Estimating the provincial environmental Kuznets curve in China: a geographically weighted regression approach
|
|
|
- Everett Lee
- 5 years ago
- Views:
Transcription
1 ORIGINAL PAPER Estimating the provincial environmental Kuznets curve in China: a geographically weighted regression approach Yoomi Kim 1 Katsuya Tanaka 2 Chazhong Ge 3 Ó Springer-Verlag GmbH Germany, part of Springer Nature 2017 Abstract This study estimates the environmental Kuznets curve (EKC) relationship at the province level in China. We apply empirical methods to test three industrial pollutants SO 2 emission, wastewater discharge, and solid waste production in 29 Chinese provinces in We use the geographically weighted regression (GWR) approach, wherein the model can be fitted at each spatial location in the data, weighting all observations by a function of distance from the regression point. Hence, considering spatial heterogeneity, the EKC relationship can be analyzed region-specifically through this approach, rather than describing the average relationship over the entire area examined. We also investigate the spatial stratified heterogeneity to verify and compare risk factors that affect regional pollution with statistical models. This study finds that the GWR model, aimed at considering spatial heterogeneity, outperforms the OLS model; it is more effective at explaining the relationships between environmental performance and economic growth in China. The results indicate a significant variation in the existence of the EKC relationship. Such spatial patterns suggest province-specific policymaking to achieve balanced growth in those provinces. Keywords China Economic growth Environmental Kuznets curve Environmental performance Geographically weighted regression 1 Introduction China has sustained remarkably rapid economic growth since the 1990s. Primarily, owing to the gradually implemented open market policies and subsequent expansion of the industrial sector, per capita gross domestic product & Yoomi Kim kimyoomi@snu.ac.kr Katsuya Tanaka tanakak@biwako.shiga-u.ac.jp Chazhong Ge gecz@caep.org.cn Seoul National University Asia Center, Seoul National University, 1, Gwanak-ro, Gwanak-gu, Seoul 08826, Republic of Korea Research Center for Sustainability and Environment, Shiga University, 1-1-1, Bamba, Hikone, Shiga , Japan Chinese Academy for Environmental Planning, 8 Dayangfang BeiYuan Road, Chaoyang District, Beijing , China (GDP) increased from 381 yuan in 1978, when China first declared its economic reform, to 41,908 yuan in However, such rapid industrialization has induced serious pollution problems. Therefore, the future of both economic and environmental performance is of great concern to China. To address the relationship between Chinese economic growth and environment, numerous studies have investigated the existence of an environmental Kuznets curve (EKC) (e.g., De Groot et al. 2004; Shen 2006; Tao et al. 2008; Wang et al. 2012b; Song et al. 2013; He et al. 2014). Most of these have analyzed the EKC relationship, which exhibits an inverted-u shape, for various pollutants, such as SO 2 emissions and wastewater discharge from industrial sources. For example, Shen (2006) validated the EKC for SO 2 emissions and three water pollutants (arsenic, cadmium, and chemical oxygen demand). De Groot et al. (2004) found that EKC exists in industrial, gas, and solid 1 These values are in 2010 constant prices. The rate of exchange in 2010 was approximately US$ 1 = 6.77 yuan. The index of GDP per capita for 2013 is 1,837.5 if using 1978 as the base year.
2 wastes at intermediate levels of economic development. More recently, Song et al. (2013) demonstrated that some areas, such as Beijing, Guizhou, Jilin, Shanghai, and Tibet, have already reached their inflection points on the EKC for industrial waste gas emissions, while Anhui, Fujian, Hainan, Liaoning, and Qinghai demonstrate no inflection points. However, there is concern that the selection of pollutants and methods has a decisive effect on the results (Brajer et al. 2011; Paruolo et al. 2015). One major limitation of existing EKC studies is that most evaluate the average relationship between environmental quality and economic development in their respective study areas by using a global regression model. As this model might be particularly unrepresentative of a more diverse study area, the estimated average relationships may overlook or underestimate significant and important local interactions between the environment and economic growth. Thus, contrasting relationships in different parts of a country may tend to cancel each other out in the calculation of a global parameter estimate (Fotheringham et al. 2002). Consequently, producing a set of local statistics by applying the locally weighted regression approach and mapping the estimated values would be substantially more informative and accurate than adopting a single global estimate. In environmental economics, the geographically weighted regression (GWR) model, one of the locally weighted regression models, adopts an economic approach that considers the possibilities of relationships among observations from various geographical spaces. Using it, we can match a regression model at individual data point. The GWR model has attracted increasing academic attention in several areas of study, including risk assessment and environmental management (Fotheringham et al. 2002; Cho et al. 2006; Fischer and Getis 2009; Helbich et al. 2013; Harris et al. 2014; Wang et al. 2017). Geographic and environmental data often show a robust pattern of spatial dependency, making spatiality an important determinant for the accuracy of analysis results (Montello and Sutton 2012). By applying the GWR model to investigate the EKC relationship, we can identify local differences depending on geographical and socioeconomic local characteristics, as well as cultural, geographical, historical, and administrative features. Despite these advantages, in most previous studies, the EKC relationships have been hidden in global results. Only few studies have considered the spatial differences of EKC relationships with locally weighted models, including the GWR (Rupasingha et al. 2004; He et al. 2014; Li et al. 2014). For large countries like China, uneven regional economic and environmental conditions are significant. For example, some preferential policies boost effective economic growth. This causes a regional economic gap and polarization phenomena among Chinese provinces (Wang et al. 2014). However, there are few extant studies on the relationship between economic growth and environmental pollutants in China that apply spatial analysis with province level data. They are, however, limited regarding air pollutants due to data limitations (Chuai et al. 2012; Liu et al. 2014, 2016; Kim et al. 2017). Considering that the spatial approach provides a more accurate EKC relationship, the primary objective of this study is to investigate the EKC relationship at province level in China using the GWR approach to account for spatial non-stationarity. Since different pollutants might exhibit different relationships, we select three environmental performance indicators from industrial sources: SO 2 emission, wastewater discharge, and solid waste production, while most previous studies on EKC focused on air pollutants or forest areas. Additionally, this study includes population density and geographical factors as control variables, thus reflecting local characteristics. These objectives are achieved by applying the GWR model to 29 provinces in China (Fig. 1) in The rest of this article is organized as follows. Section 2 discusses, in detail, the theoretical background, including history, challenges, and limitations of EKC. Section 3 describes the empirical models, and the data used for empirical estimations. Section 4 reports and interprets the estimated results for the three pollutants from the GWR and GeogDetector models. Section 5 summarizes our results, and provides several policy implications to achieve the EKC relationship for balanced growth in China. 2 Research background The EKC hypothesis suggests an inverted-u relationship between economic performance and environmental degradation. In the early 1990s, Grossman and Krueger (1991) introduced this idea based on Kuznets (1955), who described inverted-u shape for time series patterns in income inequality and the level of income, spreading it through the World Development Report of the World Bank (1992). The EKC hypothesis illustrates that, environmental quality first increases with economic growth, then declines beyond a certain turning point, which indicates the maximum pollutant concentration. This attractive assumption exists as an extension of the concept of economic sustainable development, which was initially introduced in Brundtland and Khalid (1987), showing the possibility that economic growth can be achieved along with the improvement of environmental quality if a country reaches a certain level of economic development. Ever since the EKC was proposed, and considering its concerns, numerous scholars have tried to
3 Fig. 1 Provinces and major cities in China find empirical evidence to support its relationship. As such, many previous studies conduct empirical analysis with quadratic equations using data on economic performance from, for example, income or GDP per capita and environmental quality. However, although this stylized hypothesis has received attention from scholars, many still have reservations, and criticize EKC due to its lack of theoretical foundation and empirical consistency (Stern et al. 1996; Ekins 1997; Stern 1998, 2004; Dasgupta et al. 2002). The empirical evidence remains mixed, varying among targets and methods of analysis. Some studies identified EKC relationships, and calculated the turning points from their data (Lopez 1994; Selden and Song 1994; Stern and Common 2001), while other recent studies failed to identify the EKC existence (Gangadharan and Valenzuela 2001; Azomahou et al. 2006; Aslanidis and Iranzo 2009). Therefore, scholars endeavor to obtain more accurate results of the relationship between economic growth and environmental quality by improving data and the econometric methods used (Stern 2004). For instance, Dasgupta et al. (2002) introduced the new toxics, a revised EKC, and the race to bottom scenarios, while insisting on the need to break the monotonic frame of EKC. 2 Stern (2004) also pointed out the lack of consensus on EKC results, and provided alternative approaches. Moreover, it is difficult to generalize the results obtained from previous studies. Existing literature, including Grossman and Krueger (1991), adopted air pollutants, as well as SO 2,NO X, and CO, as proxies of environmental quality due to data limitation (e.g., Selden and Song 1994; Stern and Common 2001; Bravo and Marelli 2007). Besides, as Stern et al. (1996) pointed out that notoriously patchy in coverage and/or poor in quality data on environmental quality is one of the problems that affects the estimation and analysis of EKCs. Most previous literature, including both cross-country and country-specific EKC 2 The new toxics scenario argues that new pollutants, for example, CO 2, may not show the inverted U-shape curve. The revised EKC scenario claims that technological change may accelerate to achieve the turning point; thus, the EKC graph shifting downward and left. The race to bottom scenario insist the greatest increase of environmental regulations and policies happen from low to middle economic levels (Dasgupta et al. 2002).
4 estimations, studied developed countries, since it is easier to secure environmental data over adequate research periods. However, selection of pollutants and methods can affect the estimation results of the EKC (Brajer et al. 2011). More recently, scholars have been trying to estimate EKC relationships in developing countries, thus raising questions on whether these exist and whether their trends are similar to developed countries. Specifically, scholars focus on China, which has witnessed both remarkable economic growth and serious environmental degradation for decades (e.g., De Groot et al. 2004; Shen 2006; Tao et al. 2008; Song et al. 2013). However, despite large economic gaps and polarization phenomena among Chinese provinces, there are some previous studies on the relationship between economic growth and environmental pollutants that apply spatial analysis. Furthermore, most studies are at province level and limited to air pollutants (Chuai et al. 2012). Therefore, a necessity arises to carefully investigate the various relationships between economic performance and environmental quality in China among various pollutants, while considering difference in regional characteristics. 3 Model 3.1 Geographically weighted regression The GWR model produces a set of local estimates to identify spatial differences in the study area. It is an extension of the traditional ordinary least squares (OLS) model that considers spatial differences with local parameters to be estimated in an equation as follows: y i ¼ b 0 ðu i ; v i Þþ X k b k ðu i ; v i Þx ik þ e i ; ð1þ estimation failure, the adaptive kernel function can adjust the bandwidths between regression and data points according to data density, while the fixed kernel function sets the fixed bandwidth, ignoring the density of the data points. 3 To calculate spatial weights, w ij, we apply the adaptive bi-square function for the kernel type. 4 This approach can control the spatial size variation among provinces; it is useful because the spatial weighting function specifies weights as a continuous function until distance, b, from the analyzed point, while the data point has zero weight if the distance between i and j is equal to or greater than the bandwidth: h i 2 2 w ij ¼ 1 d ij =b if d ij \b; ð2þ ¼ 0 otherwise; where b is a certain bandwidth and d ij is the distance between i and j. In this function, if a locally weighted regression parameter is similar to a global OLS model, w ij would be close to 1 regardless of d ij (Fotheringham et al. 2002; Fischer and Getis 2009). We derive the bandwidth using the Akaike information criterion (AIC) to calibrate the spatial weighting function. 5 A numerical analyst for function minimization with a correction for small sample size, AIC provides more accurate results in small-sample applications (Cavanaugh 1997). According to Fotheringham et al. (2002), deriving the bandwidth that offers equilibrium between the goodness-of-fit and degrees of freedom is equivalent to minimizing the corrected AIC (AICc). They define AICc for GWR based on Hurvich et al. (1998) and Fischer and Getis (2009) as follows: where y and x represent the dependent and the independent variables, respectively; b 0 and b i are the parameters to be estimated; k is the number of independent variables; i is the data point; and e denotes the error term. b 0 ðu i ; v i Þ and b k ðu i ; v i Þ denote the local estimated parameter for independent variables, x ik. GWR is calibrated through weights based on the distance between the observed data and point, i, assuming that observed data closer to point, i, have more impact on local estimations of b k u j ; v j s than the ones located farther from point, i. Through this approach, GWR can recognize and measure possible spatial variations in the relationships between independent and dependent variables (Fotheringham et al. 2002; Fischer and Getis 2009). To define spatial weights, we use kernel functions, which are weighting functions used in non-parametric estimation techniques. As the uneven distribution in some regression points causes issues like large standard errors or 3 Bandwidth defines how each data point is weighted by the distance from the regression point. This is determined by a spatial weighting function that affects the distance between regression and data points (Fotheringham et al. 2002). Therefore, in the adaptive spatial kernels, we can observe larger bandwidths of kernels, where data are scarce, and smaller bandwidths, where data are dense, while all regression points have the same bandwidth in the fixed kernel function. 4 In this function, if a locally weighted regression parameter is similar to a global OLS model, w ij would be close to 1 regardless of d ij. In other words, a value of w ij close to 0 indicates that the estimated parameter would vary across space. This function allows us to use the bandwidth with the same number of data points with non-zero weights (Fotheringham et al. 2002; Fischer and Getis 2009). 5 AIC is a model selection technique based on information theory, providing the information loss of models between the goodness-of-fit and degrees of freedom. In this analysis, AIC evaluates an optimal bandwidth between the global OLS and GWR models. The bandwidth with minimized AIC value is utilized in the GWR estimation (Zhen et al. 2013).
5 n þ trðsþ AIC c ¼ 2n log e ð^r Þþn log e ð2pþþn ; n 2 trðsþ ð3þ where n is the number of observations, ^r represents the estimated standard deviation of the error term, and tr(s) is the trace of the hat matrix that is a function of the bandwidth. The AICc can be used to estimate a better fit between a global OLS and a local GWR because it considers the different degrees of freedom for the two models. Further details about the GWR model can be found in Fotheringham et al. (2002), Fischer and Getis (2009), and Wheeler (2014). Since the GWR model estimates local regression coefficients by considering spatial differences, we can measure the spatially varying relationships between environmental performance and their determinants in each province. Thus, spatially varying parameters are displayed in spatial maps using the Geographic Information System (GIS). The results section demonstrates the synergy effect of the GWR model and GIS in detail. 3.2 Model specification and data The models to investigate the EKC relationship of each Chinese province mainly focus on the relationship between regional economic performance and pollution. To measure the economic performance of each province, gross regional product (GRP), income level, or per capita gross city product could be considered for the analysis. In the spatial analysis, we use provincial GRP per capita to represent the regional economic performance well (de Groot et al. 2004; Managi and Kaneko 2009; Wu2010). The coefficients and the signs of the GRP and GRP squared variables indicate the relationship between the economy and pollutants. This study uses data on three pollutants from industrial sources (SO 2 emission, wastewater discharge, and solid waste production) from 29 Chinese provinces. 6 For the control variables, population density and dummy variables for coastal regions, and time are included. The effect of population density on pollution remains controversial. As many previous studies mentioned, they are closely related. Some insist that more densely populated areas are likely to have more pollutants because more pollutants are generated in populated areas by vigorous human activity, such as complicated transportation and industry. However, others insist that a highly-populated area is likely to be more developed, have high income, and 6 Tibet is not included in our analysis, because of data limitations from statistical data sources. Chongqing is also not included, because it was split from Sichuan during the estimation period (in 1997). To maintain data consistency, we merge Chongqing and Sichuan data, and treat them as a single province in this study. thus, could put more effort into reduce emissions (Selden and Song 1994; Shen 2006; Brajer et al. 2008, 2011). Previous studies also demonstrate that it is crucial to consider geographical characteristics that affect the GRP growth rate. Particularly, there are significant differences in economic performance between coastal and land-locked regions. The share of GDP per capita for coastal regions accounts for more than 60% of total GDP, and coastal regions growth rate is higher than that of land-locked regions as well (de Groot et al. 2004). On the other hand, previous studies asserted that cities located on the coastline have better air quality, although they are expected to have more developed economies and higher population density (Brajer et al. 2011). In this context, this study includes a dummy variable for coastal regions to determine the difference between the EKC relationships among different pollutants for both coastal and land-locked regions. Moreover, a time dummy needs to be included because there are several changes in the criteria of collecting statistical data by the State Statistical Bureau ( ) corresponding to certain periods. Accordingly, we estimate Eq. (1) in the previous subsection by using the following specification: Y it ¼ b 0 þ b 1 GRPP it þ b 2 GRPPSQ it þ b 3 POPDENSE it þ b 4 D COAST it þ b 5 D TIME it þ e it ; ð4þ where Y it is per capita volume of pollutants, that is, SO 2 emission per capita, wastewater discharge per capita, or solid waste production per capita from the industrial sector in province, i, at year, t. GRPP and GRPPSQ denote GRP per capita and its squared term, respectively. Provincial GRP is adjusted by consumer price index (CPI) (1993 = 100); POPDENSE is the population density (in person/m 2 ); D_COAST a dummy variable for coastal regions 7 ; and D_TIME a dummy variable that indicates time period after the year Finally, bs are the parameters to be estimated. The variables used for estimating Eq. (4) are obtained from the China Statistical Yearbook (State Statistical Bureau ). 8 The descriptive statistics of the analyzed variables are presented in Table 1. We test the spatial stratified heterogeneity to verify and compare relevant risk factors that affect regional pollution by using the GeogDetector (Wang et al. 2010, 2016). This tool provides four types of results risk, factor, ecological, and interaction detectors which indicate information on 7 Coastal provinces refer to Beijing, Fujian, Guangdong, Guangxi, Hainan, Hebei, Jiangsu, Liaoning, Shanghai, Shandong, Tianjin, and Zhejiang. 8 GRP per capita and statistics of three pollutants in 2012 are used to identify the trend of sustainable development after 2010 in Table 7.
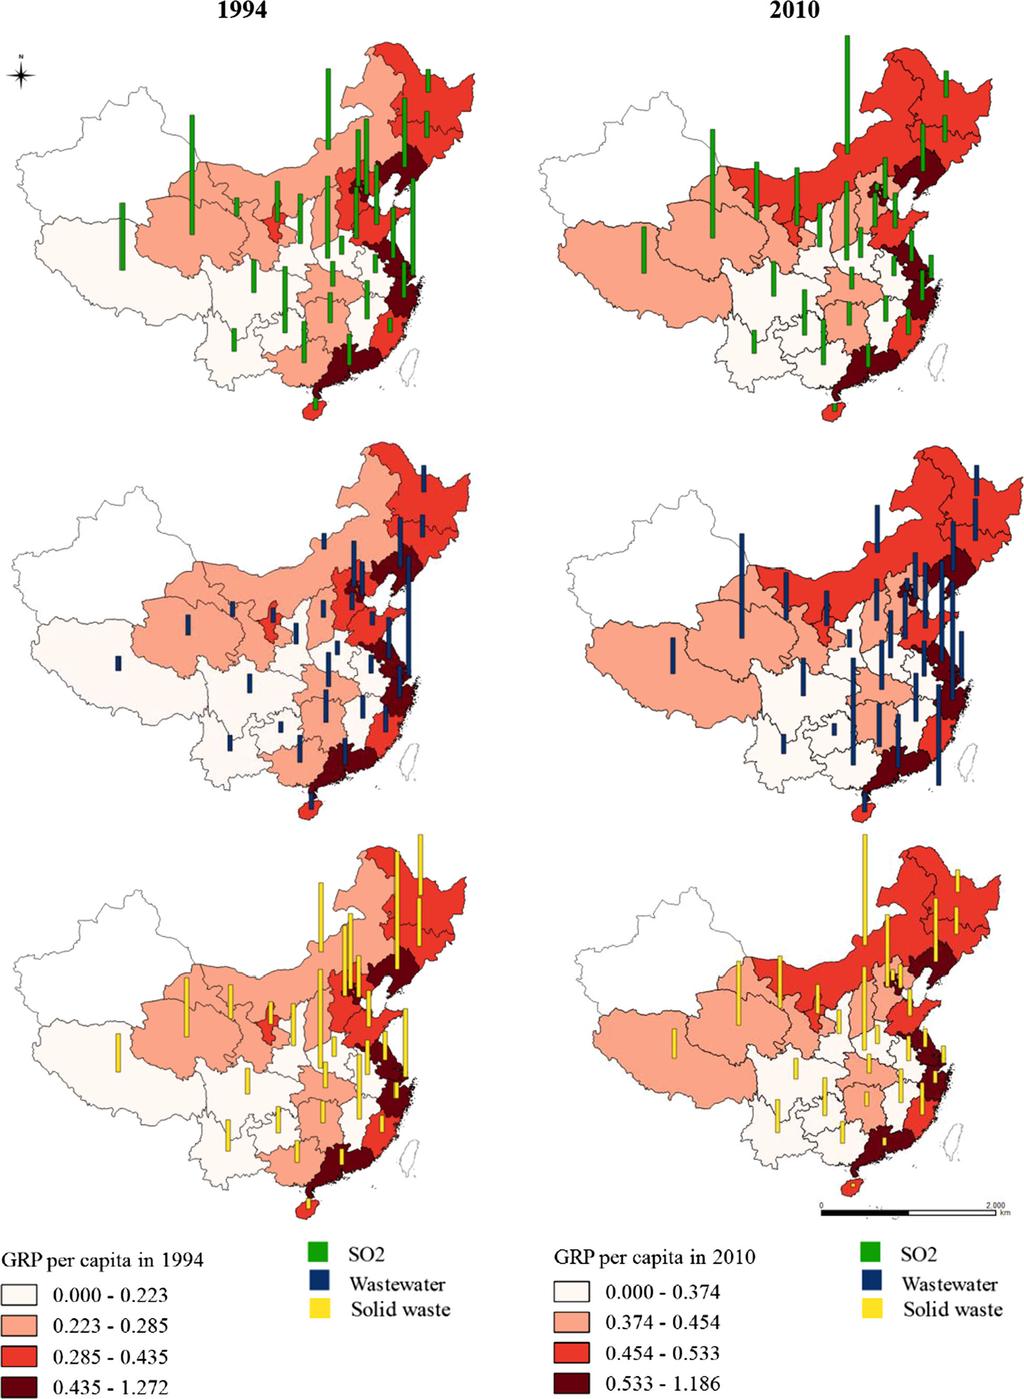
6 Table 1 Descriptive statistics Variable Definition Original data Unit Mean SD Min. Max. INDSO2P SO 2 emissions per capita Volume of SO 2 emission by industry tons INDWWP Wastewater discharged per Total volume of wasted water 10,000 tons capita discharged INDSWP Industrial solid waste produced per capita Volume of industrial solid wastes produced GRPP GRP per capita GRP adjusted by CPI (1993 = 100) 100 million yuan GRPPSQ Square of GRP per capita 100 million yuan POPDENS Population density Population by urban and rural residence and region COAST Dummy variable for coastal regions TIME Dummy variable for year after ,000 tons , person/m All data except the dummy variables are from China Statistical Yearbook (State Statistical Bureau ) each risk factor, the impact of each factor, the impact of different levels of significance on factors, and the impact of combinations of different factors, respectively (Wang et al. 2010; Todorova et al. 2016). With the result thereof, we can detect the consistency of spatial distribution of each pollutant with those of the risk factors. We consider the status of economic development, population density, and coastal regions as the environmental and socioeconomic risk factors in the perspective of the EKC hypothesis. 9 More details on the GeogDetector can be found on its official website ( and previous studies like Wang et al. (2010), Li et al. (2013), and Fei et al. (2016). 4 Results The distribution of the GRP per capita, and each pollutant in 1994 and 2010, shows spatial heterogeneity among the provinces ( Appendix ). We conduct the spatial methods with the GWR 4 software assuming that the spatial approach provides a more accurate EKC relationship at province level in China. The estimated coefficients for SO 2, wastewater, and solid waste models are presented in Tables 2, 3, and 4, respectively. The tables indicate that local GWR models outperform global OLS models for all three pollutants in terms of Adjusted R 2, AIC, and AICc. Specifically, model fit is significantly improved by estimating variables locally rather than globally because models with higher R 2 and smaller AIC or AICc offer a better fit. The parameter estimates for the seven independent variables vary widely over space. Table 5, which shows the results of the spatial variability test for the GWR coefficients, demonstrates significant spatial variability in terms of model selection criteria. All variables have negative values of the diff-criterion. 10 This provides strong evidence that the EKC relationships are not constant among provinces. In other words, it is difficult to capture the reasonable average relationship by global OLS in these three models because global OLS estimates can only produce the average relationship among all provinces. The results regarding spatial stratified heterogeneity are in line with the results from the statistical models above. Considering the uneven distribution of regional risk factors that cause spatial heterogeneity, we used the GeogDetector to investigate the risk factors impact as per the EKC hypothesis. Table 6 presents the power determination values, which show the effect of a risk factor on each pollutant with values between 0 and 1 (Wang et al. 2010; Li et al. 2013; Fei et al. 2016). The results indicate that population density is the strongest risk factor in all three pollutants. The economic situation, which is measured by the GRP per capita, is also an important risk factor. Coastal region and time factors are also more important factors for both SO 2 emissions and industrial solid waste production, while time factor is not significant for the results of industrial wastewater discharge. 9 To conduct GeogDetector, the numerical dependent variables GRP per capita and population density were transformed to the categorical variables based on the ranking among the provinces, since the precondition for this program is Y is numerical and X MUST be categorical (Wang et al. 2010). 10 A positive value of the diff-criterion (AICc, AIC, Bayesian inference criterion/minimum description length, or coefficient of variation) suggests no spatial variability in terms of model selection criteria.
7 Table 2 Model estimates: industrial SO 2 emissions Variable OLS GWR Coeff. SE Min LQ Med UQ Max Intercept *** GRPP * GRPPSQ POPDENS COAST *** TIME *** N Adjusted R AIC AICc ***,**,* indicate 1, 5, and 10% significance levels, respectively Table 3 Model estimates: industrial wastewater discharge Variable OLS GWR Coeff. SE Min LQ Med UQ Max Intercept 6.480*** GRPP *** GRPPSQ ** POPDENS *** COAST 4.862*** TIME N Adjusted R AIC AICc ***,**,* indicate 1, 5, and 10% significance levels, respectively As previously indicated, one of the advantages of the GWR model is that the estimated results are spatially displayed based on the resolution of data used in the study. Spatial variations of estimated results using GWR are displayed in terms of sign of the parameter and significance. Since this study conducts province-level local regressions, all results can be displayed using provincial data and GIS software, such as QGIS. Through this process, Figs. 2, 3, and 4 illustrate the spatial variations in the EKC relationships for SO 2, wastewater, and solid waste from industrial sources in China. This study revealed that spatial variations of the EKC relationships between the three pollutants are considerably distinct. Figure 2 indicates that 12 out of 29 provinces are demonstrated to have EKC relationships for SO 2 emissions. This is remarkably different from OLS estimates in Table 3, where the EKC relationship for SO 2 is absent for the national average. Our results indicate that 12 provinces located in northern China (Beijing, Gansu, Hebei, Henan, Inner Mongolia, Liaoning, Ningxia, Shaanxi, Shandong, Shanxi, Tianjin, and Xinjiang) achieve SO 2 emission reduction with GRP growth, although economic growth does not seem to mitigate SO 2 emissions in the other 17 southern and northwestern provinces. Some southern provinces, such as Guangdong, were concerned about regional air pollution in their rapidly developing areas. For example, the Guangdong and Hong Kong governments established The Pearl River Delta Regional Air Quality Monitoring Network in November This is the first joint regional air pollution monitoring network in China (Zhong et al. 2013). However, although there are efforts on improving air quality in these provinces, more active environmental policies (e.g., environmental standards and environmental management enhancements) would be needed to induce air quality improvement.
8 Table 4 Model estimates: industrial solid waste production Variable OLS GWR Coeff. SE Min LQ Med UQ Max Intercept GRPP 2.236*** GRPPSQ ** POPDENS * COAST *** TIME 0.649*** N Adjusted R AIC AICc ***,**,* indicate 1, 5, and 10% significance levels, respectively Table 5 Test for spatial variability of GWR coefficients Variable SO 2 emission Industrial wastewater discharge Industrial solid waste production F Diff of criterion F Diff of criterion F Diff of criterion Intercept GRPP GRPPSQ POPDENS COAST TIME Positive value of diff-criterion (AICc, AIC, BIC/MDL, or CV) suggests no spatial variability in terms of model selection criteria Table 6 Power determination of risk factors affecting regional pollution Pollutant Risk factors SO 2 emission Industrial wastewater discharge Industrial solid waste production GRPP 0.172*** 0.477*** 0.165*** POPDENCE 0.529*** 0.603*** 0.454*** COAST 0.007* 0.243*** 0.011** TIME 0.050*** *** All power determination values are significant except time in industrial wastewater discharge ***,**,* indicate 1, 5, and 10% significance levels, respectively Figure 3 indicates the EKC relationship for wastewater discharge, predicting significant EKC relationships between GRP growth and industrial wastewater discharge in 21 out of 29 provinces. This suggests that, ultimately, there would be reduced discharge of wastewater in these 21 provinces along with economic growth. However, the results show that eight provinces, namely Anhui, Fujian, Jiangsu, Jiangxi, Shanghai, Sichuan, Xinjiang, and Zhejiang, do not exhibit an EKC relationship for wastewater discharge. Regarding industrial solid waste production, the EKC relationship holds in 10 northern-central provinces, namely Beijing, Gansu, Hebei, Henan, Inner Mongolia, Ningxia, Qinghai, Shaanxi, Shanxi, and Tianjin, except for coastal regions (Fig. 4). This result demonstrates a positive tendency for solid waste to decrease in these 10 provinces as China s economy grows. However, economic growth is not likely to reduce solid waste in most western, southern, and coastal provinces, but rather, a shortage of sites for waste disposal facilities tends to occur in some provinces, such as
![Fig. 2 Spatial variations in SO 2 EKC relationship. Note: The green colored provinces represent the areas that have a significant EKC relationship [i.e., b 1 [ 0 and b 2 \ 0 in Eq. (4)] Fig.](/docs-images/91/106662518/images/9-0.jpg "3 Spatial variations in wastewater EKC relationship. Note: The blue colored provinces represent the areas that have a significant EKC relationship [i.e., b 1 [ 0 and b 2 \ 0 in Eq. (4)] Guangzhou.")
9 Fig. 2 Spatial variations in SO 2 EKC relationship. Note: The green colored provinces represent the areas that have a significant EKC relationship [i.e., b 1 [ 0 and b 2 \ 0 in Eq. (4)] Fig. 3 Spatial variations in wastewater EKC relationship. Note: The blue colored provinces represent the areas that have a significant EKC relationship [i.e., b 1 [ 0 and b 2 \ 0 in Eq. (4)] Guangzhou. This might due to the lack of solid waste disposal facilities in this region, mainly caused by poor waste management, a low-quality institutional system, and local governments financial burdens (Chung and Poon 2001; Chung and Lo 2012). Although relevant laws and policies are increasing, a more effective and sustainable management system would be needed in these regions. Considering these graphical results, we can better understand the geographical distribution of EKC for each pollutant. The development stage of the local economy and regional industrial structure, and characteristics of
10 Fig. 4 Spatial variations in solid waste EKC relationship. Note: The yellow colored provinces represent the areas that have a significant EKC relationship [i.e., b 1 [ 0 and b 2 \ 0 in Eq. (4)] pollutants can be considered the reasons for the different patterns. Regarding the relationship between economic development and pollutant characteristics, previous studies indicated several types of pollutants, and some of these studies categorized them based on the countries social and economic characteristics (Matsuoka 2004; Matsuoka et al. 1998). The empirical results show that regions that have significant EKC relationships for SO 2 and solid waste are concentrated in northern China, while regions with significant EKC relationship for wastewater are broadly distributed across the country. Therefore, establishing environmental policies according to regional differences and the characteristics of pollutants is needed to enhance their effectiveness. Finally, Table 7 presents the ratio of actual GRP per capita to calculate the turning point (i.e., the inflection point of EKC) based on the analytical results of the EKC relationships in each province for From these estimates, it is possible to identify the trend of sustainable development after the analysis period, although this calculation assumes a trend of provincial economic growth similar to the current pattern. Specifically, a ratio over 1.00 indicates that GRP per capita has reached the calculated turning point. As the pollutants start to decrease after this point along with economic growth, it is possible to identify their status on the EKC of each province. For SO 2, while 12 provinces have a valid EKC relationship between GRP and SO 2 emissions, only Beijing and Liaoning passed the inflection points on the EKC. Regarding industrial solid waste production, only Beijing reached the calculated turning point with a ratio of Beijing and Liaoning are representative of developed provinces in China that hold the first and third ranks of the actual 2012 GRP per capita, respectively. 11 These results may imply that environmental institutions (e.g., local governments and environmental NGOs) could be established in developed provinces that have a better capacity for reducing such pollutants compared to other regions. As per the central column of Table 7, numerous provinces have passed through the turning points in EKC for wastewater. Specifically, eight of 21 provinces, which show the EKC relationship, have a ratio over 1.00 Beijing, Guangdong, Guangxi, Hainan, Hunan, Liaoning, Tianjin, and Yunnan. This demonstrates a unique geographical distribution. Beijing, Liaoning, and Tianjin, located in the eastern coastal region, hold the first, third, and fifth rank of GRP per capita in 2012, respectively. Thus, similar to SO 2 and solid waste EKC, developed provinces with high GRP per capita are likely to control industrial wastewater discharge more effectively than other provinces. The other five provinces, Guangdong, Guangxi, 11 Adjusted GRP per capita by CPI (1993 = 100) of each province in 2012 is as follows: Beijing (1.223), Shanghai (1.112), Liaoning (0.794), Tianjin (0.759), Jiangsu (0.708), Zhejiang (0.706), Guangdong (0.609), Xinjiang (0.566), Shandong (0.553), Heilongjiang (0.543), Fujian (0.530), Inner Mongolia (0.530), Hainan (0.513), Jilin (0.512), Ningxia (0.489), Shaanxi (0.482), Shanxi (0.475), Qinghai (0.457), Hebei (0.457), Hubei (0.443), Hunan (0.439), Sichuan (0.399), Henan (0.385), Yunnan (0.343), Guangxi (0.343), Jiangxi (0.338), Gansu (0.324), Anhui (0.324), and Guizhou (0.298).
11 Table 7 Ratio of actual GRP per capita to calculated turning point Province or city name 2012 GRP per capita SO 2 Wastewater Solid waste Turning point Ratio Turning point Ratio Turning point Ratio Beijing Tianjin Hebei Shanxi Inner Mongolia Liaoning Jilin Heilongjiang Shanghai Jiangsu Zhejiang Anhui Fujian Jiangxi Shandong Henan Hubei Hunan Guangdong Guangxi Hainan Sichuan Guizhou Yunnan Shaanxi Gansu Qinghai Ningxia Xinjiang The turning point of each province or city indicates the calculated inflection points of EKC from the analysis in this study. The equation to calculate the ratio of actual GRP per capita to the turning point is 1? (GRPP GRPP_OPT)/GRPP_OPT. Thus, ratio 1.00 indicates that the current GRP per capita in 2012 reached the calculated turning point. Only provinces or cities that have significant EKC relationship are calculated Hainan, Hunan, and Yunnan, are all located in southern China, where the manufacturing industry has been historically developed. For example, Guangdong, which has the highest ratio of 2.695, contains one of the leading economic regions of China, known as the Golden Delta of Guangdong. Since this region is in contiguity with Hong Kong, there are substantial movements of labors, goods, or services. With abundant freshwater resources and high population density, Southern China is known as the Pearl River Delta, and has achieved rapid development over the past 20 years (Ediger and Hwang 2009). Therefore, the awareness of provincial environmental protection has been increasing here historically more than in other provinces. In this context, the preceding growing concern of wastewater pollution problems in response to the early development of manufacturing in these five provinces might result in significant EKC and ratio values above Based on the expected turning point estimations of the GRP per capita results and actual 2012 GRP per capita, Fig. 5 shows the graphs of each pollutant, which presents the relationships of the expected calculated turning point and the actual GRP per capita in 2012 based on the GWR analysis results in each province. We show the EKC with the calculated expected turning point of EKC in each province. A 45 degrees reference line with different colors (marking the color into red and blue to present provinces
12 before and after the expected point of inflection) is used in each graph to compare provinces before and after the point of inflection effectively. Through Table 7 and Fig. 5, we can easily compare different turning point scenarios in a single time axis for Overall, only Beijing successfully passed through the EKC inflection points of all three pollutants, and simultaneously entered a phase of improving environmental and economic performance. Here, SO 2, wastewater, and solid waste diminish with increasing GRP. One potential reason for this could be that Beijing has been undertaking stringent measures and enforcing environmental policies, part of the Green Olympic Movement, ever since the city received Olympic sponsorship in 1998 (Berkowitz et al. 2007). Another reason could be policies or political strategies and type of region related to industrial development that this study did not consider. Numerous manufacturing industries are established in provinces near Beijing, such as Tianjin, and thus, environmental quality in Beijing is relatively better compared to other neighboring provinces. Moreover, principles related to environmental policy implementation may affect the shape of the EKC relationship (Wang et al. 2012b). The EKC status of Beijing also presents the implications for cities with similar industrial structure. Wang et al. (2012a) showed the remarkable improvement of Beijing development, and emphasized that similar cities are likely to show analogical tendency in their development paths. 12 We can assume similar effects on environmental quality in each province. Therefore, policymakers should consider city type and regional industrial policies and structures. Other provinces, such as Hebei and Shanxi, exhibit EKC relationships, but need more time to reach a stage of reducing pollutants along with economic development. Moreover, EKC relationships for all pollutants are not significant in seven provinces located in southeastern China, thus indicating that it is currently difficult to define the relationship between economic growth and environmental pollutants in these provinces. It is possible that their EKC graphs have different shapes from the typical inverted-u shape, such as a linear relationship or cubic function. A longer term analysis may capture the shapes of the relationships between economic growth and environmental pollutants in those provinces. Moreover, further analysis would be needed to reveal the determinants of different EKC patterns. Fig. 5 The graphs of the expected turning points of SO 2 emission, wastewater, and solid waste that present the calculated turning point and the actual GRP per capita (100 million yuan) in 2012 on the GWR analysis results in each province 12 In their analyses, the city type of Beijing shows significant improvement between 1990 and 2000, but is categorized with other cities (Wang et al. 2012a).
13 5 Conclusions and discussion This study estimated the EKC relationship at province level in China using the GWR approach, where the model can be fitted at each spatial location in the data, weighting all observations by a function of distance from the regression point. Hence, considering spatial heterogeneity, the EKC relationship can be analyzed by region through this approach rather than describing the average relationship over the entire study area. We applied this approach to three industrial pollutants SO 2 emission, wastewater discharge, and solid waste production in 29 provinces of China during The results have significant implications for prospective environmental and industrial policymaking by the Chinese government. This study produced a set of local statistics by applying the GWR models, and mapped the differences in the EKC relationship among regions and pollutants. Therefore, the results could describe the state of the EKC relationship of each province, thus enabling us to provide more detailed suggestions by province, while most previous studies evaluated a country-level average EKC. The empirical results from our three GWR models indicate three types of relationships between economic performance and environmental quality: achieving an EKC relationship and passing the turning point, achieving an EKC relationship before passing the turning point, and no EKC relationship exists. If a province has achieved the EKC relationship, we can consider it has adopted a sustainable trend regardless if this was before or after the turning point. However, regions with no EKC relationship indicate they have lost the balance between economy and environmental quality, and forecast a grim future for sustainable development. This study provides policy implications from different EKC relationship types in the framework of policymaking. The results by region show that the relationships between economic and environmental performance largely differ among provinces. Since the results indicate a significant variation of the existence of EKC relationships among provinces, we could raise implication based on empirical evidence necessity of a critical attitude toward the monotonous hypothesis of the relationship between environmental degradation and economic development, and the importance of province-specific policymaking for achieving province balanced growth. We did not observe any EKC relationship for any pollutant in seven provinces, namely Anhui, Fujian, Jiangsu, Jiangxi, Shanghai, Sichuan, and Zhejiang. In this respect, it is difficult to determine an equilibrium point, which is the turning point on the EKC graph in this study, between economic and environmental performance. In other words, these provinces lack the balance of economy and environment. It should be corrected in terms of new normal policies. Considering the gap between growth rate and urbanization (Wang et al. 2012a), stricter regulations and laws may be required in provinces that achieve the EKC relationship before the turning point as opposed to other provinces, since more pollution would be expected to be generated by an increasing economic performance. In such provinces, environmental policies and laws should be implemented for the relationship between regional economies and environmental performance to move in a sustainable direction. The Coal Consumption Cap plans, enacted in China, which depend on each province s unique situation, aims to provide effective red-line restrictions for natural resources. This scheme is a good beginning for sustainable development (China Coal Cap Project 2015). Particularly, a more careful and efficient approach will be required in regions with no EKC relationship and high economic performance because they are expected to witness intensified pollution due to their active industrial development. For example, the results of Shanghai deserve attention. While Shanghai s adjusted GRP per capita in 2012 ranks second, following Beijing (refer to footnote 11), the empirical results on the EKC relationship show the opposite pattern. As previously mentioned, Beijing shows an exemplary pattern of EKC relationship, while no significant pattern is found in Shanghai during the same period. Existing EKC consideration in China tend to focus on the national framework and overlook spatial heterogeneity. However, the empirical results provide a strong implication that policymakers need to carefully consider the EKC relationship in each province, and be aware of the importance of further efficient environmental policies in regions with lively economic activity, but no EKC relation. Some provinces, including Hebei, Shanxi, and Tianjin are found to exhibit EKC relationships, but they are still away from the turning point. This implies that greater environmental deterioration would be observed, although they follow a path of sustainable growth. Specifically, discharges of pollutants are still increasing along with economic development, although the existence of EKC indicates that its economic development is moving in a direction where economic and environmental performance can be improved simultaneously. Further, the results indicated that many provinces have passed the turning point of wastewater EKC, whereas only one and two provinces have successfully passed the turning points of solid waste and SO 2 emissions, respectively. From these results, diligent efforts to manage those types of pollutants are necessary for promoting more balanced development policies for each province. Therefore, active and effective
14 environmental policies and laws to shorten the time to the turning point are required. Additionally, in the case of provinces achieving an EKC relationship after the EKC turning point, the role of policies for maintenance, control, and monitoring would be increasingly important for further sustainable development in the long term. There is a growing perception that China s economy has been entering a so-called new normal stage. This represents a significantly lower growth rate than the previous three decades. China s annual growth rate is expected to be less than 7% from 2016 to 2020, implying a new phase of the Chinese economy in comparison with the past high economic growth rates. The Chinese government officially accepts this new stage, and has been shifting its primary economic focus from a development-oriented structure to growth-balancing economic activities and environmental protection (Zhang et al. 2016). The Chinese government has also been under global pressure to consider the quality of living, including environmental protection. Although stronger environmental regulations aimed at reducing pollution and improving environmental quality have been established after the reform and opening up of the economy, the effectiveness of the Chinese government s environmental policies has been questioned owing to increasing pollution. In this regard, one of Chinese government s first and most important tasks upon entering the new normal is to harmonize economic growth and environmental quality. According to this study, it is clear that policymakers should establish different types of environmental policies to address current states of environmental problems and the economy. In other words, they should pay attention to whether the state of pollution in each region is balanced from the sustainable development perspective. Particularly, for large countries like China, regional and specialized approaches are more effective than universal policies, since regional development levels, characteristics, history, and industrial structure vary among provinces. Empirical evidence on the existence of the EKC relationships is one key indicator that allows policymakers to ascertain whether economic and sustainable developments are simultaneous. Therefore, this study contributes valuable implications for environmental policymakers who focus on China s sustainable development. Before closing this study, several limitations need to be pointed out. First, our models are limited in terms of variables, since the analyses are conducted focusing on the EKC hypothesis. This study could not consider various factors mainly because of multicollinearity and data limitations, while previous literature suggests that socioeconomic factors, such as industrial structure, capital intensity, and environmental management capacities, are major driving forces. For example, considering type and development path of cities is very important for investigating the EKC (Wang et al. 2012a; Arsanjani et al. 2013) especially, city type based on industrial structure should be considered. Moreover, all major pollution sources should be fully accommodated to address balanced growth in China. Vehicles and households are also major pollution sources, especially for air. As such, more detailed analysis would be required to include such exhaustive data. The city type and its development path can be verified based on various characteristics for more accurate inference of the EKC, thereby leading to more effective policy implications for balanced economic growth in China. Finally, although we report significant and interesting results on the relationship between economic growth and environmental quality from province-level data, the unit of analysis could be improved by using data on smaller units. Due to data limitation, this study used province-level data to provide a sufficiently long period for investigating the relationship between Chinese economic growth and environment. The process to obtain consistency and specific data on various regional environmental quality factors for China was very delicate and difficult. Further studies should overcome this limitation by developing data for small geographic units, such as miscellaneous cities, and methods focusing on particular pollutants, including those affecting the quality of the air. Acknowledgements This work was supported by the Ministry of Education of the Republic of Korea and the National Research Foundation of Korea (NRF-2013S1A5B8A ). Appendix: Distributions of the GRP per capita and the pollutants in 1994 and 2010
15
A Numerical Simulation Analysis of (Hukou) Labour Mobility Restrictions in China
 Labour Mobility Restrictions in China") A Numerical Simulation Analysis of (Hukou) Labour Mobility Restrictions in China John Whalley Department of Economics, The University of Western Ontario and Shunming Zhang Department of Finance, School
A Numerical Simulation Analysis of (Hukou) Labour Mobility Restrictions in China John Whalley Department of Economics, The University of Western Ontario and Shunming Zhang Department of Finance, School
Sampling Scheme for 2003 General Social Survey of China
 Sampling Scheme for 2003 General Social Survey of China 1. Sampling Unit This survey uses a five-stage stratified sampling scheme with unequal probabilities. The sampling units at each stage are as follows:
A Study on Differences of China s Regional Economic Development Level Based on Cluster Analysis
 MATEC Web of Conferences 22, 0 5 022 ( 2015) DOI: 10.1051/ matec conf / 201 5 220 5 022 C Owned by the authors, published by EDP Sciences, 2015 A Study on Differences of China s Regional Economic Development
Variance Analysis of Regional Per Capita Income Based on Principal Component Analysis and Cluster Analysis
 0 rd International Conference on Social Science (ICSS 0) ISBN: --0-0- Variance Analysis of Regional Per Capita Income Based on Principal Component Analysis and Cluster Analysis Yun HU,*, Ruo-Yu WANG, Ping-Ping
Analysis for Regional Differences and Influence Factor of Rural Income in China
 Modern Economy, 2012, 3, 578-583 http://dx.doi.org/10.4236/me.2012.35076 Published Online September 2012 (http://www.scirp.org/journal/me) Analysis for Regional Differences and Influence Factor of Rural
Creating a Provincial Long-Term Growth Model for China using the Kohonen Algorithm
 Creating a Provincial Long-Term Growth Model for China using the Kohonen Algorithm Elpida Makriyannis, Department of Computer Science, University College London, Gower Street, London, WC1E 6BT, U.K. Philip
Journal of Asian Business Strategy ON THE RELATIONSHIP BETWEEN FOREIGN TRADE AND REGIONAL DISPARITY IN CHINA IN THE POST-REFORM ERA
 2016 Asian Economic and Social Society. All rights reserved ISSN (P): 2309-8295, ISSN (E): 2225-4226 Volume 6, Issue 3, 2016, pp. 50-62 Journal of Asian Business Strategy http://aessweb.com/journal-detail.php?id=5006
Analysis of Spatial-Temporal Characteristics and Pattern Evolution of Fishery Geographic Agglomeration in China
 2016 International Conference on Education, Management Science and Economics (ICEMSE-16) Analysis of Spatial-Temporal Characteristics and Pattern Evolution of Fishery Geographic Agglomeration in China
Analysis of the Tourism Locations of Chinese Provinces and Autonomous Regions: An Analysis Based on Cities
 Chinese Journal of Urban and Environmental Studies Vol. 2, No. 1 (2014) 1450004 (9 pages) World Scientific Publishing Company DOI: 10.1142/S2345748114500043 Analysis of the Tourism Locations of Chinese
NBER WORKING PAPER SERIES INEQUALITY CHANGE IN CHINA AND (HUKOU) LABOUR MOBILITY RESTRICTIONS. John Whalley Shunming Zhang
 LABOUR MOBILITY RESTRICTIONS. John Whalley Shunming Zhang") NBER WORKING PAPER SERIES INEQUALITY CHANGE IN CHINA AND (HUKOU) LABOUR MOBILITY RESTRICTIONS John Whalley Shunming Zhang Working Paper 10683 http://www.nber.org/papers/w10683 NATIONAL BUREAU OF ECONOMIC
NBER WORKING PAPER SERIES INEQUALITY CHANGE IN CHINA AND (HUKOU) LABOUR MOBILITY RESTRICTIONS John Whalley Shunming Zhang Working Paper 10683 http://www.nber.org/papers/w10683 NATIONAL BUREAU OF ECONOMIC
Lightning Casualties and Damages in China from 1997 to 2009
 Lightning Casualties and Damages in China from 1997 to 2009 Wenjuan ZHANG 1, Qing MENG 1, Ming MA 2, Yijun ZHANG 1 1 Laboratory of Lightning Physics and Protection Engineering, Chinese Academy of Meteorological
Polio Bulletin 2013 Issue No Week 50 (as of 17 December 2013)
") 2013 Issue No. 16 - Week 50 (as of 17 December 2013) HIGHLIGHTS China moving forward in Polio End Game Strategy Plan Today, 17 December 2013, China Food and Drug Administration (CFDA) has conveyed an international
2013 Issue No. 16 - Week 50 (as of 17 December 2013) HIGHLIGHTS China moving forward in Polio End Game Strategy Plan Today, 17 December 2013, China Food and Drug Administration (CFDA) has conveyed an international
Total-factor water efficiency of regions in China
 ARTICLE IN PRESS Resources Policy 31 (2006) 217 230 www.elsevier.com/locate/resourpol Total-factor water efficiency of regions in China Jin-Li Hu, Shih-Chuan Wang, Fang-Yu Yeh Institute of Business and
The Impact of Urbanization and Factor Inputs on China s Economic Growth A Spatial Econometrics Approach
 Economic Management Journal December 2018, Volume 7 Issue 2, PP. 145-154 The Impact of Urbanization and Factor Inputs on China s Economic Growth A Spatial Econometrics Approach Yajie Bai SHU-UTS SILC Business
Article Internet Access, Spillover and Regional Development in China
 Article Internet Access, Spillover and Regional Development in China Juan Lin 1, Zhou Yu 2, *, Yehua Dennis Wei 3 and Mingfeng Wang 1 1 Center for Modern Chinese City Studies, East China Normal University,
The Output Effect of Trade Openness in China: Evidence from Provincial Data
 The Output Effect of Trade Openness in China: Evidence from Provincial Data Jang C. Jin (jcjin@cuhk.edu.hk) Chinese University of Hong Kong, Hong Kong Abstract Unlike other studies that concentrate on
Modeling the Seasonal Patterns of Coal and Electricity Production across Chinese Provinces
 Modeling the Seasonal Patterns of Coal and Electricity Production across Chinese Provinces Eric Girardin * M.J. Herrerias Université de la Méditerranée, Aix Marseille II, GREQAM 20 July 2011 Abstract This
Interaction between Geography and Policy: Variation in Development Performance. within China s Eastern Zone. Huang Huang
 Interaction between Geography and Policy: Variation in Development Performance within China s Eastern Zone by Huang Huang Department of Political Science Duke University Date: Approved: Georg Vanberg,
Polio Bulletin 2018 Issue No. 8 - Week 14 (as of 11 April 2018)
") 2018 Issue No. 8 - Week 14 (as of 11 April 2018) HIGHLIGHTS Workshop on the WHO Guidance for Non-Poliovirus Facilities to Minimize Risk of Sample Collections Potentially Infectious for Polioviruses 10-11
2018 Issue No. 8 - Week 14 (as of 11 April 2018) HIGHLIGHTS Workshop on the WHO Guidance for Non-Poliovirus Facilities to Minimize Risk of Sample Collections Potentially Infectious for Polioviruses 10-11
Polio Bulletin 2018 Issue No Week 25 (as of 26 June 2018)
") 2018 Issue No. 13 - Week 25 (as of 26 June 2018) HIGHLIGHTS 27th Meeting of the Technical Advisory Group on Immunization and Vaccine-preventable Diseases in the Western Pacific Region 19 22 June 2018 -
2018 Issue No. 13 - Week 25 (as of 26 June 2018) HIGHLIGHTS 27th Meeting of the Technical Advisory Group on Immunization and Vaccine-preventable Diseases in the Western Pacific Region 19 22 June 2018 -
Comprehensive Evaluation of Social Benefits of Mineral Resources Development in Ordos Basin
 Studies in Sociology of Science Vol. 4, No. 1, 2013, pp. 25-29 DOI:10.3968/j.sss.1923018420130401.2909 ISSN 1923-0176 [Print] ISSN 1923-0184 [Online] www.cscanada.net www.cscanada.org Comprehensive Evaluation
ECONOMETRIC MODELLING OF INFLUENCE OF LEVEL OF THE SOCIAL AND ECONOMIC INFRASTRUCTURE ON QUALITY OF LIFE OF THE POPULATION
 ECONOMICS AND CULTURE 14(1), 2017 DOI: 10.1515/jec-2017-0011 ECONOMETRIC MODELLING OF INFLUENCE OF LEVEL OF THE SOCIAL AND ECONOMIC INFRASTRUCTURE ON QUALITY OF LIFE OF THE POPULATION Ilchenko Angelina
DISTRIBUTION AND DIURNAL VARIATION OF WARM-SEASON SHORT-DURATION HEAVY RAINFALL IN RELATION TO THE MCSS IN CHINA
 3 DISTRIBUTION AND DIURNAL VARIATION OF WARM-SEASON SHORT-DURATION HEAVY RAINFALL IN RELATION TO THE MCSS IN CHINA Jiong Chen 1, Yongguang Zheng 1*, Xiaoling Zhang 1, Peijun Zhu 2 1 National Meteorological
Polio Bulletin 2018 Issue No. 4 - Week 6 (as of 13 February 2018)
") 2018 Issue No. 4 - Week 6 (as of 13 February 2018) HIGHLIGHTS Global Polio Certification Risk Assessment Face-to-Face Meeting, Malta, 30-31 January 2018 The Global Commission for Certification of Poliomyelitis
2018 Issue No. 4 - Week 6 (as of 13 February 2018) HIGHLIGHTS Global Polio Certification Risk Assessment Face-to-Face Meeting, Malta, 30-31 January 2018 The Global Commission for Certification of Poliomyelitis
The Evaluation and Analysis of Sustainable Development of the "Belt and Road" Regions. Jun-Wei CHEN, Qian-Bing ZHANG
 2016 3 rd International Conference on Social Science (ICSS 2016) ISBN: 978-1-60595-410-3 The Evaluation and Analysis of Sustainable Development of the "Belt and Road" Regions Jun-Wei CHEN, Qian-Bing ZHANG
Understanding the spatial disparities and vulnerability of population aging in China
 Received: 29 December 2017 Revised: 26 June 2018 Accepted: 16 October 2018 DOI: 10.1002/app5.267 ORIGINAL ARTICLE Understanding the spatial disparities and vulnerability of population aging in China Yang
ECONOMICS REGIONAL DISPARITY, TRANSITIONAL DYNAMICS AND CONVERGENCE IN CHINA. Tsun Se Cheong. and. Yanrui Wu
 ECONOMICS REGIONAL DISPARITY, TRANSITIONAL DYNAMICS AND CONVERGENCE IN CHINA by Tsun Se Cheong and Yanrui Wu Business School University of Western Australia DISCUSSION PAPER 12.23 REGIONAL DISPARITY, TRANSITIONAL
Selected Papers from the 2 nd World Forum on China Studies (Abstracts) Panel 12 Shanghai's Development in Multi-scaled Perspectives
 Panel 12 Shanghai's Development in Multi-scaled Perspectives") Shanghai Academy of Social Sciences World Forum on China Studies Selected Papers from the 2 nd World Forum on China Studies (Abstracts) Panel 12 Shanghai's Development in Multi-scaled Perspectives Contents:
Shanghai Academy of Social Sciences World Forum on China Studies Selected Papers from the 2 nd World Forum on China Studies (Abstracts) Panel 12 Shanghai's Development in Multi-scaled Perspectives Contents:
Water resource utilization efficiency and spatial spillover effects in China
 J. Geogr. Sci. 2014, 24(5): 771-788 DOI: 10.1007/s11442-014-1119-x 2014 Science Press Springer-Verlag Water resource utilization efficiency and spatial spillover effects in China SUN Caizhi 1, ZHAO Liangshi
Correlation Analysis between Agglomeration Effect of Producer Service and Manufacture Labor Productivity in China
 American Journal of Industrial and Business Management, 2015, 5, 1-10 Published Online January 2015 in SciRes. http://www.scirp.org/journal/ajibm http://dx.doi.org/10.4236/ajibm.2015.51001 Correlation
Land Use Change Patterns and Sustainable Urban Development in China
 Land Use Change Patterns and Sustainable Urban Development in China Haiyan Zhang* 1, Michinori Uwasu 2, Keishiro Hara 3 and Helmut Yabar 2 1 Research Fellow, Research Institute for Sustainability Science,
A Geographic View of Expansion Choices by U.S. Firms in China
 Portland State University PDXScholar Economics Faculty Publications and Presentations Economics 12-2015 A Geographic View of Expansion Choices by U.S. Firms in China Rossitza Wooster Portland State University,
Polio Bulletin 2016 Issue No Week 27 (as of 4 July 2016)
") 2016 Issue No. 14 - Week 27 (as of 4 July 2016) HIGHLIGHTS The role of data in helping to fight eradicate polio At the heart of the work of the GPEI lie two essential tasks: finding the virus (surveillance)
2016 Issue No. 14 - Week 27 (as of 4 July 2016) HIGHLIGHTS The role of data in helping to fight eradicate polio At the heart of the work of the GPEI lie two essential tasks: finding the virus (surveillance)
Local Government, Polluting Enterprise and Environmental Pollution: Based on MATLAB Software
 2182 JOURNAL OF SOFTWARE, VOL. 7, NO. 10, OCTOBER 2012 Local Government, Polluting Enterprise and Environmental Pollution: Based on MATLAB Software Zhiyi Guo, Zhousheng Zheng School of Economics, Lanzhou
Opportunities and challenges of HCMC in the process of development
 Opportunities and challenges of HCMC in the process of development Lê Văn Thành HIDS HCMC, Sept. 16-17, 2009 Contents The city starting point Achievement and difficulties Development perspective and goals
Evaluation on Social Vulnerability to Natural Disasters
 Kamla-Raj 2016 Anthropologist, 24(2): 570-580 (2016) Evaluation on Social Vulnerability to Natural Disasters Xuxian Yan 1 and Xianjun Li 2 1 College of Management Science and Engineering, Shanxi University
DEVELOPMENT OF URBAN INFRASTRUCTURES AND POPULATION CHANGE IN CHINA
 DEVELOPMENT OF URBAN INFRASTRUCTURES AND POPULATION CHANGE IN CHINA A Thesis submitted to the Faculty of the Graduate School of Arts and Sciences of Georgetown University in partial fulfillment of the
Carbon Dioxide (CO2) Emissions in Latin America: Looking for the Existence of Environmental Kuznets Curves
 Emissions in Latin America: Looking for the Existence of Environmental Kuznets Curves") Carbon Dioxide (CO2) Emissions in Latin America: Looking for the Existence of Environmental Kuznets Curves Krishna P. Paudel Hector Zapata Alejandro Diaz Department of Agricultural Economics and Agribusiness
Carbon Dioxide (CO2) Emissions in Latin America: Looking for the Existence of Environmental Kuznets Curves Krishna P. Paudel Hector Zapata Alejandro Diaz Department of Agricultural Economics and Agribusiness
CARPATHIAN JOURNAL OF FOOD SCIENCE AND TECHNOLOGY
 CARPATHIAN JOURNAL OF FOOD SCIENCE AND TECHNOLOGY journal homepage: http://chimie-biologie.ubm.ro/carpathian_journal/index.html EMPIRICAL STUDY ON CHINA DAIRY INDUSTRIAL CLUSTER AND INFLUENCE FACTORS-BASED
Route of Urbanisation in China from an International Perspective
 18 The Route of Urbanisation in China from an International Perspective Xiaolu Wang 1 Introduction This chapter examines China s urban development strategy from an international perspective. There are
Springer is collaborating with JSTOR to digitize, preserve and extend access to Social Indicators Research.
 Principal Component Analysis on Human Development Indicators of China Author(s): Dejian Lai Reviewed work(s): Source: Social Indicators Research, Vol. 61, No. 3 (Mar., 2003), pp. 319-330 Published by:
Assessment Model of Set Pair Analysis for Flood Loss Based on Triangular Fuzzy Intervals under α-cut
 Assessment Model of Set Pair Analysis for Flood Loss Based on Triangular Fuzzy Intervals under -Cut PAN Zheng-wei WU Kai-ya 2 JIN Ju-liang 3 LIU Xiao-wei. College of Natural Resources and Environmental
Spatial Changes of Chinese Cities Under the Condition of Exo-Urbanization
 Spatial Changes of Chinese Cities Under the Condition of Exo-Urbanization Yanguang Chen Department of Geography, Peking University, Beijing 0087, PRC. Email: chenyg@pku.edu.cn. Abstract: Only a preliminary
The Agglomeration Characteristics of Blue Economic Zone of Shandong Peninsula. Fuhui Jing 1, a, Lina Chang 2,b,Hong Wang3,c
 3rd International Conference on Education, Management, Arts, Economics and Social Science (ICEMAESS 2015) The Agglomeration Characteristics of Blue Economic Zone of Shandong Peninsula Fuhui Jing 1, a,
Determining Minimum Wages in China: Do Economic Factors Dominate?
 DISCUSSION PAPER SERIES IZA DP No. 9716 Determining Minimum Wages in China: Do Economic Factors Dominate? Christian Dreger Reinhold Kosfeld Yanqun Zhang February 2016 Forschungsinstitut zur Zukunft der
Study on China s Electronic Information Industrial Agglomeration and Regional Industrial Competitiveness
 TELKOMNIKA, Vol. 11, No. 7, July 2013, pp. 4020 ~ 4029 e-issn: 2087-278X 4020 Study on China s Electronic Information Industrial Agglomeration and Regional Industrial Competitiveness Xuan Zhaohui*1, LV
Grey Incidence Relation Analysis and Granger Causality Tests of the Income Level and Economic Growth Case Study on Gansu Province, China *
 J. Service Science & Management, 2009, 2: 427-431 doi:10.4236/jssm.2009.24051 Published Online December 2009 (www.scirp.org/journal/jssm) 427 Grey Incidence Relation Analysis and Granger Causality Tests
West meets East: Monitoring and modeling urbanization in China Land Cover-Land Use Change Program Science Team Meeting April 3, 2012
 West meets East: Monitoring and modeling urbanization in China Land Cover-Land Use Change Program Science Team Meeting April 3, 2012 Annemarie Schneider Center for Sustainability and the Global Environment,
THE LIMITS (AND HARMS) OF POPULATION POLICY: FERTILITY DECLINE AND SEX SELECTION IN CHINA UNDER MAO
 OF POPULATION POLICY: FERTILITY DECLINE AND SEX SELECTION IN CHINA UNDER MAO") THE LIMITS (AND HARMS) OF POPULATION POLICY: FERTILITY DECLINE AND SEX SELECTION IN CHINA UNDER MAO Kimberly Singer Babiarz, Paul Ma, Grant Miller, and Shige Song Online Appendix Read the full paper at
THE LIMITS (AND HARMS) OF POPULATION POLICY: FERTILITY DECLINE AND SEX SELECTION IN CHINA UNDER MAO Kimberly Singer Babiarz, Paul Ma, Grant Miller, and Shige Song Online Appendix Read the full paper at
How Does Straw Burning Affect Urban Air Quality in China?
 How Does Straw Burning Affect Urban Air Quality in China? Shiqi (Steven) Guo The Graduate Institute of International and Development Studies, Geneva September 2017, UNU-WIDER Effects of Air Pollution Health
Grey Correlational Analysis on Structure of Inbound. Tourism Industry of Xinjiang Province
 3rd International Conference on Education, Management and Computing Technology (ICEMCT 2016) Grey Correlational Analysis on Structure of Inbound Tourism Industry of Xinjiang Province Pingxin Han 1, Xiaoling
LOCATIONAL PREFERENCES OF FDI FIRMS IN TURKEY
 LOCATIONAL PREFERENCES OF FDI FIRMS IN TURKEY Prof. Dr. Lale BERKÖZ Assist. Prof. Dr.S. SenceTÜRK I.T.U. Faculty of Architecture Istanbul/TURKEY E-mail: lberkoz@itu.edu.tr INTRODUCTION Foreign direct investment
Study on Spatial Structure Dynamic Evolution of Tourism Economic Zone along Wuhan-Guangzhou HSR
 Open Access Library Journal 2017, Volume 4, e4045 ISSN Online: 2333-9721 ISSN Print: 2333-9705 Study on Spatial Structure Dynamic Evolution of Tourism Economic Zone along Wuhan-Guangzhou HSR Chun Liu 1,2
A Spatial Econometric Approach to Model the Growth of Tourism Flows to China Cities
 April 15, 2010 AAG 2010 Conference, Washington DC A Spatial Econometric Approach to Model the Growth of Tourism Flows to China Cities Yang Yang University of Florida Kevin. K.F. Wong The Hong Kong Polytechnic
Study on Shandong Expressway Network Planning Based on Highway Transportation System
 Study on Shandong Expressway Network Planning Based on Highway Transportation System Fei Peng a, Yimeng Wang b and Chengjun Shi c School of Automobile, Changan University, Xian 71000, China; apengfei0799@163.com,
A Study of Hotel Performance Under Urbanization in China
 A Study of Hotel Performance Under Urbanization in China Jian Ming LUO, Faculty of International Tourism and Management, City University of Macau, Macao. E-mail: kennyluo@cityu.mo Abstract This paper studied
Trade and Direct Investment across the Taiwan Strait
 Trade and Direct Investment across the Taiwan Strait - An Empirical Analysis of Taiwan and China s Accession into the WTO Ji Chou Chung-Hua Institution for Economic Research Shiu-Tung Wang National Taiwan
Benjamin Ognjanov. Insync Research, Melbourne, Australia. Yihong Tang. Central University of Finance and Economics, Beijing, China.
 Chinese Business Review, Jan. 2018, Vol. 17, No. 1, 38-52 doi: 10.17265/1537-1506/2018.01.004 D DAVID PUBLISHING Forecasting International Tourism Regional Expenditure Benjamin Ognjanov Insync Research,
Chin. Geogra. Sci Vol. 27 No. 3 pp Springer Science Press
 Chin. Geogra. Sci. 2017 Vol. 27 No. 3 pp. 456 470 Springer Science Press doi: 10.1007/s11769-017-0877-7 www.springerlink.com/content/1002-0063 Industrial Agglomeration Externalities, City Size, and Regional
Study on the Comprehensive Evaluation of the Economic Development Levels of Prefecture-Level Cities in Shandong Province
 International Journal of Economic Theory and Application 08; 5(): -8 http://www.aascit.org/journal/ijeta ISSN: 375-98X Study on the Comprehensive Evaluation of the Economic Development Levels of Prefecture-Level
Research Center for Science Technology and Society of Fuzhou University, International Studies and Trade, Changle Fuzhou , China
 2017 3rd Annual International Conference on Modern Education and Social Science (MESS 2017) ISBN: 978-1-60595-450-9 An Analysis of the Correlation Between the Scale of Higher Education and Economic Growth
Environmental Effects of Foreign Trade and Its Spatial Variations in Mid-eastern Provinces and Cities of China
 Chin. Geogra. Sci. 2012 Vol. 22 No. 5 pp. 626 636 doi: 10.1007/s11769-012-0546-9 www.springerlink.com/content/1002-0063 Environmental Effects of Foreign Trade and Its Spatial Variations in Mid-eastern
China Coal-Coking Industry & Listed Companies Report,
 China Coal-Coking Industry & Listed Companies Report, 2007-2008 Coal-coking, as an auxiliary sector for the metallurgical industry, is the most mature sector in technology and the most representative of
Spatial Inequality Analysis of Fire Risk in China
 Journal of Risk Analysis and Crisis Response, Vol. 6, No. 3 (October 2016), 145-155 Spatial Inequality Analysis of Fire Risk in China Guohui Li, Lizeng Zhao, Weiping Han, Ying Wang Tianjin Fire Research
Research on Economic Development Stage and Marginal Effects of Trade and FDI on Economic Growth in China
 International Journal of Economics and Finance; Vol. 5, No. 11; 2013 ISSN 1916-971XE-ISSN 1916-9728 Published by Canadian Center of Science and Education Research on Economic Development Stage and Marginal
Measuring Disaster Risk for Urban areas in Asia-Pacific
 Measuring Disaster Risk for Urban areas in Asia-Pacific Acknowledgement: Trevor Clifford, Intl Consultant 1 SDG 11 Make cities and human settlements inclusive, safe, resilient and sustainable 11.1: By
SPATIAL ANALYSIS OF POPULATION DATA BASED ON GEOGRAPHIC INFORMATION SYSTEM
 SPATIAL ANALYSIS OF POPULATION DATA BASED ON GEOGRAPHIC INFORMATION SYSTEM Liu, D. Chinese Academy of Surveying and Mapping, 16 Beitaiping Road, Beijing 100039, China. E-mail: liudq@casm.ac.cn ABSTRACT
Urbanization and spatial policies. June 2006 Kyung-Hwan Kim
 Urbanization and spatial policies June 2006 Kyung-Hwan Kim stamitzkim@gmail.com 1 Urbanization Urbanization as a process of development Stages of urbanization Trends of world urbanization Dominance of
Polio Bulletin 2015 Issue No Week 37 (as of 14 September 2015)
") HIGHLIGHTS Implementa on of Polio Endgame Strategy in the WHO region for Western Pacific (Update on progress as of 15 September 2015) According to the global Polio Eradica on and Endgame Strategic Plan
HIGHLIGHTS Implementa on of Polio Endgame Strategy in the WHO region for Western Pacific (Update on progress as of 15 September 2015) According to the global Polio Eradica on and Endgame Strategic Plan
Fundamental Causes of Inland-coastal Income Inequality in Post-reform China
 Fundamental Causes of Inland-coastal Income Inequality in Post-reform China Rui HAO a and Zheng WEI b a Corresponding author CERDI, Université d Auvergne, 65 Boulevard François Mitterrand 63000 Clermont-Ferrand,
Geographic distribution of hospital beds throughout China: a county-level econometric analysis
 Pan and Shallcross International Journal for Equity in Health (2016) 15:179 DOI 10.1186/s12939-016-0467-9 RESEARCH Open Access Geographic distribution of hospital beds throughout China: a county-level
Accepted Manuscript. The comprehensive environmental efficiency of socioeconomic sectors in China: An analysis based on a non-separable bad output SBM
 Accepted Manuscript The comprehensive environmental efficiency of socioeconomic sectors in China: An analysis based on a non-separable bad output SBM Qi He, Ji Han, Dabo Guan, Zhifu Mi, Hongyan Zhao, Qiang
Geographically weighted regression approach for origin-destination flows
 Geographically weighted regression approach for origin-destination flows Kazuki Tamesue 1 and Morito Tsutsumi 2 1 Graduate School of Information and Engineering, University of Tsukuba 1-1-1 Tennodai, Tsukuba,
Regional disparity of labor s share in China: Evidence and explanation
 MPRA Munich Personal RePEc Archive Regional disparity of labor s share in China: Evidence and explanation Wei Chi and Qian Xiaoye School of Economics and Management, Tsinghua University November 2011 Online
Topic 4: Changing cities
 Topic 4: Changing cities Overview of urban patterns and processes 4.1 Urbanisation is a global process a. Contrasting trends in urbanisation over the last 50 years in different parts of the world (developed,
Land Use Regionalization of Rural Settlements in China
 Chin. Geogra. Sci. 2013 Vol. 23 No. 4 pp. 421 434 Springer Science Press doi: 10.1007/s11769-013-0592-y www.springerlink.com/content/1002-0063 Land Use Regionalization of Rural Settlements in China SONG
Implementation Performance Evaluation on Land Use Planning: A Case of Chengdu, China
 Cross-Cultural Communication Vol. 8, No. 4, 2012, pp. 34-38 DOI:10.3968/j.ccc.1923670020120804.1020 ISSN 1712-8358[Print] ISSN 1923-6700[Online] www.cscanada.net www.cscanada.org Implementation Performance
Brief introduction to recovery and reconstruction
 Brief introduction to recovery and reconstruction of Wenchuan earthquake stricken region He Yongnian China Earthquake Administration May 2011 Major parameters of Wenchuan earthquake Original time: 14:28,
A Case Study of Regional Dynamics of China 中国区域动态案例研究
 A Case Study of Regional Dynamics of China 中国区域动态案例研究 Shuming Bao Spatial Data Center & China Data Center University of Michigan 1:00 PM - 2:00 PM, Tue, Feb 6, 2018 EST USA A Case Study of Regional Dynamics
A s i a n J o u r n a l o f M u l t i d i m e n s i o n a l R e s e a r c h KUZNETS CURVE: THE CASE OF THE INDIAN ECONOMY
 P u b l i s h e d b y : T R A N S A s i a n R e s e a r c h J o u r n a l s AJMR: A s i a n J o u r n a l o f M u l t i d i m e n s i o n a l R e s e a r c h (A Do u b le B lind Re fe r e e d & Re v ie
Analysis of Impact of Urban Agglomeration Planning of Middle and Lower Yangtze River on International Trade Development in Central China.
 International Conference on Education, Management and Computing Technology (ICEMCT 2015) Analysis of Impact of Urban Agglomeration Planning of Middle and Lower Yangtze River on International Trade Development
BOOK REVIEW. Income Inequality and Poverty in Malaysia by Shireen Mardziah Hashim, Lanham, Md., Rowman & Littlefield Publishers, 1998, xxv + 243pp.
 The Developing Economies, XXXVII-3 (September 1999) BOOK REVIEW Income Inequality and Poverty in Malaysia by Shireen Mardziah Hashim, Lanham, Md., Rowman & Littlefield Publishers, 1998, xxv + 243pp. This
Effects of Intraregional Disparities on Regional Development in China: Inequality Decomposition and Panel-Data Analysis
 Effects of Intraregional Disparities on Regional Development in China: Inequality Decomposition and Panel-Data Analysis By Reuter, Ulrich * ABSTRACT This paper analyzes the development and effects of intra-provincial
Asian Development Bank Institute. ADBI Working Paper Series
 ADBI Working Paper Series WHY GEOGRAPHIC DISPERSION BEFORE ITS TIME: INDUSTRIAL POLICY AND ECONOMIC GEOGRAPHY IN THE PEOPLE S REPUBLIC OF CHINA Yiyun Wu and Xiwei Zhu No. 633 January 2017 Asian Development
Evaluation of urban development quality of the coastal cities around the Bohai Rim
 Journal of Physics: Conference Series PAPER OPEN ACCESS Evaluation of urban development quality of the coastal cities around the Bohai Rim To cite this article: Yan Liu et al 2018 J. Phys.: Conf. Ser.
Regional Output Spillovers in China: Estimates from a VAR Model
 Regional Output Spillovers in China: Estimates from a VAR Model by Nicolaas Groenewold a * Guoping Lee b and Anping Chen b a Economics Program, University of Western Australia, Crawley, WA 6009, Australia
Effect of the strengthened western Pacific subtropical high on summer visibility decrease over eastern China since 1973
 University of Nebraska - Lincoln DigitalCommons@University of Nebraska - Lincoln Papers in the Earth and Atmospheric Sciences Earth and Atmospheric Sciences, Department of 2013 Effect of the strengthened
A Framework for the Study of Urban Health. Abdullah Baqui, DrPH, MPH, MBBS Johns Hopkins University
 This work is licensed under a Creative Commons Attribution-NonCommercial-ShareAlike License. Your use of this material constitutes acceptance of that license and the conditions of use of materials on this
Analysis on Competitiveness of Regional Central Cities:
 Int. Statistical Inst.: Proc. 58th World Statistical Congress, 2011, Dublin (Session IPS031) p.476 Analysis on Competitiveness of Regional Central Cities: the case of Yangtze River Delta Xiaolin Pang,
Urban land value, Accessibility and Night Light Data: A Case Study in China
 309-Paper Urban land value, Accessibility and Night Light Data: A Case Study in China Sumeeta Srinivasan, and Deng Yu Abstract In this paper, we use night light imagery data at two scales the city and
Income Disparities across Chinese Provinces: Revisiting the Convergence-Divergence Debate
 Income Disparities across Chinese Provinces: Revisiting the Convergence-Divergence Debate Ran Sha*, Wim Naudé** and Wilma Viviers* *School of Economics, North-West University (Potchefstroom Campus), South
The Impact of Trade Openness on Urbanization
 J ÖNKÖPING I NTERNATIONAL B USINESS S CHOOL JÖNKÖPING UNIVERSITY The Impact of Trade Openness on Urbanization A study of Eastern China Bachelor Thesis in Economics Author: Can Zhao (870123-9231) Zhewei
A Simplified Travel Demand Modeling Framework: in the Context of a Developing Country City
 A Simplified Travel Demand Modeling Framework: in the Context of a Developing Country City Samiul Hasan Ph.D. student, Department of Civil and Environmental Engineering, Massachusetts Institute of Technology,
Grade 7 Social Studies
 Standard 1: History Students will examine the major movements, events, and figures that contributed to the development of nations in modern Africa, Asia, and the Southwest Pacific from acient civilizations
Chapter 2 Thermal Springs in China
 Chapter 2 Thermal Springs in China Abstract This chapter introduces the quantity and distribution of thermal springs in China, Based on the investigation of whole country in 1970s, the total number of
CHIOT: Estimating Historical Input-output Tables of China
 CHIOT: Estimating Historical Input-output Tables of China Chen LIN a,, Lei SHI b, Qian WEI a a The Center for Economic Research, Shandong University b State Environmental Protection Key Laboratory of Eco-industry,
ARTNeT Interactive Gravity Modeling Tool
 Evidence-Based Trade Policymaking Capacity Building Programme ARTNeT Interactive Gravity Modeling Tool Witada Anukoonwattaka (PhD) UNESCAP 26 July 2011 Outline Background on gravity model of trade and
National Spatial Development Perspective (NSDP) Policy Coordination and Advisory Service
 Policy Coordination and Advisory Service") National Spatial Development Perspective (NSDP) Policy Coordination and Advisory Service 1 BACKGROUND The advances made in the First Decade by far supersede the weaknesses. Yet, if all indicators were
National Spatial Development Perspective (NSDP) Policy Coordination and Advisory Service 1 BACKGROUND The advances made in the First Decade by far supersede the weaknesses. Yet, if all indicators were
Empirical Study on the Relationship between Chemical Industry Agglomeration and Regional Economic Growth in Anhui Province
 1477 A publication of CHEMICAL ENGINEERING TRANSACTIONS VOL. 62, 2017 Guest Editors: Fei Song, Haibo Wang, Fang He Copyright 2017, AIDIC Servizi S.r.l. ISBN 978-88-95608-60-0; ISSN 2283-9216 The Italian