Simplifying Drug Discovery with JMP
|
|
|
- Lucas Bradley
- 5 years ago
- Views:
Transcription
1 Simplifying Drug Discovery with JMP John A. Wass, Ph.D. Quantum Cat Consultants, Lake Forest, IL Cele Abad-Zapatero, Ph.D. Adjunct Professor, Center for Pharmaceutical Biotechnology, University of Illinois at Chicago, Chicago, IL Introduction Pharmaceutical product development consists of a research phase, called Drug Discovery, and an applied phase where clinical studies are performed. In both areas, sophisticated and expensive software is extensively utilized to provide analytic power and database management. In the research phase, there are very many steps where simpler methods and less costly software may be utilized for a variety of studies. Although academe, where much of the research is done, favors such freeware as R and various roll-yourown software, industry and government often use commercial grade software such as JMP where powerful analytics are paired with sophisticated graphics in easy to use format. This paper delves into two areas of Discovery, gene expression, and ligand efficiency indices as they relate to mapping Chemico-biological space. Methods I: Gene Expression Genomic Datasets tend to be large and need to be statistically treated to properly convey the true nature of the underlying physical processes. These treatments include numerous issues of statistical normalization and multi-sample testing as well as biochemical variability, probe-sample pairing, and gene nomenclature which are not the subject of this brief presentation. As we wish to concentrate on the actual multivariate analysis of the data, we begin after the initial step of identifying the minimal gene set thought to be responsible, or at least contributory to the effect under study. In this section, we employ the Multivariate platform in JMP 8 to analyze tumor cell line resistance to analyze tumor cell line resistance to a metabolic inhibitor (1,2). Specifically this platform is used to i) separate resistance classes by Discriminant analysis and Clustering, and ii) further examine these differences by Principal Components Analysis (PCA). It further employs the Partition and Fit Model techniques to verify results. These types of strategies have been employed in many instances in drug discovery and find widespread use in molecular biology. Studies such as these are now implemented and greatly extended in JMP Genomics 5.0. It is the purpose of this paper to show how straightforward multivariate methods may shed light on the relative importance of various genes and gene groups. The data are from 1
2 a microarray study and represent fluorescence intensities from a microarray reader. The study compared expression of a family of pro-apoptotic genes and sensitivity to an antitumor drug in a panel of small cell lung carcinoma (SCLC), leukemia, and lymphoma cell lines, grouped as sensitive, intermediate, or resistant to anti-tumor drugs. The analytic methods here, from the Multivariate Methods, Modeling, and Fit Model Platforms are: Clustering (a multivariate grouping technique that joins groups having similar properties. Ward s method is used for small tables of less than a few thousand rows. Numeric variables are utilized where numeric differences make sense physically) Discriminant Analysis (useful to group variables by predicting class membership). The class variables may be nominal or ordinal but the predictor variables must be continuous. JMP uses a common covariance matrix for all groups and calculates the distance between points and their multivariate means. PCA (employs linear combinations of the standardized variables to reduce dimensionality of complex data sets and separate groups on the basis of variance vectors) Partition Analysis (partitions data according to a relationship between the X and Y values and determine groupings of X values that best predict a Y value) Fit Ordinal Logistic Model (the Fit Model platform utilizes the ordinal logistic fitting personality to model non-continuous data) These methods are used to i) asses their ability to cleanly separate the three groups (levels) of drug resistance and ii) be used as a model to predict resistance in new drugs. Data A portion of the data set is displayed below: 2
 separate the drug sensitivity classes by the gene expression changes, a first step is to cluster the data.")
3 The cell lines are identified in the first column, the sensitivity class in the second column and all others are the gene designations for the minimal gene set identified by ANOVA. To see if we can really (cleanly) separate the drug sensitivity classes by the gene expression changes, a first step is to cluster the data. This is a rough-cut technique and depends upon the technique utilized. We choose Hierarchical clustering as it is appropriate to small samples and we choose Ward s method as the best general compromise for a preliminary analysis. The results displayed below, indicate that one group (sensitive) is completely separated, while the other two (moderately sensitive and resistant) are not. 3

4 The list can be further clustered in 2D showing a heat map and separation both by sensitivity group and genes. This type of clustering might uncover important similarities in pathway action by the different genes. 4
 and classifies the point to the closest group.")
5 Another way to approach the class separation problem is Discriminant Analysis and will usually make a cleaner cut. DA will measure the distance from each point in the data set to each group's multivariate mean (often called a centroid) and classifies the point to the closest group. The distance measure used is the Mahalanobis distance, which takes into account the variances and covariances between the variables (3). For this separation a linear DA was used where it is assumed that the Y's are normally distributed with the same variances and covariances, but that there are different means for each group defined by X (3). 5

6 The finest cut is usually made with Principal Components Analysis. This highly mathematical method will use as many dimensions as necessary to effect a clean separation. Luckily, in most cases, only 2 or 3 are needed so the results may be interpreted physically. PCA is very useful to derive a small number of independent linear combinations of a set of variables that capture as much of the variability in the original variables as possible. Using principal component analysis reduces the dimensionality of a set of data. Principal components (PC s) are a way to picture the structure of the data as completely as possible by using as few variables as possible. For n original variables, n principal components are formed as follows: The first principal component is the linear combination of the standardized original variables that has the greatest possible variance. Each subsequent principal component is the linear combination of the standardized original variables that has the greatest possible variance and is uncorrelated with all previously defined components. Each principal component is calculated by taking a linear combination of an eigenvector of the correlation matrix with a standardized original variable. The eigenvalues show the variance of each component (3). 6
 and the relative importance of the individual genes in forming the vectors (Loading Plot).")
7 In JMP we can easily visualize the group separations with a score plot, that shows how the first two principal components are used to separate them At the same time, JMP produces diagnostics that let us know that two PC s are sufficient for the separation (Scree Plot) and the relative importance of the individual genes in forming the vectors (Loading Plot). 7

8 We can also produce a rotateable 3D scatterplot to better visualize the separation. This is important when placing new, unknown drugs into the calculations. 8

9 Finally, Partition Analysis and Logistic Regression may be used as alternative ways to i) separate the classes and ii) gain a deeper understanding of which genes may be driving the separation and thus drug sensitivity or resistance. Recursive partitioning is especially useful for preliminary exploration when there is a large data set with no prior model. The results are straightforward to interpret. Logistic regression is useful for fitting noncontinuous x-axis (predictor) data and can be effective with a single predictive factor. 9
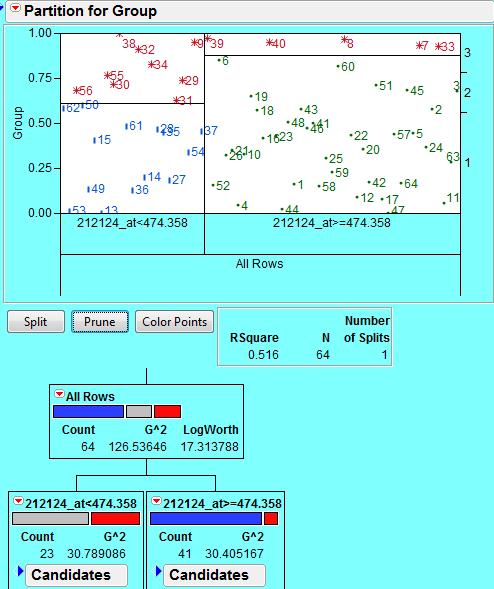
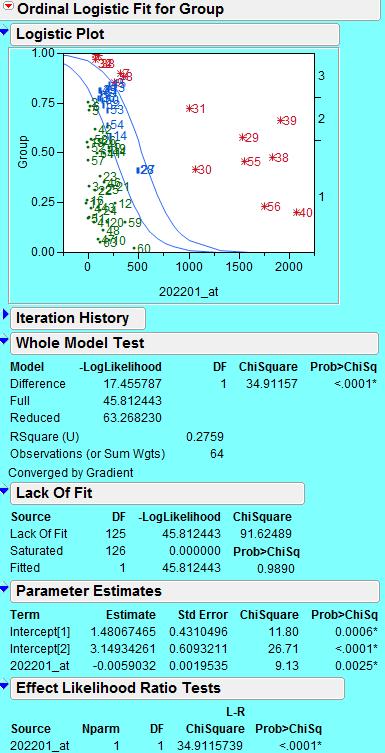
10 10
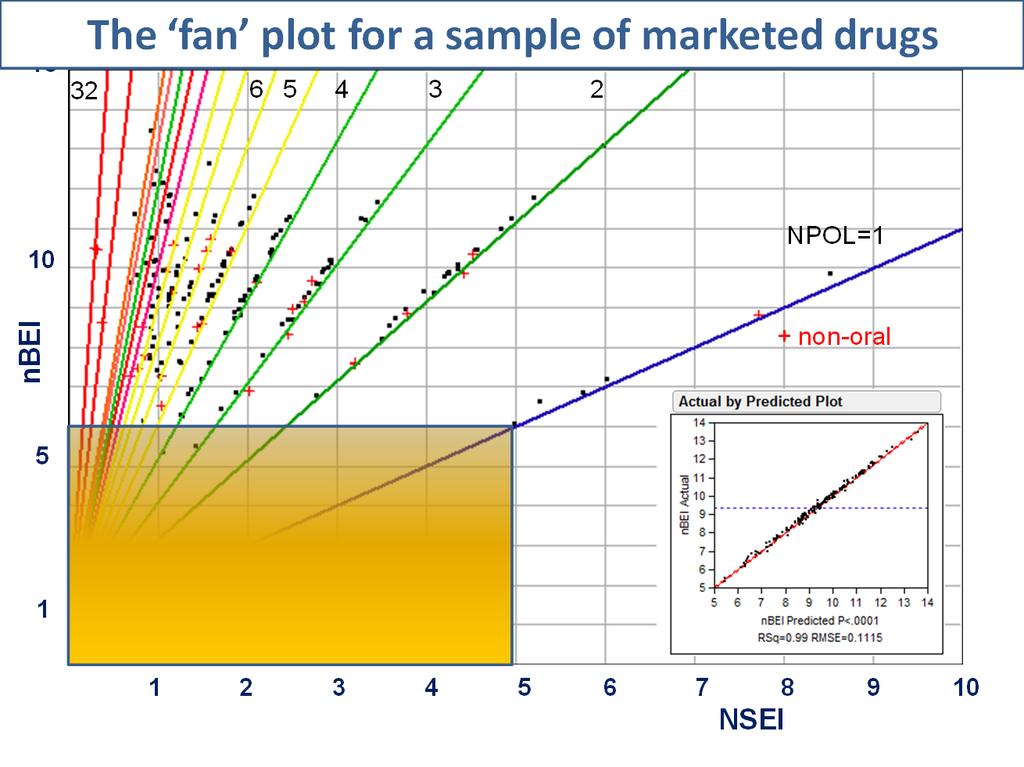
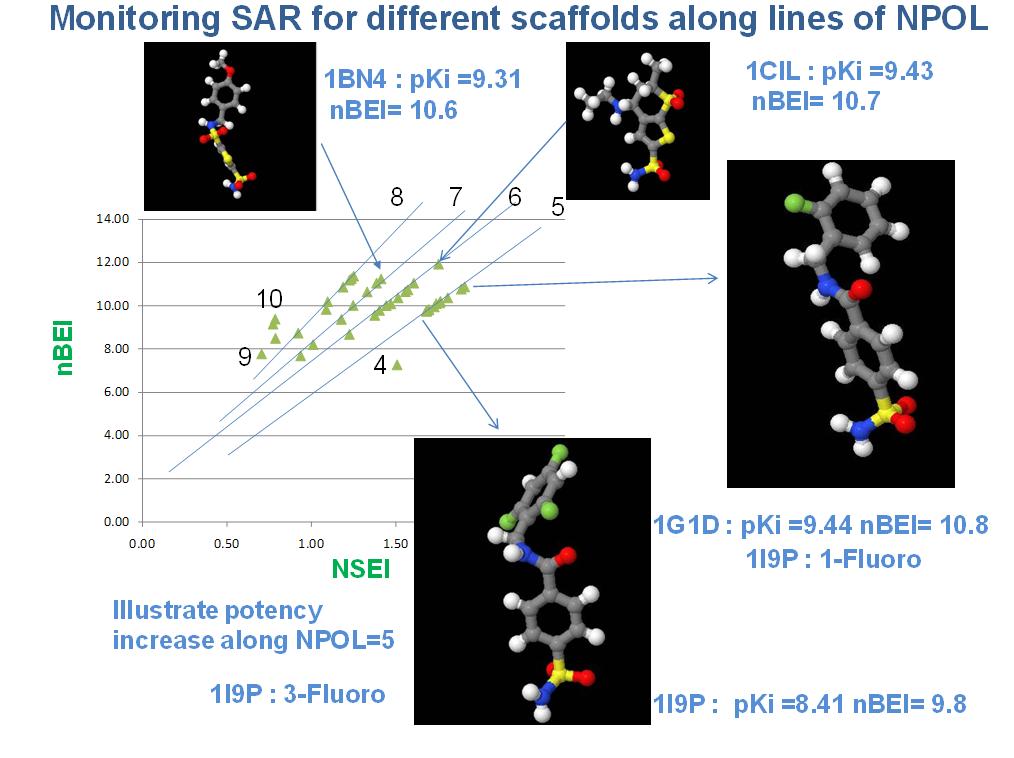
11 Methods II: Ligand Efficiency Indices (Mapping of Chemo-Biological Space) Yet another approach now being developed in drug discovery is the use of Ligand Efficiency Iindices (LEI s) to produce maps of chemical/biological properties of compounds, drug fragments and actual approved drugs. When new fragments (or chemical entities) are placed upon the map they may indicate the new fragments similarity (i.e., proximity) to an approved, on-market drug and thus suggest the probability that this fragment may successfully complete clinical trials. Although the chemistry runs deep and requires a multidimensional optimization of chemical structure integrating enzymology and cellular and organismic biology, the mathematics behind it is straightforward and the results easy to understand, interpret, and implement by the medicinal chemist (4). Historically it was realized that a more streamlined and efficient process for drug discovery was needed as increasingly, more money and effort is being used to less effect. As Lipinski s Rule of Five is limited in several ways and becoming less relevant to the discovery process, attention was focused on the potency of ligands to receptors (e.g., Ki) and evaluation of the fragments properties such as molecular weight, solubility, polar surface area (PSA), and ClogP. Beyond simple filtering there was a need to construct a numerical framework capable of predictive ability to maximize the probability of identifying a viable drug candidate. Ligand efficiency (LE) was originally defined in terms of ΔG and the number of nonhydrogen atoms N in the compound (5): LE = ΔG/N, where ΔG is the familiar Gibbs free energy and defined as G= -RTlnK i. Utilizing the importance of molecular weight (MW), the concept was extended to the use of binding affinities (4). As initial calculations demonstrated the efficacy of directly relating the potency (Ki, IC50, or related measurements) to the MW (in kda) and PSA of the ligands, these became the basis of the development of maps of the chemo-biological space that provide enhanced understanding of the distribution of compounds in terms of PSA/MW across the polarity-efficiency vs size-efficiency (SEI-BEI) plane (4,6). Moreover this representation suggests that compounds with both large values of SEI and BEI, optimize both variables simultaneously (6). In time the concepts were expanded to include related factors such as the number of heavy (non-hydrogen) atoms and the number of polar atoms (i.e., O and N). When we do this, we derive some very useful tools. Basically, the maps are constructed on sound chemical principles to display the nbei-nsei space (7) that nicely display the fragments and compounds along lines of distinct slope defined by the number of polar atoms in the chemical entity. These maps then, with descriptive annotation, suggest the probabilities of a fragment becoming a successful drug as successful drugs placed on the map suggest that there is i) an area on the lower left where there is little probability that a molecular entity will become a drug and ii) the further out and up in the lines that a new candidate lies, the greater is the probability of successful drug development. A more rigorous analysis is being undertaken to estimate probabilities for different targets. 11
 in the chemical compound.")
12 Fig. 1. Y-axis: nbei ; X-axis: NSEI. Representation of a limited sample of 200 marketed drugs in the nbei-nsei plane. The slope of the lines is equal to the number of polar atoms (N plus O) in the chemical compound. The limited dataset courtesy of the ChEMBL database (European Bioinformatics Institute, Hinxton, Wellcome Trust Campus, Cambridge, UK). See references (4, 6-7) for details. 12
13 13

14 SAS and all other SAS Institute Inc. product or service names are registered trademarks or trademarks of SAS Institute Inc. in the USA and other countries. indicates USA registration. Other brand and product names are registered trademarks or trademarks of their respective companies. References 1. Zeru, M. et. al. p53 and BCl-2 protein expression and its relationship with prognosis in small-cell lung cancer. Clin Lung Cancer 2003; 4: Tahir S.K. et. al. Identification of expression signatures predictive of sensitivity to the BCl-2 family member inhibitor ABT-263 in small cell lung carcinoma and leukemia/lymphoma cell lines. Mol Cancer Ther Mar;9(3): SAS Institute Inc JMP 8 Statistics and Graphics Guide, Volumes 1 and 2. Cary, NC 4. Abad-Zapatero, C. and J. T. Metz. Ligand efficiency indices as guideposts for drug discovery. Drug Discovery Today (2005) 10(7): Hopkins, AL, Groom, CR, and A. Alex. Ligand efficiency: a useful metric for lead selection. Drug Discovery Today (2004) 9(10): Abad-Zapatero, C. Ligand Efficiency Indices for Effective Drug Discovery. Expert Opinion in Drug Discovery (2007) 2(4): Abad-Zapatero et. al. Ligand Efficiency Indices for an Effective Mapping of Chemico-Biological Space. Drug Discovery Today, (in press). 14
Using AutoDock for Virtual Screening
 Using AutoDock for Virtual Screening CUHK Croucher ASI Workshop 2011 Stefano Forli, PhD Prof. Arthur J. Olson, Ph.D Molecular Graphics Lab Screening and Virtual Screening The ultimate tool for identifying
Principal Component Analysis, A Powerful Scoring Technique
 Principal Component Analysis, A Powerful Scoring Technique George C. J. Fernandez, University of Nevada - Reno, Reno NV 89557 ABSTRACT Data mining is a collection of analytical techniques to uncover new
DIMENSION REDUCTION AND CLUSTER ANALYSIS
 DIMENSION REDUCTION AND CLUSTER ANALYSIS EECS 833, 6 March 2006 Geoff Bohling Assistant Scientist Kansas Geological Survey geoff@kgs.ku.edu 864-2093 Overheads and resources available at http://people.ku.edu/~gbohling/eecs833
Statistics Toolbox 6. Apply statistical algorithms and probability models
 Statistics Toolbox 6 Apply statistical algorithms and probability models Statistics Toolbox provides engineers, scientists, researchers, financial analysts, and statisticians with a comprehensive set of
Advanced Medicinal Chemistry SLIDES B
 Advanced Medicinal Chemistry Filippo Minutolo CFU 3 (21 hours) SLIDES B Drug likeness - ADME two contradictory physico-chemical parameters to balance: 1) aqueous solubility 2) lipid membrane permeability
Principle Components Analysis (PCA) Relationship Between a Linear Combination of Variables and Axes Rotation for PCA
 Relationship Between a Linear Combination of Variables and Axes Rotation for PCA") Principle Components Analysis (PCA) Relationship Between a Linear Combination of Variables and Axes Rotation for PCA Principle Components Analysis: Uses one group of variables (we will call this X) In
Principle Components Analysis (PCA) Relationship Between a Linear Combination of Variables and Axes Rotation for PCA Principle Components Analysis: Uses one group of variables (we will call this X) In
G E INTERACTION USING JMP: AN OVERVIEW
 G E INTERACTION USING JMP: AN OVERVIEW Sukanta Dash I.A.S.R.I., Library Avenue, New Delhi-110012 sukanta@iasri.res.in 1. Introduction Genotype Environment interaction (G E) is a common phenomenon in agricultural
Analyzing and Interpreting Continuous Data Using JMP
 Analyzing and Interpreting Continuous Data Using JMP A Step-by-Step Guide José G. Ramírez, Ph.D. Brenda S. Ramírez, M.S. Corrections to first printing. The correct bibliographic citation for this manual
Principal component analysis
 Principal component analysis Motivation i for PCA came from major-axis regression. Strong assumption: single homogeneous sample. Free of assumptions when used for exploration. Classical tests of significance
Data Quality Issues That Can Impact Drug Discovery
 Data Quality Issues That Can Impact Drug Discovery Sean Ekins 1, Joe Olechno 2 Antony J. Williams 3 1 Collaborations in Chemistry, Fuquay Varina, NC. 2 Labcyte Inc, Sunnyvale, CA. 3 Royal Society of Chemistry,
Principal Component Analysis -- PCA (also called Karhunen-Loeve transformation)
") Principal Component Analysis -- PCA (also called Karhunen-Loeve transformation) PCA transforms the original input space into a lower dimensional space, by constructing dimensions that are linear combinations
Principal Component Analysis -- PCA (also called Karhunen-Loeve transformation) PCA transforms the original input space into a lower dimensional space, by constructing dimensions that are linear combinations
Multivariate analysis of genetic data: an introduction
 Multivariate analysis of genetic data: an introduction Thibaut Jombart MRC Centre for Outbreak Analysis and Modelling Imperial College London XXIV Simposio Internacional De Estadística Bogotá, 25th July
Dimensionality Reduction Techniques (DRT)
") Dimensionality Reduction Techniques (DRT) Introduction: Sometimes we have lot of variables in the data for analysis which create multidimensional matrix. To simplify calculation and to get appropriate,
Dimensionality Reduction Techniques (DRT) Introduction: Sometimes we have lot of variables in the data for analysis which create multidimensional matrix. To simplify calculation and to get appropriate,
Structure in Data. A major objective in data analysis is to identify interesting features or structure in the data.
 Structure in Data A major objective in data analysis is to identify interesting features or structure in the data. The graphical methods are very useful in discovering structure. There are basically two
Receptor Based Drug Design (1)
") Induced Fit Model For more than 100 years, the behaviour of enzymes had been explained by the "lock-and-key" mechanism developed by pioneering German chemist Emil Fischer. Fischer thought that the chemicals
Induced Fit Model For more than 100 years, the behaviour of enzymes had been explained by the "lock-and-key" mechanism developed by pioneering German chemist Emil Fischer. Fischer thought that the chemicals
Ligand Efficiency Indices for an Effective Mapping of Chemico- Biological Space: The concept of an Atlas-like representation.
 Ligand Efficiency Indices for an Effective Mapping of Chemico- Biological Space: The concept of an Atlas-like representation. Authors: Cele Abad-Zapatero 1,*, gnjen Perišić 1,4, John Wass 2, A. Patrícia
Principal component analysis (PCA) for clustering gene expression data
 for clustering gene expression data") Principal component analysis (PCA) for clustering gene expression data Ka Yee Yeung Walter L. Ruzzo Bioinformatics, v17 #9 (2001) pp 763-774 1 Outline of talk Background and motivation Design of our empirical
Principal component analysis (PCA) for clustering gene expression data Ka Yee Yeung Walter L. Ruzzo Bioinformatics, v17 #9 (2001) pp 763-774 1 Outline of talk Background and motivation Design of our empirical
Introduction to multivariate analysis Outline
 Introduction to multivariate analysis Outline Why do a multivariate analysis Ordination, classification, model fitting Principal component analysis Discriminant analysis, quickly Species presence/absence
Early Stages of Drug Discovery in the Pharmaceutical Industry
 Early Stages of Drug Discovery in the Pharmaceutical Industry Daniel Seeliger / Jan Kriegl, Discovery Research, Boehringer Ingelheim September 29, 2016 Historical Drug Discovery From Accidential Discovery
Introduction. OntoChem
 Introduction ntochem Providing drug discovery knowledge & small molecules... Supporting the task of medicinal chemistry Allows selecting best possible small molecule starting point From target to leads
MSc Drug Design. Module Structure: (15 credits each) Lectures and Tutorials Assessment: 50% coursework, 50% unseen examination.
 Lectures and Tutorials Assessment: 50% coursework, 50% unseen examination.") Module Structure: (15 credits each) Lectures and Assessment: 50% coursework, 50% unseen examination. Module Title Module 1: Bioinformatics and structural biology as applied to drug design MEDC0075 In the
Module Structure: (15 credits each) Lectures and Assessment: 50% coursework, 50% unseen examination. Module Title Module 1: Bioinformatics and structural biology as applied to drug design MEDC0075 In the
What is Principal Component Analysis?
 What is Principal Component Analysis? Principal component analysis (PCA) Reduce the dimensionality of a data set by finding a new set of variables, smaller than the original set of variables Retains most
Experimental Design and Data Analysis for Biologists
 Experimental Design and Data Analysis for Biologists Gerry P. Quinn Monash University Michael J. Keough University of Melbourne CAMBRIDGE UNIVERSITY PRESS Contents Preface page xv I I Introduction 1 1.1
Application of Ghosh, Grizzle and Sen s Nonparametric Methods in. Longitudinal Studies Using SAS PROC GLM
 Application of Ghosh, Grizzle and Sen s Nonparametric Methods in Longitudinal Studies Using SAS PROC GLM Chan Zeng and Gary O. Zerbe Department of Preventive Medicine and Biometrics University of Colorado
Quantitative Understanding in Biology Principal Components Analysis
 Quantitative Understanding in Biology Principal Components Analysis Introduction Throughout this course we have seen examples of complex mathematical phenomena being represented as linear combinations
Table of Contents. Multivariate methods. Introduction II. Introduction I
 Table of Contents Introduction Antti Penttilä Department of Physics University of Helsinki Exactum summer school, 04 Construction of multinormal distribution Test of multinormality with 3 Interpretation
Practice of SAS Logistic Regression on Binary Pharmacodynamic Data Problems and Solutions. Alan J Xiao, Cognigen Corporation, Buffalo NY
 Practice of SAS Logistic Regression on Binary Pharmacodynamic Data Problems and Solutions Alan J Xiao, Cognigen Corporation, Buffalo NY ABSTRACT Logistic regression has been widely applied to population
Compounding insights Thermo Scientific Compound Discoverer Software
 Compounding insights Thermo Scientific Compound Discoverer Software Integrated, complete, toolset solves small-molecule analysis challenges Thermo Scientific Orbitrap mass spectrometers produce information-rich
October 6 University Faculty of pharmacy Computer Aided Drug Design Unit
 October 6 University Faculty of pharmacy Computer Aided Drug Design Unit CADD@O6U.edu.eg CADD Computer-Aided Drug Design Unit The development of new drugs is no longer a process of trial and error or strokes
Chapter 4: Factor Analysis
 Chapter 4: Factor Analysis In many studies, we may not be able to measure directly the variables of interest. We can merely collect data on other variables which may be related to the variables of interest.
Drug Informatics for Chemical Genomics...
 Drug Informatics for Chemical Genomics... An Overview First Annual ChemGen IGERT Retreat Sept 2005 Drug Informatics for Chemical Genomics... p. Topics ChemGen Informatics The ChemMine Project Library Comparison
Overview of clustering analysis. Yuehua Cui
 Overview of clustering analysis Yuehua Cui Email: cuiy@msu.edu http://www.stt.msu.edu/~cui A data set with clear cluster structure How would you design an algorithm for finding the three clusters in this
Basics of Multivariate Modelling and Data Analysis
 Basics of Multivariate Modelling and Data Analysis Kurt-Erik Häggblom 2. Overview of multivariate techniques 2.1 Different approaches to multivariate data analysis 2.2 Classification of multivariate techniques
Next Generation Computational Chemistry Tools to Predict Toxicity of CWAs
 Next Generation Computational Chemistry Tools to Predict Toxicity of CWAs William (Bill) Welsh welshwj@umdnj.edu Prospective Funding by DTRA/JSTO-CBD CBIS Conference 1 A State-wide, Regional and National
FACTOR ANALYSIS AND MULTIDIMENSIONAL SCALING
 FACTOR ANALYSIS AND MULTIDIMENSIONAL SCALING Vishwanath Mantha Department for Electrical and Computer Engineering Mississippi State University, Mississippi State, MS 39762 mantha@isip.msstate.edu ABSTRACT
Medicinal Chemistry and Chemical Biology
 Medicinal Chemistry and Chemical Biology Activities Drug Discovery Imaging Chemical Biology Computational Chemistry Natural Product Synthesis Current Staff Mike Waring Professor of Medicinal Chemistry
Structure-Based Drug Discovery An Overview
 Structure-Based Drug Discovery An Overview Edited by Roderick E. Hubbard University of York, Heslington, York, UK and Vernalis (R&D) Ltd, Abington, Cambridge, UK RSC Publishing Contents Chapter 1 3D Structure
Metabolite Identification and Characterization by Mining Mass Spectrometry Data with SAS and Python
 PharmaSUG 2018 - Paper AD34 Metabolite Identification and Characterization by Mining Mass Spectrometry Data with SAS and Python Kristen Cardinal, Colorado Springs, Colorado, United States Hao Sun, Sun
Multivariate Data Analysis a survey of data reduction and data association techniques: Principal Components Analysis
 Multivariate Data Analysis a survey of data reduction and data association techniques: Principal Components Analysis For example Data reduction approaches Cluster analysis Principal components analysis
1 A factor can be considered to be an underlying latent variable: (a) on which people differ. (b) that is explained by unknown variables
 on which people differ. (b) that is explained by unknown variables") 1 A factor can be considered to be an underlying latent variable: (a) on which people differ (b) that is explained by unknown variables (c) that cannot be defined (d) that is influenced by observed variables
1 A factor can be considered to be an underlying latent variable: (a) on which people differ (b) that is explained by unknown variables (c) that cannot be defined (d) that is influenced by observed variables
Plan. Lecture: What is Chemoinformatics and Drug Design? Description of Support Vector Machine (SVM) and its used in Chemoinformatics.
 and its used in Chemoinformatics.") Plan Lecture: What is Chemoinformatics and Drug Design? Description of Support Vector Machine (SVM) and its used in Chemoinformatics. Exercise: Example and exercise with herg potassium channel: Use of
Plan Lecture: What is Chemoinformatics and Drug Design? Description of Support Vector Machine (SVM) and its used in Chemoinformatics. Exercise: Example and exercise with herg potassium channel: Use of
Structural biology and drug design: An overview
 Structural biology and drug design: An overview livier Taboureau Assitant professor Chemoinformatics group-cbs-dtu otab@cbs.dtu.dk Drug discovery Drug and drug design A drug is a key molecule involved
Cross Discipline Analysis made possible with Data Pipelining. J.R. Tozer SciTegic
 Cross Discipline Analysis made possible with Data Pipelining J.R. Tozer SciTegic System Genesis Pipelining tool created to automate data processing in cheminformatics Modular system built with generic
Virtual affinity fingerprints in drug discovery: The Drug Profile Matching method
 Ágnes Peragovics Virtual affinity fingerprints in drug discovery: The Drug Profile Matching method PhD Theses Supervisor: András Málnási-Csizmadia DSc. Associate Professor Structural Biochemistry Doctoral
INTRODUCCIÓ A L'ANÀLISI MULTIVARIANT. Estadística Biomèdica Avançada Ricardo Gonzalo Sanz 13/07/2015
 INTRODUCCIÓ A L'ANÀLISI MULTIVARIANT Estadística Biomèdica Avançada Ricardo Gonzalo Sanz ricardo.gonzalo@vhir.org 13/07/2015 1. Introduction to Multivariate Analysis 2. Summary Statistics for Multivariate
Introduction to Chemoinformatics and Drug Discovery
 Introduction to Chemoinformatics and Drug Discovery Irene Kouskoumvekaki Associate Professor February 15 th, 2013 The Chemical Space There are atoms and space. Everything else is opinion. Democritus (ca.
CMSC858P Supervised Learning Methods
 CMSC858P Supervised Learning Methods Hector Corrada Bravo March, 2010 Introduction Today we discuss the classification setting in detail. Our setting is that we observe for each subject i a set of p predictors
Leverage Sparse Information in Predictive Modeling
 Leverage Sparse Information in Predictive Modeling Liang Xie Countrywide Home Loans, Countrywide Bank, FSB August 29, 2008 Abstract This paper examines an innovative method to leverage information from
Principal Variance Components Analysis for Quantifying Variability in Genomics Data
 Principal Variance Components Analysis for Quantifying Variability in Genomics Data Tzu-Ming Chu SAS Institute Inc. Outlines Motivation PVCA (PCA + VCA) Example Mouse Lung Tumorigenicity Data Grouped Batch
Principal component analysis, PCA
 CHEM-E3205 Bioprocess Optimization and Simulation Principal component analysis, PCA Tero Eerikäinen Room D416d tero.eerikainen@aalto.fi Data Process or system measurements New information from the gathered
Gene Expression Data Classification with Revised Kernel Partial Least Squares Algorithm
 Gene Expression Data Classification with Revised Kernel Partial Least Squares Algorithm Zhenqiu Liu, Dechang Chen 2 Department of Computer Science Wayne State University, Market Street, Frederick, MD 273,
Lecture 6: Methods for high-dimensional problems
 Lecture 6: Methods for high-dimensional problems Hector Corrada Bravo and Rafael A. Irizarry March, 2010 In this Section we will discuss methods where data lies on high-dimensional spaces. In particular,
Unconstrained Ordination
 Unconstrained Ordination Sites Species A Species B Species C Species D Species E 1 0 (1) 5 (1) 1 (1) 10 (4) 10 (4) 2 2 (3) 8 (3) 4 (3) 12 (6) 20 (6) 3 8 (6) 20 (6) 10 (6) 1 (2) 3 (2) 4 4 (5) 11 (5) 8 (5)
Structure-based maximal affinity model predicts small-molecule druggability
 Structure-based maximal affinity model predicts small-molecule druggability Alan Cheng alan.cheng@amgen.com IMA Workshop (Jan 17, 2008) Druggability prediction Introduction Affinity model Some results
Classification 1: Linear regression of indicators, linear discriminant analysis
 Classification 1: Linear regression of indicators, linear discriminant analysis Ryan Tibshirani Data Mining: 36-462/36-662 April 2 2013 Optional reading: ISL 4.1, 4.2, 4.4, ESL 4.1 4.3 1 Classification
Data Analyses in Multivariate Regression Chii-Dean Joey Lin, SDSU, San Diego, CA
 Data Analyses in Multivariate Regression Chii-Dean Joey Lin, SDSU, San Diego, CA ABSTRACT Regression analysis is one of the most used statistical methodologies. It can be used to describe or predict causal
Computational Methods and Drug-Likeness. Benjamin Georgi und Philip Groth Pharmakokinetik WS 2003/2004
 Computational Methods and Drug-Likeness Benjamin Georgi und Philip Groth Pharmakokinetik WS 2003/2004 The Problem Drug development in pharmaceutical industry: >8-12 years time ~$800m costs >90% failure
Retrieving hits through in silico screening and expert assessment M. N. Drwal a,b and R. Griffith a
 Retrieving hits through in silico screening and expert assessment M.. Drwal a,b and R. Griffith a a: School of Medical Sciences/Pharmacology, USW, Sydney, Australia b: Charité Berlin, Germany Abstract:
Predicting Protein Functions and Domain Interactions from Protein Interactions
 Predicting Protein Functions and Domain Interactions from Protein Interactions Fengzhu Sun, PhD Center for Computational and Experimental Genomics University of Southern California Outline High-throughput
Cheminformatics Role in Pharmaceutical Industry. Randal Chen Ph.D. Abbott Laboratories Aug. 23, 2004 ACS
 Cheminformatics Role in Pharmaceutical Industry Randal Chen Ph.D. Abbott Laboratories Aug. 23, 2004 ACS Agenda The big picture for pharmaceutical industry Current technological/scientific issues Types
Robot Image Credit: Viktoriya Sukhanova 123RF.com. Dimensionality Reduction
 Robot Image Credit: Viktoriya Sukhanova 13RF.com Dimensionality Reduction Feature Selection vs. Dimensionality Reduction Feature Selection (last time) Select a subset of features. When classifying novel
7. Variable extraction and dimensionality reduction
 7. Variable extraction and dimensionality reduction The goal of the variable selection in the preceding chapter was to find least useful variables so that it would be possible to reduce the dimensionality
BIO 682 Multivariate Statistics Spring 2008
 BIO 682 Multivariate Statistics Spring 2008 Steve Shuster http://www4.nau.edu/shustercourses/bio682/index.htm Lecture 11 Properties of Community Data Gauch 1982, Causton 1988, Jongman 1995 a. Qualitative:
Knowledge instead of ignorance. More efficient drug design through the understanding of experimental uncertainty
 Research & development Research into active ingredients Knowledge instead of ignorance More efficient drug design through the understanding of experimental uncertainty 6 q&more 01.14 Prof. Dr Christian
Gene Expression Data Classification With Kernel Principal Component Analysis
 Journal of Biomedicine and Biotechnology 25:2 25 55 59 DOI:.55/JBB.25.55 RESEARCH ARTICLE Gene Expression Data Classification With Kernel Principal Component Analysis Zhenqiu Liu, Dechang Chen, 2 and Halima
In silico pharmacology for drug discovery
 In silico pharmacology for drug discovery In silico drug design In silico methods can contribute to drug targets identification through application of bionformatics tools. Currently, the application of
QSAR of Microtubule Stabilizing Dictyostatins
 QSAR of Microtubule Stabilizing Dictyostatins Kia Montgomery BBSI 2007- University of Pittsburgh Department of Chemistry, Grambling State University Billy Day, Ph.D. Department of Pharmaceutical Sciences,
Introduction to Chemoinformatics
 Introduction to Chemoinformatics Dr. Igor V. Tetko Helmholtz Zentrum München - German Research Center for Environmental Health (GmbH) Institute of Bioinformatics & Systems Biology (HMGU) Kyiv, 10 August
Lecture 16: Small Sample Size Problems (Covariance Estimation) Many thanks to Carlos Thomaz who authored the original version of these slides
 Many thanks to Carlos Thomaz who authored the original version of these slides") Lecture 16: Small Sample Size Problems (Covariance Estimation) Many thanks to Carlos Thomaz who authored the original version of these slides Intelligent Data Analysis and Probabilistic Inference Lecture
Lecture 16: Small Sample Size Problems (Covariance Estimation) Many thanks to Carlos Thomaz who authored the original version of these slides Intelligent Data Analysis and Probabilistic Inference Lecture
Problem Set 5 Question 1
 2.32 Problem Set 5 Question As discussed in class, drug discovery often involves screening large libraries of small molecules to identify those that have favorable interactions with a certain druggable
6.047 / Computational Biology: Genomes, Networks, Evolution Fall 2008
 MIT OpenCourseWare http://ocw.mit.edu 6.047 / 6.878 Computational Biology: Genomes, Networks, Evolution Fall 2008 For information about citing these materials or our Terms of Use, visit: http://ocw.mit.edu/terms.
COMBINATORIAL CHEMISTRY: CURRENT APPROACH
 COMBINATORIAL CHEMISTRY: CURRENT APPROACH Dwivedi A. 1, Sitoke A. 2, Joshi V. 3, Akhtar A.K. 4* and Chaturvedi M. 1, NRI Institute of Pharmaceutical Sciences, Bhopal, M.P.-India 2, SRM College of Pharmacy,
Multivariate Statistics Fundamentals Part 1: Rotation-based Techniques
 Multivariate Statistics Fundamentals Part 1: Rotation-based Techniques A reminded from a univariate statistics courses Population Class of things (What you want to learn about) Sample group representing
ECE 521. Lecture 11 (not on midterm material) 13 February K-means clustering, Dimensionality reduction
 13 February K-means clustering, Dimensionality reduction") ECE 521 Lecture 11 (not on midterm material) 13 February 2017 K-means clustering, Dimensionality reduction With thanks to Ruslan Salakhutdinov for an earlier version of the slides Overview K-means clustering
ECE 521 Lecture 11 (not on midterm material) 13 February 2017 K-means clustering, Dimensionality reduction With thanks to Ruslan Salakhutdinov for an earlier version of the slides Overview K-means clustering
An Introduction to Applied Multivariate Analysis with R
 ~ Snrinuer Brian Everitt Torsten Hathorn An Introduction to Applied Multivariate Analysis with R > Preface........................................................ vii 1 Multivariate Data and Multivariate
Unsupervised Learning: K- Means & PCA
 Unsupervised Learning: K- Means & PCA Unsupervised Learning Supervised learning used labeled data pairs (x, y) to learn a func>on f : X Y But, what if we don t have labels? No labels = unsupervised learning
profileanalysis Innovation with Integrity Quickly pinpointing and identifying potential biomarkers in Proteomics and Metabolomics research
 profileanalysis Quickly pinpointing and identifying potential biomarkers in Proteomics and Metabolomics research Innovation with Integrity Omics Research Biomarker Discovery Made Easy by ProfileAnalysis
Principal Components Analysis. Sargur Srihari University at Buffalo
 Principal Components Analysis Sargur Srihari University at Buffalo 1 Topics Projection Pursuit Methods Principal Components Examples of using PCA Graphical use of PCA Multidimensional Scaling Srihari 2
Data Mining in the Chemical Industry. Overview of presentation
 Data Mining in the Chemical Industry Glenn J. Myatt, Ph.D. Partner, Myatt & Johnson, Inc. glenn.myatt@gmail.com verview of presentation verview of the chemical industry Example of the pharmaceutical industry
Molecular descriptors and chemometrics: a powerful combined tool for pharmaceutical, toxicological and environmental problems.
 Molecular descriptors and chemometrics: a powerful combined tool for pharmaceutical, toxicological and environmental problems. Roberto Todeschini Milano Chemometrics and QSAR Research Group - Dept. of
Modeling Mutagenicity Status of a Diverse Set of Chemical Compounds by Envelope Methods
 Modeling Mutagenicity Status of a Diverse Set of Chemical Compounds by Envelope Methods Subho Majumdar School of Statistics, University of Minnesota Envelopes in Chemometrics August 4, 2014 1 / 23 Motivation
Clusters. Unsupervised Learning. Luc Anselin. Copyright 2017 by Luc Anselin, All Rights Reserved
 Clusters Unsupervised Learning Luc Anselin http://spatial.uchicago.edu 1 curse of dimensionality principal components multidimensional scaling classical clustering methods 2 Curse of Dimensionality 3 Curse
Principal Component Analysis-I Geog 210C Introduction to Spatial Data Analysis. Chris Funk. Lecture 17
 Principal Component Analysis-I Geog 210C Introduction to Spatial Data Analysis Chris Funk Lecture 17 Outline Filters and Rotations Generating co-varying random fields Translating co-varying fields into
Advances in Multi-parameter Optimisation Methods for de Novo Drug Design
 Advances in Multi-parameter Optimisation Methods for de Novo Drug Design Abstract Introduction A high quality drug must achieve a balance of physicochemical and ADME properties, safety and potency against
Principal Component Analysis
 I.T. Jolliffe Principal Component Analysis Second Edition With 28 Illustrations Springer Contents Preface to the Second Edition Preface to the First Edition Acknowledgments List of Figures List of Tables
Multivariate Analysis of Ecological Data using CANOCO
 Multivariate Analysis of Ecological Data using CANOCO JAN LEPS University of South Bohemia, and Czech Academy of Sciences, Czech Republic Universitats- uric! Lanttesbibiiothek Darmstadt Bibliothek Biologie
Molecular Biology: from sequence analysis to signal processing. University of Sao Paulo. Junior Barrera
 Molecular Biology: from sequence analysis to signal processing Junior Barrera University of Sao Paulo Layout Introduction Knowledge evolution in Genetics Data acquisition Data Analysis A system for genetic
Dimension Reduction and Classification Using PCA and Factor. Overview
 Dimension Reduction and Classification Using PCA and - A Short Overview Laboratory for Interdisciplinary Statistical Analysis Department of Statistics Virginia Tech http://www.stat.vt.edu/consult/ March
Prediction and Classif ication of Human G-protein Coupled Receptors Based on Support Vector Machines
 Article Prediction and Classif ication of Human G-protein Coupled Receptors Based on Support Vector Machines Yun-Fei Wang, Huan Chen, and Yan-Hong Zhou* Hubei Bioinformatics and Molecular Imaging Key Laboratory,
Multivariate analysis of genetic data: exploring groups diversity
 Multivariate analysis of genetic data: exploring groups diversity T. Jombart Imperial College London Bogota 01-12-2010 1/42 Outline Introduction Clustering algorithms Hierarchical clustering K-means Multivariate
PRINCIPAL COMPONENTS ANALYSIS
 121 CHAPTER 11 PRINCIPAL COMPONENTS ANALYSIS We now have the tools necessary to discuss one of the most important concepts in mathematical statistics: Principal Components Analysis (PCA). PCA involves
An Alternative Algorithm for Classification Based on Robust Mahalanobis Distance
 Dhaka Univ. J. Sci. 61(1): 81-85, 2013 (January) An Alternative Algorithm for Classification Based on Robust Mahalanobis Distance A. H. Sajib, A. Z. M. Shafiullah 1 and A. H. Sumon Department of Statistics,
The gpca Package for Identifying Batch Effects in High-Throughput Genomic Data
 The gpca Package for Identifying Batch Effects in High-Throughput Genomic Data Sarah Reese July 31, 2013 Batch effects are commonly observed systematic non-biological variation between groups of samples
Microarray data analysis
 Microarray data analysis September 20, 2006 Jonathan Pevsner, Ph.D. Introduction to Bioinformatics pevsner@kennedykrieger.org Johns Hopkins School of Public Health (260.602.01) Copyright notice Many of
Principal component analysis PCA. Kathleen Marchal Dept Plant Biotechnology and Bioinformatics Department information technology (INTEC)
") Principal component analysis PCA Kathleen Marchal Dept Plant Biotechnology and Bioinformatics Department information technology (INTEC) Overzicht lessen 26/02 13h biostat S3 emile clapeyron 07/03 ma 13
Principal component analysis PCA Kathleen Marchal Dept Plant Biotechnology and Bioinformatics Department information technology (INTEC) Overzicht lessen 26/02 13h biostat S3 emile clapeyron 07/03 ma 13
Cluster Analysis of Gene Expression Microarray Data. BIOL 495S/ CS 490B/ MATH 490B/ STAT 490B Introduction to Bioinformatics April 8, 2002
 Cluster Analysis of Gene Expression Microarray Data BIOL 495S/ CS 490B/ MATH 490B/ STAT 490B Introduction to Bioinformatics April 8, 2002 1 Data representations Data are relative measurements log 2 ( red
Multivariate Fundamentals: Rotation. Exploratory Factor Analysis
 Multivariate Fundamentals: Rotation Exploratory Factor Analysis PCA Analysis A Review Precipitation Temperature Ecosystems PCA Analysis with Spatial Data Proportion of variance explained Comp.1 + Comp.2
JMP Regression Model to Predict Tire Performance: Demo and Tutorial
 JMP Regression Model to Predict Tire Performance: Demo and Tutorial Leighton Spadone, DAAS Inc. Tire Technology and Statistical Consulting Avrohom.Spadone@Gmail.com Introduction: The International Mining
An Empirical Comparison of Dimensionality Reduction Methods for Classifying Gene and Protein Expression Datasets
 An Empirical Comparison of Dimensionality Reduction Methods for Classifying Gene and Protein Expression Datasets George Lee 1, Carlos Rodriguez 2, and Anant Madabhushi 1 1 Rutgers, The State University
A SAS/AF Application For Sample Size And Power Determination
 A SAS/AF Application For Sample Size And Power Determination Fiona Portwood, Software Product Services Ltd. Abstract When planning a study, such as a clinical trial or toxicology experiment, the choice