Ann M. Dillner, Travis Ruthenburg. UC Davis. IMPROVE Steering Committee Meeting, 2011
|
|
|
- Clifton Ferguson
- 6 years ago
- Views:
Transcription
1 FT-IR: a promising method for checking consistency between Teflon and quartz channels and measuring OM on IMPROVE samples Ann M. Dillner, Travis Ruthenburg UC Davis IMPROVE Steering Committee Meeting, 2011
2 Consistency between IMPROVE sampling modules Consistency checks identify issues: Swaps of filter Sampling/handling problems Teflon and nylon modules comparison for sulfur and sulfate Teflon and quartz modules PESA on Teflon measures total hydrogen Subtract NH 4 assuming fully neutralized sulfate Makes Teflon filters brittle, sometimes tear Prefer non-destructive method does not require fully neutralized assumption
3 OM on IMPROVE samples Organic mass (OM) includes carbon, oxygen, hydrogen, nitrogen and sulfur OM used in estimating visibility from PM Current method for estimating OM OM = (Measured OC) X (OM/OC) OM/OC value applied to all samples in network IMPROVE currently using 1.8 (used to use 1.4) CSN proposing to use 1.4 Prefer method that measures OM or OM/OC on each filter rather than assuming an OM/OC
4 Fourier Transform Infrared (FT-IR) Spectroscopy Non-destructive Quantifies organic functional groups OC mass use for Teflon/quartz consistency checks Sum of functional groups = OM Calculate OM/OC per sample aliphatic C-H aromatic C-H carbonyl (C=O) alcohol (O-H) carboxylic acids organosulfate organonitrate amines
5 FT-IR - limitations Not organic compound specific (i.e., levoglucosan) No one has quantified graphitic carbon in particulate matter Interferants Teflon filter material Ammonium

6 FT-IR analysis of Teflon filters Russell et al., PNAS (2011)
7 Simple Proof of Concept Analysis - IMPROVE samples 1. Does analysis provide reasonable results for OC across range of IMPROVE samples? 2. Can interferants be accounted for successfully? 3. Do samples exhibit differences that show variability in OM/OC?
8 Method Analyzed 136 IMPROVE Teflon filters from three sites + 10 field blanks Identified functional groups in spectra Subtracted ammonium from O-H and C-H region of the spectra Used peaks areas for C=O and C-H functional groups and %C in group to estimate absorbance for OC and compare to TOR OC (C=O + C-H)/C-H surrogate for OM/OC
9 IMPROVE samples Three sites - OLYM, PMRF, SAMA (map) Spring, summer, fall, 2010 Sample data: goc ( g/m 3 ) 10 th %ile 99 th %ile in network Sulfate: g ( g/m 3 ) >90 th %ile EC/OC:
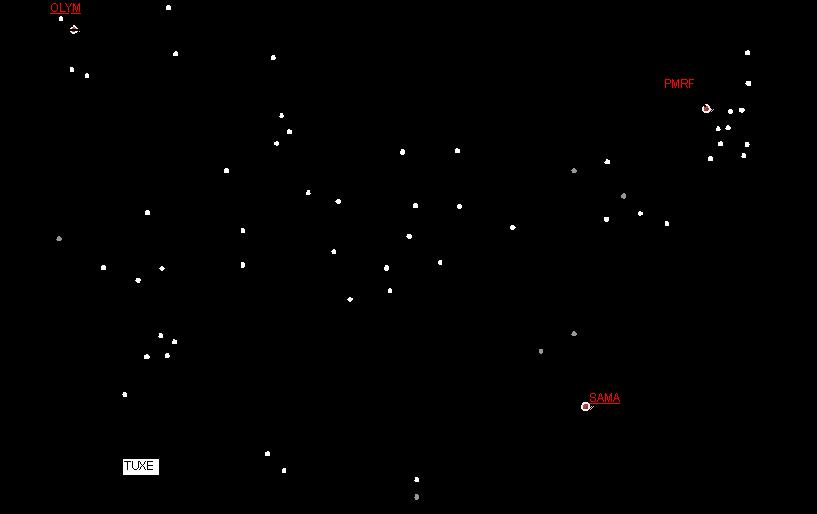
10
11 Example IR Spectra SAMA 11/19/2010
12 1. IMPROVE range FT-IR calibration will enable comparison of carbon masses
13 Consistency checking OC absorbance from FT-IR vs TOR OC OM from PESA vs OM from TOR FT-IR calibration will enable comparison of carbon masses OM from PESA = 13.75*(H-S/4)
14 2. Interferants ammonium, Teflon Ammonium absorbs in OH and CH region of spectra two methods to remove Teflon Subtract scaled ammonium sulfate spectra (Russell et al.) Include in calibration (Coury and Dillner) exclude region from calibration (Russell and Dillner groups) pre-scan Teflon and subtract from post-scan
15 3. Un-calibrated FT-IR proxy for OM/OC
16 Calibration method development to date Created di-carboxylic acid standards 5 acids of varying length Mixtures of acids Range of masses on filters Evaluated two calibration algorithms Peak area absorbance vs. mass Partial Least Squares Regression
17 FT-IR absorbance vs. mass by functional group Sebacic Acid 10 carbon dicarboxylic acid

18 Plans for coming year to further develop method Create more standards Functional groups Range of masses (low) Mixtures Evaluate/test algorithms Determine if pre-scan provides useful info. Analyze IMPROVE samples Impact of XRF on OC System for generating organic standards
19 Longer term plans Continue calibration method development Develop low cost auto-sampler for standards Test calibration method on: Laboratory generated filters well characterized lab-generated SOA samples Ambient samples Continue to analyze IMPROVE samples Compare to PESA and TOR
20 Feasibility of applying FT-IR analysis to network Automation of IMPROVE filter analysis Considered in current automation of XRF and weighing One instrument can handle all IMPROVE filters Automation/QC of data analysis To be developed after standards and algorithm established Possible new archiving method (cold?) Staff person to run samples/analyze data
21 Summary FT-IR analysis of Teflon filters useful for IMPROVE Consistency check with quartz channel OM/OC per filter Functional group information sources Non-destructive to Teflon filters Cost PESA Feasible to physically integrate into existing filter analyses at CNL
IMPROVE Sampling & Analysis: Evaluation & Development
 IMPROVE Sampling & Analysis: Evaluation & Development Chuck McDade Crocker Nuclear Laboratory University of California, Davis Okefenokee, Georgia October 2008 AEROSOL GENERATION CHAMBER Selected Species
HIPS data are now reported with a consistent calibration (2003 present) what do they say?
 what do they say?") HIPS data are now reported with a consistent calibration (2003 present) So what do they say? Well, Fabs correlates well with EC (!!), as seen below with site-year means. Each point shows the arithmetic
HIPS data are now reported with a consistent calibration (2003 present) So what do they say? Well, Fabs correlates well with EC (!!), as seen below with site-year means. Each point shows the arithmetic
Supplemental Material for Elemental Composition and Oxidation of Chamber Organic Aerosol
 Supplemental Material for Elemental Composition and Oxidation of Chamber Organic Aerosol P. S. Chhabra 1,N.L.Ng 2, M. R. Canagaratna 2, A. L. Corrigan 3, L. M. Russell 3, D. R. Worsnop 2, R. C. Flagan
Infrared Spectroscopy
 Infrared Spectroscopy Introduction Spectroscopy is an analytical technique which helps determine structure. It destroys little or no sample. The amount of light absorbed by the sample is measured as wavelength
Chapter 12 Mass Spectrometry and Infrared Spectroscopy
 Organic Chemistry, 6 th Edition L. G. Wade, Jr. Chapter 12 Mass Spectrometry and Infrared Spectroscopy Jo Blackburn Richland College, Dallas, TX Dallas County Community College District 2006, Prentice
DOCUMENT HISTORY. Initials Section/s Modified Brief Description of Modifications
 Page 2 of 13 DOCUMENT HISTORY Date Modified Initials Section/s Modified Brief Description of Modifications Page 3 of 13 Table of Contents 1. Purpose and Applicability... 4 2. Definitions... 4 3. Procedures...
Infrared Spectroscopy
 Infrared Spectroscopy IR Spectroscopy Used to identify organic compounds IR spectroscopy provides a 100% identification if the spectrum is matched. If not, IR at least provides information about the types
1.1. IR is part of electromagnetic spectrum between visible and microwave
 CH2SWK 44/6416 IR Spectroscopy 2013Feb5 1 1. Theory and properties 1.1. IR is part of electromagnetic spectrum between visible and microwave 1.2. 4000 to 400 cm -1 (wave numbers) most interesting to organic
How to Interpret an Infrared (IR) Spectrum
 Spectrum") How to Interpret an Infrared (IR) Spectrum Infrared (IR) Spectroscopy allows the identification of particular bonds present within molecules. In this class we have simplified IR analysis by only focusing
How to Interpret an Infrared (IR) Spectrum Infrared (IR) Spectroscopy allows the identification of particular bonds present within molecules. In this class we have simplified IR analysis by only focusing
More information can be found in Chapter 12 in your textbook for CHEM 3750/ 3770 and on pages in your laboratory manual.
 CHEM 3780 rganic Chemistry II Infrared Spectroscopy and Mass Spectrometry Review More information can be found in Chapter 12 in your textbook for CHEM 3750/ 3770 and on pages 13-28 in your laboratory manual.
Lecture 11. IR Theory. Next Class: Lecture Problem 4 due Thin-Layer Chromatography
 Lecture 11 IR Theory Next Class: Lecture Problem 4 due Thin-Layer Chromatography This Week In Lab: Ch 6: Procedures 2 & 3 Procedure 4 (outside of lab) Next Week in Lab: Ch 7: PreLab Due Quiz 4 Ch 5 Final
Structure Determination. How to determine what compound that you have? One way to determine compound is to get an elemental analysis
 Structure Determination How to determine what compound that you have? ne way to determine compound is to get an elemental analysis -basically burn the compound to determine %C, %H, %, etc. from these percentages
ARTICLE IN PRESS. Journal of Aerosol Science
 Journal of Aerosol Science 41 (2010) 99 107 Contents lists available at ScienceDirect Journal of Aerosol Science journal homepage: www.elsevier.com/locate/jaerosci Use of proton backscattering to determine
Summary of Recent Work on the Fragmentation Table & Oven Aerodyne
 Summary of Recent Work on the Fragmentation Table & Oven Temperature @ Aerodyne Tim Onasch - Aerodyne Boulder AMS Users Mini Meeting University of Colorado March 9-, 23 Fragmentation Waves AMS Users Meeting
Review of the IMPROVE Equation for Estimating Ambient Light Extinction
 Review of the IMPROVE Equation for Estimating Ambient Light Extinction Jenny Hand 1 Bill Malm 2 1 CIRA, Colorado State University 2 National Park Service OUTLINE Introduction Sampling Biases Chemical forms
Application of IR Raman Spectroscopy
 Application of IR Raman Spectroscopy 3 IR regions Structure and Functional Group Absorption IR Reflection IR Photoacoustic IR IR Emission Micro 10-1 Mid-IR Mid-IR absorption Samples Placed in cell (salt)
ORGANIC - BROWN 8E CH INFRARED SPECTROSCOPY.
 !! www.clutchprep.com CONCEPT: PURPOSE OF ANALYTICAL TECHNIQUES Classical Methods (Wet Chemistry): Chemists needed to run dozens of chemical reactions to determine the type of molecules in a compound.
SDBS Integrated Spectral Database for Organic Compounds
 SDBS Integrated Spectral Database for Organic Compounds Sample Search for Chemistry 130 Grace Baysinger and Dr. Dave Keller SDBS URL and Description http://riodb01.ibase.aist.go.jp/sdbs/cgi-bin/cre_index.cgi?lang=eng
CHEM 3760 Orgo I, F14 (Lab #11) (TECH 710)
 (TECH 710)") CHEM 3760 Orgo I, F14 (Lab #11) (TECH 710) Identification of an Unknown by IR PRELAB (PreLab is due before entering the lab.) Every student has to prepare for each experiment by answering the Pre-Laboratory
CHEM 3760 Orgo I, F14 (Lab #11) (TECH 710) Identification of an Unknown by IR PRELAB (PreLab is due before entering the lab.) Every student has to prepare for each experiment by answering the Pre-Laboratory
Infrared Spectroscopy: Identification of Unknown Substances
 Infrared Spectroscopy: Identification of Unknown Substances Suppose a white powder is one of the four following molecules. How can they be differentiated? H N N H H H H Na H H H H H A technique that is
Advanced Pharmaceutical Analysis
 Lecture 2 Advanced Pharmaceutical Analysis IR spectroscopy Dr. Baraa Ramzi Infrared Spectroscopy It is a powerful tool for identifying pure organic and inorganic compounds. Every molecular compound has
(2) Read each statement carefully and pick the one that is incorrect in its information.
 Read each statement carefully and pick the one that is incorrect in its information.") Organic Chemistry - Problem Drill 17: IR and Mass Spectra No. 1 of 10 1. Which statement about infrared spectroscopy is incorrect? (A) IR spectroscopy is a method of structure determination based on the
Organic Chemistry - Problem Drill 17: IR and Mass Spectra No. 1 of 10 1. Which statement about infrared spectroscopy is incorrect? (A) IR spectroscopy is a method of structure determination based on the
Lab 4 Major Anions In Atmospheric Aerosol Particles
 Georgia Institute of Technology School of Earth and Atmospheric Sciences EAS 4641 Spring 2008 Lab 4 Major Anions In Atmospheric Aerosol Particles Purpose of Lab 4: This experiment will involve determining
ORGANIC - BRUICE 8E CH MASS SPECT AND INFRARED SPECTROSCOPY
 !! www.clutchprep.com CONCEPT: PURPOSE OF ANALYTICAL TECHNIQUES Classical Methods (Wet Chemistry): Chemists needed to run dozens of chemical reactions to determine the type of molecules in a compound.
Chapter 19. Molecules and Compounds
 Chapter 19 Molecules and Compounds 1 Mini Quiz Which elements will react with water the same way that Na does? A. Ar B. B C. Cl D. K E. Mg 2 Another Which of the following has the highest ionization energy?
Infrared Spectroscopy: How to use the 5 zone approach to identify functional groups
 Infrared Spectroscopy: How to use the 5 zone approach to identify functional groups Definition: Infrared Spectroscopy is the study of the Infrared Spectrum. An Infrared Spectrum is the plot of photon energy
Chapter 3. Infrared Reflectance Spectra of Tholins
 3-1 Chapter 3. Infrared Reflectance Spectra of Tholins at Cryogenic Temperatures 3.1. Introduction Infrared spectroscopy is one of the cornerstone techniques for molecular structure determination. Because
Symmetric Stretch: allows molecule to move through space
 BACKGROUND INFORMATION Infrared Spectroscopy Before introducing the subject of IR spectroscopy, we must first review some aspects of the electromagnetic spectrum. The electromagnetic spectrum is composed
1 Which of the following cannot be used to detect alcohol in a breathalyser test? Fractional distillation. Fuel cell. Infrared spectroscopy
 1 Which of the following cannot be used to detect alcohol in a breathalyser test? Fractional distillation Fuel cell Infrared spectroscopy Reduction of dichromate(vi) ions 2 Propanal, H 3 H 2 HO, and propanone,
Experiment 11: NUCLEAR MAGNETIC RESONANCE SPECTROSCOPY
 Experiment 11: NUCLEAR MAGNETIC RESONANCE SPECTROSCOPY Purpose: This is an exercise to introduce the use of nuclear magnetic resonance spectroscopy, in conjunction with infrared spectroscopy, to determine
Describing oxidation of organics
 Describing oxidation of organics using the AMS Jesse Kroll, Doug Worsnop, Chuck Kolb, Sean Kessler, Jose Jimenez, Allison Aiken, Pete DeCarlo, Neil Donahue, Kevin Wilson, Jared Smith, Tim Onasch, Manjula
Chapter 20: Identification of Compounds
 Chemists are frequently faced with the problem of identifying unknown compounds. Environmental scientists may have to identify pollutants in soils and water, synthetic chemists may want to confirm that
CHEM 241 UNIT 5: PART A DETERMINATION OF ORGANIC STRUCTURES BY SPECTROSCOPIC METHODS [MASS SPECTROMETRY]
![CHEM 241 UNIT 5: PART A DETERMINATION OF ORGANIC STRUCTURES BY SPECTROSCOPIC METHODS [MASS SPECTROMETRY]](/thumbs/83/88348834.jpg "CHEM 241 UNIT 5: PART A DETERMINATION OF ORGANIC STRUCTURES BY SPECTROSCOPIC METHODS [MASS SPECTROMETRY]") CHEM 241 UNIT 5: PART A DETERMINATION OF ORGANIC STRUCTURES BY SPECTROSCOPIC METHODS [MASS SPECTROMETRY] 1 Introduction Outline Mass spectrometry (MS) 2 INTRODUCTION The analysis of the outcome of a reaction
CHEM 241 UNIT 5: PART A DETERMINATION OF ORGANIC STRUCTURES BY SPECTROSCOPIC METHODS [MASS SPECTROMETRY] 1 Introduction Outline Mass spectrometry (MS) 2 INTRODUCTION The analysis of the outcome of a reaction
Introduction. The analysis of the outcome of a reaction requires that we know the full structure of the products as well as the reactants
 Introduction The analysis of the outcome of a reaction requires that we know the full structure of the products as well as the reactants Spectroscopy and the Electromagnetic Spectrum Unlike mass spectrometry,
Química Orgânica I. Ciências Farmacêuticas Bioquímica Química. IR spectroscopy AFB QO I 2007/08 1 AFB QO I 2007/08 2
 Química Orgânica I Ciências Farmacêuticas Bioquímica Química AFB QO I 2007/08 1 IR spectroscopy AFB QO I 2007/08 2 1 Adaptado de: Organic Chemistry, 6th Edition; L. G. Wade, Jr. Organic Chemistry, William
Radiant energy is proportional to its frequency (cycles/s = Hz) as a wave (Amplitude is its height) Different types are classified by frequency or
 as a wave (Amplitude is its height) Different types are classified by frequency or") CHEM 241 UNIT 5: PART B INFRA-RED RED SPECTROSCOPY 1 Spectroscopy of the Electromagnetic Spectrum Radiant energy is proportional to its frequency (cycles/s = Hz) as a wave (Amplitude is its height) Different
CHEM 241 UNIT 5: PART B INFRA-RED RED SPECTROSCOPY 1 Spectroscopy of the Electromagnetic Spectrum Radiant energy is proportional to its frequency (cycles/s = Hz) as a wave (Amplitude is its height) Different
C h a p t e r F o u r t e e n: Structure Determination: Mass Spectrometry and Infrared Spectroscopy
 C h a p t e r F o u r t e e n: Structure Determination: Mass Spectrometry and Infrared Spectroscopy Cl OH Cl An electron ionization mass spectrum of 2,5-dichlorophenol CHM 323: Summary of Important Concepts
Table 8.2 Detailed Table of Characteristic Infrared Absorption Frequencies
 Table 8.2 Detailed Table of Characteristic Infrared Absorption Frequencies The hydrogen stretch region (3600 2500 cm 1 ). Absorption in this region is associated with the stretching vibration of hydrogen
EXPT. 7 CHARACTERISATION OF FUNCTIONAL GROUPS USING IR SPECTROSCOPY
 EXPT. 7 CHARACTERISATION OF FUNCTIONAL GROUPS USING IR SPECTROSCOPY Structure 7.1 Introduction Objectives 7.2 Principle 7.3 Requirements 7.4 Strategy for the Interpretation of IR Spectra 7.5 Practice Problems
CHEM 3760 Orgo I, S12, Exp 5 (Lab #6) (TECH 710: IR Unknown)
 (TECH 710: IR Unknown)") CHEM 3760 rgo I, S12, Exp 5 (Lab #6) (TECH 710: IR Unknown) LAB REPRT ISTRUCTIS Identifying an Unknown Compound by Infrared Spectroscopy (IR) Carefully read all instructions and complete Section I on page
CHEM 3760 rgo I, S12, Exp 5 (Lab #6) (TECH 710: IR Unknown) LAB REPRT ISTRUCTIS Identifying an Unknown Compound by Infrared Spectroscopy (IR) Carefully read all instructions and complete Section I on page
PAPER No.12 :Organic Spectroscopy MODULE No.29: Combined problem on UV, IR, 1 H NMR, 13 C NMR and Mass - Part I
 Subject Chemistry Paper No and Title Module No and Title Module Tag 12: rganic Spectroscopy 29: Combined problem on UV, IR, 1 H NMR, 13 C NMR and Mass - Part I CHE_P12_M29 TABLE F CNTENTS 1. Learning utcomes
CHEM 109A Organic Chemistry
 CHEM 109A Organic Chemistry https://labs.chem.ucsb.edu/zakarian/armen/courses.html Chapter 2 Acids and Bases Central to Understanding Organic Chemistry Draw the conjugate acid of each of the following:
Mole Concept. Conversion Factors:
 Today s focus. Mole Concept Avogadro s Number is 6.02x10 23 The mole unit is used to express: 1. A mass quantity 2. A counting quantity 1 water molecule 1 mole of water molecules Conversion Factors: 6.02x10
Supporting Information to
 Supporting Information to 'Bisulfide reaction with natural organic matter enhances arsenite sorption: Insights from X-ray absorption spectroscopy' Martin Hoffmann, Christian Mikutta* and Ruben Kretzschmar
PAPER No.12 :Organic Spectroscopy MODULE No.30: Combined problem on UV, IR, 1 H NMR, 13 C NMR and Mass - Part II
 Subject Chemistry Paper No and Title Module No and Title Module Tag 12 : rganic Spectroscopy 30: Combined problem on UV, IR, 1 H NMR, 13 C NMR and Mass Part-II CHE_P12_M30 TABLE F CNTENTS 1. Learning utcomes
Switching to OCR A from Pearson (Edexcel)
") Switching to OCR A from Pearson (Edexcel) The content within the OCR Chemistry A specification covers the key concepts of chemistry and will be very familiar. We ve laid it out in a logical progression
Switching to OCR A from Pearson (Edexcel) The content within the OCR Chemistry A specification covers the key concepts of chemistry and will be very familiar. We ve laid it out in a logical progression
UNIT 4 REVISION CHECKLIST CHEM 4 AS Chemistry
 UNIT 4 REVISION CHECKLIST CHEM 4 AS Chemistry Topic 4.1 Kinetics a) Define the terms: rate of a reaction, rate constant, order of reaction and overall order of reaction b) Deduce the orders of reaction
SPECTROSCOPY MEASURES THE INTERACTION BETWEEN LIGHT AND MATTER
 SPECTROSCOPY MEASURES THE INTERACTION BETWEEN LIGHT AND MATTER c = c: speed of light 3.00 x 10 8 m/s (lamda): wavelength (m) (nu): frequency (Hz) Increasing E (J) Increasing (Hz) E = h h - Planck s constant
Figure 3.11 Raman Spectroscopy
 Instrumentation 381 Figure 3.11 An example of portable FTIR instrumentation is the HazMatID Ranger (www. smithsdetection.com). (Image courtesy of Smiths Detection.) Raman Spectroscopy Instruments using
1901 Application of Spectrophotometry
 1901 Application of Spectrophotometry Chemical Analysis Problem: 1 Application of Spectroscopy Organic Compounds Organic compounds with single bonds absorb in the UV region because electrons from single
Experiment 1. Lab Safety & IR Spectroscopy
 Experiment 1 Lab Safety & IR Spectroscopy Reading: Handbook for Organic Chemistry Lab, section on Lab Safety (Chapter 1) and IR Spectroscopy (Chapter 16). Organic Chemistry by Marc Loudon, 6th ed., pp.
CHM Salicylic Acid Properties (r16) 1/11
 1/11") CHM 111 - Salicylic Acid Properties (r16) 1/11 Purpose In this lab, you will perform several tests to attempt to confirm the identity and assess the purity of the substance you synthesized in last week's
CHM 111 - Salicylic Acid Properties (r16) 1/11 Purpose In this lab, you will perform several tests to attempt to confirm the identity and assess the purity of the substance you synthesized in last week's
CHEM Chapter 13. Nuclear Magnetic Spectroscopy (Homework) W
 W") CHEM 2423. Chapter 13. Nuclear Magnetic Spectroscopy (Homework) W Short Answer 1. For a nucleus to exhibit the nuclear magnetic resonance phenomenon, it must be magnetic. Magnetic nuclei include: a. all
CHEM 2423. Chapter 13. Nuclear Magnetic Spectroscopy (Homework) W Short Answer 1. For a nucleus to exhibit the nuclear magnetic resonance phenomenon, it must be magnetic. Magnetic nuclei include: a. all
FTIR measurement of NH 3, HCN, SO 2, H 2 S and COS in pulverized lignite oxy-fuel flames Daniel Fleig, Stefan Hjärtstam and Daniel Kühnemuth
 FTIR measurement of NH 3, HCN, SO 2, H 2 S and COS in pulverized lignite oxy-fuel flames Daniel Fleig, Stefan Hjärtstam and Daniel Kühnemuth Abstract Nitrogen and sulphur compounds are investigated in
IB Topics 1 & 11 Multiple Choice Practice
 IB Topics 1 & 11 Multiple Choice Practice 1. How many atoms of nitrogen are there in 0.50 mol of (NH 4) 2CO 3? 1 2 3.01 10 23 6.02 10 23 2. What is the value of x when 32.2 g of Na 2SO 4 xh 2O are heated
6.5 Interrelationships of Fine Mass, Sulfur and Absorption Daily Scatter Plots Shenandoah National Park
 TABLE OF CONTENTS Chapter Page OVERVIEW AND SUMMARY S-1 S.1 Optical and Aerosol Data S-1 S.2 Spatial and Seasonal Distribution of Aerosol Concentration and S-4 Chemical Composition S.3 Light Extinction
EXPT. 9 DETERMINATION OF THE STRUCTURE OF AN ORGANIC COMPOUND USING UV, IR, NMR AND MASS SPECTRA
 EXPT. 9 DETERMINATION OF THE STRUCTURE OF AN ORGANIC COMPOUND USING UV, IR, NMR AND MASS SPECTRA Structure 9.1 Introduction Objectives 9.2 Principle 9.3 Requirements 9.4 Strategy for the Structure Elucidation
CHEM 3.2 (AS91388) 3 credits. Demonstrate understanding of spectroscopic data in chemistry
 3 credits. Demonstrate understanding of spectroscopic data in chemistry") CHEM 3.2 (AS91388) 3 credits Demonstrate understanding of spectroscopic data in chemistry Spectroscopic data is limited to mass, infrared (IR) and 13 C nuclear magnetic resonance (NMR) spectroscopy. Organic
CHEM 3.2 (AS91388) 3 credits Demonstrate understanding of spectroscopic data in chemistry Spectroscopic data is limited to mass, infrared (IR) and 13 C nuclear magnetic resonance (NMR) spectroscopy. Organic
Organic composition of single and submicron particles in different regions of western North America and the eastern Pacific during INTEX-B 2006
 Atmos. Chem. Phys., 9, 5433 5446, 29 www.atmos-chem-phys.net/9/5433/29/ Author(s) 29. This work is distributed under the Creative Commons Attribution 3. License. Atmospheric Chemistry and Physics Organic
MOLECULAR REPRESENTATIONS AND INFRARED SPECTROSCOPY
 MOLEULAR REPRESENTATIONS AND INFRARED SPETROSOPY A STUDENT SOULD BE ABLE TO: 1. Given a Lewis (dash or dot), condensed, bond-line, or wedge formula of a compound draw the other representations. 2. Give
Massachusetts Institute of Technology Organic Chemistry Hour Exam #1. Name. Official Recitation Instructor
 Massachusetts Institute of Technology rganic Chemistry. Friday, September 0, 00 Prof. Timothy F. Jamison Hour Exam # Name (please both print and sign your name) fficial Recitation Instructor Directions:
Look for absorption bands in decreasing order of importance:
 1. Match the following to their IR spectra (30 points) Look for absorption bands in decreasing order of importance: a e a 2941 1716 d f b 3333 c b 1466 1.the - absorption(s) between 3100 and 2850 cm-1.
CHAPTER 7 AEROSOL ACIDITY
 CHAPTER 7 AEROSOL ACIDITY It has been established by a number of investigators, that especially during the summer, aerosols along the coast of Washington are commonly acidic. 1-2 Although the measurements
12. Structure Determination: Mass Spectrometry and Infrared Spectroscopy
 12. Structure Determination: Mass Spectrometry and Infrared Spectroscopy Determining the Structure of an Organic Compound The analysis of the outcome of a reaction requires that we know the full structure
Fine Particles: Why We Care
 Fine Particles: Why We Care Visibility/Radiative Forcing Health Effects A function of chemical composition PM2.5 Mostly 1) Sulfate 2) Carbonaceous - Organic - Elemental (Soot) 3) Metals, minerals, Metals,
Supporting Information
 Supporting Information Han et al. 10.1073/pnas.1212690110 SI Materials and Methods Aging of Soot by O 3. Soot particles were deposited on the ZnSe crystal. The sample in the in situ reactor was purged
GCE AS/A level 1092/01 CHEMISTRY CH2
 Surname Centre Number Candidate Number Other Names 2 GCE AS/A level 1092/01 CHEMISTRY CH2 S15-1092-01 P.M. TUESDAY, 2 June 2015 1 hour 30 minutes For s use Question Maximum Mark Mark Awarded Section A
The Final Learning Experience
 Chemistry 416 Spectroscopy Fall Semester 1997 Dr. Rainer Glaser The Final Learning Experience Monday, December 15, 1997 3:00-5:00 pm Name: Answer Key Maximum Question 1 (Combination I) 20 Question 2 (Combination
Infrared Spectroscopy
 x-rays ultraviolet (UV) visible Infrared (I) microwaves radiowaves near I middle I far I λ (cm) 8 x 10⁻⁵ 2.5 x 10⁻⁴ 2.5 x 10⁻³ 2.5 x 10⁻² µ 0.8 2.5 25 250 ν (cm -1 ) 13,000 4,000 400 40 ν (cm -1 1 ) =
For more information about how to cite these materials visit
 Author(s): MELO 3D Project Team, 2012 License: Unless otherwise noted, this material is made available under the terms of the Creative Commons Attribution Share-Alike 3.0 License: http://creativecommons.org/licenses/by-sa/2.0/
Paper 12: Organic Spectroscopy
 Subject Chemistry Paper No and Title Module No and Title Module Tag Paper 12: Organic Spectroscopy 31: Combined problem on UV, IR, 1 H NMR, 13 C NMR and Mass - Part III CHE_P12_M31 TABLE OF CONTENTS 1.
Topic 2.11 ANALYTICAL TECHNIQUES. High Resolution Mass Spectrometry Infra-red Spectroscopy
 Topic 2.11 ANALYTICAL TECHNIQUES High Resolution Mass Spectrometry Infra-red Spectroscopy HIGH RESOLUTION MASS SPECTROMETRY The technique of mass spectrometry was used in Unit 1 to: a) determine the relative
Exemplar for Internal Achievement Standard. Chemistry Level 3
 Exemplar for Internal Achievement Standard Chemistry Level 3 This exemplar supports assessment against: Achievement Standard 91388 Demonstrate understanding of spectroscopic data in chemistry. An annotated
Lecture 10. More Aromatics. February 18, Chemistry 328N
 Lecture 10 More Aromatics February 18, 2016 eterocyclic Aromatic Compounds N N O S Pyridine Pyrrole Furan Thiophene ückel and Pyridine ückel and Pyrrole uckel and Furan Recognizing Aromatic Compounds Be
AOAC Official Method 2016.xx. Determination of Total Sulfur in Fertilizers by High Temperature Combustion
 AOAC Official Method 2016.xx Determination of Total Sulfur in Fertilizers by High Temperature Combustion Proposed First Action 2015 (Applicable for measuring total sulfur concentration in solid and liquid
Paper 12: Organic Spectroscopy
 Subject hemistry Paper No and Title Module No and Title Module Tag Paper 12: Organic Spectroscopy 34: ombined problem on UV, IR, 1 H NMR, 13 NMR and Mass- Part 6 HE_P12_M34 TABLE OF ONTENTS 1. Learning
ORGANIC - EGE 5E CH UV AND INFRARED MASS SPECTROMETRY
 !! www.clutchprep.com CONCEPT: IR SPECTROSCOPY- FREQUENCIES There are specific absorption frequencies in the functional group region that we should be familiar with EXAMPLE: What are the major IR absorptions
Lab #6: CARBOXYLIC ACIDS LAB
 lab Lab #6: CARBOXYLIC ACIDS LAB Name PART I: Preparation of Carboxylic Acids (a) Oxidation of an Aldehyde by Oxygen from the Air: Benzaldehyde is an aromatic aldehyde with a familiar odor. On a clean,
Atmospheric Environment
 Atmospheric Environment 43 (2009) 940 948 Contents lists available at ScienceDirect Atmospheric Environment journal homepage: www.elsevier.com/locate/atmosenv ATR-FTIR characterization of organic functional
Ch. 9 Atomic Absorption & Atomic Fluorescence Spectrometry
 Ch. 9 Atomic Absorption & Atomic Fluorescence Spectrometry 9.1 9A. Atomization Most fundamental for both techniques. Typical types 1. flame - burner type 2. Electrothermal graphite furnace 3. Specialized
EXPERIMENT 1: Survival Organic Chemistry: Molecular Models
 EXPERIMENT 1: Survival Organic Chemistry: Molecular Models Introduction: The goal in this laboratory experience is for you to easily and quickly move between empirical formulas, molecular formulas, condensed
Naming Organic Halides. Properties of Organic Halides
 Organic Compounds Organic Halides A hydrocarbon in which one or more hydrogen atoms have been replaced by halogen atoms Freons (chlorofluorocarbons) in refrigeration and air conditioning Teflon (polytetrafluoroethane)
Using NMR and IR Spectroscopy to Determine Structures Dr. Carl Hoeger, UCSD
 Using NMR and IR Spectroscopy to Determine Structures Dr. Carl Hoeger, UCSD The following guidelines should be helpful in assigning a structure from NMR (both PMR and CMR) and IR data. At the end of this
SCH 4U Unit Test Forces and Molecular Properties. 1. Fill in each table as done on the assignment. Including the oxidation state of the central atom:
 CH 4U Unit Test Forces and Molecular Properties Name: 1. Fill in each table as done on the assignment. Including the oxidation state of the central atom: BO 3 3- total # of e - pairs σ bonding pairs lone
Identification of functional groups in the unknown Will take in lab today
 Qualitative Analysis of Unknown Compounds 1. Infrared Spectroscopy Identification of functional groups in the unknown Will take in lab today 2. Elemental Analysis Determination of the Empirical Formula
Closed book exam, no books, notebooks, notes, etc. allowed. However, calculators, rulers, and molecular model sets are permitted.
 Massachusetts Institute of Technology Organic Chemistry 5.13 Friday, September 26, 2003 Prof. Timothy F. Jamison Hour Exam #1 Name (please both print and sign your name) Official Recitation Instructor
atomic absorption spectroscopy general can be portable and used in-situ preserves sample simpler and less expensive
 Chapter 9: End-of-Chapter Solutions 1. The following comparison provides general trends, but both atomic absorption spectroscopy (AAS) and atomic absorption spectroscopy (AES) will have analyte-specific
Chapter 3 Stoichiometry
 Chapter 3 Sep 22 1:45 PM Average atomic mass: The weighted average of all isotopes of a specific element. Takes into consideration abundance of each isotope. (% x M 1 ) + (% x M 2 ) +... Sep 22 1:45 PM
Infrared Spectroscopy. Provides information about the vibraions of functional groups in a molecule
 Infrared Spectroscopy Provides information about the vibraions of functional groups in a molecule Therefore, the functional groups present in a molecule can be deduced from an IR spectrum Two important
Scanning Electron Microscopy (SEM) with Energy Dispersive Spectroscopy (EDS) Analysis The samples were also characterized by scanning electron
 with Energy Dispersive Spectroscopy (EDS) Analysis The samples were also characterized by scanning electron") Electronic Supplementary Material (ESI) for RSC Advances. This journal is The Royal Society of Chemistry 2016 Scanning Electron Microscopy (SEM) with Energy Dispersive Spectroscopy (EDS) Analysis The samples
Electronic Supplementary Material (ESI) for RSC Advances. This journal is The Royal Society of Chemistry 2016 Scanning Electron Microscopy (SEM) with Energy Dispersive Spectroscopy (EDS) Analysis The samples
Preparation of Series Schiff Bases and Studying of their Liquid Crystalline Behavior
 Preparation of Series Schiff Bases and Studying of their Liquid Crystalline Behavior Dr. Kareem Jaber 1 1 Assistant Professor, Department of Chemistry, Faculty of Science. Email: karee2000@hotmail.com
AMS CE for Chamber SOA
 AMS CE for Chamber SOA Ken Docherty et al. Alion Science & Technology and NERL, EPA 1 Alion Science and Technology, P.O. Box 12313, Research Triangle Park, NC 27713 2 Cooperative Institute for Research
Doctor of Philosophy
 STUDIES ON THE CORROSION INHIBITION BEHAVIOUR OF SOME AMINO ACID SURFACTANT ADDITIVES ABSTRACT SUBMITTED FOR THE AWARD OF THE DEGREE OF Doctor of Philosophy IN APPLIED CHEMISTRY By MOSARRAT PARVEEN UNDER
Supporting Information
 Supporting Information Three-dimensional frameworks of cubic (NH 4 ) 5 Ga 4 SbS 10, (NH 4 ) 4 Ga 4 SbS 9 (OH) H 2 O, and (NH 4 ) 3 Ga 4 SbS 9 (OH 2 ) 2H 2 O. Joshua L. Mertz, Nan Ding, and Mercouri G.
Qualitative Analysis of Unknown Compounds
 Qualitative Analysis of Unknown Compounds 1. Infrared Spectroscopy Identification of functional groups in the unknown All functional groups are fair game (but no anhydride or acid halides, no alkenes or
Real-time ppb CO 2 Impurity Detection by an Advanced FTIR- UVF System
 Real-time ppb CO 2 Impurity Detection by an Advanced FTIR- UVF System Presented at the BevTech Conference, Albuquerque, NM 2018 by Charles M. Phillips Ph.D., Max Analytical Technologies Mark Taylor, Vice
Probing Bonding Using Infrared Spectroscopy Chem
 Probing Bonding Using Infrared Spectroscopy Chem 112-2011 INTRODUCTION First, watch the short video on how to record an infrared spectrum using an infrared spectrometer, linked at: http://employees.oneonta.edu/viningwj/chem112/labs/ir_video/ir_video_controller.swf
DISCOVER-AQ Houston as a case study for understanding spatial and temporal trends in urban particulate matter
 DISCOVER-AQ Houston as a case study for understanding spatial and temporal trends in urban particulate matter Rebecca J. Sheesley and Sascha Usenko Department of Environmental Science, Baylor University,
Infrared Spectroscopy An Instrumental Method for Detecting Functional Groups
 Infrared Spectroscopy An Instrumental Method for Detecting Functional Groups 1 The Electromagnetic Spectrum Infrared Spectroscopy I. Physics Review Frequency, υ (nu), is the number of wave cycles that
3 Use of Mass Spectra to Obtain Structural Information
 3 Use of Mass Spectra to Obtain Structural Information 1 Mass Spectrometry One of the most sensitive and versatile analytical tools More sensitive than other spectroscopic methods (e.g. IR spectroscopy)