Chemistry 311: Topic 2 - Atomic Spectroscopy Topic 2: Spectroscopy:
|
|
|
- Milton Wiggins
- 6 years ago
- Views:
Transcription
1 Topic 2: Spectroscopy: Introductory Theory Basic Components Qualitative and Quantitative applications Atomic Spectroscopy Molecular Spectroscopy

2 Electromagnetic Radiation : Wave-Particle Duality Light is a form of Electromagnetic Radiation EM Radiation described by a wave-particle duality model EM Radiation behaves as a particle with no mass traveling as a sinusoidal wave at the speed of light. EM radiation, as the name suggests, has both Magnetic and Electric field components. These components are at right angles (orthogonal) to each other. (See Skoog, Figure 6-1) Does not travel in a single plane as depicted on paper but rather as a 3D wave. ie., as an extended slinky
3 Wavelength - λ space taken up by one cycle units of distance normally stated as Å or m or cm, 1 Å = 1 x m = 1 x 10⁻⁸ cm λ Key terms: Amplitude, Period {time required} and Frequency Frequency - ν: # of cycles per sec passing through a given point (units s -1 ) Frequency determined by source invariant Wavenumber, ν, the reciprocal of the wavelength: ν = 1/λ Power, P, the energy of the beam that reaches a given area per second. The flux of energy per unit time. Power is proportional to Amplitude, A 2 Intensity, I, is the power per unit solid angle.
?")
4 Velocity or Speed of Light (c) In vacuum, c is independent of wavelength and is at a maximum value of x 10 8 m/s = constant c In air, velocity of light (v) is only ~0.03% less than c speed of light sometimes reported as 3.00 x 10 8 m/s. Valid in air or vacuum. General expression: c = 3.00 x 10 8 m/s = λ ν Consequence of constant ν and c = f(medium)? Index of refraction (η) relates velocity of light in vacuum to medium Index of Refraction : η = c/v Material Air Water Fused Silica Quartz Sapphire Benzene η
/(5.90 x 10-7 m) = 5.08 1 x 10 14 s -1 in air Velocity (v) in water = c/η = (3.00 x 10 8 m/s) / 1.333 = 2.249 x 10 8 m/s λ water = (2.249 x 10 8 m/s) / (5.08 x 10 14 s -1 ) = 4.")
5 Calculation Example: In air a monochromic beam of light at 590nm appears yellow. What is the wavelength of this beam as it travels through water? Recall : c = 3.00 x 10 8 m/s = λ ν ν = c/λ = (3.00 x 10 8 m/s)/(5.90 x 10-7 m) = x s -1 in air Velocity (v) in water = c/η = (3.00 x 10 8 m/s) / = x 10 8 m/s λ water = (2.249 x 10 8 m/s) / (5.08 x s -1 ) = x 10-7 m = 443 nm o What about Green light at λ = 500 through Quartz? (=324 nm)

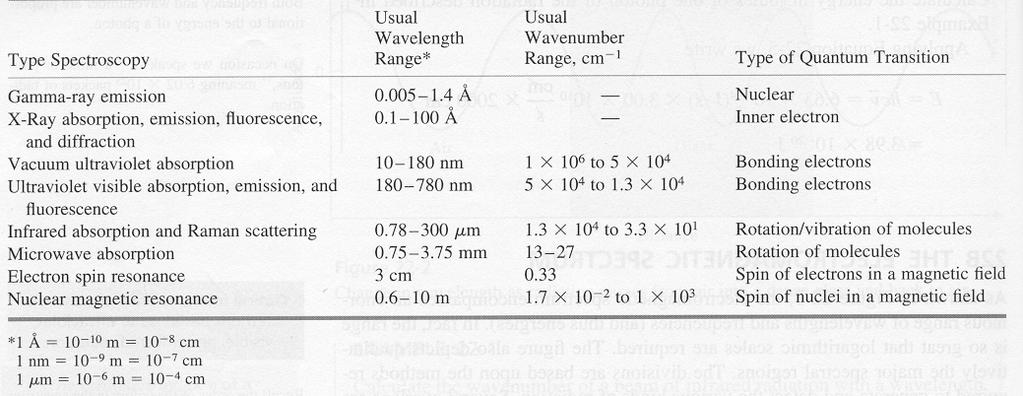
6 Interaction of EM radiation with matter: Wavelength Range Frequency Range Spectroscopy type From To Units From TO Units Quantum Transition Gamma Ray Emission Angstr Hert Nuclear 6.00E E+ om 0 18 z Xray Angstr Hert om z Vacuum UltraViolet nm Hert z UltraViolet nm Hert z Infrared um Hert z Microwave mm Hert z Electron Spin 3 3 cm Hert z Nuclear Magnetic Resonance m Hert z Inner Electron Bonding Electron Bonding Electron Vibrations Rotation of Molecules e- Spin in Mag. Field Nuclear Spin in Mag. Field
 in whole number multiples of h ν The Photoelectric Effect: Albert Einstein proposed that light is composed of particles, called photons.")
7 Planck s Quantum Theory: A Quantum is the smallest quantity of energy that can be emitted (or absorbed) in the form of EM. E = h ν where: h is Planck s constant, which is h = 6.63 x J s Energy is always emitted (or absorbed) in whole number multiples of h ν The Photoelectric Effect: Albert Einstein proposed that light is composed of particles, called photons. Each photon has an energy content of; E = h ν Energy above a specific threshold can dislodge electrons from a metal surface. This phenomenon can be used to construct a photon detector.
8 Classic experimental demonstration of Photoelectric Effect:


9 Energy Storage in Atoms and Molecules: Atoms and molecules have can store energy only in very specific ways. In other words, they have very specific and defined energy states. Since the energy of a photon is defined by it s frequency, only photons with very specific energy can be absorbed by a given atom or molecule. Subsequently, if an atom or molecule is in an excited state and then returns to a less energetic state, photons with specific frequencies will be emitted.
10
11 Basic Instruments and Components Various instruments are used to study absorption, emission, luminescence, etc. of Electromagnetic Radiation (EMR) as a function of wavelength (or frequency): Spectrometer: Measures the intensity of radiation emitted by the sample Spectrophotometer: an instrument with a monochromator to select λ Spectrograph: an instrument with a photographic plate as a detector Photometer: an instrument with a filter to select wavelength range Colorimeter: photometer using the human eye as the detector (visible λ) Fluorometer: an instrument that measures fluorescence. Spectrofluorometer: a Fluorometer with a monochromator These basic instruments are used to measure 6 phenomena; Absorption Fluorescence Phosphorescence Scattering Emission Chemiluminescence The optical and electronic principle employed in these instruments is basically the same for all the regions of the EMR, however there are some differences in the specific components used in various regions.
12 Basic Instruments and Components Any spectroscopic instrument has five major components: 1) Stable source of radiant energy 2) Transparent container for holding the sample 3) Device that isolates a restricted region for measurement 4) Radiation detector 5) Signal processor or readout

13 Line Sources: Hollow cathode lamps: Analytical Problem: The smallest Bandwidth that can be obtained by a continuous source is very large compared to atomic absorption lines of nm to nm. Only a fraction of the source beam can be absorbed by an atomic sample large background signal occurs. Analytical Solution: Use atomic emission lines as the source. Anode is tungsten, Cathode is the metal material of interest. A potential of 300 V is applied across the electrodes to and a current of 5 to 15 ma is obtained. Some gaseous cations hitting the Cathode dislodge atoms (sputtering), which are excited and then emit characteristic radiation. V A Intensity.

14 Line Sources: Electrodeless Discharge lamps (see also Skoog Section 9B-1): RF or Microwave radiation used to excite metal or salt of material of interest. Intensities of these lamps are one to two orders of magnitude larger than Hollow cathode lamps but performance is not as reliable. (see Skoog, Figure 9-12)
15 Wavelength Selectors: λ Band and Bandwidth: A narrow, continuous group of λ s. Effective Bandwidth is an indication of the quality of the λ selector.
16 2.0) Wavelength Selectors: Types Filters Interference Filters Interference Wedges Absorption filters Monochromators Prisms Gratings o Echellette Grating o Concave o Holographic
 and refractive")

17 Wavelength Selectors: Filters Interference Filters: Limit transference to narrow band. Wavelength passed depends on thickness of dielectric (t) and refractive index (η). UV to IR region. Bandwidth 1.5% to 0.15% of λ. 80% transmission to < 10% trans. 2tη λ = n Interference Wedges: Dielectric in wedge, can produce range, 20 nm BW.
18 Wavelength Selectors: Filters Absorption Filters: Generally less expensive. Normally used in visible region for inexpensive devices. Colored glass or dye suspended in gelatin. Narrow bandwidth low transmission ~10%. Cut-off filters also can be combined.
19 Wavelength Selectors: Filters Absorption Filters: Cut-off filters also can be combined.
20 Wavelength Selectors: Monochromators
21 Wavelength Selectors: Monochromators
22 Gratings Dispersion achieved through constructive interference Broad face narrow face For constructive interference: nλ = (CB + BD) = d (sin i + sin r) d = distances between blazes; i = incident angle; r = reflected angle Note: n means that a # order lines exist ie. 1 st 900 nm, 2 nd 450 nm, 3 rd 300 nm
23 Grating: Calculation Example: An Echellette Grating with 1450 blazes/mm was irradiated with a polyatomic beam at an incident angle of 48 degree to the grating normal. Calculate the wavelengths of radiation that would appear at reflection angles of +20, +10, and 0 degree. 1 st ) Calculate d (must be in same units as λ) d= 10 6 nm/mm 1450 blazes/mm = nm/blaze λ = nm (sin 48 + sin 20) n incident 48 deg 1450 Blazes/mm Wavelength r (deg) n = 1 n = 2 n = d = nm/blaze

24 Resolving Power of Monochromators: The ability to separate two (images) λ. Resolution of typical benchtop UV/Visible spectrometers 10 3 to R = λ λ For a Grating; λ R = = nn Where: n is the diffraction order and N is the # blazes λ
25
26 The Electromagnetic Radiation Transducers (Detectors): A radiation transducer is a device that converts the radiation into a quantifiable value. Early transducers were the human eye and photographic plates. Most modern transducers convert signals to an electrical signal. A generic relationship between the radiant power of the radiation and the signal is given by; S = kp + k d Note: k d is also called the dark current. Background current in absence of source Three major categories: Thermal detectors o Sense the change in temperature. o Examples: Thermoelectric detector; Bolometer; Pyroelectric detector Pneumatic detector (Golay cell). Photon detectors o Respond to incident photon arrival rates rather than to photon energies. o Examples: Phototube; Photomultiplier tube (PMT) Multichannel detectors o photographic emulsions, arrays of thermal detectors, etc.
27 Important requirements for detectors: High sensitivity with a low noise level Short response time. Long term stability to ensure quantitative response. Produces an electronic signal easily amplified for typical readout apparatus. Performance Characteristics of Common Detectors Photon Detectors Phototube The photons strike photoemissive surface of the cathode and transfer energy to loosely bound surface electrons. The electrons escape from the surface and are collected at the anode causing current to flow. Photomultiplier tube (PMT) As in phototubes, an electron is emitted from a photoemissive surface. Ejected electron is accelerated by an electric field; strikes another electron active surface, causing additional emitted electrons.
28 Performance Characteristics of Common Detectors Semi-conductor based Devices: Photovoltaic or Barrier-Layer Cells: A simple rugged device containing a thin layer of semiconductor such as selenium coated with silver or gold. Photons are ejected from semiconductor and can flow to silver or gold collector electrode. Range: 350 to 750 nm Advantages: Low cost and rugged, no power required. Disadvantage: Lack of sensitivity at low light levels, difficult to amplify signal, can fatigue with continuous illumination. Silicon Diode Transducers: A silicon chip containing a reverse-biased pn junction. Sensitivity between vacuum phototube and photomultiplier. Range: 190 to 1100 nm Advantages: Low cost and can be miniaturized. Multichannel Photon detectors: Arrays of detectors usually contained on a semiconductor chip. Three types in common usage: 1) photodiode arrays (PDAs); 2) charge-injection devices (CIDs) and 3) charge-couple devices (CCDs). 2 and 3 are Charge-Transfer Devices (CTDs) Photodiode arrays (PDAs): Series of Silicon Diode Transducers on a single integrated circuit. 64 to 4096 diodes are possible, 1024 most common. Disadvantage: Not as sensitive as photomultiplier.
29 Quantitative Aspects of Spectrochemical Measurements: As seen in the discussion of detectors, most spectroscopic detectors produce a signal that is proportional to the radiant power P of the EM. S = kp + k d The dark current, k d, is usually small and some instruments are equipped with electrical circuits which can reduce this to zero. For emission, luminescence and scattering the radiant power of the EM released is directly proportional to the concentration, ie., S = k C For atomic or molecular absorption, the magnitude that the EM beam is attenuated by the sample is proportional to the concentration. In order to measure the degree of attenuation, two measurements are required, one measuring the incident radiation, P 0, and the other the transmission, P.
30 Key terms and relations: Transmitance, T T = P P 0 % Transmitance, %T P %T = X 100 P 0 Absorbance, A A = -log 10 T = log P 0 P Beer s Law: Absorbance is directly proportional to the path length, b, the concentration, c, and a proportionality constant called the absorptivity, a, or in other words; A = abc Note: magnitude and units of a dependent on units of b & c When concentration is in Molarity and cell length is in cm, then a is equal to the molar absorptivity, ε, with units L mol -1 cm -1 A = εbc
. 3) With solvent blank correct for absorbance of the solvent, scattering, reflectance, etc.")
31 Operation of a Simple Spectrometer & Relation to Defined 1) Select appropriate wavelength and slit settings (if appropriate) 2) Nullify dark current, k d, by adjusting readout with detector isolated. In other words set to 0% transmission (this is often preset). 3) With solvent blank correct for absorbance of the solvent, scattering, reflectance, etc. by setting Transmission to 100% or zero the absorbance. 4) With sample in read transmission directly. (Note: Absorbance is a log scale)
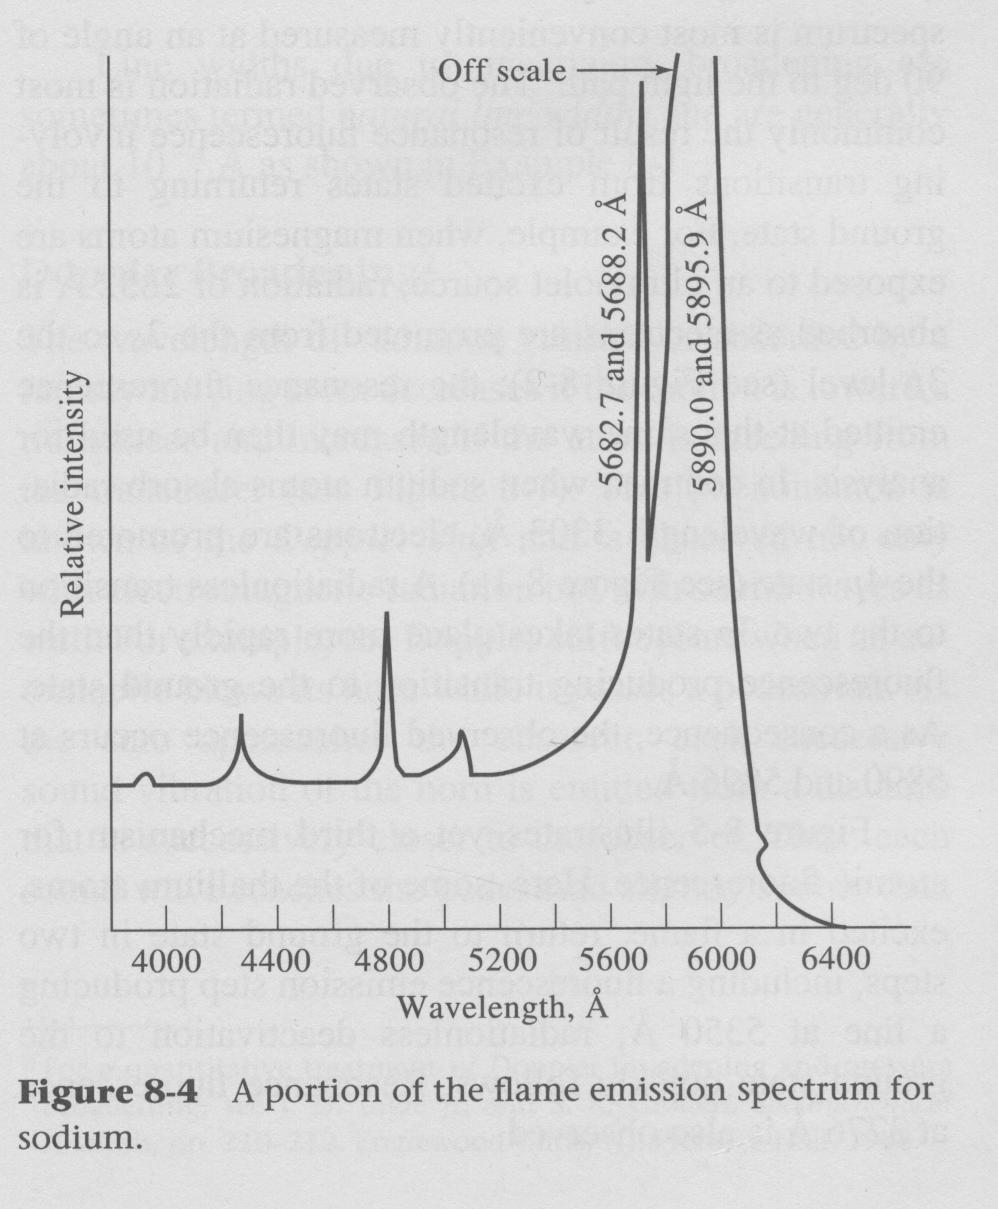
32 Introduction to Atomic Absorption Spectrometry: Detector Light Source Gas + Sample Vapour In Atomic Absolution, Sample Solution is spayed into a flame where it is vaporized and converted to atomic atoms. Atomic Atoms can absorb narrow bandwidths of light generated from a Hollow Cathode Tube. Application: Trace analysis of Metals (ppm ppb level) Instrument Cost: ~ $100,000 with accessories
33 Flame Atomization Techniques: (see Skoog, Figure 9-1) Many common steps to the production of gaseous atomic population Solution Nebulization Spray Desolvation Aerosol Dissociation Ionization Molecules Atoms Atomic Ions Temperature Dependant Population excitation Temperature Dependant Population excitation Excited Molecules Excited Atoms Excited Atomic Ions
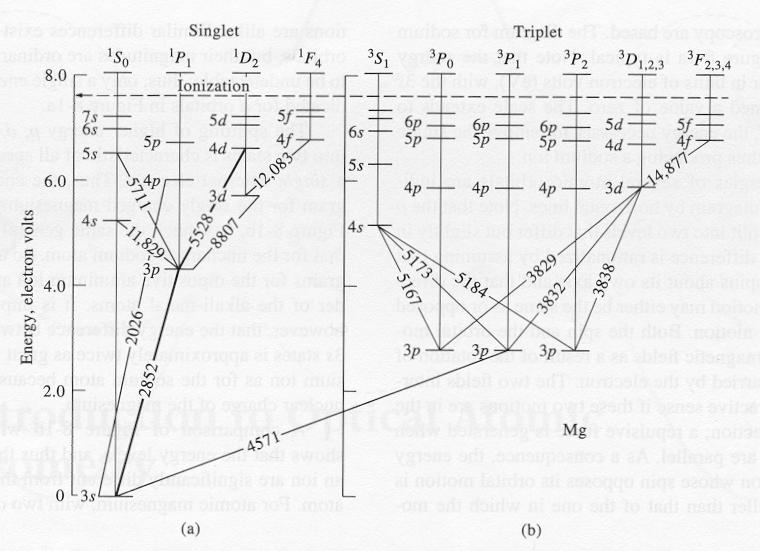
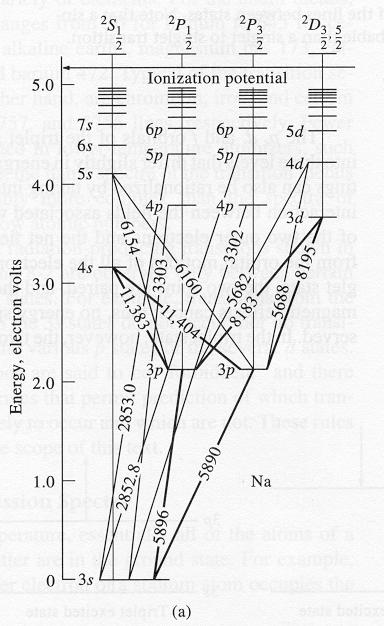
34 Atomic Absorption/Emission and Energy Level Diagrams (see Skoog Figure 8.1; Note: Na and Mg + are isoelectronic)
35 Atomic Absorption/Emission and Energy Level Diagrams Splitting of p orbitals shown in Figure 8.1 is typical. If electron spin magnetic field and orbital motion magnetic field are the same, the energy of the state is higher than if they are different. Analogous to bringing 2 north magnetic fields together. Although, Na and Mg + are isoelectronic, in Mg + the negative electron is being moved further away from a 12 + nucleus rather than a 11 + nucleus, so higher energy is involved. For both Na and Mg + cases there is 1 electron outside of the closed [Ne] shell. In Figure 8.2 (next page), the energy diagram for atomic Mg is presented. In this case there is two electrons outside of the closed [Ne] shell. If the magnetic spin of these electrons is the same, they are said to be in a triplet state (spins unpaired), if they are opposed, they are in a singlet state (spins paired). If spins are paired, the effects of magnetic electron and magnetic orbital spin splitting cancel and so the p-splitting effect is cancelled. However, in triplet states, all the p, d and f states are split. Therefore, many transitions are possible
36
37
38 Atomic Energy Level Diagrams As depicted by the darker lines in Figure 8.1 and Figure 8.2; Some transitions are more probable than others. The nature of the allowed and favored transitions is governed by a complex set of selection rules, in which some types of transitions are forbidden. For example, singlet - singlet transitions are much more probable than singlet - triplet transitions. As a result the emission or absorption lines of these transitions are much more intense. As indicated by Figure 8.2, the complexity of the Energy Level diagrams increase with the number of electrons outside the closed shell. For a simple one electron alkali metal such as Lithium there is only 30 observed spectra, for magnesium there is 173, for Iron there is As we will discuss later, the number of observed emission lines is much lower in lower energy atomizers such as flames.
39 Introduction to Atomic Absorption Spectrometry: Atomic line widths: Narrow line widths reduce the possibility of spectral overlap and thus interferences. The band width at half height is used to indicate width. This is also sometimes called the effective line width λ ½. Line broadening arises from 4 sources; Uncertainty Effect: Broadening due to the uncertainty principal relating to the uncertainty in state lifetimes Doppler effect: Broadening due to the Doppler effect (see below) Pressure effects: Broadening due to collisions of the emitted or absorbing species causing small changes in the energy level of the ground state. Electric and magnetic effects: Broadening due to the Zeeman effect or in other words the splitting of states due to presence of electric (or mag. fields)
40 Introduction to Atomic Absorption Spectrometry: Doppler effect: (see Skoog, Figure 8-7) Results from the Doppler shift phenomenon common for sound waves. The magnitude of the Doppler shift increases with the velocity that the emitting species is traveling to or from the detector (observer). No shift is observed by species moving perpendicular to the detector. Atomic velocity is distributed over a range described by a Maxwell- Boltzman distribution. The average velocity increases as the square root of the absolute temperature. In flames, Doppler effect broadens lines two orders of magnitude greater than natural line widths.
41 Introduction to Atomic Absorption Spectrometry: Temperature Effects on Atomic Spectra: Temperature has a significant effect on the population of excited vs ground atomic species. The distribution is described by the Boltzman equation; N j N 0 ( -E j ) = exp P j P 0 kt Where; N j and N 0 are the population in the ground and excited states. k is the Boltzman constant, 1.38 x J/K, T is the temperature in Kelvin, and P j and P 0 are statistical factors relating to the number of states at each level. (Example 8-2) 1.986E-23 J cm 1.38E-23 J/K Wavelength 5893 A E+04 cm E-19 J Pj 6 P0 2 Pj/P0 3 T(/C) T(/K) Nj/N E E E E E E-07
42 Temperature Effects on Atomic Spectra: Emission spectra are very dependant on the temperature of the atomizer. However, even in very hot flames only a small fraction of atoms are in excited states, Absorption and fluorescence are much less temperature dependant. High temperature increases atomization of the sample, while also enhancing Doppler effect and increasing ionization. Although, adsorption involves more states, it also involves measuring a small difference (A = log P 0 - log P), trade off.
43 Complications and Sources of Continuum Spectra: Molecular Species produce broad absorption bands due to the close spacing of vibration and rotation states associated with excited states and ground states. These broad continuum spectra can interfere (overlap) with a number of discrete atomic transitions. Formation of molecular species can also reduce the effective gaseous atomic concentration of analytes, also resulting in reduced analyte signal. The adverse effects from characteristic molecular species can be reduced by selecting appropriate characteristic signals, altering flame chemistry and in some cases by background subtraction. (see Figure 6-15 pg 132; Figure 8-8 Skoog)
44 Sample Introduction Techniques in Atomic spectroscopy: The goal of the sample introduction technique in atomic spectrometry is to transfer a reproducible and representative sample into the atomizer. This step is the one, which limits the accuracy, precision and the detection limits of the technique. This is strongly dependant on the physical and chemical state of the analyte and sample matrix. For solid samples, sample introduction is a major problem. For liquids and gases, this is relatively simple. Liquids are converted to a fine mist or aerosol and then introduced or vaporized. Pneumatic Nebulizers: To introduce either solutions or Slurries.
: Sample is vaporized by rapid resistive heating of a graphite or tantalum material. Material is entrained in a flow of inert gas.")
45 Other Atomic Absorption Introduction Techniques: Ultrasonic Nebulizers: Similar aerosol effect to pneumatic, however, quartz crystal used to produce a dense, homogenous mist. Electrothermal Vaporizers (Liquid and Solid): Sample is vaporized by rapid resistive heating of a graphite or tantalum material. Material is entrained in a flow of inert gas. A transient peak is observed. Peak Height or Peak area used to quantify. Hydride Generation Techniques: Volatile Hydrides are generated by a chemical reaction (see below). Higher transfer efficiency of specific analyte types; arsenic, antimony, tin, selenium, bismuth and lead. Results in an increase in sensitivity of 10 to100. 3BH H + + 4H 3 AsO 3 3H 3 BO 3 + 4AsH 3 (g) + H 2 O Direct Sample Insertion (Solid): Sample is physical placed into atomizer by a probe or similar and transient signal is produced.

46 Other Atomic Absorption Introduction Techniques: Arc and Spark Ablation (Solid): Electrical discharges involving the surface of a sample can lead to the ablation of surface material to form a plume of particulate and vapors which is then swept into atomizer by inert gas. Laser Ablation: Material ablated from surface by an intense laser beam. Versatile because the material can be of almost any type. Glow discharge Techniques: A glow discharge takes place in a low-pressure atmosphere (1 to 10 torr) of argon gas between a pair of electrodes maintained at a dc potential of 250 to 1000 V. The argon gas to break down into positively charged argon ions and electrons. The electric field accelerates the argon ions to the cathode surface that contains the sample. Neutral sample atoms are sputtered from surface.
47 Sample Atomization Techniques: Flame Atomization: The sample is nebulized into a gaseous oxidant flow, mixed with a fuel and then transported into a flame region for atomization. Electrothermal Atomization: A small aliquot of sample (µl) is injected into a graphite furnace where it is atomized via resistively heating to ~3000 C Glow Discharge Atomization: Small amounts of solid conductive samples are sputtered from a surface acting as an electrical cathode. An electrically accelerated stream of ionized argon is provides the energy for the sputtering and atomization process. Hydride Atomization: Volatile metal hydrides are produced from a chemical reaction and then atomized by heating in a quartz tube. Cold-Vapor Atomization: Mercury metal has sufficient volatility to be atomized by vaporization and thus the atomic absorption (@253.7 nm) can be obtained cold. Can produce low ppb detection limits.
48 Flame Atomization Techniques: Many common steps to the production of gaseous atomic population Solution Nebulization Spray Desolvation Aerosol Dissociation Ionization Molecules Atoms Atomic Ions Temperature Dependant Population excitation Temperature Dependant Population excitation Excited Molecules Excited Atoms Excited Atomic Ions
49 Flame Atomization Techniques: The temperature and chemistry of the flame will have a significant impact on the relative populations of molecules, atoms, ions and there electronically excited states. This will subsequently have a significant impact on the analytical signal.
. Thermal equilibrium not yet reached. Interzonal region: Common zone to use for spectroscopy.")
50 Flame Atomization Techniques: Structure (see Skoog, Figure 9-2, 9-3) Although, flames are dynamic systems; reproducible regions and zones with characterized temperature and chemistry profiles are produced. Flame Structure: Primary combustion zone: In hydrocarbon, blue luminescence zone (C 2, CH etc.). Thermal equilibrium not yet reached. Interzonal region: Common zone to use for spectroscopy. rich in free atoms and the hottest part of the flame Secondary combustion zone: Atoms and other reagents converted to more stable species, such as oxides. Next: Skoog, Figure 9-5
 is introduced into a graphite furnace that is heated electrically to 2000 C to")
51 Electrothermal Atomizers (Graphite Furnace): A small aliquot (µl) of sample (or entire sample) is introduced into a graphite furnace that is heated electrically to 2000 C to 3000 C.
 5% to 10% whereas in flame 1% or better. o Methods are slow, dynamic range is low.")
52 Electrothermal Atomizers (Graphite Furnace): Advantages: o Sample size 0.5 µl to 10 µl, with detection limits of to g of analyte. Disadvantages: o Reproducibility (RSD) 5% to 10% whereas in flame 1% or better. o Methods are slow, dynamic range is low. Graphite Furnace is normally only used when detection limits are an issue.
53 Interferences in Atomic Absorption: Spectral interferences: These result from the absorption or emission of radiation by an interfering species that overlaps or cannot be resolved from the absorption of the analyte species. Chemical Interferences: These result from various chemical processes that are occurring during atomization that alter the absorption characteristics of the analyte. Spectral interferences: Interferences from overlapping emission lines usually not a problem, very narrow from hollow cathode and well characterized. Combustion by-products other than analyte and particulate most significant Background correction can correct for fuel and oxidant interferences Sample matrix interferences more challenging; o Oxides and hydroxides; may need to change flame chemistry o Organic material species incomplete combustion products scattering o Most dependent on flame chemistry, temperature vary to min. prob. o Add excess to standards for radiation buffer effect

54 Spectral Interferences in Atomic Absorption: Historically, spectral interference in graphite furnace most severe, very specialized corrections applied to minimize problem. Two Line Correction: An additional spectral line from the source, close in frequency to the analyte wavelength can be employed. (special case & rare) Continuum Source Correction: Signal from a continuous (deuterium lamp) is alternately passed through the analyte zone. Limited value. Zeeman Effect Correction: In a strong magnetic field, the magnetic field generated by the spinning electron alters the energy or wavelength of transitions. For Singlet transitions, 3 lines -σ, π, +σ result. π lines absorb radiation polarized parallel to magnetic field,σ perpendicular to field(fig9-15)
55 Chemical Interferences in Atomic Absorption: Chemical interferences are much more common than spectral ones. Reduce by selecting appropriate conditions. Treat flame as a stable solvent and apply equilibrium concepts. Low Volatility Compounds: Anion presence leads to non-volatile ionic species. ie., calcium absorbance drops off linearly with sulfate or phosphate contamination. The presence of other metals can also reduce signal possibly due to complex, heat stable metal oxides being formed. o Reduce or eliminate by higher temperature o Add releasing agents to preferably bind with interference. o Add protective agents to form stable volatile complexes such as EDTA Dissociation Equilibria: In a flame complex equilibrium are established such as; M + O MO M + 2OH M(OH) 2 o alkaline-earth oxides are stable, lead to broad molecular bands o Other reactions also reduce such as: Na + Cl NaCl
56 Chemical Interferences in Atomic Absorption: Ionization Equilibria: In low temperature flames, such as those produced with oxygen as a oxidant, ionization is low and the loss of analyte by the reaction following reaction is low. Not the case for hotter flames. M M + + e - (1) The equilibrium constant for this reaction is; K = [M + ] [e - ] [M] o As the equilibrium constant implies that introduction of an easily ionized element such as Potassium or Cesium will lead to the production of additional e - by the reaction below. B B + + e - (2) The [M + ] can then be significantly reduced as increasing the [e-] will drive reaction 1 back toward reagents. On the other hand for easily ionized atoms such as the alkali metals, using a hotter flame may reduce the analyte signal due to ionization but increase the signal by eliminating hydroxide and oxide formation. complex
57 Atomic Absorption Techniques: US EPA method 7000A: 4.8 Glassware - All glassware, polypropylene, or Teflon containers, including sample bottles, flasks and pipets, should be washed in the following sequence: detergent, tap water, 1:1 nitric acid, tap water, 1:1 hydrochloric acid, tap water, and reagent water. (Read and understand specifications for reagents) 5.7 Calibration standards -... preparation of standards which produce an absorbance of 0.0 to 0.7. Calibration standards are prepared by diluting the stock metal solutions at the time of analysis.... calibration standards should be prepared fresh each time a batch of samples is analyzed. Prepare a blank and at least three calibration standards in graduated amounts in the appropriate range of the linear part of the curve. The calibration standards should be prepared using the same type of acid or combination of acids and at the same concentration as will result in the samples following processing....calibration curves are always required.
58 Atomic Absorption Techniques: US EPA method 7000A: 7.2 Direct aspiration (flame) procedure: In general, after choosing the proper lamp for the analysis, allow the lamp to warm up for a minimum of 15 minutes Align the instrument, position the monochromator at the correct wavelength, select the proper monochromator slit width, and adjust the current according to the manufacturer's recommendation. Subsequently, Light the flame and regulate the flow of fuel and oxidant. Adjust the burner and nebulizer flow rate for maximum percent absorption and stability. Run a series of standards of the element under analysis. Construct a calibration curve by plotting the concentrations of the standards against absorbances. Aspirate the samples and determine the concentrations either directly or from the calibration curve. Standards must be run each time a sample or series of samples is run.
59 8.0 QUALITY CONTROL 8.2 A calibration curve must be prepared each day with a minimum of a calibration blank and three standards. After calibration, the calibration curve must be verified by use of at least a calibration blank and a calibration check standard (made from a reference material or other independent standard material) at or near the mid-range. The calibration reference standard must be measured within 10 % of it's true value for the curve to be valid. 8.3 If more than 10 samples per day are analyzed, the working standard curve must be verified by measuring satisfactorily a mid-range standard or reference standard after every 10 samples. This sample value must be within 20% of the true value, or the previous ten samples reanalyzed Dilution test - For each analytical batch select one typical sample for serial dilution to determine whether interferences are present. The concentration of the analyte should be at least 25 times the estimated detection limit. Determine the apparent concentration in the undiluted sample. Dilute the sample by a minimum of five fold and reanalyze. Agreement within 10% between the concentration for the undiluted sample and five times the concentration for the diluted sample indicates the absence of interferences, and such samples may be analyzed without using the method of standard additions.
60 Atomic Emission Spectroscopy - Atomization Emission Sources: Flame Electric Spark and Arc Direct current Plasmas Microwave Induced Plasma Inductively Coupled Plasma Advantages: o Simultaneous multi-element Analysis o Some non-metal determination (Cl, Br, I, and S) o Concentration range of several decades Disadvantages: o Spectra very complex hundreds to thousands of lines o High resolution and expensive optical components o Expensive instruments, highly trained personnel required
61 Plasma Sources: A Plasma is an electrically conducting gaseous mixture containing significant concentrations of cations and electrons. There are three main types; Inductively Coupled Plasma (ICP) Direct Current Plasma (DCP) Microwave Induced Plasma (MIP) Inductively Coupled Plasma (ICP): Plasma generated in a device called a Torch Rate of Argon Consumption 5-20 L/Min Radio frequency (RF) generator 27 or 41 MHz Telsa coil produces initiation spark Ions and e- interact with magnetic field and begin to flow in a circular motion. Resistance to movement (collisions of e- and cations with ambient gas) leads to ohmic heating. Rapid tangential flow of argon cools outer quartz and centers plasma. Sample introduction is analogous to atomic absorption.

62 Inductively Coupled Plasma (ICP):
63 Inductively Coupled Plasma (ICP): (see Skoog Figure 10-4) Sample atoms reside in plasma for ~2 msec and Reach temperatures of 4000 to 8000 K. Ionization interference small due to high density of e- Plasma chemically inert, little oxide formation Temperature profile quite stable and uniform.

64 Inductively Coupled Plasma (ICP):

65 Inductively Coupled Plasma (ICP): Sequential: Step between atomic emission lines quickly (sec/line) Simultaneous Multi-channel: Measure intensities of a large number of elements (50-60) simultaneously Sequential: Most use holographic grating Some 2 sets of slits, one visible, one UV range Sequential Skew-scan: Scan fast between wavelengths and slow near wavelength Scanning Echelle Spectrometer: Photomultiplier is moved to monitor signal from slotted aperature.

66 Scanning Echelle Spectrometer: Multichannel Spectrometers: Analogous except use diode arrays or CCD s etc.
67 ICP/OES INTERFERENCES: Spectral interferences: caused by background emission from continuous or recombination phenomena, stray light from the line emission of high concentration elements, overlap of a spectral line from another element, or unresolved overlap of molecular band spectra. Background emission and stray light compensated for by subtracting background emission determined by measurements adjacent to the analyte wavelength peak. Correction factors can be applied if interference is well characterized Inter-element corrections will vary for the same emission line among instruments because of differences in resolution, as determined by the grating, the entrance and exit slit widths, and by the order of dispersion. Physical interferences: effects associated with the sample nebulization and transport processes. Changes in viscosity and surface tension can cause significant inaccuracies, especially in samples containing high dissolved solids or high acid concentrations. Reduced by diluting the sample or by using a peristaltic pump, by using an internal standard or by using a high solids nebulizer. Salt buildup at the tip of the nebulizer, affecting aerosol flow rate and nebulization.
68 ICP/OES INTERFERENCES: Chemical interferences: include molecular compound formation, ionization effects, and solute vaporization effects. Normally, these effects are not significant with the ICP technique. Chemical interferences are highly dependent on matrix type and the specific analyte element. Memory interferences: result when analytes in a previous sample contribute to the signals measured in a new sample. Memory effects can result from sample deposition on the uptake tubing to the nebulizer and from the build up of sample material in the plasma torch and spray chamber. The site where these effects occur is dependent on the element and can be minimized by flushing the system with a rinse blank between samples. High salt concentrations can cause analyte signal suppressions and confuse interference tests.
69 Typical Calibration ICP Curves (note non linear)

70 Calibration curves in various matrices:

71 Comparison of ICP and other techniques:
72 Atomic X-ray Spectrometry Fundamental Principles Emission of X-rays Absorption Spectra o Mass Absorption Coefficient X-Ray Fluorescence Instrumentation o Sources o Monochromators o Transducers Applications X-ray Fluorescence Methods o Qualitative o Quantitative
.")
73 Fundamental Principles: X-rays are short wavelength (10-5 Å to 100 Å) EM produced by the deceleration of high-energy electrons or by electronic transitions of electrons in the inner orbitals of atoms. In practice the wavelength range most often used for analytical purposes is 0.1 Å to 25 Å (0.01 nm to 2.5 nm). Emission of X-rays: There are 4 main sources of analytical X-rays; A) Bombardment of a metal target with a beam of high-energy electrons B) X-ray Fluorescence by a material irradiated by X-rays C) Use of an radioactive source D) Synchrotron radiation Source (highly specialized facility not discussed)
74 A) Bombardment of a metal target with a beam of high-energy electrons e- produced at cathode and accelerated toward a high potential anode (100 kv) Collision e- decelerated and X-ray spectrum is produced. This is dependent only on the accelerating voltage and is independent of target material. Energy of photon is equal to difference in KE before and after collision.
75 A) Bombardment of a metal target with a beam of high-energy electrons Maximum photon energy corresponds to the instantaneous and complete deceleration of the electron. Described mathematically by Duane-Hunt Law; h c hν 0 = λ 0 = Ve Where; V is accelerating Voltage; e is charge on e- From this λ 0 = 12,396/V (λ 0 is in Å and V is in volts) ie., λ 0 = 12,396 35,000 = Å

76 A) Bombardment of a metal target with a beam of high-energy electrons Emission behavior of Molybdenum is typical of all elements with atomic numbers (A#) greater than 23 X-ray line spectra relatively simple, with shorter wavelength being K series and longer L series. Elements with A# s < 23 produce only K series. X-Ray line spectra have a specific appearance energy for Mo this is 20 KV. For Tungsten these lines appear at >70KV
77 4d 10 4p 6 4s 2 3d 10 3p 6 3s 2 2p 6 2s 2 1s 2
78 B) X-ray Fluorescence by a material irradiated by X-rays The absorption of X-rays produces electronically excited ions, when the ion returns to it s ground electronic state, characteristic λ are produced. Cutoff λ from the primary X-ray source must be less (greater in energy) than the absorption edge of the analyte. C) Use of an radioactive source X-ray radiation can be produced by radioactive species. γ-rays are high energy EM that is indistinguishable from X-rays. Another radioactive process is electron capture in which the nucleus captures an electron to form a new atomic species (with lower atomic number). K electrons because of their proximity are captured must often, leaving the K-level electron hole needed for characteristic radiation. Common example is 55 Fe 54 Mn + h ν Mn Kα line at 2.1 Å results
79 Absorption Spectra X-rays are absorbed by materials through an photoelectron effect process. Typical absorption spectra are presented below (Figure 12-5).
80 Absorption Spectra The absorption spectra of a given element is relatively simple Observed λ is characteristic of the element and is independent of it s chemical state. Inner e- far removed from valence e-. Sharp discontinuities are called absorption edges The absorption edge for a given band ie., K reflects the difficulty in removing an electron from that orbital. It is more difficult to extract a 1s electron (e-) close to the a nucleus with 82 protons (+82 charge) than it is to extract a 1s electron (e-) close to the a nucleus with 47 protons (+47 charge) 82 Pb has a much lower wavelength (higher energy) K band than does 47 Ag. Mass Absorption Coefficient Beer s law is also applicable to absorption of X-radiation. P 0 ln = µ x P t ln P 0 P t = µ M ρ x Where; x is the sample thickness (cm): µ is the linear absorption coefficient µ M is mass absorption coefficient (cm 2 /g): and ρ is sample density. Note: µ M is independent of the chemical or physical state of the element Diffraction of X-rays
) Radioisotopes: The nature of the radiation used with these sources is completely dependent on the radioactive material used. Many produce line spectra.")
81 X-ray Spectrometry Instrumentation: Source λ selector Sample Holder Detector Sources: X-Ray Tube: These are the most commonly used sources for analytical work. (see previous diagram, (Skoog Figure 12-7)) Radioisotopes: The nature of the radiation used with these sources is completely dependent on the radioactive material used. Many produce line spectra. Since absorption sensitivity is related to the proximity to specific absorption edges, specific sources are more applicable to specific analysis. Secondary Fluorescence: This can be quite useful, as discrete lines are produced without the underlying continuum of X-ray tube. However, a primary X-ray tube or Radioisotope source is required to stimulate fluorescence.
82 λ Monochromators and Filters: Filters: Thin strips of metal can provide effective λ filters. (see Skoog Figure 12-8) λ Monochromators: Crystals can be used to produce monochromatic radiation via application of Bragg s law (see Figure 12-9 and Table 12-3)

83 (see Skoog Figure 12-9 and Table 12-3)
84 X-ray Transducers: Usually the monitored signals in X-ray spectrometry are of low intensity and frequency, as a result transducers are often operated in a photon counting mode. Most of the detectors in X-ray spectrometry rely on the ionizing nature of X-ray radiation to produce measurable electronic signals. Gas-Filled Transducers: Inert gasses such as Argon, Xenon or Krypton are enclosed metal tube equipped with electrodes that have a high potential applied across them. When X-rays ionize the gas, a current is produced, the nature of which is dependent on the magnitude of the applied potential. 3 types of transducers are obtained (see next page). o Geiger Tube o Proportional Counters o Ionization Chambers Scintillation Counters: Radiation striking a phosphor produces luminescence that can be monitored and amplified with a photomultiplier tube. Semi-conductor Transducers: semiconductor based detectors have a roughly analogous mode of operation to gas filled detectors.
85 Gas-Filled Transducers: Geiger Tube: If the potential is > ~1000V significant amplification occurs (~10 9 ). Space charge effects cause a dead-time of µsec for this device. Proportional Counters: Signal gains are less (500-10,000) and thus require additional amplification. Dead time is approximately 1 µsec. Signal intensity is dependent on the energy (frequency) of the incident radiation, thus if selected ranges of signals are counted in sequence a frequency domain spectra can be obtained. Ionization Chambers: Currents are small in this range and thus the sensitivity is also low. Not used in X-ray spectrometry. Signal Processors:
86 Pulse-Height Selectors: Only signals with a preset range of intensities are collected. See Figure Pulse-Height Analyzers: Signals with specific energy range have distinct energy scanning energy range is comparable to scanning frequency (or λ).
87 Applications: X-Ray Fluorescence: The non-destructive nature of this technique makes it very popular especially for qualitative purposes. Semi-quantitative and even quantitative analyses are also possible although these are more difficult. X-Ray Fluorescence Instrumentation: There are 3 basic types. The later two listed below could be equipped with either a X-ray tube or radioactive source. Wavelength Dispersive: Since only a small fraction of incident radiation can be effectively dispersed into monochromatic radiation, an intense source is required. this type of instrument requires a X-ray tube (10 4 more intense than common Radioactive sources). These can be either sequential (~$60,000) or multi-channel (>$150,000). Energy Dispersive Non-Dispersive


88 Energy Dispersive: A schematic for a typical energy dispersive instrument is adjacent. Since the source, sample and detector can be placed close to each other signal losses are significantly reduced. Much less expensive (~$15,000 $20,000). Non-Dispersive: If a filter or series of filters are placed before the detector, only specific frequencies can be passed, producing a very simple low cost instrument.
89
90 Qualitative and Semi-quantitative Analysis: Qualitative information is obtained by the observed frequency of the radiation. The observed relative intensity of the lines is a rough guide for quantitative determination. A better quick estimate is to use the following relationship; P x = P s W x Where; P x is the observed intensity: P s is the intensity of pure material; and W x is the weight fraction of x Quantitative Analysis: Reasonably accurate quantitative results can be obtained if standards with nearly identical matrices can be used for calibration. Matrix effects: Both bulk and surface elements can absorb X-rays and emit characteristic radiation. For those in the bulk material; the intensity of the excitation absorption is attenuated by the material radiation must pass through before reaching analyte. Furthermore, the fluorescence emitted by the analyte must pass back through material and therefore may also be absorbed. Furthermore, matrix material might also emit interfering radiation. Calibration: External calibration standards can be used in an identical manner. Dissolving or diluting sample (fusing) may also be used to create a constant matrix.

91 Advantages and Disadvantages of X-Ray Fluorescence: Advantages: Simple spectra Spectral interferences limited Non-destructive technique (for the most part) Many sample types and sizes Very rapid and convenient Disadvantages: low sensitivity (0.01 to 100 %) Less applicable for lighter elements (elements below Vanadium A# 23) Cost of $5000 to $500000
Chemistry 311: Instrumentation Analysis Topic 2: Atomic Spectroscopy. Chemistry 311: Instrumentation Analysis Topic 2: Atomic Spectroscopy
 Topic 1: Atomic Spectroscopy Text: Chapter 12,13 & 14 Rouessac (~2 weeks) 1.0 Review basic concepts in Spectroscopy 2.0 Atomic Absorption and Graphite Furnace Instruments 3.0 Inductively Coupled Plasmas
Chemistry 311: Instrumentation Analysis Topic 2: Atomic Spectroscopy. Chemistry 311: Instrumentation Analysis Topic 2: Atomic Spectroscopy
 Atomic line widths: Narrow line widths reduce the possibility of spectral overlap and thus interferences. The band width at half height is used to indicate width. This is also sometimes called the effective
Chemistry 311: Instrumentation Analysis Topic 2: Atomic Spectroscopy. Chemistry 311: Instrumentation Analysis Topic 2: Atomic Spectroscopy
 Topic 2b: X-ray Fluorescence Spectrometry Text: Chapter 12 Rouessac (1 week) 4.0 X-ray Fluorescence Download, read and understand EPA method 6010C ICP-OES Winter 2009 Page 1 Atomic X-ray Spectrometry Fundamental
25 Instruments for Optical Spectrometry
 25 Instruments for Optical Spectrometry 25A INSTRUMENT COMPONENTS (1) source of radiant energy (2) wavelength selector (3) sample container (4) detector (5) signal processor and readout (a) (b) (c) Fig.
10/2/2008. hc λ. νλ =c. proportional to frequency. Energy is inversely proportional to wavelength And is directly proportional to wavenumber
 CH217 Fundamentals of Analytical Chemistry Module Leader: Dr. Alison Willows Electromagnetic spectrum Properties of electromagnetic radiation Many properties of electromagnetic radiation can be described
2101 Atomic Spectroscopy
 2101 Atomic Spectroscopy Atomic identification Atomic spectroscopy refers to the absorption and emission of ultraviolet to visible light by atoms and monoatomic ions. It is best used to analyze metals.
3 - Atomic Absorption Spectroscopy
 3 - Atomic Absorption Spectroscopy Introduction Atomic-absorption (AA) spectroscopy uses the absorption of light to measure the concentration of gas-phase atoms. Since samples are usually liquids or solids,
Reference literature. (See: CHEM 2470 notes, Module 8 Textbook 6th ed., Chapters )
") September 17, 2018 Reference literature (See: CHEM 2470 notes, Module 8 Textbook 6th ed., Chapters 13-14 ) Reference.: https://slideplayer.com/slide/8354408/ Spectroscopy Usual Wavelength Type of Quantum
September 17, 2018 Reference literature (See: CHEM 2470 notes, Module 8 Textbook 6th ed., Chapters 13-14 ) Reference.: https://slideplayer.com/slide/8354408/ Spectroscopy Usual Wavelength Type of Quantum
high temp ( K) Chapter 20: Atomic Spectroscopy
 Chapter 20: Atomic Spectroscopy") high temp (2000-6000K) Chapter 20: Atomic Spectroscopy 20-1. An Overview Most compounds Atoms in gas phase high temp (2000-6000K) (AES) (AAS) (AFS) sample Mass-to-charge (ICP-MS) Atomic Absorption experiment
high temp (2000-6000K) Chapter 20: Atomic Spectroscopy 20-1. An Overview Most compounds Atoms in gas phase high temp (2000-6000K) (AES) (AAS) (AFS) sample Mass-to-charge (ICP-MS) Atomic Absorption experiment
Because light behaves like a wave, we can describe it in one of two ways by its wavelength or by its frequency.
 Light We can use different terms to describe light: Color Wavelength Frequency Light is composed of electromagnetic waves that travel through some medium. The properties of the medium determine how light
Ch. 9 Atomic Absorption & Atomic Fluorescence Spectrometry
 Ch. 9 Atomic Absorption & Atomic Fluorescence Spectrometry 9.1 9A. Atomization Most fundamental for both techniques. Typical types 1. flame - burner type 2. Electrothermal graphite furnace 3. Specialized
Chemistry Instrumental Analysis Lecture 17. Chem 4631
 Chemistry 4631 Instrumental Analysis Lecture 17 Introduction to Optical Atomic Spectrometry From molecular to elemental analysis there are three major techniques used for elemental analysis: Optical spectrometry
a. An emission line as close as possible to the analyte resonance line
 Practice Problem Set 5 Atomic Emission Spectroscopy 10-1 What is an internal standard and why is it used? An internal standard is a substance added to samples, blank, and standards. The ratio of the signal
Ch. 8 Introduction to Optical Atomic Spectroscopy
 Ch. 8 Introduction to Optical Atomic Spectroscopy 8.1 3 major types of Spectrometry elemental Optical Spectrometry Ch 9, 10 Mass Spectrometry Ch 11 X-ray Spectrometry Ch 12 In this chapter theories on
Emission spectrum of H
 Atomic Spectroscopy Atomic spectroscopy measures the spectra of elements in their atomic/ionized states. Atomic spectrometry, exploits quantized electronic transitions characteristic of each individual
2001 Spectrometers. Instrument Machinery. Movies from this presentation can be access at
 2001 Spectrometers Instrument Machinery Movies from this presentation can be access at http://www.shsu.edu/~chm_tgc/sounds/sound.html Chp20: 1 Optical Instruments Instrument Components Components of various
CH. 21 Atomic Spectroscopy
 CH. 21 Atomic Spectroscopy 21.1 Anthropology Puzzle? What did ancient people eat for a living? Laser Ablation-plasma ionization-mass spectrometry CH. 21 Atomic Spectroscopy 21.2 plasma In Atomic Spectroscopy
very high temperature for excitation not necessary generally no plasma/arc/spark AAS
 Atomic Absorption Spectrometry (Chapter 9) AAS intrinsically more sensitive than AES similar atomization techniques to AES addition of radiation source high temperature for atomization necessary flame
Course Details. Analytical Techniques Based on Optical Spectroscopy. Course Details. Textbook. SCCH 211: Analytical Chemistry I
 SCCH 211: Analytical Chemistry I Analytical Techniques Based on Optical Spectroscopy Course Details September 22 October 10 September 22 November 7 November 17 December 1 Topic Period Introduction to Spectrometric
Chapter 9. Atomic emission and Atomic Fluorescence Spectrometry Emission spectrophotometric Techniques
 Chapter 9 Atomic emission and Atomic Fluorescence Spectrometry Emission spectrophotometric Techniques Emission Spectroscopy Flame and Plasma Emission Spectroscopy are based upon those particles that are
Chemistry Instrumental Analysis Lecture 18. Chem 4631
 Chemistry 4631 Instrumental Analysis Lecture 18 Instrumentation Radiation sources Hollow cathode lamp Most common source Consist of W anode and a cathode sealed in a glass tube filled with Ne or Ar. Hollow
Atomization. In Flame Emission
 FLAME SPECTROSCOPY The concentration of an element in a solution is determined by measuring the absorption, emission or fluorescence of electromagnetic by its monatomic particles in gaseous state in the
CHEM*3440. Photon Energy Units. Spectrum of Electromagnetic Radiation. Chemical Instrumentation. Spectroscopic Experimental Concept.
 Spectrum of Electromagnetic Radiation Electromagnetic radiation is light. Different energy light interacts with different motions in molecules. CHEM*344 Chemical Instrumentation Topic 7 Spectrometry Radiofrequency
Introduction to Spectroscopic methods
 Introduction to Spectroscopic methods Spectroscopy: Study of interaction between light* and matter. Spectrometry: Implies a quantitative measurement of intensity. * More generally speaking electromagnetic
Atomic Absorption Spectrophotometry. Presentation by, Mrs. Sangita J. Chandratre Department of Microbiology M. J. college, Jalgaon
 Atomic Absorption Spectrophotometry Presentation by, Mrs. Sangita J. Chandratre Department of Microbiology M. J. college, Jalgaon Defination In analytical chemistry, Atomic absorption spectroscopy is a
FLAME PHOTOMETRY AIM INTRODUCTION
 FLAME PHOTOMETRY AIM INTRODUCTION Atomic spectroscopy is based on the absorption, emission or fluorescence process of light by atoms or elementary ions. Information for atomic scale is obtained in two
Ch 313 FINAL EXAM OUTLINE Spring 2010
 Ch 313 FINAL EXAM OUTLINE Spring 2010 NOTE: Use this outline at your own risk sometimes a topic is omitted that you are still responsible for. It is meant to be a study aid and is not meant to be a replacement
Spectroscopy: Introduction. Required reading Chapter 18 (pages ) Chapter 20 (pages )
 Chapter 20 (pages )") Spectroscopy: Introduction Required reading Chapter 18 (pages 378-397) Chapter 20 (pages 424-449) Spectrophotometry is any procedure that uses light to measure chemical concentrations Properties of Light
Spectroscopy: Introduction Required reading Chapter 18 (pages 378-397) Chapter 20 (pages 424-449) Spectrophotometry is any procedure that uses light to measure chemical concentrations Properties of Light
AN INTRODUCTION TO ATOMIC SPECTROSCOPY
 AN INTRODUCTION TO ATOMIC SPECTROSCOPY Atomic spectroscopy deals with the absorption, emission, or fluorescence by atom or elementary ions. Two regions of the spectrum yield atomic information- the UV-visible
Skoog Chapter 6 Introduction to Spectrometric Methods
 Skoog Chapter 6 Introduction to Spectrometric Methods General Properties of Electromagnetic Radiation (EM) Wave Properties of EM Quantum Mechanical Properties of EM Quantitative Aspects of Spectrochemical
Atomic Emission Spectroscopy
 Atomic Emission Spectroscopy Ahmad Aqel Ifseisi Assistant Professor of Analytical Chemistry College of Science, Department of Chemistry King Saud University P.O. Box 2455 Riyadh 11451 Saudi Arabia Building:
Complete the following. Clearly mark your answers. YOU MUST SHOW YOUR WORK TO RECEIVE CREDIT.
 CHEM 322 Name Exam 3 Spring 2013 Complete the following. Clearly mark your answers. YOU MUST SHOW YOUR WORK TO RECEIVE CREDIT. Warm-up (3 points each). 1. In Raman Spectroscopy, molecules are promoted
Chapter 8: An Introduction to Optical Atomic Spectrometry
 Chapter 8: An Introduction to Optical Atomic Spectrometry Sample is atomized (gaseous atoms/ions) absorption or emission measured Optical Atomic Spectra Atomization Methods Sample Introduction Methods
Analytical Spectroscopy Review
 Analytical Spectroscopy Review λ = wavelength ν = frequency V = velocity = ν x λ = 2.998 x 10 8 m/sec = c (in a vacuum) ν is determined by source and does not change as wave propogates, but V can change
Chemistry Instrumental Analysis Lecture 19 Chapter 12. Chem 4631
 Chemistry 4631 Instrumental Analysis Lecture 19 Chapter 12 There are three major techniques used for elemental analysis: Optical spectrometry Mass spectrometry X-ray spectrometry X-ray Techniques include:
Spectroscopy. Page 1 of 8 L.Pillay (2012)
") Spectroscopy Electromagnetic radiation is widely used in analytical chemistry. The identification and quantification of samples using electromagnetic radiation (light) is called spectroscopy. Light has
Spectroscopy Electromagnetic radiation is widely used in analytical chemistry. The identification and quantification of samples using electromagnetic radiation (light) is called spectroscopy. Light has
II. Spectrophotometry (Chapters 17, 19, 20)
") II. Spectrophotometry (Chapters 17, 19, 20) FUNDAMENTALS (Chapter 17) Spectrophotometry: any technique that uses light to measure concentrations (here: U and visible - ~190 800 nm) c = 2.99792 x 10 8 m/s
II. Spectrophotometry (Chapters 17, 19, 20) FUNDAMENTALS (Chapter 17) Spectrophotometry: any technique that uses light to measure concentrations (here: U and visible - ~190 800 nm) c = 2.99792 x 10 8 m/s
INTRODUCTION TO OPTICAL ATOMIC SPECTROSCOPY (Chapter 8)
") INTRODUCTION TO OPTICAL ATOMIC SPECTROSCOPY (Chapter 8) Atomic spectroscopy techniques: Optical spectrometry Mass spectrometry X-Ray spectrometry Optical spectrometry: Elements in the sample are atomized
INTRODUCTION TO OPTICAL ATOMIC SPECTROSCOPY (Chapter 8) Atomic spectroscopy techniques: Optical spectrometry Mass spectrometry X-Ray spectrometry Optical spectrometry: Elements in the sample are atomized
Instrumental Analysis: Spectrophotometric Methods
 Instrumental Analysis: Spectrophotometric Methods 2007 By the end of this part of the course, you should be able to: Understand interaction between light and matter (absorbance, excitation, emission, luminescence,fluorescence,
9/13/10. Each spectral line is characteristic of an individual energy transition
 Sensitive and selective determination of (primarily) metals at low concentrations Each spectral line is characteristic of an individual energy transition 1 Atomic Line Widths Why do atomic spectra have
Chapter 13 An Introduction to Ultraviolet/Visible Molecular Absorption Spectrometry
 Chapter 13 An Introduction to Ultraviolet/Visible Molecular Absorption Spectrometry 13A Measurement Of Transmittance and Absorbance Absorption measurements based upon ultraviolet and visible radiation
CHAPTER 8 Introduction to Optical Atomic Spectrometry
 CHAPTER 8 Introduction to Optical Atomic Spectrometry From: Principles of Instrumental Analysis, 6 th Edition, Holler, Skoog and Crouch. CMY 383: Dr Tim Laurens Introduction. Three major types of spectrometric
Chem 434 -Instrumental Analysis Hour Exam 1
 Do any 8 of the following 9 problems Name: Chem 434 -Instrumental Analysis Hour Exam 1 +2 1. A 25.0 ml sample containing Cu gave an instrument reading of 23.6 units (corrected for a blank). When exactly
Optical Atomic Spectroscopy
 Optical Atomic Spectroscopy Methods to measure conentrations of primarily metallic elements at < ppm levels with high selectivity! Two main optical methodologies- -Atomic Absorption--need ground state
Questions on Instrumental Methods of Analysis
 Questions on Instrumental Methods of Analysis 1. Which one of the following techniques can be used for the detection in a liquid chromatograph? a. Ultraviolet absorbance or refractive index measurement.
Atomic Absorption & Atomic Fluorescence Spectrometry
 Atomic Absorption & Atomic Fluorescence Spectrometry Sample Atomization Atomic Absorption (AA) Atomic Fluorescence (AF) - Both AA and AF require a light source - Like Molecular Absorption & Fluorescence,
EMISSION SPECTROSCOPY
 IFM The Department of Physics, Chemistry and Biology LAB 57 EMISSION SPECTROSCOPY NAME PERSONAL NUMBER DATE APPROVED I. OBJECTIVES - Understand the principle of atomic emission spectra. - Know how to acquire
ATOMIC SPECROSCOPY (AS)
") ATOMIC ABSORPTION ANALYTICAL CHEMISTRY ATOMIC SPECROSCOPY (AS) Atomic Absorption Spectroscopy 1- Flame Atomic Absorption Spectreoscopy (FAAS) 2- Electrothermal ( Flame-less ) Atomic Absorption Spectroscopy
ATOMIC ABSORPTION ANALYTICAL CHEMISTRY ATOMIC SPECROSCOPY (AS) Atomic Absorption Spectroscopy 1- Flame Atomic Absorption Spectreoscopy (FAAS) 2- Electrothermal ( Flame-less ) Atomic Absorption Spectroscopy
JABLONSKI DIAGRAM INTERACTIONS BETWEEN LIGHT AND MATTER LIGHT AS A WAVE LIGHT AS A PARTICLE 2/1/16. Photoelectric effect Absorp<on Emission ScaDering
 INTERACTIONS BETWEEN LIGHT AND MATTER LIGHT AS A WAVE Diffrac
Lecture 7: Atomic Spectroscopy
 Lecture 7: Atomic Spectroscopy 1 Atomic spectroscopy The wavelengths of absorbance and emission from atoms in the gas phase are characteristic of atomic orbitals. 2 In the lowest energy transition, the
Ultraviolet-Visible and Infrared Spectrophotometry
 Ultraviolet-Visible and Infrared Spectrophotometry Ahmad Aqel Ifseisi Assistant Professor of Analytical Chemistry College of Science, Department of Chemistry King Saud University P.O. Box 2455 Riyadh 11451
Spectroscopy Problem Set February 22, 2018
 Spectroscopy Problem Set February, 018 4 3 5 1 6 7 8 1. In the diagram above which of the following represent vibrational relaxations? 1. Which of the following represent an absorbance? 3. Which of following
Chem 155 Midterm Exam Page 1 of 10 Spring 2010 Terrill
 Chem 155 Midterm Exam Page 1 of 10 ame Signature 1. Mercury (Hg) is is believed to be hazardous to human neurological health at extremely low concentrations. Fortunately EPA Method 45.7 cold vapor atomic
Partial Energy Level Diagrams
 Partial Energy Level Diagrams 460 nm 323 nm 610 nm 330 nm 819 nm 404 nm 694 nm 671 nm 589 / 590 nm 767 / 769 nm Lithium Sodium Potassium Gas Mixtures Maximum Temperatures, C Air-Coal Gas 1825 Air-Propane
Chapter 15 Molecular Luminescence Spectrometry
 Chapter 15 Molecular Luminescence Spectrometry Two types of Luminescence methods are: 1) Photoluminescence, Light is directed onto a sample, where it is absorbed and imparts excess energy into the material
PRINCIPLE OF ICP- AES
 INTRODUCTION Non- flame atomic emission techniques, which use electrothermal means to atomize and excite the analyte, include inductively coupled plasma and arc spark. It has been 30 years since Inductively
EEE4106Z Radiation Interactions & Detection
 EEE4106Z Radiation Interactions & Detection 2. Radiation Detection Dr. Steve Peterson 5.14 RW James Department of Physics University of Cape Town steve.peterson@uct.ac.za May 06, 2015 EEE4106Z :: Radiation
R O Y G B V. Spin States. Outer Shell Electrons. Molecular Rotations. Inner Shell Electrons. Molecular Vibrations. Nuclear Transitions
 Spin States Molecular Rotations Molecular Vibrations Outer Shell Electrons Inner Shell Electrons Nuclear Transitions NMR EPR Microwave Absorption Spectroscopy Infrared Absorption Spectroscopy UV-vis Absorption,
Chapter 4 Scintillation Detectors
 Med Phys 4RA3, 4RB3/6R03 Radioisotopes and Radiation Methodology 4-1 4.1. Basic principle of the scintillator Chapter 4 Scintillation Detectors Scintillator Light sensor Ionizing radiation Light (visible,
MOLECULAR AND ATOMIC SPECTROSCOPY
 MOLECULAR AND ATOMIC SPECTROSCOPY 1. General Background on Molecular Spectroscopy 3 1.1. Introduction 3 1.2. Beer s Law 5 1.3. Instrumental Setup of a Spectrophotometer 12 1.3.1. Radiation Sources 13 1.3.2.
Photochemical principles
 Chapter 1 Photochemical principles Dr. Suzan A. Khayyat 1 Photochemistry Photochemistry is concerned with the absorption, excitation and emission of photons by atoms, atomic ions, molecules, molecular
Taking fingerprints of stars, galaxies, and interstellar gas clouds
 - - Taking fingerprints of stars, galaxies, and interstellar gas clouds Absorption and emission from atoms, ions, and molecules Periodic Table of Elements The universe is mostly hydrogen H and helium He
Lecture 0. NC State University
 Chemistry 736 Lecture 0 Overview NC State University Overview of Spectroscopy Electronic states and energies Transitions between states Absorption and emission Electronic spectroscopy Instrumentation Concepts
Taking fingerprints of stars, galaxies, and interstellar gas clouds. Absorption and emission from atoms, ions, and molecules
 Taking fingerprints of stars, galaxies, and interstellar gas clouds Absorption and emission from atoms, ions, and molecules 1 Periodic Table of Elements The universe is mostly hydrogen H and helium He
Atomic Absorption Spectroscopy
 CH 2252 Instrumental Methods of Analysis Unit IV Atomic Absorption Spectroscopy Dr. M. Subramanian Associate Professor Department of Chemical Engineering Sri Sivasubramaniya Nadar College of Engineering
Chapter 17: Fundamentals of Spectrophotometry
 Chapter 17: Fundamentals of Spectrophotometry Spectroscopy: the science that deals with interactions of matter with electromagnetic radiation or other forms energy acoustic waves, beams of particles such
INTRODUCTION Atomic fluorescence spectroscopy ( AFS ) depends on the measurement of the emission ( fluorescence ) emitted from gasphase analyte atoms
 depends on the measurement of the emission ( fluorescence ) emitted from gasphase analyte atoms") INTRODUCTION Atomic fluorescence spectroscopy ( AFS ) depends on the measurement of the emission ( fluorescence ) emitted from gasphase analyte atoms that have been excited to higher energy levels by absorption
INTRODUCTION Atomic fluorescence spectroscopy ( AFS ) depends on the measurement of the emission ( fluorescence ) emitted from gasphase analyte atoms that have been excited to higher energy levels by absorption
ANALYSIS OF ZINC IN HAIR USING FLAME ATOMIC ABSORPTION SPECTROSCOPY
 ANALYSIS OF ZINC IN HAIR USING FLAME ATOMIC ABSORPTION SPECTROSCOPY Introduction The purpose of this experiment is to determine the concentration of zinc in a sample of hair. You will use both the calibration
Classification of spectroscopic methods
 Introduction Spectroscopy is the study of the interaction between the electromagnetic radiation and the matter. Spectrophotometry is the measurement of these interactions i.e. the measurement of the intensity
MODULE 4.3 Atmospheric analysis of particulates
 MODULE 4.3 Atmospheric analysis of particulates Measurement And Characterisation Of The Particulate Content 1 Total particulate concentration 1 Composition of the particulate 1 Determination of particle
levels. The signal is either absorbance vibrational and rotational energy levels or percent transmittance of the analyte
 1 In this chapter, absorption by molecules, rather than atoms, is considered. Absorption in the ultraviolet and visible regions occurs due to electronic transitions from the ground state to excited state.
高等食品分析 (Advanced Food Analysis) I. SPECTROSCOPIC METHODS *Instrumental methods: 1. Spectroscopic methods (spectroscopy): a) Electromagnetic radiation
 I. SPECTROSCOPIC METHODS *Instrumental methods: 1. Spectroscopic methods (spectroscopy): a) Electromagnetic radiation") *Instrumental methods: 1. Spectroscopic methods (spectroscopy): a) Electromagnetic radiation (EMR): γ-ray emission X-Ray absorption, emission, fluorescence and diffraction Vacuum ultraviolet (UV) absorption
*Instrumental methods: 1. Spectroscopic methods (spectroscopy): a) Electromagnetic radiation (EMR): γ-ray emission X-Ray absorption, emission, fluorescence and diffraction Vacuum ultraviolet (UV) absorption
Reflection = EM strikes a boundary between two media differing in η and bounces back
 Reflection = EM strikes a boundary between two media differing in η and bounces back Incident ray θ 1 θ 2 Reflected ray Medium 1 (air) η = 1.00 Medium 2 (glass) η = 1.50 Specular reflection = situation
Atomic absorption spectroscopy
 Atomic absorption spectroscopy Modern atomic absorption spectrometers Atomic absorption spectroscopy (AAS) is a spectroanalytical procedure for the quantitative determination of chemical elements using
Molecular Luminescence Spectroscopy
 Molecular Luminescence Spectroscopy In Molecular Luminescence Spectrometry ( MLS ), molecules of the analyte in solution are excited to give a species whose emission spectrum provides information for qualitative
1 WHAT IS SPECTROSCOPY?
 1 WHAT IS SPECTROSCOPY? 1.1 The Nature Of Electromagnetic Radiation Anyone who has been sunburnt will know that light packs a punch: in scientific terms, it contains considerable amounts of energy. All
Chem 434 Instrumental Analysis Test 1
 Chem 434 Instrumental Analysis Test 1 Name: 1. (15 points) In Chapter 5 we discussed four sources of instrumental noise: Thermal Noise, Shot Noise, Flicker Noise, and Environmental noise. Discuss the differences
CHAPTER 4: ANALYTICAL INSTRUMENTATION
 CHAPTER 4: ANALYTICAL INSTRUMENTATION 4.1 INTRODUCTION In this section, a review of the analytical instrumentation used during sample preparation and analysis is presented which includes an overview of
Model Answer (Paper code: AR-7112) M. Sc. (Physics) IV Semester Paper I: Laser Physics and Spectroscopy
 M. Sc. (Physics) IV Semester Paper I: Laser Physics and Spectroscopy") Model Answer (Paper code: AR-7112) M. Sc. (Physics) IV Semester Paper I: Laser Physics and Spectroscopy Section I Q1. Answer (i) (b) (ii) (d) (iii) (c) (iv) (c) (v) (a) (vi) (b) (vii) (b) (viii) (a) (ix)
Model Answer (Paper code: AR-7112) M. Sc. (Physics) IV Semester Paper I: Laser Physics and Spectroscopy Section I Q1. Answer (i) (b) (ii) (d) (iii) (c) (iv) (c) (v) (a) (vi) (b) (vii) (b) (viii) (a) (ix)
Chapter 17: Fundamentals of Spectrophotometry
 Chapter 17: Fundamentals of Spectrophotometry Spectroscopy: the science that deals with interactions of matter with electromagnetic radiation or other forms energy acoustic waves, beams of particles such
Taking Fingerprints of Stars, Galaxies, and Other Stuff. The Bohr Atom. The Bohr Atom Model of Hydrogen atom. Bohr Atom. Bohr Atom
 Periodic Table of Elements Taking Fingerprints of Stars, Galaxies, and Other Stuff Absorption and Emission from Atoms, Ions, and Molecules Universe is mostly (97%) Hydrogen and Helium (H and He) The ONLY
Spectrochemical methods
 Spectrochemical methods G. Galbács The interactions of radiations and matter are the subject of spectroscopy py or spectrochemical methods (also called spectrometry). Spectrochemical methods usually measure
Chapter 5 Light and Matter
 Chapter 5 Light and Matter Stars and galaxies are too far for us to send a spacecraft or to visit (in our lifetimes). All we can receive from them is light But there is much we can learn (composition,
9/28/10. Visible and Ultraviolet Molecular Spectroscopy - (S-H-C Chapters 13-14) Valence Electronic Structure. n σ* transitions
 Valence Electronic Structure. n σ* transitions") Visible and Ultraviolet Molecular Spectroscopy - (S-H-C Chapters 13-14) Electromagnetic Spectrum - Molecular transitions Widely used in chemistry. Perhaps the most widely used in Biological Chemistry.
Visible and Ultraviolet Molecular Spectroscopy - (S-H-C Chapters 13-14) Electromagnetic Spectrum - Molecular transitions Widely used in chemistry. Perhaps the most widely used in Biological Chemistry.
UNIVERSITI SAINS MALAYSIA. Second Semester Examination Academic Session 2004/2005. March KAA 502 Atomic Spectroscopy.
 UNIVERSITI SAINS MALAYSIA Second Semester Examination Academic Session 2004/2005 March 2005 KAA 502 Atomic Spectroscopy Time: 3 hours Please make sure this paper consists of FIVE typed pages before answering
Radionuclide Imaging MII Detection of Nuclear Emission
 Radionuclide Imaging MII 3073 Detection of Nuclear Emission Nuclear radiation detectors Detectors that are commonly used in nuclear medicine: 1. Gas-filled detectors 2. Scintillation detectors 3. Semiconductor
INDUCTIVELY COUPLED PLASMA MASS SPECTROMETRY
 INDUCTIVELY COUPLED PLASMA MASS SPECTROMETRY Edited by AKBAR MONTASER George Washington University Washington, D.C. 20052, USA WILEY-VCH New York Chichester Weinheim Brisbane Singapore Toronto CONTENTS
Analytical Chemistry II
 Analytical Chemistry II L4: Signal processing (selected slides) Computers in analytical chemistry Data acquisition Printing final results Data processing Data storage Graphical display https://www.creativecontrast.com/formal-revolution-of-computer.html
Absorption spectrometry summary
 Absorption spectrometry summary Rehearsal: Properties of light (electromagnetic radiation), dual nature light matter interactions (reflection, transmission, absorption, scattering) Absorption phenomena,
Ultraviolet-Visible and Infrared Spectrophotometry
 Ultraviolet-Visible and Infrared Spectrophotometry Ahmad Aqel Ifseisi Assistant Professor of Analytical Chemistry College of Science, Department of Chemistry King Saud University P.O. Box 2455 Riyadh 11451
Skoog Chapter 7 Components of Optical Instruments
 Skoog Chapter 7 Components of Optical Instruments General Design of Optical Instruments Sources of Radiation Wavelength Selectors (Filters, Monochromators, Interferometers) Sample Containers Radiation
Ionization Techniques Part IV
 Ionization Techniques Part IV CU- Boulder CHEM 5181 Mass Spectrometry & Chromatography Presented by Prof. Jose L. Jimenez High Vacuum MS Interpretation Lectures Sample Inlet Ion Source Mass Analyzer Detector
Energetic particles and their detection in situ (particle detectors) Part II. George Gloeckler
 Part II. George Gloeckler") Energetic particles and their detection in situ (particle detectors) Part II George Gloeckler University of Michigan, Ann Arbor, MI University of Maryland, College Park, MD Simple particle detectors Gas-filled
Energetic particles and their detection in situ (particle detectors) Part II George Gloeckler University of Michigan, Ann Arbor, MI University of Maryland, College Park, MD Simple particle detectors Gas-filled
Sample Analysis Design Polyatomic Interferences
 Sample Analysis Design Polyatomic Interferences More serious than isobaric interferences Result from possible, short-lived combination of atomic species in the plasma or during ion transfer Common recombinants
Two-electron systems
 Two-electron systems Laboratory exercise for FYSC11 Instructor: Hampus Nilsson hampus.nilsson@astro.lu.se Lund Observatory Lund University September 12, 2016 Goal In this laboration we will make use of
Secondary Ion Mass Spectroscopy (SIMS)
") Secondary Ion Mass Spectroscopy (SIMS) Analyzing Inorganic Solids * = under special conditions ** = semiconductors only + = limited number of elements or groups Analyzing Organic Solids * = under special
Secondary Ion Mass Spectroscopy (SIMS) Analyzing Inorganic Solids * = under special conditions ** = semiconductors only + = limited number of elements or groups Analyzing Organic Solids * = under special
ATOMIC STRUCTURE, ELECTRONS, AND PERIODICITY
 ATOMIC STRUCTURE, ELECTRONS, AND PERIODICITY All matter is made of atoms. There are a limited number of types of atoms; these are the elements. (EU 1.A) Development of Atomic Theory Atoms are so small
Chemistry Instrumental Analysis Lecture 34. Chem 4631
 Chemistry 4631 Instrumental Analysis Lecture 34 From molecular to elemental analysis there are three major techniques used for elemental analysis: Optical spectrometry Mass spectrometry X-ray spectrometry
Chem 321 Lecture 18 - Spectrophotometry 10/31/13
 Student Learning Objectives Chem 321 Lecture 18 - Spectrophotometry 10/31/13 In the lab you will use spectrophotometric techniques to determine the amount of iron, calcium and magnesium in unknowns. Although
Wavelength λ Velocity v. Electric Field Strength Amplitude A. Time t or Distance x time for 1 λ to pass fixed point. # of λ passing per s ν= 1 p
 Introduction to Spectroscopy (Chapter 6) Electromagnetic radiation (wave) description: Wavelength λ Velocity v Electric Field Strength 0 Amplitude A Time t or Distance x Period p Frequency ν time for 1