Developments & Limitations in GSR Analysis
|
|
|
- Baldric Allen
- 6 years ago
- Views:
Transcription
1 Developments & Limitations in GSR Analysis ENFSI Working Group Meeting June 2006 Jenny Goulden Oxford Instruments NanoAnalysis
2 Overview Introduction Developments in GSR Software Importance of EDS Hardware Particle detection
3 What do we want to achieve with GSR Accurate particle detection Accurate particle analysis Correct identification of Unique particles Relocation of specific particles for confirmation Compliance to ASTM Standard - (E 1588) GSR Analysis by SEM/EDS
4 Requirements for GSR Accurate - MUST give the right answer Particle detection/element Identification /Quantification & Classification Flexible Fast ammunition types/ different sample preparation / different environments critical for laboratories dealing with casework Ease of reporting Data Integrity
5 Particle Detection and Measurement For ALL the particles to be detected and measured correctly : Area & Field layout must be accurate Particle detection criteria must be suitable Beam relocation must be accurate Spectrum Processing must be correct
6 GSR Software INCAGSR provides: Automated analysis Flexible detection criteria, which can be optimised for SEM and particle type Analysis conditions stored in a recipe for reuse Easy and fast data reprocessing Straightforward reporting

7 INCAGSR INCA Navigator: Data is acquired through a series of logical steps Enter sample details Define area layout Grey scale calibration Define parameters for particle detection and quantification Automatically acquire data from whole area or selected fields Data classification Data reporting

8 Automated particle analysis Sample areas are defined with the aid of a stage mimic. The positions are stored and recalled for future use: Analysis achieved by dividing the sample into rectangular fields of equal area Relocate any selected area under the beam Define up to 48 areas in any one run

9 Progress monitoring Motorised microscope stage is driven to each field position in turn Detected particles are displayed during and after acquisition By predefining the position of standards monitor microscope/system stability during a run

10 Particle Detection GSR particles are typically seen as bright particles on a dark background in the BSE image. Detection of inclusions in a typical field: (a) BSE Image (b) Grey level thresholding (c) Feature detection

11 Oxford Instruments Particle Detection Criteria Signal Source - BSE / SE Magnification / Minimum required particle size 2 pass imaging technique. Pass 1 scans entire field quickly Pass 2 scans over detected particles slowly If no particles detected pass 2 is skipped Guard Zone user defined enforced field overlap to correct for particles which occur at the field boundaries

12 Particle Relocation User selects optimum conditions, SE image may be collected in addition to BSE Morphology and chemistry are measured New data may be saved Example shows a relocated GSR particle, analysed at a high magnification
13 Data Analysis Plot all data or selected classes Identify the particle number of any point on the graph Histograms Ternary plots - select up to 4 elements/oxides at each corner

14 By class or selection of classes Select a particle from the list or the field of view Select individual samples or groups of samples from a batch run for data review Particle can be relocated under the microscope beam automatically Data Review The data for each particle can be reviewed instantly


15 Importance of EDS Hardware INCAx-sight detector INCAx-stream pulse processor Combine to give superior resolution and stability
16 Detector Performance Two main indicators of detector performance: Resolution - FWHM of an element line typically measured MnKα ISO15632:2002 recognises the importance of light element detection Stability Peak stability with count rate
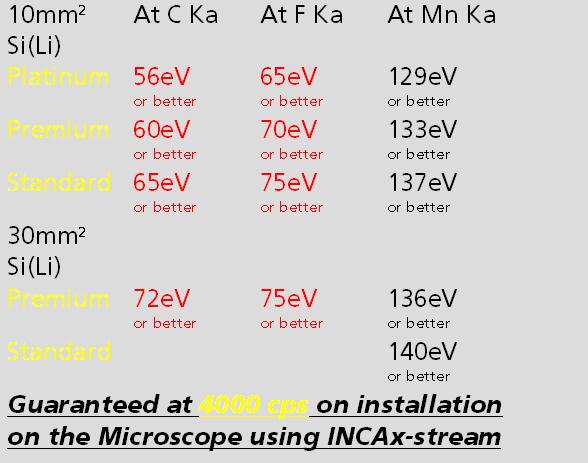
17 Detector Performance
18 INCAx-sight & INCAx-stream count rate stability guaranteed Many systems claim no variation with count rate, we can prove it Our specification is: Between 1,000 and 10,000cps peak position and resolution will change by less than 1eV Measured on MnKa at Process Time 5
19 Why is this important for GSR Analysis? When peaks are well separated small changes in resolution and position can be easily compensated When peaks are close together, the position and resolution must be known for the areas of the constituents to be correctly proportioned
20 Why is this important for GSR Analysis? This is important in GSR analysis where there are some well documented overlaps: Ba&Ti Pb& S Ca&Sb
21 GSR Overlaps - Ba/Ti Sb Ba Ti particle 1 Sb Ba Pb Sb Sb Sb Sb Sb Ti Ba Ba Ba Full Scale cts Cursor: (39406 cts) kev Ti K line overlaps with Ba L
22 GSR Overlaps - Pb/S Pb particle 1 S S Sb Sb Pb Pb Sb Sb Full Scale cts Cursor: (57702 cts) kev S K lines overlap with Pb M
23 GSR Overlaps - Sb/Ca Sb particle 1 Ba Sb Ba Pb Sb Sb Sb Ba Full Scale cts Cursor: (46895 cts) kev Ca K lines overlap with Sb L
24 GSR Spectrum Peak and resolution stability are key if the peaks are to be correctly resolved and the elements correctly identified Pb Ba Sb 22 20kV PT 4 approx 7kcps 5 seconds livetime Sb Ba Pb Pb Ba Sb Ba Ba Full Scale 247 cts Cursor: (7 cts) kev
25 Pulse Processor Performance Peak position must be reproducible for: peak shape and area to be correctly resolved, element to be correctly identified and quantified Accurate analysis requires: when count rate changes, peaks must not shift or change in resolution Key for GSR applications: possibility of peak overlaps, relatively high count rates are often used coupled with a short analysis time
26 Benefits of Peak Stability Accurate & Reliable AutoID at productive count rates even for spectra containing difficult overlaps results do not change with count rate reliable AutoID at high count rates and with the short livetimes typical for GSR analysis No need to know the elements in your sample Unexpected / Unusual ammunitions will not be overlooked
27 Benefits of Peak Stability Accurate & Reliable Quantification Correct elements are identified then the quant will be accurate Accurate & Reliable Classification whatever your ammunition
28 Particle Detection Requirements for particle detection are increasing to the sub-micron range for many applications The use of SEM with field emission sources has made the imaging of samples on the nano-scale at all kvs a reality Plano standard now includes particles in sub-micron range In GSR is the routine analysis of sub-micron particles is becoming a more common requirement?
29 Particle Detection & Analysis Factors that control the particle detection: Beam conditions - kv, spot size, beam current (W-SEM or FEG-SEM) Spot or raster beam for analysis Stage reproducibility and calibration Detection System & Sample BSE detector solid state 2 Segments or 4 Segments Background of GSR sample e.g. carbon tape or cloth Optimum time for analysis


30 Spatial Resolution of Interaction Volume at Different kvs 800 nm 300 nm 100 nm 200 nm 80 nm 550 nm 12 kev 7 KeV 3 kev Material: Fe
31 Spatial Resolution of Interaction Volume at Different kvs Higher kv larger interaction volume X-ray signal from background as well as particle The smaller the particle - the greater the X- ray signal from the background
32 Spatial Resolution of Interaction Volume at Different kvs For some particle analysis applications a lower kv is used For GSR applications kv of 20 or 25kV is typical To excite the Pb L line Achieve adequate backscatter contrast for particle detection


33 100nm Conventional W- SEM 100nm full & 4 partial hits of the beam on the particle nA; ~ 80nm Spot Size; 100nm Pixel Size,

34 Hot Field Emission SEM 100nm 100nm hits of beam on the particle nA; < 8nm Spot Size ; 100nm Pixel Size
35 Effect of Spot Size on Particle Detection Larger Spot size higher count rate poorer image quality smallest particles may be missed
36 Beam Conditions Effect of kv & spot size on image, 20kV 4nA -> good statistics (spectrum) poor quality image with W - SEM better image with FEG SEM 25kV 1nA -> acceptable statistics image acceptable on both W and FEG SEM 20kV 0.5nA -> analytical statistics poor - possibly use a large detecting crystal (30mm²), good quality image
37 Spot or Area Analysis INCAGSR option: Spot analysis - centre of the longest chord Scan over entire particle
38 Stage and Beam Calibration When detecting small particles accuracy of stage calibration and stage movement are critical The scanned raster and the stage movements must be orthogonal i.e. The sides of the image area must be parallel with the stage X and Y axes correctly tiled fields
39 Stage and Beam Calibration If the image and stage are not orthogonal the fields will not be properly tiled Gaps where particles are missed Overlapping fields were particles are counted twice particles missed particles double counted
40 System Calibration & Validation GSR a measure of confidence in your system is required INCAGSR dedicated stage and beam calibration This is then validated using a supplied particle standard


41 Regular arrays System Validation Regular grid of Au particles with a known size and position Au particles 5,10,15,20 µm Used to validate field tiling particle detection particle measurement
42 Random arrays - System Validation e.g.plano series of standards which are specifically designed for GSR validation Particle positions and chemistry known For example Plano SPS 521C with 43 Sb/Pb particles precipitated onto the surface of a silicon chip 6, 2.5 and 1.2µm size Additional Fe, Cu and Pb particles
43 System validation - Standards Conditions of analysis 20kV, 1nA probe current 2048x2048 image resolution 5 seconds live time minimum size 0.5µm 43 unique particles detected and measured correctly
44 Detection System Range of BSE-detectors are available, for example: Solid state detectors ( 2 quadrants, 4 quadrants) Robinson type detectors Scintillator based systems Micro channel detectors


45 Detection System BSE detector must be: fast response high signal/noise ratio e.g. 4 quadrant solid state detectors

46 Particle detection Find global dynamic range for BSE detector using a suitable standard e.g Mn/Rh or Cu/C Test this on known particles, of a suitable size Verify your system on a real particle
47 Analysis Time Any system can detect and measure all particles correctly slow scan speed high magnifications high magnification All result in an overall increase in analysis time Optimum conditions, for time and quality of data (e.g. 98% of particles detected and measured correctly)
48 Conclusion Software developments have created powerful and sophisticated tools for GSR applications easy of use powerful data processing Hardware is at least as important as software
49 Conclusion Particle Detection critical Influenced by a number of parameters Will differ from system to system Difficult to standardise on set of conditions that will work on every system
MT Electron microscopy Scanning electron microscopy and electron probe microanalysis
 MT-0.6026 Electron microscopy Scanning electron microscopy and electron probe microanalysis Eero Haimi Research Manager Outline 1. Introduction Basics of scanning electron microscopy (SEM) and electron
Information on the test material EDS-TM002 and the BAM software package EDX Spectrometer Test for determination of the spectrometer performance
 BAM 6.8 8.5.213 Information on the test material EDS-TM2 and the BAM software package EDX Spectrometer Test for determination of the spectrometer performance 1. Introduction Energy dispersive spectrometers
ESPRIT Feature. Innovation with Integrity. Particle detection and chemical classification EDS
 ESPRIT Feature Particle detection and chemical classification Innovation with Integrity EDS Fast and Comprehensive Feature Analysis Based on the speed and accuracy of the QUANTAX EDS system with its powerful
Auger Electron Spectroscopy Overview
 Auger Electron Spectroscopy Overview Also known as: AES, Auger, SAM 1 Auger Electron Spectroscopy E KLL = E K - E L - E L AES Spectra of Cu EdN(E)/dE Auger Electron E N(E) x 5 E KLL Cu MNN Cu LMM E f E
Electron Microprobe Analysis 1 Nilanjan Chatterjee, Ph.D. Principal Research Scientist
 12.141 Electron Microprobe Analysis 1 Nilanjan Chatterjee, Ph.D. Principal Research Scientist Massachusetts Institute of Technology Electron Microprobe Facility Department of Earth, Atmospheric and Planetary
Electron probe microanalysis - Electron microprobe analysis EPMA (EMPA) What s EPMA all about? What can you learn?
 What s EPMA all about? What can you learn?") Electron probe microanalysis - Electron microprobe analysis EPMA (EMPA) What s EPMA all about? What can you learn? EPMA - what is it? Precise and accurate quantitative chemical analyses of micron-size
Electron probe microanalysis - Electron microprobe analysis EPMA (EMPA) What s EPMA all about? What can you learn? EPMA - what is it? Precise and accurate quantitative chemical analyses of micron-size
In recent decades, oil analysis laboratories have used
 Analyze dirt with precision Automated scanning electron microscopy of particles in lubricants can help you zero in on root causes By William R. Herguth and Guy Nadeau In recent decades, oil analysis laboratories
Basic structure of SEM
 Table of contents Basis structure of SEM SEM imaging modes Comparison of ordinary SEM and FESEM Electron behavior Electron matter interaction o Elastic interaction o Inelastic interaction o Interaction
Latest advances in identifying mineral composition variation by the M4 TORNADO AMICS
 Latest advances in identifying mineral composition variation by the M4 TORNADO AMICS Bruker Nano Analytics, Berlin, Germany Webinar, June 15, 2017 Innovation with Integrity Presenters Samuel Scheller Sr.
Electron Microprobe Analysis 1 Nilanjan Chatterjee, Ph.D. Principal Research Scientist
 12.141 Electron Microprobe Analysis 1 Nilanjan Chatterjee, Ph.D. Principal Research Scientist Massachusetts Institute of Technology Electron Microprobe Facility Department of Earth, Atmospheric and Planetary
SEM. Chemical Analysis in the. Elastic and Inelastic scattering. Chemical analysis in the SEM. Chemical analysis in the SEM
 THE UNIVERSITY Chemical Analysis in the SEM Ian Jones Centre for Electron Microscopy OF BIRMINGHAM Elastic and Inelastic scattering Electron interacts with one of the orbital electrons Secondary electrons,
DDefense. MMetals. Marie C. Vicéns
 Foreign Particle Size Distribution and Characterization in Pharmaceutical Drug Products Using a High Throughput Electron Beam Analyzer Marie C. Vicéns mvicens@aspexcorp.com 1 F Forensics 2 Ia Industrial
QUANTAX. Innovation with Integrity. EDS with Slim-line Technology for SEM and TEM EDS
 QUANTAX EDS with Slim-line Technology for SEM and TEM Innovation with Integrity EDS Excellence in X-ray Analysis for the Electron Microscope The new generation of QUANTAX EDS features slim-line technology
ICP-MS. High Resolution ICP-MS.
 ICP-MS attom ES High Resolution ICP-MS www.nu-ins.com Attom ES Enhanced Sensitivity Enhanced Speed Enhanced Selectivity Enhanced Software The Attom ES from Nu Instruments is a double focussing inductively
Peter L Warren, Pamela Y Shadforth ICI Technology, Wilton, Middlesbrough, U.K.
 783 SCOPE AND LIMITATIONS XRF ANALYSIS FOR SEMI-QUANTITATIVE Introduction Peter L Warren, Pamela Y Shadforth ICI Technology, Wilton, Middlesbrough, U.K. Historically x-ray fluorescence spectrometry has
X-ray Microanalysis in Nanomaterials
 3 X-ray Microanalysis in Nanomaterials Robert Anderhalt 1. Introduction Traditionally, energy dispersive x-ray spectroscopy (EDS) in the scanning electron microscope (SEM) has been called microanalysis,
HOW TO APPROACH SCANNING ELECTRON MICROSCOPY AND ENERGY DISPERSIVE SPECTROSCOPY ANALYSIS. SCSAM Short Course Amir Avishai
 HOW TO APPROACH SCANNING ELECTRON MICROSCOPY AND ENERGY DISPERSIVE SPECTROSCOPY ANALYSIS SCSAM Short Course Amir Avishai RESEARCH QUESTIONS Sea Shell Cast Iron EDS+SE Fe Cr C Objective Ability to ask the
Everhart-Thornley detector
 SEI Detector Everhart-Thornley detector Microscope chamber wall Faraday cage Scintillator Electrons in Light pipe Photomultiplier Electrical signal out Screen Quartz window +200 V +10 kv Always contains
MS482 Materials Characterization ( 재료분석 ) Lecture Note 4: XRF
 Lecture Note 4: XRF") 2016 Fall Semester MS482 Materials Characterization ( 재료분석 ) Lecture Note 4: XRF Byungha Shin Dept. of MSE, KAIST 1 Course Information Syllabus 1. Overview of various characterization techniques (1 lecture)
2016 Fall Semester MS482 Materials Characterization ( 재료분석 ) Lecture Note 4: XRF Byungha Shin Dept. of MSE, KAIST 1 Course Information Syllabus 1. Overview of various characterization techniques (1 lecture)
Auger Electron Spectroscopy
 Auger Electron Spectroscopy Auger Electron Spectroscopy is an analytical technique that provides compositional information on the top few monolayers of material. Detect all elements above He Detection
Multi-residue analysis of pesticides by GC-HRMS
 An Executive Summary Multi-residue analysis of pesticides by GC-HRMS Dr. Hans Mol is senior scientist at RIKILT- Wageningen UR Introduction Regulatory authorities throughout the world set and enforce strict
Thermo Scientific K-Alpha + XPS Spectrometer. Fast, powerful and accessible chemical analysis for surface and thin film characterization
 Thermo Scientific K-Alpha + XPS Spectrometer Fast, powerful and accessible chemical analysis for surface and thin film characterization X-ray Photoelectron Spectroscopy Quantitative, chemical identification
Defining quality standards for the analysis of solid samples
 Defining quality standards for the analysis of solid samples Thermo Scientific Element GD Plus Glow Discharge Mass Spectrometer Redefine your quality standards for the elemental analysis of solid samples
4- Locate the channel number of the peak centroid with the software cursor and note the corresponding energy. Record these values.
 EXPERIMENT 2.1 GAMMA ENERGY CALIBRATION 1- Turn the power supply on to 900 V. Turn the NIM crate on to power the amplifiers. Turn the Oscilloscope on to check the gamma pulses. The main amplifier should
Silicon Drift Detectors: Understanding the Advantages for EDS Microanalysis. Patrick Camus, PhD Applications Scientist March 18, 2010
 Silicon Drift Detectors: Understanding the Advantages for EDS Microanalysis Patrick Camus, PhD Applications Scientist March 18, 2010 EDS Detector Requirements Detect whole energy range of x-rays 50 ev
Standards-Based Quantification in DTSA-II Part I
 Part I Nicholas W.M. Ritchie National Institute of Standards and Technology, Gaithersburg, MD 20899-8371 nicholas.ritchie@nist.gov Introduction Quantifying an X-ray spectrum is the process of converting
Fast, Effective XPS Point Analysis of Metal Components
 Application Note: 52297 Fast, Effective XPS Point Analysis of Metal Components Chris Baily and Tim Nunney, Thermo Fisher Scientific, East Grinstead, West Sussex, UK Key Words K-Alpha Auto-Analysis Multi-Spectrum
The Game-Changer in Microscopy and Microanalysis
 Personal SEM (PSEM) express : The Game-Changer in Microscopy and Microanalysis Timothy J. Drake, Ph.D. Application Specialist ASPEX Corporation July 2009 ASPEX CORPORATION 175 SHEFFIELD DRIVE DELMONT,
Quantification of JEOL XPS Spectra from SpecSurf
 Quantification of JEOL XPS Spectra from SpecSurf The quantification procedure used by the JEOL SpecSurf software involves modifying the Scofield cross-sections to account for both an energy dependency
SEAMLESS INTEGRATION OF MASS DETECTION INTO THE UV CHROMATOGRAPHIC WORKFLOW
 SEAMLESS INTEGRATION OF MASS DETECTION INTO THE UV CHROMATOGRAPHIC WORKFLOW Paula Hong, John Van Antwerp, and Patricia McConville Waters Corporation, Milford, MA, USA Historically UV detection has been
AZtec LayerProbe TM. Layer thickness and composition characterisation in the SEM. ...the ultimate non-destructive, high-resolution solution.
 AZtec LayerProbe TM EDS Layer thickness and composition characterisation in the SEM...the ultimate non-destructive, high-resolution solution 300 nm 253 nm 198 nm ds AZtec LayerProbe Overview Measure layer
CBE Science of Engineering Materials. Scanning Electron Microscopy (SEM)
") CBE 30361 Science of Engineering Materials Scanning Electron Microscopy (SEM) Scale of Structure Organization Units: micrometer = 10-6 m = 1µm nanometer= 10-9 m = 1nm Angstrom = 10-10 m = 1Å A hair is
CBE 30361 Science of Engineering Materials Scanning Electron Microscopy (SEM) Scale of Structure Organization Units: micrometer = 10-6 m = 1µm nanometer= 10-9 m = 1nm Angstrom = 10-10 m = 1Å A hair is
Multi Channel Analyzer (MCA) Analyzing a Gamma spectrum
 Analyzing a Gamma spectrum") Multi Channel Analyzer (MCA) Analyzing a Gamma spectrum Objective: Using the MCA to acquire spectrums for different gamma sources and to identify an unknown source from its spectrum, furthermore to investigate
Multi Channel Analyzer (MCA) Analyzing a Gamma spectrum Objective: Using the MCA to acquire spectrums for different gamma sources and to identify an unknown source from its spectrum, furthermore to investigate
EM-30AX is very good space utilization
 EM helps to grasp material characteristics through providing precise images. EM makes it possible to analyze deep submicron or nanometer structure. Alteration of material caused by pressure, heat can be
Introduction to Fourier Transform Infrared Spectroscopy
 Introduction to Fourier Transform Infrared Spectroscopy Introduction What is FTIR? FTIR stands for Fourier transform infrared, the preferred method of infrared spectroscopy. In infrared spectroscopy, IR
PHI 5000 Versaprobe-II Focus X-ray Photo-electron Spectroscopy
 PHI 5000 Versaprobe-II Focus X-ray Photo-electron Spectroscopy The very basic theory of XPS XPS theroy Surface Analysis Ultra High Vacuum (UHV) XPS Theory XPS = X-ray Photo-electron Spectroscopy X-ray
List of Nuclear Medicine Radionuclides. Nuclear Medicine Imaging Systems: The Scintillation Camera. Crystal and light guide
 Nuclear Medicine Imaging Systems: The Scintillation Camera List of Nuclear Medicine Radionuclides Tc99m 140.5 kev 6.03 hours I-131 364, 637 kev 8.06 days I-123 159 kev 13.0 hours I-125 35 kev 60.2 days
APPENDICES. Appendix 1
 Corthouts, T.L., Lageson, D.R., and Shaw, C.A., 2016, Polyphase deformation, dynamic metamorphism and metasomatism of Mount Everest s summit limestone, east central Himalaya, Nepal/Tibet: Lithosphere,
Development of X-ray phase imaging method using a compact high-brightness X-ray generator
 Development of X-ray phase imaging method using a compact high-brightness X-ray generator Development of X-ray phase imaging method using a compact high-brightness X-ray generator Sub-theme: Evaluation
AP5301/ Name the major parts of an optical microscope and state their functions.
 Review Problems on Optical Microscopy AP5301/8301-2015 1. Name the major parts of an optical microscope and state their functions. 2. Compare the focal lengths of two glass converging lenses, one with
AUTOMATED TEMPLATE MATCHING METHOD FOR NMIS AT THE Y-12 NATIONAL SECURITY COMPLEX
 AUTOMATED TEMPLATE MATCHING METHOD FOR NMIS AT THE Y-1 NATIONAL SECURITY COMPLEX J. A. Mullens, J. K. Mattingly, L. G. Chiang, R. B. Oberer, J. T. Mihalczo ABSTRACT This paper describes a template matching
GIS Data Processing. Eddie Breeveld MSSL/UCL
 GIS Data Processing Eddie Breeveld MSSL/UCL erb@mssl.ucl.ac.uk GIS Data Processing Introduction and status of the GIS system Planning GIS Observations Displaying GIS Data Correcting Instument Effects Fixed
Neutron Instruments I & II. Ken Andersen ESS Instruments Division
 Neutron Instruments I & II ESS Instruments Division Neutron Instruments I & II Overview of source characteristics Bragg s Law Elastic scattering: diffractometers Continuous sources Pulsed sources Inelastic
for XPS surface analysis
 Thermo Scientific Avantage XPS Software Powerful instrument operation and data processing for XPS surface analysis Avantage Software Atomic Concentration (%) 100 The premier software for surface analysis
PHI. Scanning XPS Microprobe
 PHI Scanning XPS Microprobe Unique Scanning XPS Microprobe X-ray photoelectron spectroscopy (XPS/ESA) is the most widely used surface analysis technique and has many well established industrial and research
CHARACTERIZATION OF Pu-CONTAINING PARTICLES BY X-RAY MICROFLUORESCENCE
 Copyright(c)JCPDS-International Centre for Diffraction Data 2000,Advances in X-ray Analysis,Vol.43 534 CHARACTERIZATION OF Pu-CONTAINING PARTICLES BY X-RAY MICROFLUORESCENCE Marco Mattiuzzi, Andrzej Markowicz,
Laser heating of noble gas droplet sprays: EUV source efficiency considerations
 Laser heating of noble gas droplet sprays: EUV source efficiency considerations S.J. McNaught, J. Fan, E. Parra and H.M. Milchberg Institute for Physical Science and Technology University of Maryland College
Chemical Analysis in TEM: XEDS, EELS and EFTEM. HRTEM PhD course Lecture 5
 Chemical Analysis in TEM: XEDS, EELS and EFTEM HRTEM PhD course Lecture 5 1 Part IV Subject Chapter Prio x-ray spectrometry 32 1 Spectra and mapping 33 2 Qualitative XEDS 34 1 Quantitative XEDS 35.1-35.4
BENEFITS OF IMPROVED RESOLUTION FOR EDXRF
 135 Abstract BENEFITS OF IMPROVED RESOLUTION FOR EDXRF R. Redus 1, T. Pantazis 1, J. Pantazis 1, A. Huber 1, B. Cross 2 1 Amptek, Inc., 14 DeAngelo Dr, Bedford MA 01730, 781-275-2242, www.amptek.com 2
NUCL 3000/5030 Laboratory 2 Fall 2013
 Lab #2: Passive Gamma Spec Measurements in Decoding Natural Radioactivity in SLC Area Objectives a. Learn basics of gamma spectroscopy b. Learn the equipment in Counting stations #4, #5 and #8 c. Apply
MT Electron microscopy Scanning electron microscopy and electron probe microanalysis
 MT-0.6026 Electron microscopy Scanning electron microscopy and electron probe microanalysis Eero Haimi Research Manager Outline 1. Introduction Basics of scanning electron microscopy (SEM) and electron
Whole Tablet Measurements Using the Spectrum One NTS Tablet Autosampler System
 Whole Tablet Measurements Using the Spectrum One NTS Tablet Autosampler System A P P L I C A T I O N N O T E Introduction Recent advances in NIR technology have changed the ways in which both the pharmaceutical
EDAX Microanalysis Course. Tasks
 EDAX Microanalysis Course Tasks Version 7.3 August 2009 TASKS TABLE OF CONTENTS Task 1 Electron Flight Simulation page 3 Task 2 Calibration page 4 Task 3 Geometry page 6 Introduction: Qualitative analysis
h p λ = mν Back to de Broglie and the electron as a wave you will learn more about this Equation in CHEM* 2060
 Back to de Broglie and the electron as a wave λ = mν h = h p you will learn more about this Equation in CHEM* 2060 We will soon see that the energies (speed for now if you like) of the electrons in the
EDS Mapping. Ian Harvey Fall Practical Electron Microscopy
 EDS Mapping Ian Harvey Fall 2008 1 From: Energy Dispersive X-ray Microanalysis, An Introduction Kevex Corp. 1988 Characteristic X-ray generation p.2 1 http://www.small-world.net/efs.htm X-ray generation
XUV 773: X-Ray Fluorescence Analysis of Gemstones
 Fischer Application report vr118 HELM UT FISCHER GMBH + CO. KG Institut für Elektronik und Messtechnik Industriestrasse 21-7169 Sindelfingen, Germany Tel.: (+49) 731 33- - Fax: (+49) 731 33-79 E-Mail:
Supplementary Information
 Supplementary Information Supplementary Figures Supplementary figure S1: Characterisation of the electron beam intensity profile. (a) A 3D plot of beam intensity (grey value) with position, (b) the beam
Application of Micro-Flow Imaging (MFI TM ) to The Analysis of Particles in Parenteral Fluids. October 2006 Ottawa, Canada
 to The Analysis of Particles in Parenteral Fluids. October 2006 Ottawa, Canada") Application of Micro-Flow Imaging (MFI TM ) to The Analysis of Particles in Parenteral Fluids October 26 Ottawa, Canada Summary The introduction of a growing number of targeted protein-based drug formulations
Application of Micro-Flow Imaging (MFI TM ) to The Analysis of Particles in Parenteral Fluids October 26 Ottawa, Canada Summary The introduction of a growing number of targeted protein-based drug formulations
COMPARATIVE STUDY OF PIGE, PIXE AND NAA ANALYTICAL TECHNIQUES FOR THE DETERMINATION OF MINOR ELEMENTS IN STEELS
 COMPARATIVE STUDY OF PIGE, PIXE AND NAA ANALYTICAL TECHNIQUES FOR THE DETERMINATION OF MINOR ELEMENTS IN STEELS ANTOANETA ENE 1, I. V. POPESCU 2, T. BÃDICÃ 3, C. BEªLIU 4 1 Department of Physics, Faculty
Agilent All Ions MS/MS
 Agilent All Ions MS/MS Workflow Overview A Determine fragment ions for LC/MS Quant method B Develop final Quant method Develop LC/MS Qualitative Analysis method Process data with Find by Formula Build
Scanning Electron Microscopy
 Scanning Electron Microscopy Field emitting tip Grid 2kV 100kV Anode ZEISS SUPRA Variable Pressure FESEM Dr Heath Bagshaw CMA bagshawh@tcd.ie Why use an SEM? Fig 1. Examples of features resolvable using
Geology 777 Monte Carlo Exercise I
 Geology 777 Monte Carlo Exercise I Purpose The goal of this exercise is to get you to think like an electron... to start to think about where electrons from the stream of high energy electrons go when
Become a Microprobe Power User Part 2: Qualitative & Quantitative Analysis
 Become a Microprobe Power User Part 2: Qualitative & Quantitative Analysis Mike Spilde Spring IOM Seminar February 5, 2008 Qualitative Analysis Why use qualitative scans? Elemental ID (especially trace
Ultrafast Dynamics and Single Particle Spectroscopy of Au-CdSe Nanorods
 Supporting Information Ultrafast Dynamics and Single Particle Spectroscopy of Au-CdSe Nanorods G. Sagarzazu a, K. Inoue b, M. Saruyama b, M. Sakamoto b, T. Teranishi b, S. Masuo a and N. Tamai a a Department
ATLAS EXPERIMENT : HOW THE DATA FLOWS. (Trigger, Computing, and Data Analysis)
") ATLAS EXPERIMENT : HOW THE DATA FLOWS (Trigger, Computing, and Data Analysis) In order to process large volumes of data within nanosecond timescales, the trigger system is designed to select interesting
ATLAS EXPERIMENT : HOW THE DATA FLOWS (Trigger, Computing, and Data Analysis) In order to process large volumes of data within nanosecond timescales, the trigger system is designed to select interesting
CALCULATION OF THE DETECTOR-CONTRIBUTION TO ZIRCONIUM PEAKS IN EDXRF SPECTRA OBTAINED WITH A SI-DRIFT DETECTOR
 CALCULATION OF THE DETECTOR-CONTRIBUTION TO ZIRCONIUM PEAKS IN EDXRF SPECTRA OBTAINED WITH A SI-DRIFT DETECTOR A. C. Neiva 1, J. N. Dron 1, L. B. Lopes 1 1 Escola Politécnica da Universidade de São Paulo
TESCAN S New generation of FIB-SEM microscope
 TESCAN S New generation of FIB-SEM microscope rising standards in sample preparation Key Features SEM COLUMN Versatile system for unlimited applications: resolution imaging (0.9 nm at 15 kev, 1.4 nm at
Introduction to EDS analysis. Reference Manual
 Introduction to EDS analysis Reference Manual Bruker Nano GmbH Schwarzschildstr. 12 12489 Berlin Tel. +49 (30) 670 990-0 Fax +49 (30) 670 990-30 E-mail service-berlin@bruker-nano.de Internet www.bruker.com
QuantumMCA QuantumNaI QuantumGe QuantumGold
 QuantumMCA QuantumNaI QuantumGe QuantumGold Berkeley Nucleonics Corporation (San Rafael, CA) and Princeton Gamma Tech (Princeton, NJ) have partnered to offer gamma spectroscopy with either germanium or
SCINTILLATION DETECTORS & GAMMA SPECTROSCOPY: AN INTRODUCTION
 SCINTILLATION DETECTORS & GAMMA SPECTROSCOPY: AN INTRODUCTION OBJECTIVE The primary objective of this experiment is to use an NaI(Tl) detector, photomultiplier tube and multichannel analyzer software system
Whole Tablet Measurements Using the Frontier Tablet Autosampler System
 a p p l i c a t i o n N O T E Whole Tablet Measurements Using the Frontier Tablet Autosampler System FT-NIR Spectroscopy Introduction Recent advances in NIR technology have changed the ways in which both
Trace Element Profiling of Gunshot Residues by PIXE and SEM-EDS: A Comparative Study
 Trace Element Profiling of Gunshot Residues by PIXE and SEM-EDS: A Comparative Study M. Webb, D. Cox 2, K. J. Kirkby and C. Jeynes University of Surrey Ion Beam Centre, Guildford, GU2 7XH, UK 2 Advanced
The University of Alabama 1 st APT Workshop for Earth Sciences
 The University of Alabama 1 st APT Workshop for Earth Sciences January 2016 David Reinhard LEAP 5000 www.cameca.com Microstructure characterization technique (UHV) that uses field evaporation (high electric
Observations Regarding Automated SEM and SIMS Analysis of Minerals. Kristofor Ingeneri. April 22, 2009
 Observations Regarding Automated SEM and SIMS Analysis of Minerals Kristofor Ingeneri April 22, 2009 Forensic Geoscience A field of inquiry that utilizes techniques developed in the geosciences (geology,
Chapter 9. Electron mean free path Microscopy principles of SEM, TEM, LEEM
 Chapter 9 Electron mean free path Microscopy principles of SEM, TEM, LEEM 9.1 Electron Mean Free Path 9. Scanning Electron Microscopy (SEM) -SEM design; Secondary electron imaging; Backscattered electron
POWER + FLEXIBILITY IN ELEMENTAL ANALYSIS
 POWER + FLEXIBILITY IN ELEMENTAL ANALYSIS Energy Dispersive X-Ray Fluorescence Spectrometry (EDXRF) is an atomic spectroscopy that provides elemental composition analysis of materials. The elemental range
GS Analysis of Microarray Data
 GS01 0163 Analysis of Microarray Data Keith Baggerly and Kevin Coombes Section of Bioinformatics Department of Biostatistics and Applied Mathematics UT M. D. Anderson Cancer Center kabagg@mdanderson.org
CHEM-E5225 :Electron Microscopy X-Ray Spectrometry
 CHEM-E5225 :Electron Microscopy X-Ray Spectrometry 2016.11 Yanling Ge Outline X-ray Spectrometry X-ray Spectra and Images Qualitative and Quantitative X-ray Analysis and Imaging Discussion of homework
Improvements for Absorption Spectroscopy at Beamlines A1, E4, X1
 Improvements for Absorption Spectroscopy at Beamlines A1, E4, X1 U. Brüggmann 1, N. Haack, M. Herrmann 2, S.K.J. Johnas 3, P. Kappen, K. Klementiev 4, E. Welter For an improvement of the conditions of
Gamma-Spectrum Generator
 1st Advanced Training Course ITCM with NUCLEONICA, Karlsruhe, Germany, 22-24 April, 2009 1 Gamma-Spectrum Generator A.N. Berlizov ITU - Institute for Transuranium Elements Karlsruhe - Germany http://itu.jrc.ec.europa.eu/
Micro-XRF excitation in an SEM
 X-RAY SPECTROMETRY X-Ray Spectrom. 2007; 36: 254 259 Published online 8 May 2007 in Wiley InterScience (www.interscience.wiley.com).974 Micro-XRF excitation in an SEM M. Haschke, 1 F. Eggert 2 andw.t.elam
ISPA-Tubes with YAP:Ce Active Windows for X and Gamma Ray Imaging.
 PIXEL 2000 International Workshop on Semiconductor Pixel Detectors for Particles and X-Rays Genova - Porto Antico - Magazzini del Cotone (Sala Libeccio) June 5-8, 2000 ISPA-Tubes with YAP:Ce Active Windows
Particle Analysis of Environmental Swipe Samples
 IAEA-SM-367/10/07 Particle Analysis of Environmental Swipe Samples D. DONOHUE, S. VOGT, A. CIURAPINSKI, F. RUEDENAUER, M. HEDBERG Safeguards Analytical Laboratory International Atomic Energy Agency Vienna,
FRAM V5.2. Plutonium and Uranium Isotopic Analysis Software
 V5.2 Plutonium and Uranium Isotopic Analysis Software Advanced Isotopic Ratio Analysis Software for HPGe Gamma-Ray Spectra Analyzes Pu, and a wide variety of heterogeneous samples containing Pu, Am, U,
X-Ray Measurements of the Levitated Dipole Experiment
 X-Ray Measurements of the Levitated Dipole Experiment J. L. Ellsworth, J. Kesner, MIT Plasma Science and Fusion Center, D.T. Garnier, A.K. Hansen, M.E. Mauel, Columbia University, S. Zweben, Princeton
(1) CNR-Istituto LAMEL, Via Piero Gobetti n.101, Bologna, Italy (2) PASTIS-CNRSM SCpA, S.S.7 km 714.3, Brindisi, Italy
 CNR-Istituto LAMEL, Via Piero Gobetti n.101, Bologna, Italy (2) PASTIS-CNRSM SCpA, S.S.7 km 714.3, Brindisi, Italy") Observations Microsc. Microanal. Microstruct. 499 Classification Physics Abstracts 61.16B Resolution of Semiconductor Multilayers using Backscattered Electrons in Scanning Electron Microscopy Donato Govoni(1),
Observations Microsc. Microanal. Microstruct. 499 Classification Physics Abstracts 61.16B Resolution of Semiconductor Multilayers using Backscattered Electrons in Scanning Electron Microscopy Donato Govoni(1),
Determination of the activity of radionuclides
 BUREAU NATIONAL DE MÉTROLOGIE COMMISSARIAT À L'ÉNERGIE ATOMIQUE LABORATOIRE NATIONAL HENRI BECQUEREL Note technique LNHB/04-33 Determination of the activity of radionuclides contained in volume samples
Pulsar. Delivering NMR to your benchtop
 Pulsar NMR Delivering NMR to your benchtop Pulsar TM NMR for your laboratory The Pulsar TM NMR spectrometer from Oxford Instruments delivers affordable, high performance NMR spectroscopy into the laboratory
New happenings in gamma spectroscopy data analysis Sylvie Ward Sales Support Specialist
 New happenings in gamma spectroscopy data analysis Sylvie Ward Sales Support Specialist Genie-2000 Latest Features Cascade Summing Correction LACE (Line Activity Consistency Evaluator) Interactive Nuclide
Nuclear Lifetimes. = (Eq. 1) (Eq. 2)
 (Eq. 2)") Nuclear Lifetimes Theory The measurement of the lifetimes of excited nuclear states constitutes an important experimental technique in nuclear physics. The lifetime of a nuclear state is related to its
Nuclear Lifetimes Theory The measurement of the lifetimes of excited nuclear states constitutes an important experimental technique in nuclear physics. The lifetime of a nuclear state is related to its
Exploiting the Speed of the Silicon Drift Detector to Open New Measurement Opportunities in Particle Analysis. Dale E. Newbury
 Exploiting the Speed of the Silicon Drift Detector to Open New Measurement Opportunities in Particle Analysis Dale E. Newbury National Institute of Standards and Technology Gaithersburg, MD 20899-8370
MicroBrook Eyetech. Particle Size, Shape, and Concentration Analyzer. Particle Sizing. Particle Concentration. Particle Shape
 MicroBrook Eyetech Particle Size, Shape, and Concentration Analyzer Particle Sizing Particle Shape Particle Concentration Particle Sizing Particle Shape Particle Concentration MicroBrook Eyetech Particle
S8 TIGER Series 2 for ASTM D 6443
 Lab Report XRF 139 S8 TIGER Series 2 for ASTM D 6443 Standard Test Method for Determination of Ca, Cl, Cu, Mg, P, S and Zn in Unused Lubricating Oils and Additives Introduction Lubricating oils are generally
XPS: Issues with Data Acquisition and Data Processing
 Invited Paper XPS: Issues with Data Acquisition and Data Processing J.T. Grant Research Institute University of Dayton 3 College Park, Dayton OH 45469-51, USA j.grant@ieee.org (Received: November 26, 27;
Weak-Beam Dark-Field Technique
 Basic Idea recall bright-field contrast of dislocations: specimen close to Bragg condition, s î 0 Weak-Beam Dark-Field Technique near the dislocation core, some planes curved to s = 0 ) strong Bragg reflection
Commissioning of the Hanle Autoguider
 Commissioning of the Hanle Autoguider Copenhagen University Observatory Edited November 10, 2005 Figure 1: First light image for the Hanle autoguider, obtained on September 17, 2005. A 5 second exposure
Trends in X-ray Microanalysis: Enabling Rapid Discovery One Pixel at a Time
 Trends in X-ray Microanalysis: Enabling Rapid Discovery One Pixel at a Time White Paper 52353 Key Words COMPASS, EDS, Elemental analysis, Multivariate statistical analysis (MSA), Phase-based analysis,
THE FIFTH GENERATION ELECTRON PROBE MICRO ANALYSER SX FIVE from CAMECA(France) in CRF, ISM
 in CRF, ISM") THE FIFTH GENERATION ELECTRON PROBE MICRO ANALYSER SX FIVE from CAMECA(France) in CRF, ISM The Central Research Facility (CRF) of Indian School of Mines, Dhanbad has installed Fifth Generation Electron
THE FIFTH GENERATION ELECTRON PROBE MICRO ANALYSER SX FIVE from CAMECA(France) in CRF, ISM The Central Research Facility (CRF) of Indian School of Mines, Dhanbad has installed Fifth Generation Electron
THIN FILMS FOR PHOTOVOLTAICS AND OTHER APPLICATIONS. BY Dr.A.K.SAXENA PHOTONICS DIVISION INDIAN INSTITUTE OF ASTROPHYSICS
 THIN FILMS FOR PHOTOVOLTAICS AND OTHER APPLICATIONS BY Dr.A.K.SAXENA PHOTONICS DIVISION INDIAN INSTITUTE OF ASTROPHYSICS BACKGROUND 2.8 meter coating plant at VBO, Kavalur 1.5 meter coating plant at VBO,