Time-dependence of key H-bond/electrostatic interaction distances in the sirna5-hago2 complexes... Page S14
|
|
|
- Malcolm Jenkins
- 6 years ago
- Views:
Transcription
1 Supporting Information Probing the Binding Interactions between Chemically Modified sirnas and Human Argonaute 2 Using Microsecond Molecular Dynamics Simulations S. Harikrishna* and P. I. Pradeepkumar* Department of Chemistry, Indian Institute of Technology Bombay, Mumbai India * harikrishna.s@iitb.ac.in or pradeep@chem.iitb.ac.in Table of Contents Analysis of domain orientations in AGO protein... Page S1 Figure S1 Figure S2 Figure S3 Figure S4 Figure S5 Figure S6 Figure S7 Figure S8 Figure S9 Figure S10 Figure S11 Figure S12 Figure S13 Figure S14 Figure S15 Figure S16 Figure S17 Figure S18 Table S1 Energy optimized structure and RESP charge of the 2 -O-benzyl nucleotide... Page S3 Docked structure and RMSD graph of the sirna3-hago2 complex... Page S4 Model of sirna3-hago2 complex emerged from the MD simulations... Page S5 Structural comparison between the hago2 model and the crystal structure... Page S6 Schematic representation of the noncovalent interactions in unmodified sirna-hago2 complex... Page S7 H-bond interactions in sirna3... Page S7 Local base pair parameters of sirna2/5... Page S8 Principal component and cluster analysis of the hago2... Page S9 Time-dependence of key H-bond/electrostatic interaction distances in the sirna3-hago2 complexes... Page S10 Electrosatics and van der Waals energies of the sirna3-hago2 complexes... Page S11 MD snapshots around g3 of the unmodified and the modified sirna3 - hago2 complexes... Page S12 Phosphate distance between g1 and g3 in the sirna2-hago2 complexes... Page S12 Time-dependence of key H-bond/electrostatic interaction distances in sirna2-hago2 complexes... Page S13 Time-dependence of key H-bond/electrostatic interaction distances in the sirna5-hago2 complexes... Page S14 Van der Waals interaction energies between 2'-OB modification in the sirna5 and amino acids in the PIWI domain of hago2... Page S15 MD snapshots of position g5 in the unmodified and the modified sirna5-hago2 complexes... Page S16 MD snapshots of loops around g5 in the unmodified and the 2 -MOE modified sirna5- hago2 complexes... Page S16 Time-dependence of key H-bond distances in the sirna14 and hago2 complexes.. Page S17 Time-dependent RMSD graphs of the sirna and the hago2... Page S18 sirna sequences used in the MD simulations... Page S22 References... Page S23
2 Page S1 Analysis of domain orientations in AGO protein. This analysis was performed in order to gather the domain distance parameters required to generate an open conformational model of hago2. The crystal structure of hago2 reported in complex with only guide RNA/miRNA (PDB entry: 4F3T) in which the 3'-end of the RNA interacts with the PAZ domain (Figure M1A). In this structure, the distance between the PIWI and PAZ (central cleft) domain (24.9 Å) is measured as a distance between the C-alpha atoms of Q632 and K263. The distance between the MID and PAZ (21.7 Å) domain is measured as a distance between the C-alpha atoms of R527 and T251. The distance between the N-terminal and PAZ domain (18.4 Å) is measured as a distance between the C alpha atoms of P67 and V330. Structure of hago2 reported in complex with guide-target (2-9 nt base pairing; PDB entry: 4W5O), in which the 3'-end of the RNA is interacting at the PAZ domain (Figure M1B). The domain distances were calculated using the same C-alpha atoms as in the hago2-guide RNA/miRNA complex structures. The distance between the MID and PAZ, PIWI and PAZ domains were increased from 8 to 10 Å upon the binding of target RNAs. In Thermus thermophilus AGO (TtAGO) in complex with guide: target DNA (2-19 base pairing; PDB entry: 4NCB), the distance between the PIWI and PAZ (central cleft) domain (24.9 Å) is measured as a distance between the C-alpha atoms of S572 and T201 (Figure M1C). The distance between the MID and PAZ domain (27 Å) is measured as a distance between the C-alpha atoms of S572 and T201. The distance between the N-terminal and PAZ domain (33 Å) is measured as a distance between the C-alpha atoms of G61 and K230. The accommodation of duplex in TtAGO increases the distances between the N-terminal and PAZ around 15 Å, but the accommodation of guide: target DNA duplex in hago2 increases the distance between PIWI and PAZ domain around 12 Å (Figure M1D). Structural alignment of hago2 in complex with guide-target (2-9 nt base pairing; PDB entry: 4W5O) and TtAGO in complex guide: target DNA (2-19 nt base pairing; PDB entry: 4NCB) shows that the major conformational changes are in the PAZ domain (Figure M1E). The RMSD between the two structure is 4.5 Å. The significant difference was seen in the orientation of PAZ and N-terminal domains in the enzymes (Figure M1F). All these structural alignments were carried out using DALI algorithm. 1
, MID (orange), PIWI (green), PAZ (magenta), L1 (wheatish), L2 (cyan) domains and the guide or")
3 Page S2 Figure M1. Distances between the domains and structural alignment of the argonaute proteins, N- terminal (blue), MID (orange), PIWI (green), PAZ (magenta), L1 (wheatish), L2 (cyan) domains and the guide or mirna (blue) and the target RNA (red). The protein is represented in cartoon with ribbon or cylindrical helices. RNA is represented in spheres and sticks. (A) The guide RNA/miRNA-hAGO2 complex (PDB entry: 4F3T), in which the 3'-end of the RNA is interacting at the PAZ domain. (B) The guide-target RNA-hAGO2 complex (2-9 nt base pairing; PDB entry: 4W5O), in which the 3'-end of the RNA is interacting at the PAZ domain. (C) The guide: target DNA-Thermus thermophilus AGO complex (2-19 nt base pairing; PDB entry: 4NCB). (D) Structural alignment of guide:target-hago2
4 Page S3 complex (2-9 nt base pairing; green; PDB entry: 4W5O) and guide: target DNA-TtAGO complex (2-19 base pairing; magenta; PDB entry: 4NCB). (E) Structural alignment of guide RNA-hAGO2 complex (yellow; PDB entry: 4F3T) and guide RNA-TtAGO complex (green; PDB entry: 3DLH). Black lines indicate the distance between the PIWI and N-terminal domain in hago2 and TtAGO. (F) Structural alignment of TtAGO and hago2 to show the conformational changes (black line) observed upon target RNA binding to the guide RNA in TtAGO. Similar conformational changes were not observed in the hago2 during target mrna binding. 2 Energy optimized structure and RESP charge of 2 -O-benzyl nucleotide Atom name ESP charge Atom name ESP charge P O O1P CM O2P HM O HM C CB H CB H HB C CB H HB O CB C HB H CB N HB C CB H HB C C H H C O O N H C O C H Figure S1. Energy optimized geometry and calculated RESP charges for the 2 -O-benzyl (2 -OB) nucleotide using HF/6-31G* basis set in Gaussian 09 program. 3-5
 Docked structure of the unmodified sirna3-hago2 complex. Protein is represented in cartoon, RNA backbone in cartoon and atoms in sticks.")
5 Page S4 Docked structure and RMSD graph of the sirna3-hago2 complex Figure S2. Docked structure and RMSD graph from the MD simulations of sirna3 (22 nt) and hago2 complex. (A) Docked structure of the unmodified sirna3-hago2 complex. Protein is represented in cartoon, RNA backbone in cartoon and atoms in sticks. sirna guide strand is shown in red and the passenger strand is shown in blue. (B) RMSD graph of hago2 (black) and sirna (red) from the MD simulations. RMSD is calculated using the equilibrated structure as the reference.

6 Page S5 Model of sirna3-hago2 complex emerged from the MD simulations Figure S3. Model of sirna3-hago2 complex emerged from the MD simulations. (A) Overall structure of sirna3-hago2 complex. Protein is represented in cartoon and sirna is represented in sticks and spheres. (B) Best representative structure of the hago2 protein, in which the sirna was removed to show the central nucleic acid binding channel. The tunnel is highlighted in grey. Protein is represented in surface. (C) Best representative structure of sirna3 to show the A-type RNA duplex. sirna is represented in cartoon (D) Superimposed crystal structure of sirna guide strand (green, PDB entry: 4W5O) and the sirna3 (red) emerged from the MD simulations. (E) Structural alignment of TtAGO crystal structure (blue, PDB entry: 4NCB) and hago2 model (red). (G) Structural alignment of hago2 crystal structure (green, PDB entry: 4W5O) and hago2 model (red).
 and the hago2")
7 Page S6 Structural comparison between the hago2 model and the crystal structure Figure S4. Architecture of the 5 -binding pocket in the MID domain and the structural alignment of domains between the crystal structure of hago2 (green, 2-9 nt base pairing, PDB entry: 4W5O) and the hago2 model (purple) emerged from the MD simulations. The 5'-guide RNA binding pocket in the MID domain of the protein averaged from the last 200 ns of the MD simulations of (A) sirna2- hago2 complex and (B) the hago2 crystal structure. Protein is represented in ribbon, interacting atoms are represented in sticks. RNA is represented in stick and spheres. Water molecules are shown as small non-bonded red coloured spheres. Inter molecular H-bonds are shown in dashed lines. Water mediated contacts made by R814 with the 5'-phosphate in which the side chain is significantly rotated. All the intermolecular contacts are 3.3 Å and are present during 98 % of the total simulation time. (C) Structural alignment of the linker 2, which acts as a hinge and shifts around 4 Å to accommodate the target RNA binding. Protein domains are represented in cartoon. (D) Alignment of the MID domain (RMSD ~1.5 Å) shows the rigidity of the domain indicated by the less conformational changes. (E) Alignment of N-terminal domain (RMSD ~2.3 Å) shows the moderate flexibility of the domain. (F) Alignment of PIWI domain(rmsd ~3 Å).
 sirna3-hago2, (B) sirna2/sirna5-hago2 and (C) sirna14- hago2")


8 Page S7 Schematic representation of the noncovalent interactions in unmodified sirnahago2 complex Figure S5. Schematic representation of the sirna-hago2 noncovalent interactions observed from the MD simulations of (A) sirna3-hago2, (B) sirna2/sirna5-hago2 and (C) sirna14- hago2 complexes. The interactions represented here are present >40 % of the last 800 ns MD simulations. All other interactions having < 25 % occupancies were discarded. H-bond interactions in the sirna3 Figure S6. Intramolecular H-bond interactions in the sirna3 during the course of MD simulations of sirna3-hago2 complex. (A) H-bonds between 2 -OH and O4 in the consecutive nucleotides represented by black dashed lines. sirna is represented in cartoon, guide strand in blue and the passenger strand in red. (B) H-bond interaction between 2 -OH and oxygen (OP1) between g1 and g2 indicated by black dashed lines. (C) Time-dependence of H-bond distance between g1 (2 -OH) and g2 (5 -phosphate) as shown in Figure S6B. The average H-bond distance is 2.6 Å.
9 Page S8 Local base pair parameters of sirna2/5 Figure S7. Local RNA base pair parameters from the MD simulations of the unmodified sirna2/sirna5-hago2 complex. The parameters are calculated from the ensemble averaged structure from the last 200 ns of the MD simulations using X3DNA. These parameters for the unmodified sirna3 and sirna14 were found to be similar with those of the unmodified sirna5. The translational intra base pair helical parameters such as stretch, shear and stagger are mentioned in Å. And the rotational intra base pair helical parameters such as propeller, buckle and opening are mentioned in degrees.
 First principal component mode of motion for the protein. Similar results were seen in RMSF of the protein (Figure 2C, main text).")
10 Page S9 Principal component and cluster analysis of the hago2 Figure S8. Principal component and cluster analysis of the hago2 and the unmodified sirnas from the MD simulations. (A) First principal component mode of motion for the protein. Similar results were seen in RMSF of the protein (Figure 2C, main text). Arrows indicate direction of the motion and the length of the arrows indicate the amplitude of the motion. The arrows in L1 and PAZ domain indicates that 50% motion in the first principal component. Protein is represented in cartoon. (B) Second principal component mode of motion of the protein. The first two principal component of the protein motion corresponds to the 80% motion of the MD trajectory. The most rigid domains are MID and PIWI. (C) Best representative structures from the 10 clusters are shown to depict the stability and motion of the protein domains. Protein is represented in ribbon. The disordered loops in PAZ and PIWI domains are highlighted in magenta. (D) Rotated (55 ) view of the best representative structures from the 10 clusters, which reveal the nucleic acid binding channel.
 (OP2) g3 R792 (NH1) (OP1) g4 Y790 (OH) (OP1) g4")


11 Page S10 Time-dependence of key H-bond/electrostatic interaction distances in the sirna3- hago2 complexes K566 (NZ) (OP2) g3 R792 (NH1) (OP1) g4 Y790 (OH) (OP1) g4 R795 (NH1) (O2 ) g3 N562 (OD1) (4 -C-NH2) g4 Figure S9. Time-dependence of key H-bond distances during the course of MD simulations of the sirna3-hago2 complex. The H-bonds are measured as the distances between the heavy atoms as mentioned above the graph. Black line indicates the H-bond distance with a cut-off value of 3.3 Å. The distances in the unmodified (grey), 2'-OMe (green), 4 -AM-2'-OMe (magenta), 2 -MOE (yellow), and 2 -OB (brown) modified sirnas are highlighted using different colours.

 Van der Waals interaction energies between g3 of sirna and V791 in the PIWI domain. (D) Van der Waals interaction energies between g3 of sirna and C793 in the PIWI domain of hago2.")
12 Page S11 Electrostatic and van der Waals energies of the sirna3-hago2 complexes A R792 B R795 C V791 D C793 Figure S10. Electrostatic and van der Waals interaction energies betweeen g3 in sirna3 and AAs in hago2 during the course of MD simulations. (A) Electrostatic interaction energies between g3 of sirna and R792 in the PIWI domain. (B) Electrostatic interaction energies between g3 of sirna and R795 in the PIWI domain. (C) Van der Waals interaction energies between g3 of sirna and V791 in the PIWI domain. (D) Van der Waals interaction energies between g3 of sirna and C793 in the PIWI domain of hago2. The energies in the unmodified (grey), 2'-OMe (green), 4 -AM-2'- OMe (magenta), 2 -MOE (yellow), and 2 -OB (brown) modified sirnas are highlighted using different colours. The interacting AAs are mentioned above the graph.

13 Page S12 MD snapshots around g3 of the unmodified and the modified sirna3-hago2 complexes Figure S11. Averaged MD snapshots from the last 200 ns of simulations depicting the key interactions between and position g3 in the sirna3 and the AAs in the PIWI domain. (A) Unmodified (blue), (B) 2 -MOE (yellow), and (C) 2 -OB (brown) modified sirnas. Only the interacting AAs are shown for clarity. AAs in the protein are represented in green sticks. RNA atoms and bonds are represented in spheres and sticks, respectively. The unmodified and the modified nucleotides are highlighted using different colours. The black dashed lines indicate the non-covalent interactions. Phosphate distance between g1 and g3 in the sirna3-hago2 complexes A B Figure S12. Phosphate distance between the guide strand nucleotides (g1 and g3) in the unmodified and in the modified sirna3-hago2 during the course of MD simulations. (A) Electrostatic interaction between lysine (K566) in the MID domain and the phosphate backbone in g1 and g3 of sirna. Black dashed lines indicate the electrostatic contacts. Cyan dashed line indicates the distance between the two phosphate atoms in g1 and g3. Protein is represented in cartoon and RNA is represented in spheres and sticks. (B) Time-dependence of distance between the phosphate atoms in g1 and g3 during the course of MD simulations. The distances in the unmodified (grey), 2'-OMe (green), 4 -AM-2'-OMe (magenta), 2 -MOE (yellow), and 2 -OB (brown) modified sirnas are highlighted using different colours.
 (5 -P) g1 R814 (NH1)")
 (5 -P) g1 N551 (ND2) (OP2) g2 K550(NZ) (OP1) g2 Figure")


, 4 -AM-2'-OMe")
14 Page S13 Time-dependence of key H-bond/electrostatic interaction distances in sirna2-hago2 complexes K533 (NZ) (5 -P) g1 R814 (NH1) (5 -P) g1 K570(NZ) (5 -P) g1 Q545 (NE2) (5 -P) g1 Q548 (NE2) (O2') g1 K566(NZ) (5 -P) g1 N551 (ND2) (OP2) g2 K550(NZ) (OP1) g2 Figure S13. Time-dependence of key H-bond distances during the course of MD simulations of sirna2 -hago2 complexes. The H-bond is measured as the distance between the heavy atoms as mentioned above the graphs. Black line indicates the H-bond distance with a cut-off value of 3.3 Å. The distances in the unmodified (black), 4 -AM-2'-OMe (magenta), and 2 -OB (brown) modified sirnas are highlighted using different colours.
 (OP1) g6 R792 (NH1) (OP2) g4 Y804 (OH)")


15 Page S14 Time-dependence of key H-bond/electrostatic interaction distances in the sirna5- hago2 complexes K709 (NZ) (OP1) g6 R792 (NH1) (OP2) g4 Y804 (OH) (OP1) g5 S798 (OG) (OP2) g5 H753 (ND1) (OP2) g6 Figure S14. Time-dependence of key H-bond distances during the MD simulations of sirna5- hago2 complexes. The H-bond is measured as the distance between the heavy atoms as mentioned above the graphs. Black line indicates the H-bond distance with a cut-off value of 3.3 Å. The distances in the unmodified (black), 2'-OMe (green), 4 -AM-2'-OMe (magenta), 2 -MOE (yellow), and 2 -OB (brown) modified sirnas are highlighted using different colours.
16 Page S15 Van der Waals interaction energies between 2'-OB modification in the sirna5 and amino acids in the PIWI domain of hago2 H753 A754 G755 I756 Q757 G758 T759 S760 Figure S15. Van der Waals interaction energies between 2 -OB and the AAs in the PIWI domain during the course of MD simulations of sirna5-hago2 complex. The interacting AAs are mentioned above the graphs.

 modified sirna5-hago2 complexes.")


17 Page S16 MD snapshots of position g5 in the unmodified and in the modified sirna5 -hago2 complexes Figure S16. MD snapshots depicting the binding interactions around position g5 of the unmodified and the modified sirna5-hago2 complexes. Best representative structures from the last 200 ns of the MD simulations of (A) unmodified, (B) 2 -OMe (green), (C) 4 -AM-2 -OMe (magenta) and (D) 2 -MOE (yellow) modified sirna5-hago2 complexes. Protein is represented in cartoon, interacting AAs are represented in sticks, RNA is represented in spheres and sticks. The black dashed lines indicate the non-covalent interactions between nucleotides of the sirna and the AAs of hago2. MD snapshots of the loops around g5 in the unmodified and in the 2 -MOE modified sirna5-hago2 complexes A B C Figure S17. MD snapshots depicting the orientation of the hydrophobic loop around position g5 in the unmodified and 2 -MOE modified sirna5-hago2 complexes. Best representative structures from the last 200 ns of the MD simulations of (A) unmodified and (B) 2 -MOE modified sirna5- hago2 complexes. (C) Superposition of the averaged structure of unmodified (blue) and 2 -MOE (yellow) modified sirna5-hago2 complexes.
 (O3 ) g15 Q678 (NE2) (OP2) g15 Figure S18.")

18 Page S17 Time-dependence of key H-bond distances in the sirna14-hago2 complexes Q633 (N) (OP1) g14 Q678 (N) (OP1) g15 Q675 (NE2) (O2 ) g14 Q677 (N) (OP2) g15 F676 (N) (O3 ) g15 Q678 (NE2) (OP2) g15 Figure S18. Time-dependence of the key H-bond distances during the MD simulations of sirna14 and hago2 complexes. The H-bond is measured as the distances between the heavy atoms as mentioned above the graphs. Black lines indicate the H-bond distance with a cut-off value of 3.3 Å. The distances in the unmodified (black) and 2'-OMe (green), 4 -AM-2'-OMe (magenta) modified sirnas are highlighted using different colours.
 calculated with respect to the initial structure after equilibrations.")
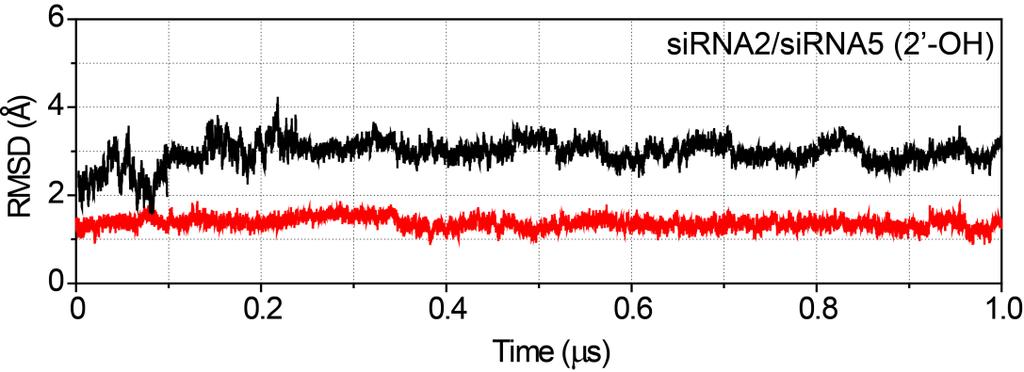
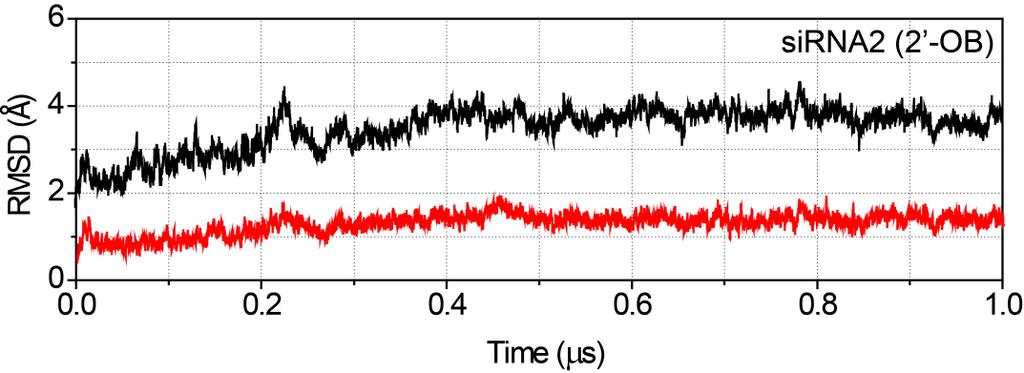
19 Page S18 Time-dependent RMSD graphs of the sirnas and the hago2 Time-dependent root-mean-square deviation (RMSD) graphs of backbone heavy atoms in the sirna (P, O5, C5, C4, C3, and O3 ; red) and in the hago2 (CA, C, and N; black) calculated with respect to the initial structure after equilibrations. Each graph is labelled with the specific name of the complex used (Table S1, Supporting Information)
20 Page S19
21 Page S20
22 Page S21
23 Page S22 sirna sequances used in the MD simulations No Sequence (passenger: guide) Modification sirna code 1 5'-GGCCUUUCACUACUCCUACUU-3' 3'-UUCCGGAAAGUGAUGAGGAUGA-5' 2 5'-GGCCUUUCACUACUCCUACUU-3' 3'-UUCCGGAAAGUGAUGAGGAUGA-5' 3 5'-GGCCUUUCACUACUCCUACUU-3' 3'-UUCCGGAAAGUGAUGAGGAUGA-5' 4 5'-GGCCUUUCACUACUCCUACUU-3' 3'-UUCCGGAAAGUGAUGAGGAUGA-5' 5 5'-GGCCUUUCACUACUCCUACUU-3' 3'-UUCCGGAAAGUGAUGAGGAUGA-5' 6 5'-AUAAGGCUAUGAAGAGAUAUU-3' 3'-UUUAUUCCGAUACUUCUCUAU-5' 7 5'-AUAAGGCUAUGAAGAGAUAUU-3' 3'-UUUAUUCCGAUACUUCUCUAU-5' 8 5'-AUAAGGCUAUGAAGAGAUAUU-3' 3'-UUUAUUCCGAUACUUCUCUAU-5' 9 5'-AUAAGGCUAUGAAGAGAUAUU-3' 3'-UUUAUUCCGAUACUUCUCUAU-5' 10 5'-AUAAGGCUAUGAAGAGAUAUU-3' 3'-UUUAUUCCGAUACUUCUCUAU-5' 11 5'-AUAAGGCUAUGAAGAGAUAUU-3' 3'-UUUAUUCCGAUACUUCUCUAU-5' 12 5'-AUAAGGCUAUGAAGAGAUAUU-3' 3'-UUUAUUCCGAUACUUCUCUAU-5' 13 5'-GGUUAACAGCGAUCUGAUAUU-3' 3'-UUCCAAUUGUCGCUAGACUAU-5' 14 5'-GGUUAACAGCGAUCUGAUAUU-3' 3'-UUCCAAUUGUCGCUAGACUAU-5' 15 5'-GGUUAACAGCGAUCUGAUAUU-3' 3'-UUCCAAUUGUCGCUAGACUAU-5' Unmodified 2'-OMe 4'-AM-2'-OMe 2'-MOE 2'-OB Unmodified 4'-AM-2'-OMe 2'-OB 2'-OMe 4'-AM-2'-OMe 2'-MOE 2'-OB Unmodified 2'-OMe 4'-AM-2'-OMe sirna3 (2 -OH) sirna3 (2'-OMe) sirna3 (4'-AM-2'- OMe) sirna3 (2'-MOE) sirna3 (2'-OB) sirna2/sirna5 (2 -OH) sirna2 (4'-AM-2'- OMe) sirna2 (2'-OB) sirna5 (2'-OMe) sirna5 (4'-AM-2'- OMe) sirna5 (2'-OMe) sirna5 (2'-OB) sirna14 (2 -OH) sirna14 (2'-OMe) sirna14 (4'-AM- 2'-OMe) Table S1. sirna sequences and position of the modifications used in the MD simulations studies. The sequences of the sirna are shown completely (22nt), but only 17 nt (from 5'-end of guide RNA) base pairing was used in MD studies. The position of modification is highlighted in red color.
24 Page S23 References (1) Shindyalov, I. N.; Bourne, P. E. Nucleic Acids Res. 2001, 29, 228. (2) Schirle, N. T.; Sheu-Gruttadauria, J.; MacRae, I. J. Science 2014, 346, 608. (3) Case, D. A., Darden, T. A., Cheatham, T. E., III, Simmerling, C. L., Wang, J., Duke, R. E., Luo, R., Walker, R. C., Zhang, W., Merz, K. M., Roberts, B., Wang, B., Hayik, S., Roitberg, A., Seabra, G., Kolossváry, I., Wong, K. F., Paesani, F., Vanicek, J., Liu, J., Wu, X., Brozell, S. R., Steinbrecher, T., Gohlke, H., Cai, Q., Ye, X., Wang, J., Hsieh, M. J., Cui, G., Roe, D. R., Mathews, D. H., Seetin, M. G., Sagui, C., Babin, V., Gusarov, S., Kovalenko, A., and Kollman, P. A. AMBER 14, University of Californai, San Francisco (4) Wang, J.; Wolf, R. M.; Caldwell, J. W.; Kollman, P. A.; Case, D. A. J. Comput. Chem. 2004, 25, (5) Cornell, W. D.; Cieplak, P.; Bayly, C. I.; Gould, I. R.; Merz, K. M.; Ferguson, D. M.; Spellmeyer, D. C.; Fox, T.; Caldwell, J. W.; Kollman, P. A. J. Am. Chem. Soc. 1995, 117, 5179.
Estimating Convergence Probability for the Hartree-Fock Algorithm for Calculating Electronic Wavefunctions for Molecules
 Estimating Convergence Probability for the Hartree-Fock Algorithm for Calculating Electronic Wavefunctions for Molecules Sofia Izmailov, Fang Liu December 14, 2012 1 Introduction In quantum mechanics,
Supporting Information Comparative Molecular Dynamics Studies of Human DNA Polymerase η
 Supporting Information Comparative Molecular Dynamics Studies of Human DNA Polymerase η Melek N. Ucisik and Sharon Hammes-Schiffer* Department of Chemistry, University of Illinois at Urbana-Champaign,
Protein structure sampling based on molecular dynamics and improvement of docking prediction
 1 1 1, 2 1 NMR X Protein structure sampling based on molecular dynamics and improvement of docking prediction Yusuke Matsuzaki, 1 Yuri Matsuzaki, 1 Masakazu Sekijima 1, 2 and Yutaka Akiyama 1 When a protein
SUPPLEMENTARY INFORMATION
 Supplementary Results DNA binding property of the SRA domain was examined by an electrophoresis mobility shift assay (EMSA) using synthesized 12-bp oligonucleotide duplexes containing unmodified, hemi-methylated,
Nitrogenase MoFe protein from Clostridium pasteurianum at 1.08 Å resolution: comparison with the Azotobacter vinelandii MoFe protein
 Acta Cryst. (2015). D71, 274-282, doi:10.1107/s1399004714025243 Supporting information Volume 71 (2015) Supporting information for article: Nitrogenase MoFe protein from Clostridium pasteurianum at 1.08
Protein-protein interactions of Human Glyoxalase II: findings of a reliable docking protocol
 Electronic Supplementary Material (ESI) for Organic & Biomolecular Chemistry. This journal is The Royal Society of Chemistry 2018 SUPPLEMENTARY INFORMATION Protein-protein interactions of Human Glyoxalase
SUPPLEMENTARY FIGURES
 SUPPLEMENTARY FIGURES Supplementary Figure 1 Protein sequence alignment of Vibrionaceae with either a 40-residue insertion or a 44-residue insertion. Identical residues are indicated by red background.
Towards fast and accurate binding affinity. prediction with pmemdgti: an efficient. implementation of GPU-accelerated. Thermodynamic Integration
 Towards fast and accurate binding affinity prediction with pmemdgti: an efficient implementation of GPU-accelerated Thermodynamic Integration Tai-Sung Lee,, Yuan Hu, Brad Sherborne, Zhuyan Guo, and Darrin
Supporting Information for. Models for the Metal Transfer Complex of the N-terminal Region of CusB and. CusF
 Supporting Information for Models for the Metal Transfer Complex of the N-terminal Region of CusB and CusF Melek N. Ucisik, Dhruva K. Chakravorty, and Kenneth M. Merz Jr. * Department of Chemistry and
Supplementary Information
 Supplementary Information Resveratrol Serves as a Protein-Substrate Interaction Stabilizer in Human SIRT1 Activation Xuben Hou,, David Rooklin, Hao Fang *,,, Yingkai Zhang Department of Medicinal Chemistry
SUPPLEMENTARY INFORMATION
 Fig. 1 Influences of crystal lattice contacts on Pol η structures. a. The dominant lattice contact between two hpol η molecules (silver and gold) in the type 1 crystals. b. A close-up view of the hydrophobic
SUPPLEMENTARY INFORMATION
 SUPPLEMENTARY INFORMATION Structure of human carbamoyl phosphate synthetase: deciphering the on/off switch of human ureagenesis Sergio de Cima, Luis M. Polo, Carmen Díez-Fernández, Ana I. Martínez, Javier
A DFT and ONIOM study of C H hydroxylation catalyzed. by nitrobenzene 1,2-dioxygenase
 Electronic Supplementary Material (ESI) for Physical Chemistry Chemical Physics. This journal is the Owner Societies 2014 A DFT and ONIOM study of C H hydroxylation catalyzed by nitrobenzene 1,2-dioxygenase
Ranjit P. Bahadur Assistant Professor Department of Biotechnology Indian Institute of Technology Kharagpur, India. 1 st November, 2013
 Hydration of protein-rna recognition sites Ranjit P. Bahadur Assistant Professor Department of Biotechnology Indian Institute of Technology Kharagpur, India 1 st November, 2013 Central Dogma of life DNA
Supporting Information
 Supporting Information A Streptavidin Binding Site Mutation Yields an Unexpected Result: An Ionized Asp128 Residue is Not Essential for Strong Biotin Binding. Loren Baugh, Isolde Le Trong, Patrick S. Stayton,
Supporting Information
 Electronic Supplementary Material (ESI) for Physical Chemistry Chemical Physics. This journal is the Owner Societies 2016 Supporting Information Lipid molecules can induce an opening of membrane-facing
A conserved P-loop anchor limits the structural dynamics that mediate. nucleotide dissociation in EF-Tu.
 Supplemental Material for A conserved P-loop anchor limits the structural dynamics that mediate nucleotide dissociation in EF-Tu. Evan Mercier 1,2, Dylan Girodat 1, and Hans-Joachim Wieden 1 * 1 Alberta
Supplementary Figure 1. Aligned sequences of yeast IDH1 (top) and IDH2 (bottom) with isocitrate
 and IDH2 (bottom) with isocitrate") SUPPLEMENTARY FIGURE LEGENDS Supplementary Figure 1. Aligned sequences of yeast IDH1 (top) and IDH2 (bottom) with isocitrate dehydrogenase from Escherichia coli [ICD, pdb 1PB1, Mesecar, A. D., and Koshland,
SUPPLEMENTARY FIGURE LEGENDS Supplementary Figure 1. Aligned sequences of yeast IDH1 (top) and IDH2 (bottom) with isocitrate dehydrogenase from Escherichia coli [ICD, pdb 1PB1, Mesecar, A. D., and Koshland,
Supplementary Information. The protease GtgE from Salmonella exclusively targets. inactive Rab GTPases
 Supplementary Information The protease GtgE from Salmonella exclusively targets inactive Rab GTPases Table of Contents Supplementary Figures... 2 Supplementary Figure 1... 2 Supplementary Figure 2... 3
SUPPLEMENTARY FIGURES. Figure S1
 SUPPLEMENTARY FIGURES Figure S1 The substrate for DH domain (2R,3R,4R,6R,7S,8S,9R)-3,7,9-trihydroxy-5-oxo-2,4,6,8 tetramethylundecanoate) was docked as two separate fragments shown in magenta and blue
Supporting Information
 Supporting Information Ottmann et al. 10.1073/pnas.0907587106 Fig. S1. Primary structure alignment of SBT3 with C5 peptidase from Streptococcus pyogenes. The Matchmaker tool in UCSF Chimera (http:// www.cgl.ucsf.edu/chimera)
NB-DNJ/GCase-pH 7.4 NB-DNJ+/GCase-pH 7.4 NB-DNJ+/GCase-pH 4.5
 SUPPLEMENTARY TABLES Suppl. Table 1. Protonation states at ph 7.4 and 4.5. Protonation states of titratable residues in GCase at ph 7.4 and 4.5. Histidine: HID, H at δ-nitrogen; HIE, H at ε-nitrogen; HIP,
Protein Dynamics. The space-filling structures of myoglobin and hemoglobin show that there are no pathways for O 2 to reach the heme iron.
 Protein Dynamics The space-filling structures of myoglobin and hemoglobin show that there are no pathways for O 2 to reach the heme iron. Below is myoglobin hydrated with 350 water molecules. Only a small
Structural Insights from Molecular Dynamics. Simulations of Tryptophan 7-Halogenase and
 Supporting Information Structural Insights from Molecular Dynamics Simulations of Tryptophan 7-Halogenase and Tryptophan 5-halogenase Jon Ainsley 1, Adrian J. Mulholland 2, Gary W. Black 1, Olivier Sparagano
Structure Investigation of Fam20C, a Golgi Casein Kinase
 Structure Investigation of Fam20C, a Golgi Casein Kinase Sharon Grubner National Taiwan University, Dr. Jung-Hsin Lin University of California San Diego, Dr. Rommie Amaro Abstract This research project
Table 1. Crystallographic data collection, phasing and refinement statistics. Native Hg soaked Mn soaked 1 Mn soaked 2
 Table 1. Crystallographic data collection, phasing and refinement statistics Native Hg soaked Mn soaked 1 Mn soaked 2 Data collection Space group P2 1 2 1 2 1 P2 1 2 1 2 1 P2 1 2 1 2 1 P2 1 2 1 2 1 Cell
Destruction of Amyloid Fibrils by Graphene through Penetration and Extraction of Peptides
 Electronic Supplementary Material (ESI) for Nanoscale. This journal is The Royal Society of Chemistry 2015 Destruction of Amyloid Fibrils by Graphene through Penetration and Extraction of Peptides Zaixing
SUPPLEMENTARY INFORMATION
 Table of Contents Page Supplementary Table 1. Diffraction data collection statistics 2 Supplementary Table 2. Crystallographic refinement statistics 3 Supplementary Fig. 1. casic1mfc packing in the R3
Nature Structural & Molecular Biology: doi: /nsmb Supplementary Figure 1
 Supplementary Figure 1 Crystallization. a, Crystallization constructs of the ET B receptor are shown, with all of the modifications to the human wild-type the ET B receptor indicated. Residues interacting
Comparing crystal structure of M.HhaI with and without DNA1, 2 (PDBID:1hmy and PDBID:2hmy),
,") Supporting Information 1. Constructing the starting structure Comparing crystal structure of M.HhaI with and without DNA1, 2 (PDBID:1hmy and PDBID:2hmy), we find that: the RMSD of overall structure and
Supporting Information 1. Constructing the starting structure Comparing crystal structure of M.HhaI with and without DNA1, 2 (PDBID:1hmy and PDBID:2hmy), we find that: the RMSD of overall structure and
SUPPLEMENTARY INFORMATION
 doi:10.1038/nature12045 Supplementary Table 1 Data collection and refinement statistics. Native Pt-SAD X-ray source SSRF BL17U SPring-8 BL41XU Wavelength (Å) 0.97947 1.07171 Space group P2 1 2 1 2 1 P2
Lipid Regulated Intramolecular Conformational Dynamics of SNARE-Protein Ykt6
 Supplementary Information for: Lipid Regulated Intramolecular Conformational Dynamics of SNARE-Protein Ykt6 Yawei Dai 1, 2, Markus Seeger 3, Jingwei Weng 4, Song Song 1, 2, Wenning Wang 4, Yan-Wen 1, 2,
Pyrogallol[4]arenes as frustrated organic solids
![Pyrogallol[4]arenes as frustrated organic solids](/thumbs/93/114493602.jpg "Pyrogallol[4]arenes as frustrated organic solids") Supporting Information Pyrogallol[4]arenes as frustrated organic solids Harshita Kumari, a Loredana Erra, b Alicia C. Webb, a Prashant Bhatt, c Charles L. Barnes, a Carol A. Deakyne, * a John E. Adams
Supporting Information Pyrogallol[4]arenes as frustrated organic solids Harshita Kumari, a Loredana Erra, b Alicia C. Webb, a Prashant Bhatt, c Charles L. Barnes, a Carol A. Deakyne, * a John E. Adams
SUPPLEMENTARY INFORMATION
 SUPPLEMENTARY INFORMATION doi:10.1038/nature11539 Supplementary Figure 1 Schematic representation of plant (A) and mammalian (B) P 2B -ATPase domain organization. Actuator (A-), nucleotide binding (N-),
Nature Structural & Molecular Biology: doi: /nsmb Supplementary Figure 1
 Supplementary Figure 1 Cryo-EM structure and model of the C. thermophilum 90S preribosome. a, Gold standard FSC curve showing the average resolution of the 90S preribosome masked and unmasked (left). FSC
SUPPLEMENTARY INFORMATION. doi: /nature07461
 Figure S1 Electrophysiology. a ph-activation of. Two-electrode voltage clamp recordings of Xenopus oocytes expressing in comparison to waterinjected oocytes. Currents were recorded at 40 mv. The ph of
SUPPLEMENTARY INFORMATION
 Figure S1. Secondary structure of CAP (in the camp 2 -bound state) 10. α-helices are shown as cylinders and β- strands as arrows. Labeling of secondary structure is indicated. CDB, DBD and the hinge are
Supporting Information
 Supporting Information Nucleosome histone tail conformation and dynamics: impacts of lysine acetylation and a nearby minor groove benzo[a]pyrene-derived lesion Iwen Fu 1, Yuqin Cai 1, Nicholas E. Geacintov
RNA Polymerase I Contains a TFIIF-Related DNA-Binding Subcomplex
 Molecular Cell, Volume 39 Supplemental Information RNA Polymerase I Contains a TFIIFRelated DNABinding Subcomplex Sebastian R. Geiger, Kristina Lorenzen, Amelie Schreieck, Patrizia Hanecker, Dirk Kostrewa,
Structural insights into WcbI, a novel polysaccharide-biosynthesis enzyme
 Volume 1 (2014) Supporting information for article: Structural insights into WcbI, a novel polysaccharide-biosynthesis enzyme Mirella Vivoli, Emily Ayres, Edward Beaumont, Michail N. Isupov and Nicholas
Impact of the crystallization condition on importin-β conformation
 Supporting information Volume 72 (2016) Supporting information for article: Impact of the crystallization condition on importin-β conformation Marcel J. Tauchert, Clément Hémonnot, Piotr Neumann, Sarah
Structure and evolution of the spliceosomal peptidyl-prolyl cistrans isomerase Cwc27
 Acta Cryst. (2014). D70, doi:10.1107/s1399004714021695 Supporting information Volume 70 (2014) Supporting information for article: Structure and evolution of the spliceosomal peptidyl-prolyl cistrans isomerase
Pymol Practial Guide
 Pymol Practial Guide Pymol is a powerful visualizor very convenient to work with protein molecules. Its interface may seem complex at first, but you will see that with a little practice is simple and powerful
Supplemental Data SUPPLEMENTAL FIGURES
 Supplemental Data CRYSTAL STRUCTURE OF THE MG.ADP-INHIBITED STATE OF THE YEAST F 1 C 10 ATP SYNTHASE Alain Dautant*, Jean Velours and Marie-France Giraud* From Université Bordeaux 2, CNRS; Institut de
Structure, mechanism and ensemble formation of the Alkylhydroperoxide Reductase subunits. AhpC and AhpF from Escherichia coli
 Structure, mechanism and ensemble formation of the Alkylhydroperoxide Reductase subunits AhpC and AhpF from Escherichia coli Phat Vinh Dip 1,#, Neelagandan Kamariah 2,#, Malathy Sony Subramanian Manimekalai
SUPPLEMENTARY INFORMATION
 doi:10.1038/nature11085 Supplementary Tables: Supplementary Table 1. Summary of crystallographic and structure refinement data Structure BRIL-NOP receptor Data collection Number of crystals 23 Space group
Applications of the Spring. Force: molecules
 Applications of the Spring Atoms interact via the coulomb force Force: molecules When atoms are far apart, they are attractive When atoms are too close, they are repulsive Atoms in a molecule display relative
Advanced Cell Biology. Lecture 7
 Advanced Cell Biology. Lecture 7 Alexey Shipunov Minot State University January 25, 2013 Shipunov (MSU) Advanced Cell Biology. Lecture 7 January 25, 2013 1 / 43 Outline Questions and answers Structure
Supporting Information
 Supporting Information Control of methylglyoxal synthesis in Bacillus subtilis: Structural basis for the regulatory interaction of the methylglyoxal synthase MgsA with the carbon flux regulator Crh Achim
Part 8 Working with Nucleic Acids
 Part 8 Working with Nucleic Acids http://cbm.msoe.edu/newwebsite/learntomodel Introduction Most Protein Databank files loaded into the CBM's Jmol Design Environment include protein structures and small
SUPPLEMENTARY INFORMATION
 Supplementary materials Figure S1 Fusion protein of Sulfolobus solfataricus SRP54 and a signal peptide. a, Expression vector for the fusion protein. The signal peptide of yeast dipeptidyl aminopeptidase
T H E J O U R N A L O F G E N E R A L P H Y S I O L O G Y. jgp
 S u p p l e m e n ta l m at e r i a l jgp Lee et al., http://www.jgp.org/cgi/content/full/jgp.201411219/dc1 T H E J O U R N A L O F G E N E R A L P H Y S I O L O G Y S u p p l e m e n ta l D I S C U S
BSc and MSc Degree Examinations
 Examination Candidate Number: Desk Number: BSc and MSc Degree Examinations 2018-9 Department : BIOLOGY Title of Exam: Molecular Biology and Biochemistry Part I Time Allowed: 1 hour and 30 minutes Marking
Supplementary Information. The Solution Structural Ensembles of RNA Kink-turn Motifs and Their Protein Complexes
 Supplementary Information The Solution Structural Ensembles of RNA Kink-turn Motifs and Their Protein Complexes Xuesong Shi, a Lin Huang, b David M. J. Lilley, b Pehr B. Harbury a,c and Daniel Herschlag
Supplementary information
 Supplementary information The structural basis of modularity in ECF-type ABC transporters Guus B. Erkens 1,2, Ronnie P-A. Berntsson 1,2, Faizah Fulyani 1,2, Maria Majsnerowska 1,2, Andreja Vujičić-Žagar
Supplementary Figure S1. Urea-mediated buffering mechanism of H. pylori. Gastric urea is funneled to a cytoplasmic urease that is presumably attached
 Supplementary Figure S1. Urea-mediated buffering mechanism of H. pylori. Gastric urea is funneled to a cytoplasmic urease that is presumably attached to HpUreI. Urea hydrolysis products 2NH 3 and 1CO 2
SUPPLEMENTARY INFORMATION
 www.nature.com/nature 1 Figure S1 Sequence alignment. a Structure based alignment of the plgic of E. chrysanthemi (ELIC), the acetylcholine binding protein from the snail Lymnea stagnalis (AchBP, PDB code
Visualization of Macromolecular Structures
 Visualization of Macromolecular Structures Present by: Qihang Li orig. author: O Donoghue, et al. Structural biology is rapidly accumulating a wealth of detailed information. Over 60,000 high-resolution
Why Proteins Fold? (Parts of this presentation are based on work of Ashok Kolaskar) CS490B: Introduction to Bioinformatics Mar.
 CS490B: Introduction to Bioinformatics Mar.") Why Proteins Fold? (Parts of this presentation are based on work of Ashok Kolaskar) CS490B: Introduction to Bioinformatics Mar. 25, 2002 Molecular Dynamics: Introduction At physiological conditions, the
Why Proteins Fold? (Parts of this presentation are based on work of Ashok Kolaskar) CS490B: Introduction to Bioinformatics Mar. 25, 2002 Molecular Dynamics: Introduction At physiological conditions, the
SUPPLEMENTARY INFORMATION
 doi:10.1038/nature11054 Supplementary Fig. 1 Sequence alignment of Na v Rh with NaChBac, Na v Ab, and eukaryotic Na v and Ca v homologs. Secondary structural elements of Na v Rh are indicated above the
Examples of Protein Modeling. Protein Modeling. Primary Structure. Protein Structure Description. Protein Sequence Sources. Importing Sequences to MOE
 Examples of Protein Modeling Protein Modeling Visualization Examination of an experimental structure to gain insight about a research question Dynamics To examine the dynamics of protein structures To
High Performance Computing
 High Performance Computing ADVANCED SCIENTIFIC COMPUTING Dr. Ing. Morris Riedel Adjunct Associated Professor School of Engineering and Natural Sciences, University of Iceland Research Group Leader, Juelich
Atomic Accessibility Radii for Molecular Dynamics Analysis
 Zuse Institute Berlin Takustr. 7 14195 Berlin Germany NORBERT LINDOW 1, DANIEL BAUM 2, HANS-CHRISTIAN HEGE 3 Atomic Accessibility Radii for Molecular Dynamics Analysis 1 0000-0001-5143-2573 2 0000-0003-1550-7245
Potassium channel gating and structure!
 Reading: Potassium channel gating and structure Hille (3rd ed.) chapts 10, 13, 17 Doyle et al. The Structure of the Potassium Channel: Molecular Basis of K1 Conduction and Selectivity. Science 280:70-77
Fig. 1. Stereo images showing (A) the best fit of the atomic model for F actin and the F actin map obtained by cryo-em and image analysis, and (B) goo
 the best fit of the atomic model for F actin and the F actin map obtained by cryo-em and image analysis, and (B) goo") Fig. 1. Stereo images showing (A) the best fit of the atomic model for F actin and the F actin map obtained by cryo-em and image analysis, and (B) good correspondence between the location of Cys374 and
Fig. 1. Stereo images showing (A) the best fit of the atomic model for F actin and the F actin map obtained by cryo-em and image analysis, and (B) good correspondence between the location of Cys374 and
Indian Institute of Science, Bangalore, India California Institute of Technology, Pasadena, CA 91125
 Date of Submission: Email: maiti@physics.iisc.ernet.in Date of Acceptance: Understanding DNA based Nanostructures Prabal K. Maiti 1+, Tod A.Pascal 2, Nagarajan Vaidehi 2,3, and William A. Goddard III 2,
SUPPLEMENTARY INFORMATION
 SUPPLMTARY IFORMATIO a doi:10.108/nature10402 b 100 nm 100 nm c SAXS Model d ulers assigned to reference- Back-projected free class averages class averages Refinement against single particles Reconstructed
Cks1 CDK1 CDK1 CDK1 CKS1. are ice- lobe. conserved. conserved
 Cks1 d CKS1 Supplementary Figure 1 The -Cks1 crystal lattice. (a) Schematic of the - Cks1 crystal lattice. -Cks1 crystallizes in a lattice that contains c 4 copies of the t - Cks1 dimer in the crystallographic
Supplementary Figure 1 Crystal packing of ClR and electron density maps. Crystal packing of type A crystal (a) and type B crystal (b).
 and type B crystal (b).") Supplementary Figure 1 Crystal packing of ClR and electron density maps. Crystal packing of type A crystal (a) and type B crystal (b). Crystal contacts at B-C loop are magnified and stereo view of A-weighted
Supplementary Figure 1 Crystal packing of ClR and electron density maps. Crystal packing of type A crystal (a) and type B crystal (b). Crystal contacts at B-C loop are magnified and stereo view of A-weighted
SUPPLEMENTARY INFORMATION
 SUPPLEMENTARY INFORMATION doi:10.1038/nature11524 Supplementary discussion Functional analysis of the sugar porter family (SP) signature motifs. As seen in Fig. 5c, single point mutation of the conserved
Experimental and Computational Mutagenesis to Investigate the. Positioning of a General Base within an Enzyme Active Site
 Experimental and Computational Mutagenesis to Investigate the Positioning of a General Base within an Enzyme Active Site Jason P. Schwans, Philip Hanoian, Benjamin J. Lengerich, Fanny Sunden, Ana Gonzalez
SUPPLEMENTARY INFORMATION
 SUPPLEMENTARY INFORMATION doi:10.1038/nature11744 Supplementary Table 1. Crystallographic data collection and refinement statistics. Wild-type Se-Met-BcsA-B SmCl 3 -soaked EMTS-soaked Data collection Space
Synthesis and Fluorescence Properties of 3,6-Diaminocarbazole- Modified Pyrrolidinyl Peptide Nucleic Acid
 Electronic Supplementary Material (ESI) for RSC Advances. This journal is The Royal Society of Chemistry 2016 1 Synthesis and Fluorescence Properties of 3,6-Diaminocarbazole- Modified Pyrrolidinyl Peptide
An Informal AMBER Small Molecule Force Field :
 An Informal AMBER Small Molecule Force Field : parm@frosst Credit Christopher Bayly (1992-2010) initiated, contributed and lead the efforts Daniel McKay (1997-2010) and Jean-François Truchon (2002-2010)
LS1a Fall 2014 Problem Set #2 Due Monday 10/6 at 6 pm in the drop boxes on the Science Center 2 nd Floor
 LS1a Fall 2014 Problem Set #2 Due Monday 10/6 at 6 pm in the drop boxes on the Science Center 2 nd Floor Note: Adequate space is given for each answer. Questions that require a brief explanation should
From Amino Acids to Proteins - in 4 Easy Steps
 From Amino Acids to Proteins - in 4 Easy Steps Although protein structure appears to be overwhelmingly complex, you can provide your students with a basic understanding of how proteins fold by focusing
Softwares for Molecular Docking. Lokesh P. Tripathi NCBS 17 December 2007
 Softwares for Molecular Docking Lokesh P. Tripathi NCBS 17 December 2007 Molecular Docking Attempt to predict structures of an intermolecular complex between two or more molecules Receptor-ligand (or drug)
Supplementary Figures. Measuring Similarity Between Dynamic Ensembles of Biomolecules
 Supplementary Figures Measuring Similarity Between Dynamic Ensembles of Biomolecules Shan Yang, Loïc Salmon 2, and Hashim M. Al-Hashimi 3*. Department of Chemistry, University of Michigan, Ann Arbor, MI,
Supplementary information for cloud computing approaches for prediction of ligand binding poses and pathways
 Supplementary information for cloud computing approaches for prediction of ligand binding poses and pathways Morgan Lawrenz 1, Diwakar Shukla 1,2 & Vijay S. Pande 1,2 1 Department of Chemistry, Stanford
Structural insights into Aspergillus fumigatus lectin specificity - AFL binding sites are functionally non-equivalent
 Acta Cryst. (2015). D71, doi:10.1107/s1399004714026595 Supporting information Volume 71 (2015) Supporting information for article: Structural insights into Aspergillus fumigatus lectin specificity - AFL
Villa et al. (2005) Structural dynamics of the lac repressor-dna complex revealed by a multiscale simulation. PNAS 102:
 Structural dynamics of the lac repressor-dna complex revealed by a multiscale simulation. PNAS 102:") Villa et al. (2005) Structural dynamics of the lac repressor-dna complex revealed by a multiscale simulation. PNAS 102: 6783-6788. Background: The lac operon is a cluster of genes in the E. coli genome
Villa et al. (2005) Structural dynamics of the lac repressor-dna complex revealed by a multiscale simulation. PNAS 102: 6783-6788. Background: The lac operon is a cluster of genes in the E. coli genome
Anion binding in aqueous media by a tetra-triazolium macrocycle
 Supporting Information for Anion binding in aqueous media by a tetra-triazolium macrocycle Nicholas G. White, a Sílvia Carvalho, b Vítor Félix, b & Paul D. Beer a * a Chemistry Research Laboratory, Department
1. (5) Draw a diagram of an isomeric molecule to demonstrate a structural, geometric, and an enantiomer organization.
 Draw a diagram of an isomeric molecule to demonstrate a structural, geometric, and an enantiomer organization.") Organic Chemistry Assignment Score. Name Sec.. Date. Working by yourself or in a group, answer the following questions about the Organic Chemistry material. This assignment is worth 35 points with the
Organic Chemistry Assignment Score. Name Sec.. Date. Working by yourself or in a group, answer the following questions about the Organic Chemistry material. This assignment is worth 35 points with the
Acta Cryst. (2014). D70, doi: /s
. D70, doi: /s") Acta Cryst. (2014). D70, doi:10.1107/s1399004714021166 Supporting information Volume 70 (2014) Supporting information for article: Elucidation of the bicarbonate binding site and insights into the carboxylation
Acta Cryst. (2014). D70, doi:10.1107/s1399004714021166 Supporting information Volume 70 (2014) Supporting information for article: Elucidation of the bicarbonate binding site and insights into the carboxylation
How Tertiary Interactions Between the L2 and L3 Loops Affect the Dynamics of the Distant Ligand Binding Site in the Guanine Sensing Riboswitch
 How Tertiary Interactions Between the L2 and L3 Loops Affect the Dynamics of the Distant Ligand Binding Site in the Guanine Sensing Riboswitch Christian A. Hanke and Holger Gohlke Institute for Pharmaceutical
Supporting Information
 Electronic Supplementary Material (ESI) for Nanoscale. This journal is The Royal Society of Chemistry 207 Supporting Information Carbon Nanoscroll- Silk Crystallite Hybrid Structure with Controllable Hydration
Supplementary Figure 1 Schematic overview of ASTNs in neuronal migration. (a) Schematic of roles played by ASTNs 1 and 2. ASTN-1-mediated adhesions
 Schematic of roles played by ASTNs 1 and 2. ASTN-1-mediated adhesions") Supplementary Figure 1 Schematic overview of ASTNs in neuronal migration. (a) Schematic of roles played by ASTNs 1 and 2. ASTN-1-mediated adhesions undergo endocytosis into clathrin-coated vesicles dependent
Supplementary Figure 1 Schematic overview of ASTNs in neuronal migration. (a) Schematic of roles played by ASTNs 1 and 2. ASTN-1-mediated adhesions undergo endocytosis into clathrin-coated vesicles dependent
Equilibrated atomic models of outward-facing P-glycoprotein and effect of ATP binding on structural dynamics (Supplementary Information)
") Equilibrated atomic models of outward-facing P-glycoprotein and effect of ATP binding on structural dynamics (Supplementary Information) Lurong Pan 1 and Stephen G. Aller 2 * 1,2 Department of Pharmacology
Equilibrated atomic models of outward-facing P-glycoprotein and effect of ATP binding on structural dynamics (Supplementary Information) Lurong Pan 1 and Stephen G. Aller 2 * 1,2 Department of Pharmacology
Supplementary Figure 3 a. Structural comparison between the two determined structures for the IL 23:MA12 complex. The overall RMSD between the two
 Supplementary Figure 1. Biopanningg and clone enrichment of Alphabody binders against human IL 23. Positive clones in i phage ELISA with optical density (OD) 3 times higher than background are shown for
Protein Structure. W. M. Grogan, Ph.D. OBJECTIVES
 Protein Structure W. M. Grogan, Ph.D. OBJECTIVES 1. Describe the structure and characteristic properties of typical proteins. 2. List and describe the four levels of structure found in proteins. 3. Relate
DISCRETE TUTORIAL. Agustí Emperador. Institute for Research in Biomedicine, Barcelona APPLICATION OF DISCRETE TO FLEXIBLE PROTEIN-PROTEIN DOCKING:
 DISCRETE TUTORIAL Agustí Emperador Institute for Research in Biomedicine, Barcelona APPLICATION OF DISCRETE TO FLEXIBLE PROTEIN-PROTEIN DOCKING: STRUCTURAL REFINEMENT OF DOCKING CONFORMATIONS Emperador
Crystal Structure of Fibroblast Growth Factor 9 (FGF9) Reveals Regions. Implicated in Dimerization and Autoinhibition
 Reveals Regions. Implicated in Dimerization and Autoinhibition") JBC Papers in Press. Published on November 1, 2000 as Manuscript M006502200 Crystal Structure of Fibroblast Growth Factor 9 (FGF9) Reveals Regions Implicated in Dimerization and Autoinhibition 1 Copyright
JBC Papers in Press. Published on November 1, 2000 as Manuscript M006502200 Crystal Structure of Fibroblast Growth Factor 9 (FGF9) Reveals Regions Implicated in Dimerization and Autoinhibition 1 Copyright
IULTCS 2005 Heidemann Lecture
 IULTCS 2005 Heidemann Lecture A Molecular Dynamics Approach to the Supramolecular Structure of Collagen and Related Binding Properties Simona Bronco, Chiara Cappelli, Francesco Ciardelli, INFM, Polylab,
of the Guanine Nucleotide Exchange Factor FARP2
 Structure, Volume 21 Supplemental Information Structural Basis for Autoinhibition of the Guanine Nucleotide Exchange Factor FARP2 Xiaojing He, Yi-Chun Kuo, Tyler J. Rosche, and Xuewu Zhang Inventory of
Nature Structural & Molecular Biology: doi: /nsmb Supplementary Figure 1
 Supplementary Figure 1 Identification of the ScDcp2 minimal region interacting with both ScDcp1 and the ScEdc3 LSm domain. Pull-down experiment of untagged ScEdc3 LSm with various ScDcp1-Dcp2-His 6 fragments.
Supplementary Materials for
 advances.sciencemag.org/cgi/content/full/4/1/eaau413/dc1 Supplementary Materials for Structure and dynamics conspire in the evolution of affinity between intrinsically disordered proteins Per Jemth*, Elin
Supporting Information. Pterosin Sesquiterpenoids from Pteris cretica as Hypolipidemic Agents. via Activating Liver X Receptors
 Supporting Information Pterosin Sesquiterpenoids from Pteris cretica as Hypolipidemic Agents via Activating Liver X Receptors Xiangkun Luo, Chanjuan Li, Pan Luo, Xin Lin, Hang Ma, Navindra P. Seeram, Ching
Carbazole Derivatives Binding to c-kit G-quadruplex DNA
 Supplementary Materials Carbazole Derivatives Binding to c-kit G-quadruplex DNA Agata Głuszyńska 1, *, Bernard Juskowiak 1, Martyna Kuta-Siejkowska 2, Marcin Hoffmann 2 and Shozeb Haider 3 1 Laboratory
Table S1. Overview of used PDZK1 constructs and their binding affinities to peptides. Related to figure 1.
 Table S1. Overview of used PDZK1 constructs and their binding affinities to peptides. Related to figure 1. PDZK1 constru cts Amino acids MW [kda] KD [μm] PEPT2-CT- FITC KD [μm] NHE3-CT- FITC KD [μm] PDZK1-CT-
PROTEIN STRUCTURE PREDICTION USING GAS PHASE MOLECULAR DYNAMICS SIMULATION: EOTAXIN-3 CYTOKINE AS A CASE STUDY
 International Conference Mathematical and Computational Biology 2011 International Journal of Modern Physics: Conference Series Vol. 9 (2012) 193 198 World Scientific Publishing Company DOI: 10.1142/S2010194512005259