Chapter 15 Sampling Distribution Models
|
|
|
- Leon Nelson
- 6 years ago
- Views:
Transcription

1 Chapter 15 Sampling Distribution Models 1
2 15.1 Sampling Distribution of a Proportion 2

3 Sampling About Evolution According to a Gallup poll, 43% believe in evolution. Assume this is true of all Americans. If many surveys were done of 1007 Americans, we could calculate the sample proportion for each. The histogram shows the distribution of a simulation of 2000 sample proportions. The distribution of all possible sample proportions from samples with the same sample size is called the sampling distribution. 3
4 Sampling Distributions Sampling Distribution for Proportions Symmetric Unimodal Centered at p The sampling distribution follows the Normal model. What does the sampling distribution tell us? The sampling distribution allows us to make statements about where we think the corresponding population parameter is and how precise these statements are likely to be. 4

5 Sampling Distribution for Smoking 18% of US adults smoke. How much would we expect the proportion of smokers in a sample of size 1000 to vary from sample to sample? A histogram was drawn to display the results of a simulation. The mean is 0.18 = the population proportion. The standard deviation was calculated as Normal: rule works. 95% of all proportions are within of the mean. This is very close to the true value: 95.41% 5
6 Thinking about Many Samples Distribution of the Sample Variable was the answer to the survey question or the result of an experiment. Proportion is a fixed value that comes from the one sample. Sampling Distribution Variable is the proportion that comes from the entire sample. Many proportions that differ from one to another, each coming from a different sample. 6
7 Mean and Standard Deviation Sampling Distribution for Proportions Mean = p ˆ npq σ( p) = = n pq n N p, pq n 7

8 The Normal Model for Evolution Population: p = 0.43, n = Sampling Distribution: Mean = 0.43 Standard deviation = σ( pˆ ) =
9 Smokers Revisited p = 0.18, n = 1000 Standard deviation = σ( pˆ ) = Standard deviation from simulation: The sample-to-sample standard deviation is called the standard error or sampling variability. The standard error is not an error, since no error has been made. 9
10 15.2 When Does the Normal Model Work? Assumptions and Conditions 10

11 When Does the Normal Model Work? Success Failure Condition: np 10, nq 10 There must be at least 10 expected successes and failures. Independent trials: Check for the Randomization Condition. 10% Condition: Sample size less than 10% of the population size 11
12 Understanding Health Risks 22% of US women have a BMI that is above the 25 healthy mark. Only 31 of the 200 randomly chosen women from a large college had a BMI above 25. Is this proportion unusually small? Randomization Condition: Yes, the women were randomly chosen. 10% Condition: For a large college, this is ok. Success Failure Condition: 31 10, Yes, the Normal model can be used. 12
13 Understanding Health Risks: n = 200, p = 0.22, x = 31 ˆ 31 = = 0.155, = 0.22, 200 p p SD pˆ z = = Rule: Values 2 SD below the mean occur less than 2.5% of the time. Perhaps this college has a higher proportion of healthy women, or women who lie about their weight. 13
14 Enough Lefty Seats? 13% of all people are left handed. A 200-seat auditorium has 15 lefty seats. What is the probability that there will not be enough lefty seats for a class of 90 students? Think Plan: 15/ , Want Model: P pˆ > Independence Assumption: With respect to lefties, the students are independent. 10% Condition: This is out of all people. Success/Failure Condition: 15 10,
15 Enough Lefty Seats? Think Model: p = 0.13, SD pˆ = The model is: N(0.13, 0.035) Show Plot Mechanics: z = P( pˆ > 0.167) = P( z >1.06)
16 Enough Lefty Seats? Tell Conclusion: There is about a 14.5% chance that there will not be enough seats for the left handed students in the class. 16
17 15.3 The Sampling Distribution of Other Statistics 17
18 The Sampling Distribution for Others There is a sampling distribution for any statistic, but the Normal model may not fit. Below are histograms showing results of simulations of sampling distributions. 18
19 The Sampling Distribution For Others The medians seem to be approximately Normal. The variances seem somewhat skewed right. The minimums are all over the place. In this course, we will focus on the proportions and the means. 19


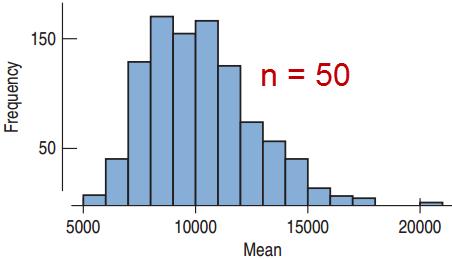
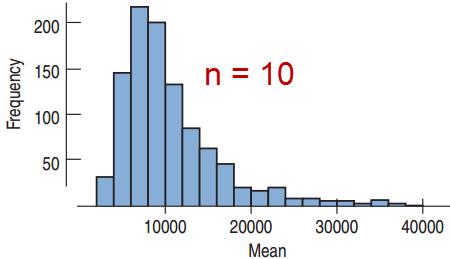
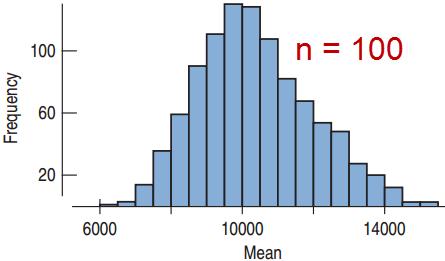
20 Sampling Distribution of the Means For 1 die, the distribution is Uniform. For 3 dice, the sampling distribution for the means is closer to Normal. For 20 dice, the sampling distribution for the means is very close to normal. The standard deviation is much smaller. 20
21 15.4 The Central Limit Theorem: The Fundamental Theorem of Statistics 21
22 The Central Limit Theorem The Central Limit Theorem The sampling distribution of any mean becomes nearly Normal as the sample size grows. Requirements Independent Randomly collected sample The sampling distribution of the means is close to Normal if either: Large sample size Population close to Normal 22

23 How Normal? 23
24 Population Distribution and Sampling Distribution of the Means Population Distribution Sampling Distribution for the Means Normal Normal (any sample size) Uniform Bimodal Skewed Normal (large sample size) Normal (larger sample size) Normal (larger sample size) 24
25 Binomial Distributions and the Central Limit Theorem Consider a Bernoulli trial as quantitative: Success = 1 Failure = 0 The mean of many trials is just ˆp. This distribution of a single trial is far from Normal. By the Central Limit Theorem, the Binomial distribution is approximately normal for large sample sizes. 25
26 Standard Deviation of the Means Which would be more unusual: a student who is 6 9 tall in the class or a class that has mean height of 6 9? The sample means have a smaller standard deviation than the individuals. The standard deviation of the sample means goes down by the square root of the sample size: SD y = σ n 26
27 The Sampling Distribution Model for a Mean When a random sample is drawn from a population with mean m and standard deviation s, the sampling distribution has: Mean: m σ Standard Deviation: n For large sample size, the distribution is approximately normal regardless of the population the random sample comes from. The larger the sample size, the closer to Normal. 27
28 Low BMI Revisited The 200 college women with the low BMI reported a mean weight of only 140 pounds. For all 18-year-old women, m = and s = Does the mean weight seem exceptionally low? Randomization Condition: The women were a random sample with weights independent. Sample size Condition: Weights are approximately Normal. 200 is large enough. 28
29 Low BMI Revisited Mean and Standard Deviation of the sampling distribution μ( y) =143.7 The rule suggests that the mean is low but not that unusual. Such variability is not extraordinary for samples of this size. σ SD( y ) = = 3.64 n

30 Too Heavy for the Elevator? Mean weight of US men is 190 lb, the standard deviation is 59 lb. An elevator has a weight limit of 10 persons or 2500 lb. Find the probability that 10 men in the elevator will overload the weight limit. Think Plan: 10 over 2500 lb same as their mean over 250. Model: Independence Assumption: Not random, but probably independent. Sample Size Condition: Weight approx. Normal. 30
31 Too Heavy for the Elevator Think Model: m = 190, s = 59 By the CLT, the sampling distribution of approximately Normal: σ 59 μ( y ) =190, SD( y ) = = n 10 Show Plot: y is 31
32 Too Heavy for the Elevator? Mechanics: Tell y μ z = = 3.21 SD ( y ) P( y > 250) P( z >3.21) Conclusion: There is only a chance that the 10 men will exceed the elevator s weight limit. 32
33 15.5 Sampling Distributions: A Summary 33
34 Sample Size and Standard Deviation SD( y ) = σ n SD( pˆ ) = pq n Larger sample size Smaller standard deviation Multiply n by 4 Divide the standard deviation by 2. Need a sample size of 100 to reduce the standard deviation by a factor of
35 Billion Dollar Misunderstanding Bill and Melinda Gates Foundation found that the 12% of the top 50 performing schools were from the smallest 3%. They funded a transformation to small schools. Small schools have a smaller n, thus a higher standard deviation. y Likely to see both higher and lower means. 18% of the bottom 50 were also from the smallest 3%. 35
36 Distribution of the Sample vs. the Sampling Distribution Don t confuse the distribution of the sample and the sampling distribution. If the population s distribution is not Normal, then the sample s distribution will not be normal even if the sample size is very large. For large sample sizes, the sampling distribution, which is the distribution of all possible sample means from samples of that size, will be approximately Normal. 36
37 Two Truths About Sampling Distributions Sampling distributions arise because samples vary. Each random sample will contain different cases and, so, a different value of the statistic. Although we can always simulate a sampling distribution, the Central Limit Theorem saves us the trouble for proportions and means. This is especially important when we do not know the population s distribution. 37
38 38
39 What Can Go Wrong? Don t confuse the sampling distribution with the distribution of the sample. A histogram of the data shows the sample s distribution. The sampling distribution is more theoretical. Beware of observations that are not independent. The CLT fails for dependent samples. A good survey design can ensure independence. Watch out for small samples from skewed or bimodal populations. The CLT requires large samples or a Normal population or both. 39
STA Why Sampling? Module 6 The Sampling Distributions. Module Objectives
 STA 2023 Module 6 The Sampling Distributions Module Objectives In this module, we will learn the following: 1. Define sampling error and explain the need for sampling distributions. 2. Recognize that sampling
Chapter 18. Sampling Distribution Models. Copyright 2010, 2007, 2004 Pearson Education, Inc.
 Chapter 18 Sampling Distribution Models Copyright 2010, 2007, 2004 Pearson Education, Inc. Normal Model When we talk about one data value and the Normal model we used the notation: N(μ, σ) Copyright 2010,
Sampling Distribution Models. Chapter 17
 Sampling Distribution Models Chapter 17 Objectives: 1. Sampling Distribution Model 2. Sampling Variability (sampling error) 3. Sampling Distribution Model for a Proportion 4. Central Limit Theorem 5. Sampling
Sampling Distribution Models. Central Limit Theorem
 Sampling Distribution Models Central Limit Theorem Thought Questions 1. 40% of large population disagree with new law. In parts a and b, think about role of sample size. a. If randomly sample 10 people,
Chapter 18. Sampling Distribution Models /51
 Chapter 18 Sampling Distribution Models 1 /51 Homework p432 2, 4, 6, 8, 10, 16, 17, 20, 30, 36, 41 2 /51 3 /51 Objective Students calculate values of central 4 /51 The Central Limit Theorem for Sample
From the Data at Hand to the World at Large
 From the Data at Hand to the World at Large PART V Chapter 18 Sampling Distribution Models Chapter 19 Confidence Intervals for Proportions Chapter 20 Testing Hypotheses About Proportions Chapter 21 More
STA Module 8 The Sampling Distribution of the Sample Mean. Rev.F08 1
 STA 2023 Module 8 The Sampling Distribution of the Sample Mean Rev.F08 1 Module Objectives 1. Define sampling error and explain the need for sampling distributions. 2. Find the mean and standard deviation
( ) P A B : Probability of A given B. Probability that A happens
 P A B : Probability of A given B. Probability that A happens") A B A or B One or the other or both occurs At least one of A or B occurs Probability Review A B A and B Both A and B occur ( ) P A B : Probability of A given B. Probability that A happens given that B
A B A or B One or the other or both occurs At least one of A or B occurs Probability Review A B A and B Both A and B occur ( ) P A B : Probability of A given B. Probability that A happens given that B
CHAPTER 7. Parameters are numerical descriptive measures for populations.
 CHAPTER 7 Introduction Parameters are numerical descriptive measures for populations. For the normal distribution, the location and shape are described by µ and σ. For a binomial distribution consisting
ACMS Statistics for Life Sciences. Chapter 13: Sampling Distributions
 ACMS 20340 Statistics for Life Sciences Chapter 13: Sampling Distributions Sampling We use information from a sample to infer something about a population. When using random samples and randomized experiments,
Lecture 7: Confidence interval and Normal approximation
 Lecture 7: Confidence interval and Normal approximation 26th of November 2015 Confidence interval 26th of November 2015 1 / 23 Random sample and uncertainty Example: we aim at estimating the average height
Chapter 18. Sampling Distribution Models. Bin Zou STAT 141 University of Alberta Winter / 10
 Chapter 18 Sampling Distribution Models Bin Zou (bzou@ualberta.ca) STAT 141 University of Alberta Winter 2015 1 / 10 Population VS Sample Example 18.1 Suppose a total of 10,000 patients in a hospital and
Test 3 SOLUTIONS. x P(x) xp(x)
 xp(x)") 16 1. A couple of weeks ago in class, each of you took three quizzes where you randomly guessed the answers to each question. There were eight questions on each quiz, and four possible answers to each
16 1. A couple of weeks ago in class, each of you took three quizzes where you randomly guessed the answers to each question. There were eight questions on each quiz, and four possible answers to each
Chapter 8: Sampling Distributions. A survey conducted by the U.S. Census Bureau on a continual basis. Sample
 Chapter 8: Sampling Distributions Section 8.1 Distribution of the Sample Mean Frequently, samples are taken from a large population. Example: American Community Survey (ACS) A survey conducted by the U.S.
Chapter 18: Sampling Distribution Models
 Chapter 18: Sampling Distribution Models Suppose I randomly select 100 seniors in Scott County and record each one s GPA. 1.95 1.98 1.86 2.04 2.75 2.72 2.06 3.36 2.09 2.06 2.33 2.56 2.17 1.67 2.75 3.95
Probability and Probability Distributions. Dr. Mohammed Alahmed
 Probability and Probability Distributions 1 Probability and Probability Distributions Usually we want to do more with data than just describing them! We might want to test certain specific inferences about
Chapitre 3. 5: Several Useful Discrete Distributions
 Chapitre 3 5: Several Useful Discrete Distributions 5.3 The random variable x is not a binomial random variable since the balls are selected without replacement. For this reason, the probability p of choosing
Chapter 7: Theoretical Probability Distributions Variable - Measured/Categorized characteristic
 BSTT523: Pagano & Gavreau, Chapter 7 1 Chapter 7: Theoretical Probability Distributions Variable - Measured/Categorized characteristic Random Variable (R.V.) X Assumes values (x) by chance Discrete R.V.
What Is a Sampling Distribution? DISTINGUISH between a parameter and a statistic
 Section 8.1A What Is a Sampling Distribution? Learning Objectives After this section, you should be able to DISTINGUISH between a parameter and a statistic DEFINE sampling distribution DISTINGUISH between
Chapter 6. Estimates and Sample Sizes
 Chapter 6 Estimates and Sample Sizes Lesson 6-1/6-, Part 1 Estimating a Population Proportion This chapter begins the beginning of inferential statistics. There are two major applications of inferential
Using Dice to Introduce Sampling Distributions Written by: Mary Richardson Grand Valley State University
 Using Dice to Introduce Sampling Distributions Written by: Mary Richardson Grand Valley State University richamar@gvsu.edu Overview of Lesson In this activity students explore the properties of the distribution
Carolyn Anderson & YoungShil Paek (Slide contributors: Shuai Wang, Yi Zheng, Michael Culbertson, & Haiyan Li)
") Carolyn Anderson & YoungShil Paek (Slide contributors: Shuai Wang, Yi Zheng, Michael Culbertson, & Haiyan Li) Department of Educational Psychology University of Illinois at Urbana-Champaign 1 Inferential
Carolyn Anderson & YoungShil Paek (Slide contributors: Shuai Wang, Yi Zheng, Michael Culbertson, & Haiyan Li) Department of Educational Psychology University of Illinois at Urbana-Champaign 1 Inferential
Chapter 6: SAMPLING DISTRIBUTIONS
 Chapter 6: SAMPLING DISTRIBUTIONS Read Section 1.5 Graphical methods may not always be sufficient for describing data. Numerical measures can be created for both populations and samples. Definition A numerical
Exam #2 Results (as percentages)
") Oct. 30 Assignment: Read Chapter 19 Try exercises 1, 2, and 4 on p. 424 Exam #2 Results (as percentages) Mean: 71.4 Median: 73.3 Soda attitudes 2015 In a Gallup poll conducted Jul. 8 12, 2015, 1009 adult
Oct. 30 Assignment: Read Chapter 19 Try exercises 1, 2, and 4 on p. 424 Exam #2 Results (as percentages) Mean: 71.4 Median: 73.3 Soda attitudes 2015 In a Gallup poll conducted Jul. 8 12, 2015, 1009 adult
Chapter 22. Comparing Two Proportions. Bin Zou STAT 141 University of Alberta Winter / 15
 Chapter 22 Comparing Two Proportions Bin Zou (bzou@ualberta.ca) STAT 141 University of Alberta Winter 2015 1 / 15 Introduction In Ch.19 and Ch.20, we studied confidence interval and test for proportions,
Each trial has only two possible outcomes success and failure. The possible outcomes are exactly the same for each trial.
 Section 8.6: Bernoulli Experiments and Binomial Distribution We have already learned how to solve problems such as if a person randomly guesses the answers to 10 multiple choice questions, what is the
Business Statistics: A Decision-Making Approach 6 th Edition. Chapter Goals
 Chapter 6 Student Lecture Notes 6-1 Business Statistics: A Decision-Making Approach 6 th Edition Chapter 6 Introduction to Sampling Distributions Chap 6-1 Chapter Goals To use information from the sample
Lecture Slides. Elementary Statistics Eleventh Edition. by Mario F. Triola. and the Triola Statistics Series 9.1-1
 Lecture Slides Elementary Statistics Eleventh Edition and the Triola Statistics Series by Mario F. Triola Copyright 2010, 2007, 2004 Pearson Education, Inc. All Rights Reserved. 9.1-1 Chapter 9 Inferences
Chapter 6 The Standard Deviation as a Ruler and the Normal Model
 Chapter 6 The Standard Deviation as a Ruler and the Normal Model Overview Key Concepts Understand how adding (subtracting) a constant or multiplying (dividing) by a constant changes the center and/or spread
Chapter 9 Inferences from Two Samples
 Chapter 9 Inferences from Two Samples 9-1 Review and Preview 9-2 Two Proportions 9-3 Two Means: Independent Samples 9-4 Two Dependent Samples (Matched Pairs) 9-5 Two Variances or Standard Deviations Review
Chapter 18 Sampling Distribution Models
 Chapter 18 Sampling Distribution Models The histogram above is a simulation of what we'd get if we could see all the proportions from all possible samples. The distribution has a special name. It's called
Elementary Statistics
 Elementary Statistics Q: What is data? Q: What does the data look like? Q: What conclusions can we draw from the data? Q: Where is the middle of the data? Q: Why is the spread of the data important? Q:
Chapter 7: Sampling Distributions
 + Chapter 7: Sampling Distributions Section 7.2 The Practice of Statistics, 4 th edition For AP* STARNES, YATES, MOORE + Chapter 7 Sampling Distributions n 7.1 What is a Sampling Distribution? n 7.2 n
Statistic: a that can be from a sample without making use of any unknown. In practice we will use to establish unknown parameters.
 Chapter 9: Sampling Distributions 9.1: Sampling Distributions IDEA: How often would a given method of sampling give a correct answer if it was repeated many times? That is, if you took repeated samples
3 Conditional Probability
 3 Conditional Probability Question: What are the chances that a college student chosen at random from the U.S. population is a fan of the Notre Dame football team? Now, if the person chosen is a student
DSST Principles of Statistics
 DSST Principles of Statistics Time 10 Minutes 98 Questions Each incomplete statement is followed by four suggested completions. Select the one that is best in each case. 1. Which of the following variables
Chapter 22. Comparing Two Proportions 1 /29
 Chapter 22 Comparing Two Proportions 1 /29 Homework p519 2, 4, 12, 13, 15, 17, 18, 19, 24 2 /29 Objective Students test null and alternate hypothesis about two population proportions. 3 /29 Comparing Two
MTH135/STA104: Probability
 MTH35/STA04: Probability Homework # 3 Due: Tuesday, Sep 0, 005 Prof. Robert Wolpert. from prob 7 p. 9 You roll a fair, six-sided die and I roll a die. You win if the number showing on your die is strictly
Chapter 5, 6 and 7: Review Questions: STAT/MATH Consider the experiment of rolling a fair die twice. Find the indicated probabilities.
 Chapter5 Chapter 5, 6 and 7: Review Questions: STAT/MATH3379 1. Consider the experiment of rolling a fair die twice. Find the indicated probabilities. (a) One of the dice is a 4. (b) Sum of the dice equals
Linear Regression. Linear Regression. Linear Regression. Did You Mean Association Or Correlation?
 Did You Mean Association Or Correlation? AP Statistics Chapter 8 Be careful not to use the word correlation when you really mean association. Often times people will incorrectly use the word correlation
7.1: What is a Sampling Distribution?!?!
 7.1: What is a Sampling Distribution?!?! Section 7.1 What Is a Sampling Distribution? After this section, you should be able to DISTINGUISH between a parameter and a statistic DEFINE sampling distribution
Chapter 18: Sampling Distributions
 Chapter 18: Sampling Distributions All random variables have probability distributions, and as statistics are random variables, they too have distributions. The random phenomenon that produces the statistics
STA Module 10 Comparing Two Proportions
 STA 2023 Module 10 Comparing Two Proportions Learning Objectives Upon completing this module, you should be able to: 1. Perform large-sample inferences (hypothesis test and confidence intervals) to compare
The area under a probability density curve between any two values a and b has two interpretations:
 Chapter 7 7.1 The Standard Normal Curve Introduction Probability density curve: The area under a probability density curve between any two values a and b has two interpretations: 1. 2. The region above
*Karle Laska s Sections: There is no class tomorrow and Friday! Have a good weekend! Scores will be posted in Compass early Friday morning
 STATISTICS 100 EXAM 3 Spring 2016 PRINT NAME (Last name) (First name) *NETID CIRCLE SECTION: Laska MWF L1 Laska Tues/Thurs L2 Robin Tu Write answers in appropriate blanks. When no blanks are provided CIRCLE
LECTURE 12 CONFIDENCE INTERVAL AND HYPOTHESIS TESTING
 LECTURE 1 CONFIDENCE INTERVAL AND HYPOTHESIS TESTING INTERVAL ESTIMATION Point estimation of : The inference is a guess of a single value as the value of. No accuracy associated with it. Interval estimation
Review. A Bernoulli Trial is a very simple experiment:
 Review A Bernoulli Trial is a very simple experiment: Review A Bernoulli Trial is a very simple experiment: two possible outcomes (success or failure) probability of success is always the same (p) the
The Central Limit Theorem
 The Central Limit Theorem Patrick Breheny March 1 Patrick Breheny STA 580: Biostatistics I 1/23 Kerrich s experiment A South African mathematician named John Kerrich was visiting Copenhagen in 1940 when
A proportion is the fraction of individuals having a particular attribute. Can range from 0 to 1!
 Proportions A proportion is the fraction of individuals having a particular attribute. It is also the probability that an individual randomly sampled from the population will have that attribute Can range
appstats8.notebook October 11, 2016
 Chapter 8 Linear Regression Objective: Students will construct and analyze a linear model for a given set of data. Fat Versus Protein: An Example pg 168 The following is a scatterplot of total fat versus
Binomial and Poisson Probability Distributions
 Binomial and Poisson Probability Distributions Esra Akdeniz March 3, 2016 Bernoulli Random Variable Any random variable whose only possible values are 0 or 1 is called a Bernoulli random variable. What
Two Sample Problems. Two sample problems
 Two Sample Problems Two sample problems The goal of inference is to compare the responses in two groups. Each group is a sample from a different population. The responses in each group are independent
Probability calculus and statistics
 A Probability calculus and statistics A.1 The meaning of a probability A probability can be interpreted in different ways. In this book, we understand a probability to be an expression of how likely it
Chapter. Objectives. Sampling Distributions
 Chapter Sampling Distributions 8 Section 8.1 Distribution of the Sample Mean Objectives 1. Describe the distribution of the sample mean: samples from normal populations 2. Describe the distribution of
green green green/green green green yellow green/yellow green yellow green yellow/green green yellow yellow yellow/yellow yellow
 CHAPTER PROBLEM Did Mendel s results from plant hybridization experiments contradict his theory? Gregor Mendel conducted original experiments to study the genetic traits of pea plants. In 1865 he wrote
The Central Limit Theorem
 Introductory Statistics Lectures The Central Limit Theorem Sampling distributions Department of Mathematics Pima Community College Redistribution of this material is prohibited without written permission
Chapter 18 Summary Sampling Distribution Models
 Uit 5 Itroductio to Iferece Chapter 18 Summary Samplig Distributio Models What have we leared? Sample proportios ad meas will vary from sample to sample that s samplig error (samplig variability). Samplig
What is a parameter? What is a statistic? How is one related to the other?
 Chapter Seven: SAMPLING DISTRIBUTIONS 7.1 Sampling Distributions Read 424 425 What is a parameter? What is a statistic? How is one related to the other? Example: Identify the population, the parameter,
AP Statistics Review Ch. 7
 AP Statistics Review Ch. 7 Name 1. Which of the following best describes what is meant by the term sampling variability? A. There are many different methods for selecting a sample. B. Two different samples
QUIZ 4 (CHAPTER 7) - SOLUTIONS MATH 119 SPRING 2013 KUNIYUKI 105 POINTS TOTAL, BUT 100 POINTS = 100%
 - SOLUTIONS MATH 119 SPRING 2013 KUNIYUKI 105 POINTS TOTAL, BUT 100 POINTS = 100%") QUIZ 4 (CHAPTER 7) - SOLUTIONS MATH 119 SPRING 013 KUNIYUKI 105 POINTS TOTAL, BUT 100 POINTS = 100% 1) We want to conduct a study to estimate the mean I.Q. of a pop singer s fans. We want to have 96% confidence
QUIZ 4 (CHAPTER 7) - SOLUTIONS MATH 119 SPRING 013 KUNIYUKI 105 POINTS TOTAL, BUT 100 POINTS = 100% 1) We want to conduct a study to estimate the mean I.Q. of a pop singer s fans. We want to have 96% confidence
CHAPTER 18 SAMPLING DISTRIBUTION MODELS STAT 203
 1 CHAPTER 18 SAMPLING DISTRIBUTION MODELS STAT 203 Outline 2 Sampling Distribution for Proportions Sample Proportions The mean The standard deviation The Distribution Model Assumptions and Conditions Sampling
3/30/2009. Probability Distributions. Binomial distribution. TI-83 Binomial Probability
 Random variable The outcome of each procedure is determined by chance. Probability Distributions Normal Probability Distribution N Chapter 6 Discrete Random variables takes on a countable number of values
Problems Pages 1-4 Answers Page 5 Solutions Pages 6-11
 Part III Practice Problems Problems Pages 1-4 Answers Page 5 Solutions Pages 6-11 1. In estimating population mean or proportion what is the width of an interval? 2. If 25 college students out of 80 graduate
Math 243 Section 3.1 Introduction to Probability Lab
 Math 243 Section 3.1 Introduction to Probability Lab Overview Why Study Probability? Outcomes, Events, Sample Space, Trials Probabilities and Complements (not) Theoretical vs. Empirical Probability The
CHAPTER 9, 10. Similar to a courtroom trial. In trying a person for a crime, the jury needs to decide between one of two possibilities:
 CHAPTER 9, 10 Hypothesis Testing Similar to a courtroom trial. In trying a person for a crime, the jury needs to decide between one of two possibilities: The person is guilty. The person is innocent. To
CHAPTER 14 THEORETICAL DISTRIBUTIONS
 CHAPTER 14 THEORETICAL DISTRIBUTIONS THEORETICAL DISTRIBUTIONS LEARNING OBJECTIVES The Students will be introduced in this chapter to the techniques of developing discrete and continuous probability distributions
Chapter 22. Comparing Two Proportions 1 /30
 Chapter 22 Comparing Two Proportions 1 /30 Homework p519 2, 4, 12, 13, 15, 17, 18, 19, 24 2 /30 3 /30 Objective Students test null and alternate hypothesis about two population proportions. 4 /30 Comparing
We're in interested in Pr{three sixes when throwing a single dice 8 times}. => Y has a binomial distribution, or in official notation, Y ~ BIN(n,p).
.") Sampling distributions and estimation. 1) A brief review of distributions: We're in interested in Pr{three sixes when throwing a single dice 8 times}. => Y has a binomial distribution, or in official notation,
Sampling distributions and estimation. 1) A brief review of distributions: We're in interested in Pr{three sixes when throwing a single dice 8 times}. => Y has a binomial distribution, or in official notation,
Chapter 8. Linear Regression. Copyright 2010 Pearson Education, Inc.
 Chapter 8 Linear Regression Copyright 2010 Pearson Education, Inc. Fat Versus Protein: An Example The following is a scatterplot of total fat versus protein for 30 items on the Burger King menu: Copyright
Math/Stat 3850 Exam 1
 2/21/18 Name: Math/Stat 3850 Exam 1 There are 10 questions, worth a total of 100 points. You may use R, your calculator, and any written or internet resources on this test, although you are not allowed
Math/Stat 352 Lecture 10. Section 4.11 The Central Limit Theorem
 Math/Stat 352 Lecture 10 Section 4.11 The Central Limit Theorem 1 Summing random variables Summing random variables Summing random variables Generally summation changes the shape of the distribution: range
Population 1 Population 2
 Two Population Case Testing the Difference Between Two Population Means Sample of Size n _ Sample mean = x Sample s.d.=s x Sample of Size m _ Sample mean = y Sample s.d.=s y Pop n mean=μ x Pop n s.d.=
MATH 1150 Chapter 2 Notation and Terminology
 MATH 1150 Chapter 2 Notation and Terminology Categorical Data The following is a dataset for 30 randomly selected adults in the U.S., showing the values of two categorical variables: whether or not the
MAT 2379, Introduction to Biostatistics, Sample Calculator Questions 1. MAT 2379, Introduction to Biostatistics
 MAT 2379, Introduction to Biostatistics, Sample Calculator Questions 1 MAT 2379, Introduction to Biostatistics Sample Calculator Problems for the Final Exam Note: The exam will also contain some problems
Review of Multiple Regression
 Ronald H. Heck 1 Let s begin with a little review of multiple regression this week. Linear models [e.g., correlation, t-tests, analysis of variance (ANOVA), multiple regression, path analysis, multivariate
Chapter 26: Comparing Counts (Chi Square)
") Chapter 6: Comparing Counts (Chi Square) We ve seen that you can turn a qualitative variable into a quantitative one (by counting the number of successes and failures), but that s a compromise it forces
Chapter 6: Comparing Counts (Chi Square) We ve seen that you can turn a qualitative variable into a quantitative one (by counting the number of successes and failures), but that s a compromise it forces
ACM 116: Lecture 2. Agenda. Independence. Bayes rule. Discrete random variables Bernoulli distribution Binomial distribution
 1 ACM 116: Lecture 2 Agenda Independence Bayes rule Discrete random variables Bernoulli distribution Binomial distribution Continuous Random variables The Normal distribution Expected value of a random
You may use your calculator and a single page of notes. The room is crowded. Please be careful to look only at your own exam.
 LAST NAME (Please Print): KEY FIRST NAME (Please Print): HONOR PLEDGE (Please Sign): Statistics 111 Midterm 1 This is a closed book exam. You may use your calculator and a single page of notes. The room
Ch. 7 Statistical Intervals Based on a Single Sample
 Ch. 7 Statistical Intervals Based on a Single Sample Before discussing the topics in Ch. 7, we need to cover one important concept from Ch. 6. Standard error The standard error is the standard deviation
STT 315 This lecture is based on Chapter 2 of the textbook.
 STT 315 This lecture is based on Chapter 2 of the textbook. Acknowledgement: Author is thankful to Dr. Ashok Sinha, Dr. Jennifer Kaplan and Dr. Parthanil Roy for allowing him to use/edit some of their
Point Estimation and Confidence Interval
 Chapter 8 Point Estimation and Confidence Interval 8.1 Point estimator The purpose of point estimation is to use a function of the sample data to estimate the unknown parameter. Definition 8.1 A parameter
One-sample categorical data: approximate inference
 One-sample categorical data: approximate inference Patrick Breheny October 6 Patrick Breheny Biostatistical Methods I (BIOS 5710) 1/25 Introduction It is relatively easy to think about the distribution
7 Estimation. 7.1 Population and Sample (P.91-92)
") 7 Estimation MATH1015 Biostatistics Week 7 7.1 Population and Sample (P.91-92) Suppose that we wish to study a particular health problem in Australia, for example, the average serum cholesterol level for
7 Estimation MATH1015 Biostatistics Week 7 7.1 Population and Sample (P.91-92) Suppose that we wish to study a particular health problem in Australia, for example, the average serum cholesterol level for
MAT2377. Rafa l Kulik. Version 2015/November/23. Rafa l Kulik
 MAT2377 Rafa l Kulik Version 2015/November/23 Rafa l Kulik Rafa l Kulik 1 Rafa l Kulik 2 Rafa l Kulik 3 Rafa l Kulik 4 The Z-test Test on the mean of a normal distribution, σ known Suppose X 1,..., X n
Practice Questions: Statistics W1111, Fall Solutions
 Practice Questions: Statistics W, Fall 9 Solutions Question.. The standard deviation of Z is 89... P(=6) =..3. is definitely inside of a 95% confidence interval for..4. (a) YES (b) YES (c) NO (d) NO Questions
The Central Limit Theorem
 - The Central Limit Theorem Definition Sampling Distribution of the Mean the probability distribution of sample means, with all samples having the same sample size n. (In general, the sampling distribution
Sections 7.1 and 7.2. This chapter presents the beginning of inferential statistics. The two major applications of inferential statistics
 Sections 7.1 and 7.2 This chapter presents the beginning of inferential statistics. The two major applications of inferential statistics Estimate the value of a population parameter Test some claim (or
Population Variance. Concepts from previous lectures. HUMBEHV 3HB3 one-sample t-tests. Week 8
 Concepts from previous lectures HUMBEHV 3HB3 one-sample t-tests Week 8 Prof. Patrick Bennett sampling distributions - sampling error - standard error of the mean - degrees-of-freedom Null and alternative/research
Thus, P(F or L) = P(F) + P(L) - P(F & L) = = 0.553
 = P(F) + P(L) - P(F & L) = = 0.553") Test 2 Review: Solutions 1) The following outcomes have at least one Head: HHH, HHT, HTH, HTT, THH, THT, TTH Thus, P(at least one head) = 7/8 2) The following outcomes have a sum of 9: (6,3), (5,4), (4,5),
Test 2 Review: Solutions 1) The following outcomes have at least one Head: HHH, HHT, HTH, HTT, THH, THT, TTH Thus, P(at least one head) = 7/8 2) The following outcomes have a sum of 9: (6,3), (5,4), (4,5),
Lecture Slides. Elementary Statistics. Tenth Edition. by Mario F. Triola. and the Triola Statistics Series
 Lecture Slides Elementary Statistics Tenth Edition and the Triola Statistics Series by Mario F. Triola Slide 1 Chapter 7 Estimates and Sample Sizes 7-1 Overview 7-2 Estimating a Population Proportion 7-3
This is a multiple choice and short answer practice exam. It does not count towards your grade. You may use the tables in your book.
 NAME (Please Print): HONOR PLEDGE (Please Sign): statistics 101 Practice Final Key This is a multiple choice and short answer practice exam. It does not count towards your grade. You may use the tables
STAT 200 Chapter 1 Looking at Data - Distributions
 STAT 200 Chapter 1 Looking at Data - Distributions What is Statistics? Statistics is a science that involves the design of studies, data collection, summarizing and analyzing the data, interpreting the
green green green/green green green yellow green/yellow green yellow green yellow/green green yellow yellow yellow/yellow yellow
 CHAPTER PROBLEM Did Mendel s results from plant hybridization experiments contradict his theory? Gregor Mendel conducted original experiments to study the genetic traits of pea plants. In 1865 he wrote
Sampling, Frequency Distributions, and Graphs (12.1)
") 1 Sampling, Frequency Distributions, and Graphs (1.1) Design: Plan how to obtain the data. What are typical Statistical Methods? Collect the data, which is then subjected to statistical analysis, which
1 Sampling, Frequency Distributions, and Graphs (1.1) Design: Plan how to obtain the data. What are typical Statistical Methods? Collect the data, which is then subjected to statistical analysis, which
success and failure independent from one trial to the next?
 , section 8.4 The Binomial Distribution Notes by Tim Pilachowski Definition of Bernoulli trials which make up a binomial experiment: The number of trials in an experiment is fixed. There are exactly two
STAT 201 Assignment 6
 STAT 201 Assignment 6 Partial Solutions 12.1 Research question: Do parents in the school district support the new education program? Parameter: p = proportion of all parents in the school district who
Continuous Probability Distributions
 1 Chapter 5 Continuous Probability Distributions 5.1 Probability density function Example 5.1.1. Revisit Example 3.1.1. 11 12 13 14 15 16 21 22 23 24 25 26 S = 31 32 33 34 35 36 41 42 43 44 45 46 (5.1.1)
Section 9 1B: Using Confidence Intervals to Estimate the Difference ( p 1 p 2 ) in 2 Population Proportions p 1 and p 2 using Two Independent Samples
 in 2 Population Proportions p 1 and p 2 using Two Independent Samples") Section 9 1B: Using Confidence Intervals to Estimate the Difference ( p 1 p 2 ) in 2 Population Proportions p 1 and p 2 using Two Independent Samples If p 1 p 1 = 0 then there is no difference in the 2
Section 9 1B: Using Confidence Intervals to Estimate the Difference ( p 1 p 2 ) in 2 Population Proportions p 1 and p 2 using Two Independent Samples If p 1 p 1 = 0 then there is no difference in the 2
Math 10 - Compilation of Sample Exam Questions + Answers
 Math 10 - Compilation of Sample Exam Questions + Sample Exam Question 1 We have a population of size N. Let p be the independent probability of a person in the population developing a disease. Answer the
Margin of Error for Proportions
 for Proportions Gene Quinn for Proportions p.1/8 An interval estimate for a population proportion p is often reported not as a confidence interval, but as a margin of error. for Proportions p.2/8 An interval