Supplementary Figure 1. Potential energy, volume, and molecular distribution of the
|
|
|
- Jean Garrison
- 6 years ago
- Views:
Transcription
 Change of the density and total potential energy of the substrates consisting of 256-number of UGH-2, CBP, and TSPO1 molecules, respectively, in the simulation of packing the molecules at 300 K")
1 Supplementary Figure 1. Potential energy, volume, and molecular distribution of the organic substrates prepared by MD simulation. (a) Change of the density and total potential energy of the substrates consisting of 256-number of UGH-2, CBP, and TSPO1 molecules, respectively, in the simulation of packing the molecules at 300 K and 1 atm. (b) Angular distributions of the 256-number of molecular vectors (red arrows) in the substrates. Their distribution followed the random angular distribution line, indicating the amorphous substrates were formed by the MD simulation
 Analysis of the EDO at peak wavelength of each emitter (520 nm, 530 nm, and 570 nm).")
2 Supplementary Figure 2. Angle-dependent PL analysis of Ir(ppy)2tmd, Ir(3,5,4-mppy), and Ir(dmppy-ph) 2 tmd doped in 30 nm of TSPO1 layers. (a) Analysis of the EDO at peak wavelength of each emitter (520 nm, 530 nm, and 570 nm). Measured emission patterns (scatters) are located between the lines with an isotropic orientation (blue) and a fully horizontal orientation (red). The best fitted fractions of the horizontal to vertical emitting dipole moment were 78:22, 79:21, and 85:15, for Ir(ppy) 2 tmd, Ir(3,5,4-mppy), and Ir(dmppy-ph) 2 tmd, respectively. (b) Measured (surfaces) and calculated angular emission spectra (broken lines) having the orientation that have been determined by the analyses at the peak wavelengths
3 23 3
4 24 4
5 25 5
6 26 6

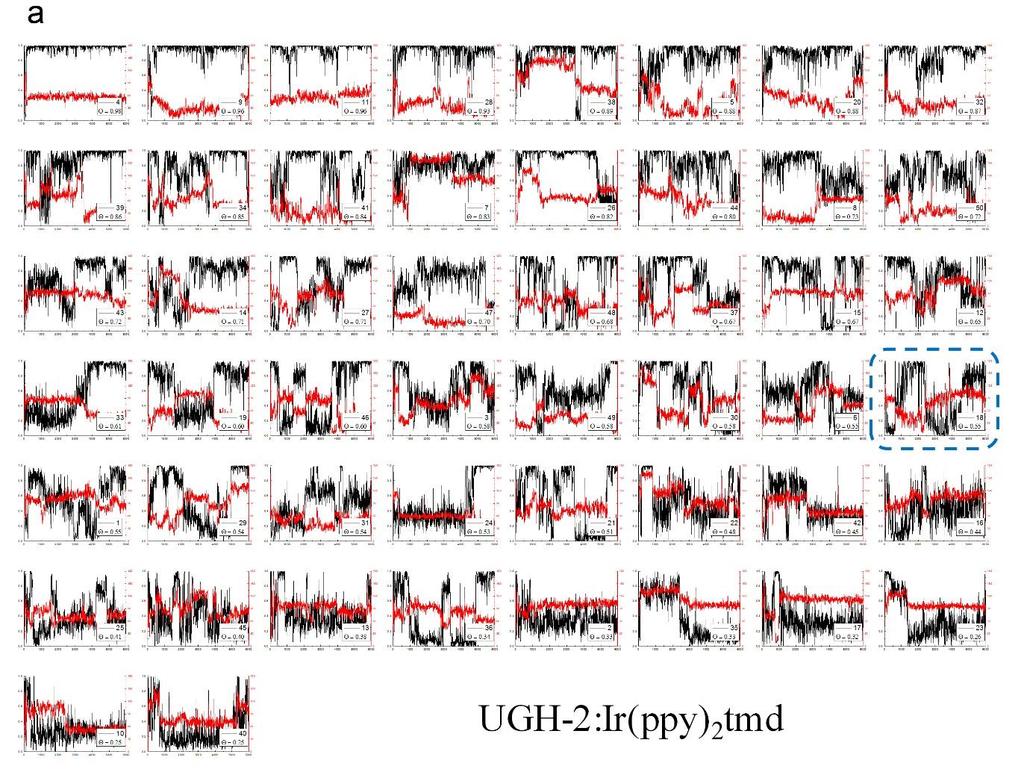
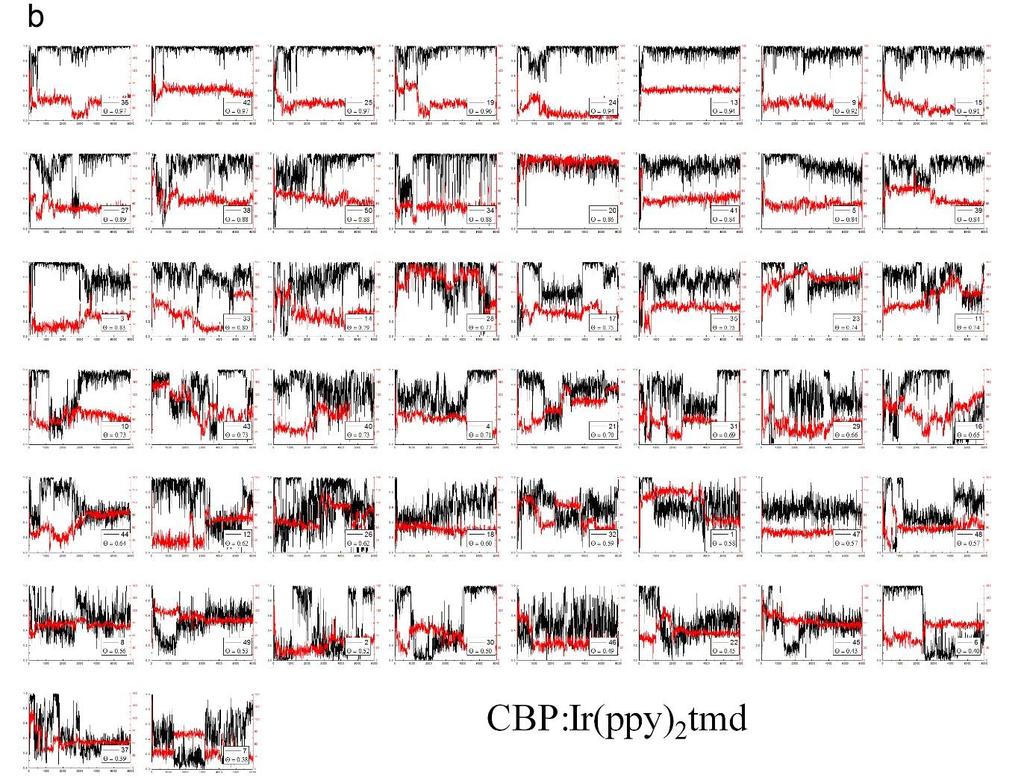
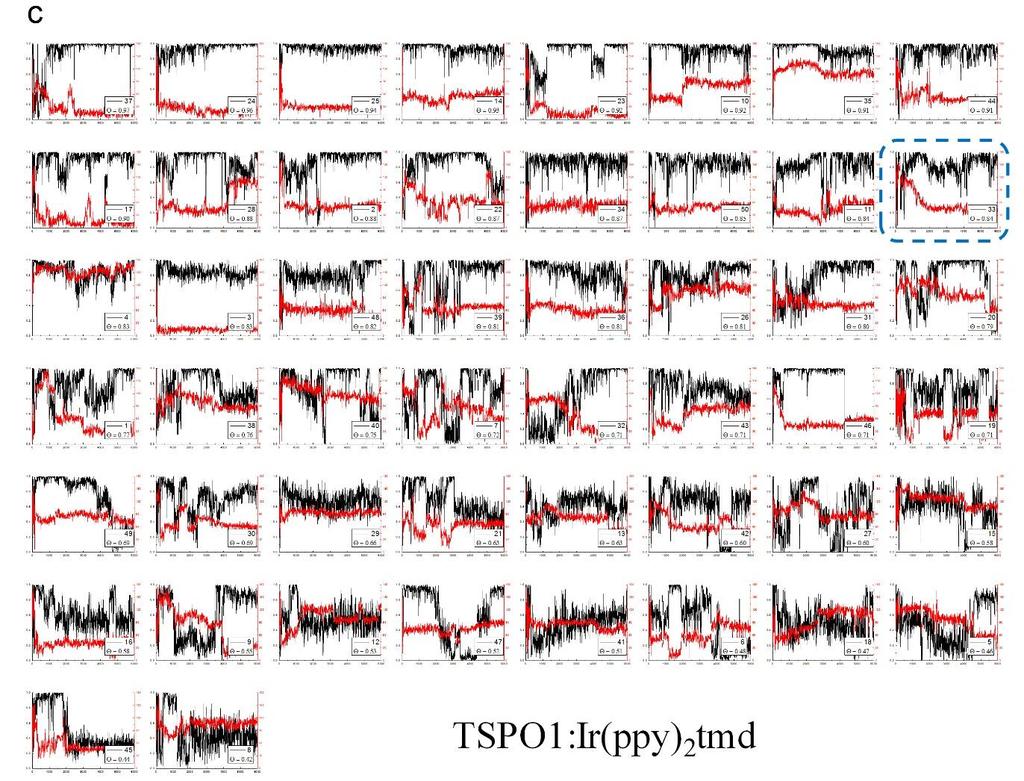
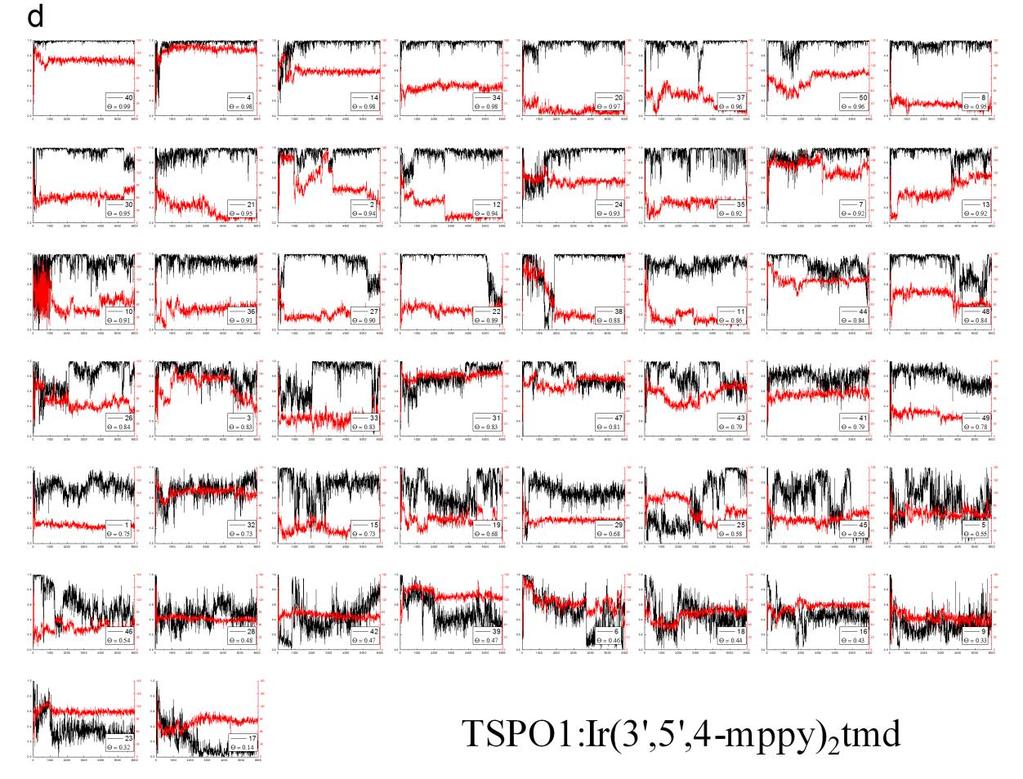
7 Supplementary Figure trajectories of TDM H up to 6000 ps in 5 combinations of the host and the dopant. Black and red lines represent the ratio of TDM H in the range of 0 to 1 and the angle of the C 2 axis of phosphors in the range of 0 to 180, respectively. Data were arranged in the order of standard deviation between 1000 ns and 6000 ns and the numbers in the figure is the simulation numbers. 33 7
8 Supplementary Figure 4. Quantum chemical simulation of the TDMs and molecular dynamic simulation of molecular and emitting dipole orientations of Ir(ppy) 3. (a) Three triplet TDM vectors of Ir(ppy) 3 with a 3-fold rotation symmetry from iridium to three equivalent ppy ligands by 3 MLCT. The C 3 symmetry axis toward pyridines from the origin located at the Ir atom was set as m z, the vector normal to the plane including m z and one of Ir- N vector was set as m y, and m x was determined by a cross product of m y and m z in the dopants. Optimization of the molecular structures were demonstrated using B3LYP method and LACVP** basis set. Spin-orbit coupled time-dependent density functional theory (SOC- TDDFT) calculations were carried out using B3LYP method and DYALL-2ZCVP_ZORA-J- PT-GEN basis set. (b) A histogram of the TDM H of Ir(ppy) 3 with a simulated Θ value. Red bars indicate the population of the phosphor configurations having TDM H values in steps of The blue line is the theoretical line of TDM H from an arbitrary vector and the green line 8
9 represents the deviations between red bars and blue lines. Note that data were included in the histogram by a product of 41,700 frames and three TDMs. (c) A histogram of the angle of the C 3 axis of Ir(ppy) 3 in steps of 2. The blue line represents an angular random distribution of an arbitrary vector. This histogram includes 41,700 data in total. 51 9
 Comparison of TSPO1 substrates consisting of 256 and 1024 molecules.")
10 Supplementary Figure 5. Vacuum deposition simulation with a 1024-molecule substrate (a) Comparison of TSPO1 substrates consisting of 256 and 1024 molecules. (b) Histograms 56 of (a) TDM H and (b) C demonstrated by the deposition simulation of Ir(ppy)2tmd on the molecule TSPO1 substrate
11 60 61 Supplementary Figure 6. Autocorrelation coefficients in the 5 different deposition systems

12 Supplementary Figure 7. Relationship of the emitting dipole orientation in five hostdopant systems. Non-bonded energies of the phosphors located on the surface were calculated by the summation of van der Waals and Coulomb interaction energies with cut-off radius of 0.9 nm of each atom of the phosphors. Red lines represent the mean non-bonded energies as a function of the ratio of TDM H. 12
13 69 Supplementary Note 1: Preparation of organic substrates by MD Preparation of the substrate had three steps of the MD simulation after locating 256 molecules in a grid: annealing at 500K at first (NVT, 500 ps) followed by annealing at 300 K (NVT, 200 ps), and finally packing of the molecules at 300K and 1 atm (NPT, 1,000 ps for UGH-2 and CBP, and 5,000 ps for TSPO1). Supplementary Figure 1a shows the trajectories of the density and total potential energy of UGH-2, CBP, and TSPO1 substrates, respectively, at the step of packing. Density and potential energies were converged during the 1,000 ps of simulation for the UGH-2 and CBP substrates and 5,000 ps of simulation for the TSPO1 substrate. The NPT MD simulation produced amorphous solid densities of 1.04, 1.13, and 1.10 g/cm 3 for UGH-2, CBP, and TSPO1, respectively. Consider for example CBP whose simulated density of 1.13 g/cm 3 is in good agreement with the experimental value of 1.18 g/cm 3. 1 Supplementary Figure 1b exhibits the orientation of 256 molecular vectors of UGH-2, CBP, and TSPO1 indicated as red arrows, respectively, consisting the substrates. Their angular distributions were closed to the random distribution line so we concluded that the amorphous organic substrates were successfully prepared. 84 Supplementary Note 2: Film fabrication and angle-dependent PL measurement 85 Organic films were fabricated on fused silica substrates by thermal evaporation under a 86 pressure of torr without breaking the vacuum. Rates of the co-deposition were 1 Å/s and thickness of the films were 30 nm. Films were encapsulated using glasses and UV resin after the deposition. EDOs of the organic films were measured by angle-dependent PL analysis. The fused silica substrates were attached to a half-cylinder lens made of fused silica with an index similar densities and matching oil. The attached films were excited by a He-Cd laser (325 nm, CW) and the angular PL spectra escaping out through the lens were measured 13
14 by Maya2000 spectrometer (Ocean Optics Inc.). A linear polarizer was used to obtain the p- polarized PL patterns. Optical simulation of the luminescence from a thin film was employed to fit the dipole orientation from the PL patterns Supplementary Figure 2a shows the angular p-polarized emission patterns at peak wavelengths of Ir(ppy) 2 tmd, Ir(3,5,4-mppy), and Ir(dmppy-ph) 2 tmd doped in 30-nm-thick TSPO1 layers, respectively. Lines are the calculated emission patterns of the p-polarized light with an isotropic (blue), fully horizontal (red), and the best-fitted EDO (black). The lower emission intensities of the dyes above 50 represent that the emitter has the larger portion of the horizontal emitting dipole moment. As a result, EDO of Ir(ppy) 2 tmd, Ir(3,5,4-mppy), and Ir(dmppy-ph) 2 tmd were determined as Θ = 0.78, 0.80, and 0.86, respectively. The orientation values fitted in all the spectral range of the phosphors as shown in Supplementary Figure 2b Supplementary Note 3: Deposition simulation of Ir(ppy) 3 on CBP substrate Deposition simulation of Ir(ppy) 3 was demonstrated on the pre-organized CBP substrate layer. Ir(ppy) 3 is a well-known homoleptic complex exhibiting isotropic emitting dipole orientation (EDO) as doped in organic host layers. 3-4 The identical QM and MD methods described in the main text were employed to analyze the orientation of Ir(ppy) 3 deposited on CBP layer using Jaguar 5 and Desmond. 6 The symmetric structure of Ir(ppy) 3 results in three equivalent triplet 109 transition dipole moments (TDMs) by 3 MLCT with polar coordinates of [ 87, = 25 ], [ M 87, = 145 ], and [ M 87, = -95 ], with respect to M the molecular C 3 axis as shown in Supplementary Figure 4a. Molecular configurations and three TDM vectors of Ir(ppy) 3 in the deposition simulation were recorded every 6 ps until reaching 6,000 ps. Supplementary Figure 4b and 4c show the statistical results of the ratio of horizontal TMD (TDM H ) and the angle of the C 3 axis of Ir(ppy) 3. The distribution of TDM H 14
15 follows the random distribution line (blue line in Supplementary Figure 4b) and the ensemble average of Θ=0.67 is in good agreement with the EDO observed by experiments. The angular distribution of the C 3 axis is close to the random distribution line (blue line in Supplementary Figure 4c) as well Supplementary Note 4: Deposition simulation of Ir(ppy) 2 tmd on a 1024-molecule- TSPO1 substrate To validate if the substrates consisting of 256 molecules appropriately consider intermolecular interactions, we demonstrated the deposition simulation with the larger number of host molecules. Supplementary Figure 5a exhibits the equilibrated 1024-molecule- TSPO1 substrate. Supplementary Figure 5b and 5c show histograms of TDM H and angle of the C 2 axis of Ir(ppy) 2 tmd, respectively, deposited on the 1024-molecule substrate. The simulated EDO value (Θ, the ratio of horizontal transition dipole moment) was 0.74 which corresponds to the value of the deposition using the substrate consisting of 256 TSPO1 molecules. The distribution of the C 2 axis vector was broad with the mean angle of 74, exhibiting no large difference of the molecular distribution with the simulation results using the 256-molecule substrate. 131 Supplementary Note 5: Autocorrelation times of the deposition simulation We estimated the integrated autocorrelation times and the effective number of independent samples to validate if the 50-independent-deposition events are sufficient to represent configurations of Ir compounds doped in organic semiconducting layers. The autocorrelation coefficient (τ) as a function of the time lag (t) was calculated by 15
16 CA( t, k), 50 C (0, k) k 1 A (1) 137 where k is the simulation number among the 50 deposition events and C A is the covariance 138 following C ( ) ( ( ) )( ( ) ) A t A s t A A s A. Supplementary Figure 6 exhibits τ s of the different deposition systems with the x-axis as a product of the lag and the time step of 6 ps. The integrated autocorrelation times ( int ( n eff ) were calculated using the following formulas: ) and the effective number of independent samples 142 int tfinal 6 ps ( t), t 0 (2) 143 n eff int (3) int values were 157, 168, 189, 218, and 208 ps, and n eff values were 765, 715, 638, 557, and 583 for UGH-2:Ir(ppy) 2 tmd, CBP:Ir(ppy) 2 tmd, TSPO1:Ir(ppy) 2 tmd, TSPO1:Ir(3',5',4-146 mppy) 2 tmd, and TSPO1:Ir(dmppy-ph) 2 tmd systems, respectively. The small int values compared to the total simulation time of 5000 ps (1000 ps to 6000 ps) indicate no large autocorrelation in the time series data. We concluded that the number of samples is sufficient for the analysis of molecular configuration in the trajectories Supplementary References Xiang, H.-F. et al. Method for measurement of the density of thin films of small organic molecules. Rev. Sci. Instrumen. 78, (2007). 16
17 Moon, C.-K., Kim, S.-Y., Lee, J.-H. & Kim, J.-J. Luminescence from oriented emitting dipoles in a birefringent medium. Opt. Exp. 23, A279 A291 (2015) Liehm, P. et al. Comparing the emissive dipole orientation of two similar phosphorescent green emitter molecules in highly efficient organic light-emitting diodes. Appl. Phys. Lett. 101, (2012) Moon, C.-K., Kim, K.-H., Lee, J. W. & Kim, J.-J. Influence of host molecules on emitting dipole orientation of phosphorescent iridium complexes. Chem. Mater. 27, (2015) Jaguar 9.2, Schrödinger, LLC, New York, NY, (2016) Desmond Molecular Dynamics System 4.6, D. E. Shaw Research, New York, NY (2016); Maestro-Desmond Interoperability Tools, Schrödinger, New York, NY (2016). 17
E L E C T R O P H O S P H O R E S C E N C E
 Organic LEDs part 4 E L E C T R O P H O S P H O R E S C E C E. OLED efficiency 2. Spin 3. Energy transfer 4. Organic phosphors 5. Singlet/triplet ratios 6. Phosphor sensitized fluorescence 7. Endothermic
SUPPLEMENTARY INFORMATION
 Deep blue phosphorescent organic light-emitting diodes with very high brightness and efficiency Jaesang Lee 1, Hsiao-Fan Chen 2, Thilini Batagoda 2, Caleb Coburn 3, Peter I. Djurovich 2, Mark E. Thompson
Operational lifetimes of organic light-emitting diodes dominated by Förster
 Operational lifetimes of organic light-emitting diodes dominated by Förster resonance energy transfer Hirohiko Fukagawa *, Takahisa Shimizu, Yukiko Iwasaki, and Toshihiro Yamamoto Japan Broadcasting Corporation
Determining the orientation of the emissive dipole moment associated with dye molecules in microcavity structures
 journal of modern optics, 15 october 2004 vol. 51, no. 15, 2287 2295 Determining the orientation of the emissive dipole moment associated with dye molecules in microcavity structures S. H. GARRETT, J.
Electronic Supplementary Information. Iridium(III) phosphors with bis(diphenylphorothioyl)amide ligand for
 phosphors with bis(diphenylphorothioyl)amide ligand for") Electronic Supplementary Material (ESI) for Journal of Materials Chemistry C. This journal is The Royal Society of Chemistry 218 Electronic Supplementary Information Iridium(III) phosphors with bis(diphenylphorothioyl)amide
Electronic Supplementary Material (ESI) for Journal of Materials Chemistry C. This journal is The Royal Society of Chemistry 218 Electronic Supplementary Information Iridium(III) phosphors with bis(diphenylphorothioyl)amide
Surface Plasmon Enhanced Light Emitting Devices
 Surface Plasmon Enhanced Light Emitting Devices Alexander Mikhailovsky, Jacek Ostrowski, Hadjar Benmansour, and Guillermo Bazan + Department of Chemistry and Biochemistry, University of California Santa
Supporting Information
 Supporting Information A New Molecular Design Based on Thermally Activated Delayed Fluorescence for Highly Efficient Organic Light Emitting Diodes Pachaiyappan Rajamalli, Natarajan Senthilkumar, Parthasarathy
Comments to Atkins: Physical chemistry, 7th edition.
 Comments to Atkins: Physical chemistry, 7th edition. Chapter 16: p. 483, Eq. (16.1). The definition that the wave number is the inverse of the wave length should be used. That is much smarter. p. 483-484.
SUPPORTING INFORMATION
 SUPPORTIG IFORMATIO [1,2,4]Triazolo[1,5-a]pyridine-based Host Materials for Green Phosphorescent and Delayed-Fluorescence OLEDs with Low Efficiency Roll-off Wenxuan Song, a Yi Chen, a Qihao Xu, a Haichuan
Single Emitter Detection with Fluorescence and Extinction Spectroscopy
 Single Emitter Detection with Fluorescence and Extinction Spectroscopy Michael Krall Elements of Nanophotonics Associated Seminar Recent Progress in Nanooptics & Photonics May 07, 2009 Outline Single molecule
Light Extraction in OLED with Corrugated Substrates Franky So
 Light Extraction in OLED with Corrugated Substrates Franky So Department of Materials Science and Engineering North Carolina State University Raleigh, NC 27695-7907 1 Where Did the Light Go? Modes Distribution
Optical and Photonic Glasses. Lecture 31. Rare Earth Doped Glasses I. Professor Rui Almeida
 Optical and Photonic Glasses : Rare Earth Doped Glasses I Professor Rui Almeida International Materials Institute For New Functionality in Glass Lehigh University Rare-earth doped glasses The lanthanide
Supplementary Figure 1 Comparison of single quantum emitters on two type of substrates:
 Supplementary Figure 1 Comparison of single quantum emitters on two type of substrates: a, Photoluminescence (PL) spectrum of localized excitons in a WSe 2 monolayer, exfoliated onto a SiO 2 /Si substrate
Interaction mechanism for energy transfer from Ce to Tb ions in silica
 Interaction mechanism for energy transfer from Ce to Tb ions in silica HAA Seed Ahmed 1,2, W-S Chae 3, OM Ntwaeaborwa 1 and RE Kroon 1 1 Department of Physics, University of the Free State, South Africa
Optical Properties of Copper Phthalocyanine(CuPc)Thin Films
Thin Films") Egypt. J. Sol., Vol. (24), No. (1), (2001) 11 Optical Properties of Copper Phthalocyanine(CuPc)Thin Films M. M. El-Nahass, F.S. Bahabri* ands.r.al-harbi* Faculty of Education, Ain Shams University, Cairo,
Egypt. J. Sol., Vol. (24), No. (1), (2001) 11 Optical Properties of Copper Phthalocyanine(CuPc)Thin Films M. M. El-Nahass, F.S. Bahabri* ands.r.al-harbi* Faculty of Education, Ain Shams University, Cairo,
Molecular orientation in small-molecule organic light-emitting diodes
 Journal of Materials Chemistry Dynamic Article Links C < Cite this: J. Mater. Chem., 2011, 21, 19187 www.rsc.org/materials Molecular orientation in small-molecule organic light-emitting diodes Daisuke
Electrophosphorescence for Solid- State Lighting
 Electrophosphorescence for Solid- State Lighting Mark Thompson Department of Chemistry University of Southern California Hole/electron recombination gives singlet and triplet excitons hole electron + or
OLEDs and PLEDs Nele Schumacher Incoherent Lightsources - Prof. Thomas Jüstel
 OLEDs and PLEDs 28.5.2014 Nele Schumacher Incoherent Lightsources - Prof. Thomas Jüstel Contents 1. History 2. Working principle 4. Preparation of multilayer devices 5. Advantages and disadvantages 6.
Supporting Information: Poly(dimethylsiloxane) Stamp Coated with a. Low-Surface-Energy, Diffusion-Blocking,
 Stamp Coated with a. Low-Surface-Energy, Diffusion-Blocking,") Supporting Information: Poly(dimethylsiloxane) Stamp Coated with a Low-Surface-Energy, Diffusion-Blocking, Covalently Bonded Perfluoropolyether Layer and Its Application to the Fabrication of Organic Electronic
Supporting Information: Poly(dimethylsiloxane) Stamp Coated with a Low-Surface-Energy, Diffusion-Blocking, Covalently Bonded Perfluoropolyether Layer and Its Application to the Fabrication of Organic Electronic
Spiro-Configured Bifluorenes: Highly Efficient Emitter for UV Organic Light-Emitting Device and Host Material for Red Electrophosphorescence
 Spiro-Configured Bifluorenes: Highly Efficient Emitter for UV Organic Light-Emitting Device and Host Material for Red Electrophosphorescence Ken-Tsung Wong,* a Yuan-Li Liao, a Yu-Ting Lin, b Hai-Ching
Because light behaves like a wave, we can describe it in one of two ways by its wavelength or by its frequency.
 Light We can use different terms to describe light: Color Wavelength Frequency Light is composed of electromagnetic waves that travel through some medium. The properties of the medium determine how light
Supporting Information
 Electronic Supplementary Material (ESI) for Energy & Environmental Science. This journal is The Royal Society of Chemistry 2018 Supporting Information A hydro/oxo-phobic top hole-selective layer for efficient
Supplementary documents
 Supplementary documents Low Threshold Amplified Spontaneous mission from Tin Oxide Quantum Dots: A Instantiation of Dipole Transition Silence Semiconductors Shu Sheng Pan,, Siu Fung Yu, Wen Fei Zhang,
Organic LEDs part 8. Exciton Dynamics in Disordered Organic Thin Films. Handout on QD-LEDs: Coe et al., Nature 420, 800 (2002).
.") Organic LEDs part 8 Exciton Dynamics in Disordered Organic Thin Films Quantum Dot LEDs Handout on QD-LEDs: Coe et al., ature 420, 800 (2002). @ MIT April 29, 2003 Organic Optoelectronics - Lecture 20b
Organic LEDs part 8 Exciton Dynamics in Disordered Organic Thin Films Quantum Dot LEDs Handout on QD-LEDs: Coe et al., ature 420, 800 (2002). @ MIT April 29, 2003 Organic Optoelectronics - Lecture 20b
Supplementary Figure 1. Mass spectrum (top) and 1 H NMR spectrum (bottom, in CDCl 3 ) of [ppy 2 IrNH] + PF 6 -.
![Supplementary Figure 1. Mass spectrum (top) and 1 H NMR spectrum (bottom, in CDCl 3 ) of [ppy 2 IrNH] + PF 6 -.](/thumbs/82/85675389.jpg "Supplementary Figure 1. Mass spectrum (top) and 1 H NMR spectrum (bottom, in CDCl 3 ) of [ppy 2 IrNH] + PF 6 -.") Supplementary Figure 1. Mass spectrum (top) and 1 H NMR spectrum (bottom, in CDCl 3 ) of [ppy 2 IrNH] + PF 6 -. 1 Supplementary Figure 2. Mass spectrum (top) and 1 H NMR spectrum (bottom, in CDCl 3 ) of
Supplementary Figure 1. Mass spectrum (top) and 1 H NMR spectrum (bottom, in CDCl 3 ) of [ppy 2 IrNH] + PF 6 -. 1 Supplementary Figure 2. Mass spectrum (top) and 1 H NMR spectrum (bottom, in CDCl 3 ) of
Photonics applications II. Ion-doped ChGs
 Photonics applications II Ion-doped ChGs 1 ChG as a host for doping; pros and cons - Important - Condensed summary Low phonon energy; Enabling emission at longer wavelengths Reduced nonradiative multiphonon
Supplementary Information. depending on the atomic thickness of intrinsic and chemically doped. MoS 2
 Electronic Supplementary Material (ESI) for Nanoscale. This journal is The Royal Society of Chemistry 2014 Supplementary Information Confocal absorption spectral imaging of MoS 2 : Optical transitions
Luminescence. Photoluminescence (PL) is luminescence that results from optically exciting a sample.
 is luminescence that results from optically exciting a sample.") Luminescence Topics Radiative transitions between electronic states Absorption and Light emission (spontaneous, stimulated) Excitons (singlets and triplets) Franck-Condon shift(stokes shift) and vibrational
Luminescence Topics Radiative transitions between electronic states Absorption and Light emission (spontaneous, stimulated) Excitons (singlets and triplets) Franck-Condon shift(stokes shift) and vibrational
Combined Excitation Emission Spectroscopy of Europium ions in GaN and AlGaN films
 Mater. Res. Soc. Symp. Proc. Vol. 866 2005 Materials Research Society V3.6.1 Combined Excitation Emission Spectroscopy of Europium ions in GaN and AlGaN films V.Dierolf 1, Z. Fleischman 1, and C, Sandmann
Lasers PH 645/ OSE 645/ EE 613 Summer 2010 Section 1: T/Th 2:45-4:45 PM Engineering Building 240
 Lasers PH 645/ OSE 645/ EE 613 Summer 2010 Section 1: T/Th 2:45-4:45 PM Engineering Building 240 John D. Williams, Ph.D. Department of Electrical and Computer Engineering 406 Optics Building - UAHuntsville,
Excited States in Organic Light-Emitting Diodes
 Excited States in Organic Light-Emitting Diodes The metal-to-ligand charge transfer (MLCT) excited states of d 6 π coordination compounds have emerged as the most efficient for solar harvesting and sensitization
Anti-Bunching from a Quantum Dot
 Anti-Bunching from a Quantum Dot Gerardo I. Viza 1, 1 Department of Physics and Astronomy, University of Rochester, Rochester, NY 14627 We study the nature of non-classical single emitter light experimentally
Supporting Information for: Enhancing the Performance of CdSe/CdS Dot-in- Rod Light Emitting Diodes via Surface Ligand.
 Supporting Information for: Enhancing the Performance of CdSe/CdS Dot-in- Rod Light Emitting Diodes via Surface Ligand Modification Prachi Rastogi a,b, Francisco Palazon a, Mirko Prato c, Francesco Di
LABORATORY OF ELEMENTARY BIOPHYSICS
 LABORATORY OF ELEMENTARY BIOPHYSICS Experimental exercises for III year of the First cycle studies Field: Applications of physics in biology and medicine Specialization: Molecular Biophysics Fluorescence
Near-infrared organic light-emitting diodes with very high external quantum efficiency and radiance
 In the format provided by the authors and unedited. SUPPLEMENTARY INFORMATION DOI: 10.1038/NPHOTON.2016.230 Near-infrared organic light-emitting diodes with very high external quantum efficiency and radiance
Colloidal Single-Layer Quantum Dots with Lateral Confinement Effects on 2D Exciton
 Supporting Information Colloidal Single-Layer Quantum Dots with Lateral Confinement Effects on 2D Exciton Ho Jin,, Minji Ahn,,,, Sohee Jeong,,, Jae Hyo Han,,, Dongwon Yoo,, Dong Hee Son, *, and Jinwoo
Organic LEDs part 6. Exciton Recombination Region in Organic LEDs. Handout: Bulovic, et al., Chem. Phys. Lett. 287, 455 (1998); 308, 317 (1999).
; 308, 317 (1999).") Organic LEDs part 6 Exciton Recombination Region in Organic LEDs White OLED Flexible OLEDs Solvation Effect Solid State Solvation Handout: Bulovic, et al., Chem. Phys. Lett. 287, 455 (1998); 308, 317 (1999).
Organic LEDs part 6 Exciton Recombination Region in Organic LEDs White OLED Flexible OLEDs Solvation Effect Solid State Solvation Handout: Bulovic, et al., Chem. Phys. Lett. 287, 455 (1998); 308, 317 (1999).
Haiyang Sun, Huimin Guo,* Wenting Wu, Xin Liu, Jianzhang Zhao*
 Electronic Supplementary Information for: Coumarin phosphorescence observed with ^ Pt(II) bisacetylide complex and its applications for luminescent oxygen sensing and triplet-triplet-annihilation based
Chapter 6. Electronic spectra and HOMO-LUMO studies on Nickel, copper substituted Phthalocyanine for solar cell applications
 Chapter 6 Electronic spectra and HOMO-LUMO studies on Nickel, copper substituted Phthalocyanine for solar cell applications 6.1 Structures of Ni, Cu substituted Phthalocyanine Almost all of the metals
Biologically Inspired Organic Light-Emitting Diodes
 Supporting Information Biologically Inspired Organic Light-Emitting Diodes Jae-Jun Kim,, Jaeho Lee, Sung-Pyo Yang, Ha Gon Kim, Hee-Seok Kweon ǁ, Seunghyup Yoo, and Ki-Hun Jeong*, Department of Bio and
Laboratory 3: Confocal Microscopy Imaging of Single Emitter Fluorescence and Hanbury Brown, and Twiss Setup for Photon Antibunching
 Laboratory 3: Confocal Microscopy Imaging of Single Emitter Fluorescence and Hanbury Brown, and Twiss Setup for Photon Antibunching Jonathan Papa 1, * 1 Institute of Optics University of Rochester, Rochester,
Aluminum for nonlinear plasmonics: Methods Section
 Aluminum for nonlinear plasmonics: Methods Section Marta Castro-Lopez, Daan Brinks, Riccardo Sapienza, and Niek F. van Hulst, ICFO - Institut de Ciencies Fotoniques, and ICREA - Institució Catalana de
Supplementary Figures
 Supplementary Figures Supplementary Figure. X-ray diffraction pattern of CH 3 NH 3 PbI 3 film. Strong reflections of the () family of planes is characteristics of the preferred orientation of the perovskite
Judd-Ofelt intensity parameters
 Spectral properties of Nd 3+ ion in new fluorophosphates glasses: Judd-Ofelt intensity parameters J. H. Choi and F. G. Shi * Department of Chemical Engineering and Materials Science, University of California,
In order to determine the energy level alignment of the interface between cobalt and
 SUPPLEMENTARY INFORMATION Energy level alignment of the CuPc/Co interface In order to determine the energy level alignment of the interface between cobalt and CuPc, we have performed one-photon photoemission
Abstract. Introduction
 Organic Materials in Optoelectronic Applications: Physical Processes and Active Devices Jonnalagadda Padmarani Department of Physics (Opto Electronics), Osmania University, TS, India Abstract The present
Laser. emission W FL
 W Laser Laser emission W FL Supplementary Figure 1. Comparison between fluorescence and laser emission spectra. The fluorescence has broad spectrum whereas the laser has very narrow spectrum. W FL and
Supplementary Materials
 Supplementary Materials Sample characterization The presence of Si-QDs is established by Transmission Electron Microscopy (TEM), by which the average QD diameter of d QD 2.2 ± 0.5 nm has been determined
Last Updated: April 22, 2012 at 7:49pm
 Page 1 Electronic Properties of d 6 π Coordination Compounds The metal-to-ligand charge transfer (MLCT) excited states of d 6 π coordination compounds have emerged as the most efficient for both solar
Supplementary Material (ESI) for Dalton Transactions This journal is The Royal Society of Chemistry 2011
 for Dalton Transactions This journal is The Royal Society of Chemistry 2011") upplementary Material (EI) for Dalton Transactions This journal is The Royal ociety of Chemistry 211 Electronic upplementary Information for: Accessing the long-lived emissive 3 IL triplet excited states
upplementary Material (EI) for Dalton Transactions This journal is The Royal ociety of Chemistry 211 Electronic upplementary Information for: Accessing the long-lived emissive 3 IL triplet excited states
Temperature dependence of the triplet diffusion and quenching rates in films of an Ir ppy 3 -cored dendrimer
 Temperature dependence of the triplet diffusion and quenching rates in films of an Ir ppy 3 -cored dendrimer J. C. Ribierre, A. Ruseckas, I. D. W. Samuel, S. V. Staton, 2 and P. L. Burn 2,3 Organic Semiconductor
Optical properties of nano-silicon
 Bull. Mater. Sci., Vol. 4, No. 3, June 001, pp. 85 89. Indian Academy of Sciences. Optical properties of nano-silicon S TRIPATHY, R K SONI*, S K GHOSHAL and K P JAIN Department of Physics, Indian Institute
Supplementary Figures
 Supplementary Figures iso ( =2900 cm -1 ) 1.0 0.8 0.6 0.4 0.2 0.0-0.2-0.4 pump cm -1 3450 cm -1 cm -1 cm -1-0.5 0.0 0.5 1.0 1.5 2.0 2.5 delay [ps] Supplementary Figure 1: Raw infrared pump-probe traces.
Interaction between Single-walled Carbon Nanotubes and Water Molecules
 Workshop on Molecular Thermal Engineering Univ. of Tokyo 2013. 07. 05 Interaction between Single-walled Carbon Nanotubes and Water Molecules Shohei Chiashi Dept. of Mech. Eng., The Univ. of Tokyo, Japan
NPTEL/IITM. Molecular Spectroscopy Lectures 1 & 2. Prof.K. Mangala Sunder Page 1 of 15. Topics. Part I : Introductory concepts Topics
 Molecular Spectroscopy Lectures 1 & 2 Part I : Introductory concepts Topics Why spectroscopy? Introduction to electromagnetic radiation Interaction of radiation with matter What are spectra? Beer-Lambert
Supplementary Figures:
 Supplementary Figures: dcdtbt vibration spectrum: Ground state blue vs Cation state red Intensity a.u. 1000 1100 1200 1300 1400 1500 1600 1700 Frequency cm^1 dcdtbt vibration spectrum: Ground state blue
Energy Transfer Upconversion Processes
 1. Up-conversion Processes Energy Transfer Upconversion Processes Seth D. Melgaard NLO Final Project The usual fluorescence behavior follows Stokes law, where exciting photons are of higher energy than
Supporting Information
 Supporting Information Distinct Mechanoresponsive Luminescence, Thermochromism, Vapochromism and Chlorine Gas Sensing by a Solid-State Organic Emitter S1 Figure S1. 1 H NMR (in CDCl 3 ) spectra of as synthesized
Enhancing the Rate of Spontaneous Emission in Active Core-Shell Nanowire Resonators
 Chapter 6 Enhancing the Rate of Spontaneous Emission in Active Core-Shell Nanowire Resonators 6.1 Introduction Researchers have devoted considerable effort to enhancing light emission from semiconductors
Temperature Dependent Optical Band Gap Measurements of III-V films by Low Temperature Photoluminescence Spectroscopy
 Temperature Dependent Optical Band Gap Measurements of III-V films by Low Temperature Photoluminescence Spectroscopy Linda M. Casson, Francis Ndi and Eric Teboul HORIBA Scientific, 3880 Park Avenue, Edison,
Enhancement of Light Outcoupling Efficiency in OLEDs
 Enhancement of Light Outcoupling Efficiency in OLEDs Stéphane Altazin*, Lidia Stepanova*, Lieven Penninck*, Christoph Kirsch**, Beat Ruhstaller** *Fluxim AG, Winterthur, Switzerland **Zurich University
Hyeyoung Shin a, Tod A. Pascal ab, William A. Goddard III abc*, and Hyungjun Kim a* Korea
 The Scaled Effective Solvent Method for Predicting the Equilibrium Ensemble of Structures with Analysis of Thermodynamic Properties of Amorphous Polyethylene Glycol-Water Mixtures Hyeyoung Shin a, Tod
Effect of Electric Field on Condensed-Phase Molecular Systems. II. Stark Effect on the Hydroxyl Stretch Vibration of Ice
 Effect of Electric Field on Condensed-Phase Molecular Systems. II. Stark Effect on the Hydroxyl Stretch Vibration of Ice Sunghwan Shin, Hani Kang, Daeheum Cho, Jin Yong Lee, *, and Heon Kang *, Department
Effects of Si doping on optical properties of GaN epitaxial layers
 (123) 31 Effects of Si doping on optical properties of GaN epitaxial layers Chiharu SASAKI (Department of Electrical and Electronic Engineering) Tatsuya YAMASHITA (Department of Electrical and Electronic
Supporting Information
 Supporting Information Mulifunctional Dendritic Emitter: Aggregation-Induced Emission Enhanced, Thermally Activated Delayed Fluorescent Material for Solution- Processed Multilayered Organic Light-Emitting
Molecular spectroscopy Multispectral imaging (FAFF 020, FYST29) fall 2017
 fall 2017") Molecular spectroscopy Multispectral imaging (FAFF 00, FYST9) fall 017 Lecture prepared by Joakim Bood joakim.bood@forbrf.lth.se Molecular structure Electronic structure Rotational structure Vibrational
Molecular spectroscopy Multispectral imaging (FAFF 00, FYST9) fall 017 Lecture prepared by Joakim Bood joakim.bood@forbrf.lth.se Molecular structure Electronic structure Rotational structure Vibrational
Gratings in Electrooptic Polymer Devices
 Gratings in Electrooptic Polymer Devices Venkata N.P.Sivashankar 1, Edward M. McKenna 2 and Alan R.Mickelson 3 Department of Electrical and Computer Engineering, University of Colorado at Boulder, Boulder,
Chapter 15 Molecular Luminescence Spectrometry
 Chapter 15 Molecular Luminescence Spectrometry Two types of Luminescence methods are: 1) Photoluminescence, Light is directed onto a sample, where it is absorbed and imparts excess energy into the material
Supplementary Figure 1 XRD and Raman spectrum characterization of GQDs. a, XRD pattern of GQDs. b, Raman spectrum of GQDs, the appearance of the mode
 Supplementary Figure 1 XRD and Raman spectrum characterization of GQDs. a, XRD pattern of GQDs. b, Raman spectrum of GQDs, the appearance of the mode at 1456 cm -1 is not fully understood. Nevertheless,
Development and application for X-ray excited optical luminescence (XEOL) technology at STXM beamline of SSRF
 technology at STXM beamline of SSRF") Development and application for X-ray excited optical luminescence (XEOL) technology at STXM beamline of SSRF Content Introduction to XEOL Application of XEOL Development and Application of XEOL in STXM
Development and application for X-ray excited optical luminescence (XEOL) technology at STXM beamline of SSRF Content Introduction to XEOL Application of XEOL Development and Application of XEOL in STXM
Supplementary Figure 2 Photoluminescence in 1L- (black line) and 7L-MoS 2 (red line) of the Figure 1B with illuminated wavelength of 543 nm.
 and 7L-MoS 2 (red line) of the Figure 1B with illuminated wavelength of 543 nm.") PL (normalized) Intensity (arb. u.) 1 1 8 7L-MoS 1L-MoS 6 4 37 38 39 4 41 4 Raman shift (cm -1 ) Supplementary Figure 1 Raman spectra of the Figure 1B at the 1L-MoS area (black line) and 7L-MoS area (red
PL (normalized) Intensity (arb. u.) 1 1 8 7L-MoS 1L-MoS 6 4 37 38 39 4 41 4 Raman shift (cm -1 ) Supplementary Figure 1 Raman spectra of the Figure 1B at the 1L-MoS area (black line) and 7L-MoS area (red
Determination of Kamlet-Taft parameters for selected solvate ionic liquids.
 Electronic Supplementary Material (ESI) for Physical Chemistry Chemical Physics. This journal is the Owner Societies 2016 Determination of Kamlet-Taft parameters for selected solvate ionic liquids. Daniel
Ziessel a* Supporting Information (75 pages) Table of Contents. 1) General Methods S2
 Table of Contents. 1) General Methods S2") S1 Chemistry at Boron: Synthesis and Properties of Red to Near-IR Fluorescent Dyes based on Boron Substituted Diisoindolomethene Frameworks Gilles Ulrich, a, * Sebastien Goeb a, Antoinette De Nicola a,
S1 Chemistry at Boron: Synthesis and Properties of Red to Near-IR Fluorescent Dyes based on Boron Substituted Diisoindolomethene Frameworks Gilles Ulrich, a, * Sebastien Goeb a, Antoinette De Nicola a,
Electronic Spectra of Complexes
 Electronic Spectra of Complexes Interpret electronic spectra of coordination compounds Correlate with bonding Orbital filling and electronic transitions Electron-electron repulsion Application of MO theory
Towards the Lasing Spaser: Controlling. Metamaterial Optical Response with Semiconductor. Quantum Dots
 Towards the Lasing Spaser: Controlling Metamaterial Optical Response with Semiconductor Quantum Dots E. Plum, V. A. Fedotov, P. Kuo, D. P. Tsai, and N. I. Zheludev,, Optoelectronics Research Centre, University
Photothermal Spectroscopy Lecture 2 - Applications
 Photothermal Spectroscopy Lecture 2 - Applications Aristides Marcano Olaizola (PhD) Research Professor Department of Physics and Engineering Delaware State University, US 1 Outlook 1. Optical characterization
Observation of charged excitons in hole-doped carbon nanotubes using photoluminescence and absorption spectroscopy
 Observation of charged excitons in hole-doped carbon nanotubes using photoluminescence and absorption spectroscopy Ryusuke Matsunaga 1, Kazunari Matsuda 1, and Yoshihiko Kanemitsu 1,2 1 Institute for Chemical
Organic LEDs part 7. Exciton Dynamics in Disordered Organic Thin Films. Handout on QD-LEDs: Coe et al., Nature 420, 800 (2002).
.") Organic LEDs part 7 Solvation Effect - Review Solid State Solvation Exciton Dynamics in Disordered Organic Thin Films Quantum Dot LEDs Handout on QD-LEDs: Coe et al., ature 420, 800 (2002). @ MIT April
Organic LEDs part 7 Solvation Effect - Review Solid State Solvation Exciton Dynamics in Disordered Organic Thin Films Quantum Dot LEDs Handout on QD-LEDs: Coe et al., ature 420, 800 (2002). @ MIT April
Supplementary Figure 1 Comparison between normalized and unnormalized reflectivity of
 Supplementary Figures Supplementary Figure 1 Comparison between normalized and unnormalized reflectivity of bulk SrTiO 3. The normalized high-energy reflectivity (0.5 35 ev) of SrTiO 3 is compared to the
1. Transition dipole moment
 1. Transition dipole moment You have measured absorption spectra of aqueous (n=1.33) solutions of two different chromophores (A and B). The concentrations of the solutions were the same. The absorption
PHYS 219 General Physics: Electricity, Light and Modern Physics
 PHYS 219 General Physics: Electricity, Light and Modern Physics Final exam is scheduled on Thursday May 2 @ 8 10 AM In Physics 112 It will cover five Chapters 25, 27, 28, 29, and 30. Review lecture notes,
Supplementary Information
 Electronic Supplementary Material (ESI) for Nanoscale. This journal is The Royal Society of Chemistry 2014 Supplementary Information Large-scale lithography-free metasurface with spectrally tunable super
SUPPLEMENTARY INFORMATION
 SUPPLEMENTARY INFORMATION Supplementary Information Figure S1: (a) Initial configuration of hydroxyl and epoxy groups used in the MD calculations based on the observations of Cai et al. [Ref 27 in the
Semiconductor Polymer
 Semiconductor Polymer Organic Semiconductor for Flexible Electronics Introduction: An organic semiconductor is an organic compound that possesses similar properties to inorganic semiconductors with hole
Wavelength λ Velocity v. Electric Field Strength Amplitude A. Time t or Distance x time for 1 λ to pass fixed point. # of λ passing per s ν= 1 p
 Introduction to Spectroscopy (Chapter 6) Electromagnetic radiation (wave) description: Wavelength λ Velocity v Electric Field Strength 0 Amplitude A Time t or Distance x Period p Frequency ν time for 1
What happens when light falls on a material? Transmission Reflection Absorption Luminescence. Elastic Scattering Inelastic Scattering
 Raman Spectroscopy What happens when light falls on a material? Transmission Reflection Absorption Luminescence Elastic Scattering Inelastic Scattering Raman, Fluorescence and IR Scattering Absorption
Supplementary Figure 1. Schematics of light transmission and reflection from a slab confined between
 Supplementary Figures: Supplementary Figure. Schematics of light transmission and reflection from a slab confined between two infinite media. Supplementary Figure. Reflectivity of a magneto-electric slab
Full-Color Light-Emitting Carbon Dots with a Surface-State
 Supporting information Full-Color Light-Emitting Carbon Dots with a Surface-State -Controlled Luminescence Mechanism Hui Ding, Shang-Bo Yu, Ji-Shi Wei and Huan-Ming Xiong* Department of Chemistry, Fudan
Supplementary Figure 1 XRD pattern of a defective TiO 2 thin film deposited on an FTO/glass substrate, along with an XRD pattern of bare FTO/glass
 Supplementary Figure 1 XRD pattern of a defective TiO 2 thin film deposited on an FTO/glass substrate, along with an XRD pattern of bare FTO/glass and a reference pattern of anatase TiO 2 (JSPDS No.: 21-1272).
A Photonic Crystal Laser from Solution Based. Organo-Lead Iodide Perovskite Thin Films
 SUPPORTING INFORMATION A Photonic Crystal Laser from Solution Based Organo-Lead Iodide Perovskite Thin Films Songtao Chen 1, Kwangdong Roh 2, Joonhee Lee 1, Wee Kiang Chong 3,4, Yao Lu 5, Nripan Mathews
Journal of Materials Chemistry C
 Journal of Materials Chemistry C RSCPublishing Cite this: DOI: 10.1039/x0xx00000x Received 00th January 2012, Accepted 00th January 2012 DOI: 10.1039/x0xx00000x www.rsc.org/ Correlating the transition
Survival Strategy: Photosynthesis
 Energy and Electron Transfer Survival Strategy: Photosynthesis Light Energy Harvested by Plants 6 CO 2 + 6 H 2 O + light energy C 6 H 12 O 6 + 6 O 2 Importance of Photosynthesis Provides energy for plants
Supplementary Information for. Vibrational Spectroscopy at Electrolyte Electrode Interfaces with Graphene Gratings
 Supplementary Information for Vibrational Spectroscopy at Electrolyte Electrode Interfaces with Graphene Gratings Supplementary Figure 1. Simulated from pristine graphene gratings at different Fermi energy
PHOTO-DISSOCIATION OF CO 2 GAS BY USING TWO LASERS
 Proceedings of the 3rd Annual ISC Research Symposium ISCRS 9 April 14, 9, Rolla, Missouri PHOTO-DISSOCIATION OF CO GAS BY USING TWO LASERS Zhi Liang MAE department/zlch5@mst.edu Dr. Hai-Lung Tsai MAE department/tsai@mst.edu
New Concept of DPSSL
 New Concept of DPSSL - Tuning laser parameters by controlling temperature - Junji Kawanaka Contributors ILS/UEC Tokyo S. Tokita, T. Norimatsu, N. Miyanaga, Y. Izawa H. Nishioka, K. Ueda M. Fujita Institute
Electronic Supplementary Information
 Electronic Supplementary Material (ESI) for Journal of Materials Chemistry C. This journal is The Royal Society of Chemistry 2016 Electronic Supplementary Information Understanding the efficiency drooping
single-molecule fluorescence resonance energy transfer
 single-molecule fluorescence resonance energy transfer (2) determing the Förster radius: quantum yield, donor lifetime, spectral overlap, anisotropy michael börsch 26/05/2004 1 fluorescence (1) absorbance
Supplementary Figure S1. AFM characterizations and topographical defects of h- BN films on silica substrates. (a) (c) show the AFM height
 (c) show the AFM height") Supplementary Figure S1. AFM characterizations and topographical defects of h- BN films on silica substrates. (a) (c) show the AFM height topographies of h-bn film in a size of ~1.5µm 1.5µm, 30µm 30µm
Supplementary Figure S1. AFM characterizations and topographical defects of h- BN films on silica substrates. (a) (c) show the AFM height topographies of h-bn film in a size of ~1.5µm 1.5µm, 30µm 30µm
Molecular alignment, wavepacket interference and Isotope separation
 Molecular alignment, wavepacket interference and Isotope separation Sharly Fleischer, Ilya Averbukh and Yehiam Prior Chemical Physics, Weizmann Institute Yehiam.prior@weizmann.ac.il Frisno-8, Ein Bokek,
Nature. Single-molecule spectral fluctuations at room temperature
 Page 1 of 8 Main Search Page Display Knowledge Base He Full Text Save Article Text Email Article Text P Nature Single-molecule spectral fluctuations at room temperature Author(s): Lu, H. Peter; Xie, X.