PREDICTION OF SATURATED LIQUID VOLUMES FROM A MODIFIED VAN DER WAALS EQUATION. By Charles R. Koppany
|
|
|
- Natalie Harris
- 5 years ago
- Views:
Transcription
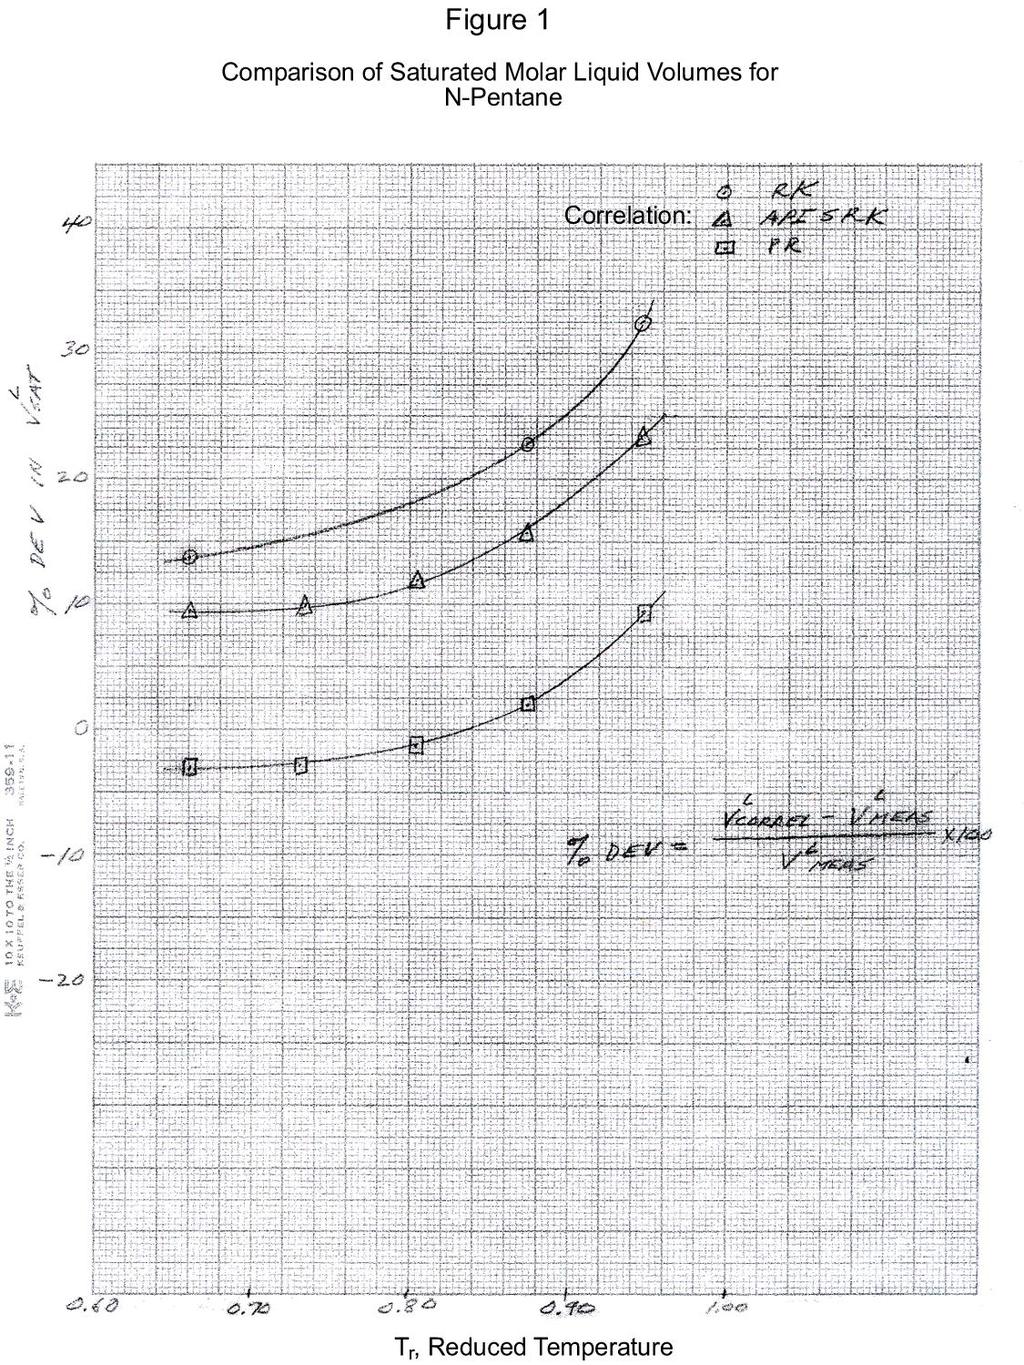
1 PREDICTION OF SATURATED LIQUID VOLUMES FROM A MODIFIED VAN DER WAALS EQUATION Part 1 By Charles R. Koppany Introduction Over the past 40 years or so, closed cubic (in volume) equations of state have been successfully used to predict PVT and thermodynamic properties of nonpolar substances and their mixtures. However, the most common weakness of nearly all of these equations is their inability to accurately or even reasonably predict saturated liquid volumes. For example, Figure 1 provides a comparison between measured saturated liquid volumes for n-pentane (1) and the corresponding values predicted by the Redlich-Kwong (2), Soave (3) and the Peng-Robinson (4) equations of state. The comparisons are plotted in terms of Percent (%) Deviation defined as: versus the reduced temperature, T r. vpred vmeas % Deviation x100 (1) v For the RK equation the deviations vary from being about 14 percent too high at T r = 0.66 to deviations in excess of 30 percent as the critical temperature is approached (T r = 1). Over the same range in T r the Soave deviations vary from about 10 to 25 percent. The PR equation shows improved prediction accuracy over the above two equations. The PR deviations for the saturated liquid volume of n-pentane are slightly negative for the lower T r range and then proceed to increase steadily to + 10 percent and higher as the critical point is approached. In their work Peng and Robinson inserted an additional term, namely b(v b), into the original Soave equation. It was introduced purposely with the objective of improving the prediction of liquid density and also provide a more realistic value for the universal critical compressibility factor i.e. Z c = as opposed to a value of Z c = as is generated by either the RK or Soave equations. In principle the RK, Soave, Peng-Robinson and other versions of the cubic-in-volume equation are basically extensions of the original van der Waals equation which was first proposed by J. D. van der Waals in Although not plotted on Figure 1, the deviations predicted by the original VDW equation for the v L of n-pentane vary from about 67 to 76 percent over the range of temperatures studied. In this work we attempt to modify the van der Waals equation to make it more accurately predict saturated liquid volumes for a host of (nonpolar) hydrocarbons and several polar nonhydrocarbons (NH 3, H 2 S and CO 2 ) including water. meas
2 The reason for choosing the VDW equation for this exercise was because of its fundamental simplicity. In principle, the fundamental procedure employed here could also be applied to any of the other extensions or modifications of the original VDW equation. -2- Review of the VDW Equation The first closed-cubic equation of state was proposed by van der Waals in He applied two correction factors to the basic ideal gas equation and arrived at the following PVT model: P0v 0 RT ( ideal gas format ) (2) where the amount by which the observed pressure P is less than P 0 is given by the relationship, and the observed volume v is given by, a PP0 (3) 2 v vv0 b (4) In other words, P 0 and v 0 are the effective pressure and molar volume if the fluid were actually an ideal gas. The term a/v 2 arises from the existence of intermolecular forces, and the constant b is proportional to the volume occupied by the molecules (atoms) themselves. It is then quite apparent from these proposed corrections that the final form of the van der Waals equation for one mole of fluid can be written as, For n moles of fluid it may be written as, a P 2 v b RT (5) v 2 an P 2 V nbnrt (6) V where V is the total volume (nv) occupied by n moles of fluid.
3 -3- The most fortunate circumstance here is that the van der Waals equation can be applied to either the vapor or the liquid phase. This is true because the equation is cubic in volume and, for a specified P and T, can have as many as three real roots for v. The largest root will generally apply to the vapor and the smallest to the liquid. Graphically, this can be depicted below: The isotherm T o (less than T c ), computed via the VDW equation, displays three roots at P o, the saturation vapor pressure. The middle root v / has no physical significance. As we mentioned previously, the desired root is either v L for the liquid or v g for the vapor. After rearrangement into a cubic polynomial in v, the van der Waals equation assumes the form: RT a ab 0 (7) P P P 3 2 v b v v Equation 7 can be transformed to a cubic in the compressibility factor after substitution of the identity v = zrt/p. The result is, 2 b P ap abp 1 0 (8) 3 RT R T RT 3 2 z z z 2 2 Furthermore, we can also define the following parameters and simplify the above expression to an even more compact form, In this case, the final result becomes, a P b P A B a b ; (9, ) RT 2 RT z 3 B z 2 Az AB 1 0 (10)
4 -4- With this form of the VDW equation, the largest (vapor) or smallest (liquid) root will still be sought in this case the correct value of z. The characteristic constants a and b are simply derived from the criteria for a pure substance that both a maximum in the saturation locus and a point of inflection coexist at the critical point shown as Point c on the above sketch. Mathematically, these criteria are expressed as: 2 P P v v 2 Tc, Pc Tc, Pc 0 (11) When these criteria are applied to Equation 5, the following expressions for a and b can be derived: R Tc R Tc a ; b ; zc (12 a, b, c) 64 P 8 P c c General Cubic EOS Form Abbott and Van Ness (5) have attempted to generalize all of the cubic equations of state with an expression of the form: RT v P v b 2 v bv v (13) Each of the five parameters b,,,, and can be made to depend on temperature and also upon composition if a single phase mixture of components is involved. The short table below classifies the van der Waals, Redlich-Kwong, Soave and Peng-Robinson equations according to the generalized equation form (Eqn. 13). Equation van der Waals a b 0 0 Redlich-Kwong a/t 0.5 b b 0 Soave a(t) b b 0 Peng-Robinson a(t) b 2b - b 2 With the Redlich-Kwong equation, the term 1/T 0.5 accompanies the parameter a. With the Soave and PR equations, the a parameter is treated as a generalized function of the temperature.
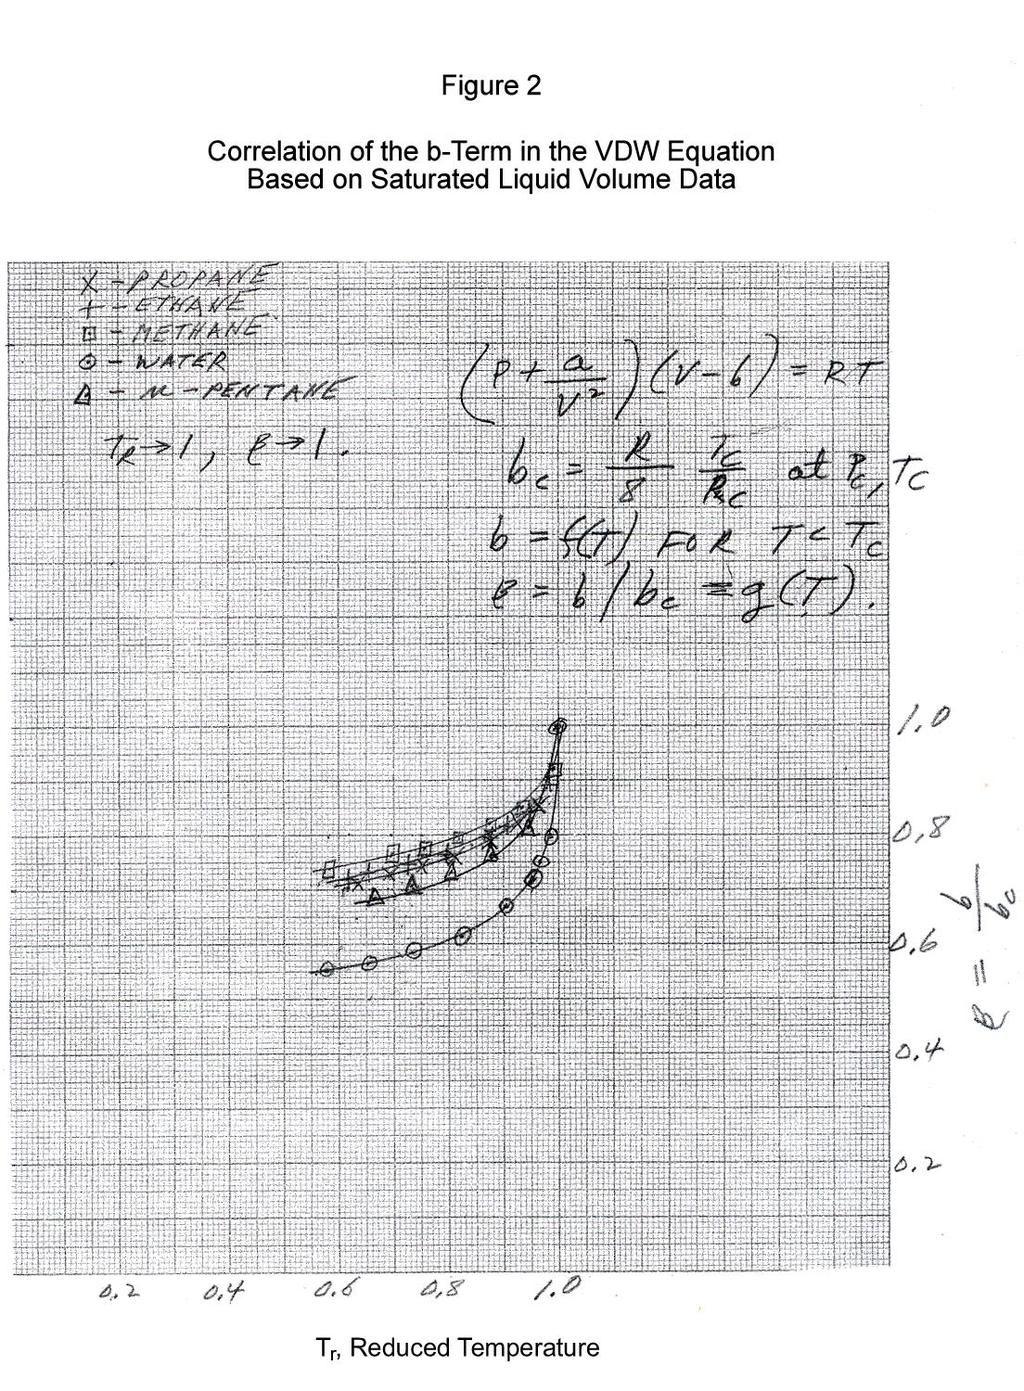
5 -5- The Culprit, v L b Table 1 provides an analysis of the term v L b for saturated liquid n- pentane. The specific liquid volumes listed here are the actual or measured values taken from Sage and Lacey (1). b is calculated directly by Equation 12b which was derived from the original VDW equation using the critical point criterion given in Equation(s) 11. As the temperature is increased from 100 to 340 deg. F, at intervals of 60 deg. F, we observe that the term v L b goes from being slightly negative to that of being slightly positive. At some point between 220 and 280 deg. F, the value of v L b becomes zero. In other words, a singularity point occurs in the first term of Equation 5 when it is written in the alternate form: RT a P (14) v b v 2 A point of singularity here implies that P vp. This is a fundamental problem which all of the other cubic equations of state share in common. In Table 2 we give a comparison of predicted saturated liquid and vapor specific volumes for n-pentane and water by the original VDW equation against the corresponding measured values. For n-pentane the predicted liquid volumes are high by about 70 percent on the average. For water the average trend easily exceeds 100 percent. The predicted vapor specific volumes are fairly reasonable. The resulting average trends are percent and 9.0 percent for n-pentane and water respectively. A Newton-Raphson algorithm is used to solve Equation 10 for the desired root (v or z). For the liquid phase the procedure seeks the smallest root which will be significantly greater than b in order to avoid the convergence instability that would occur around point of singularity. As a result, we would expect a predicted value for v L that turns out to be on the high side of the measured value. For the vapor phase this problem will generally not occur because v g >> b in all cases. The Beta Function In this paper we propose a temperature-dependent function designated as Beta () which will be used to modify the van der Waals b term with the primary objective of improving the prediction of saturated liquid volumes and also insure that the quantity v L b is always greater than zero i.e. v L b > 0. First let us designate the original VDW volume correction parameter by the symbol b c where b c = (R/8)(T c /P c ). Then the correct value of b is related to b c via the Beta function as follows:
6 -6- b bbc or b c (15) The basic correlation approach here is to first rearrange Equation 5 into a form that can be solved explicitly for b: bv RT a P v 2 (16) Next we choose a pure component for which there is an abundance of saturated v L data. We can then impose the experimental values of v L, T and vapor pressure P sat on Equation 16 and calculate the corresponding value for b. is then readily calculated from Equation 15. In all cases, the parameter a is calculated from the classical VDW definition given by Equation 12a (a = a c ). This process is repeated for each data point for a given component. We are now in a position to attempt to correlate as a function of T or T r for each component considered. The next challenge would be whether or not a generalized correlation for can be achieved for all of the components studied or considered. In other words, can we also achieve a cross-correlation of the function with some component identification or characterization parameter such as the Pitzer acentric factor. Actual Correlation of Appendix I lists saturated liquid P- V T data for a host of different hydrocarbon types and four nonhydrocarbons, namely H 2 S, CO 2, NH 3 and water. The majority of the data listed here were read from the vapor pressure and liquid specific gravity charts found in the Data Book of the American Petroleum Institute (6). With exception, the saturated P- V T data for n-pentane were taken from the work of Sage and Lacey (1). For water the points were read from the steam tables of Keenan and Keyes (7). For CO 2 the tabulated data of F. Din (8) were utilized. A BASIC computer program was used to generate values for all of the data sets listed in Appendix I. For convenience of reference, these values are tabulated in Appendix II as a function of temperature for each component. Figure 2 is a plot of the function versus reduced temperature (T r = T/T c ) for several of the paraffinic hydrocarbons plus water. In each case, the value of the function is less than one, increases continuously with increasing temperature, and approaches a value of unity as the critical temperature is approached i.e. 1 as T r 1. This general behavior was followed by all of the components listed in Appendix 1.
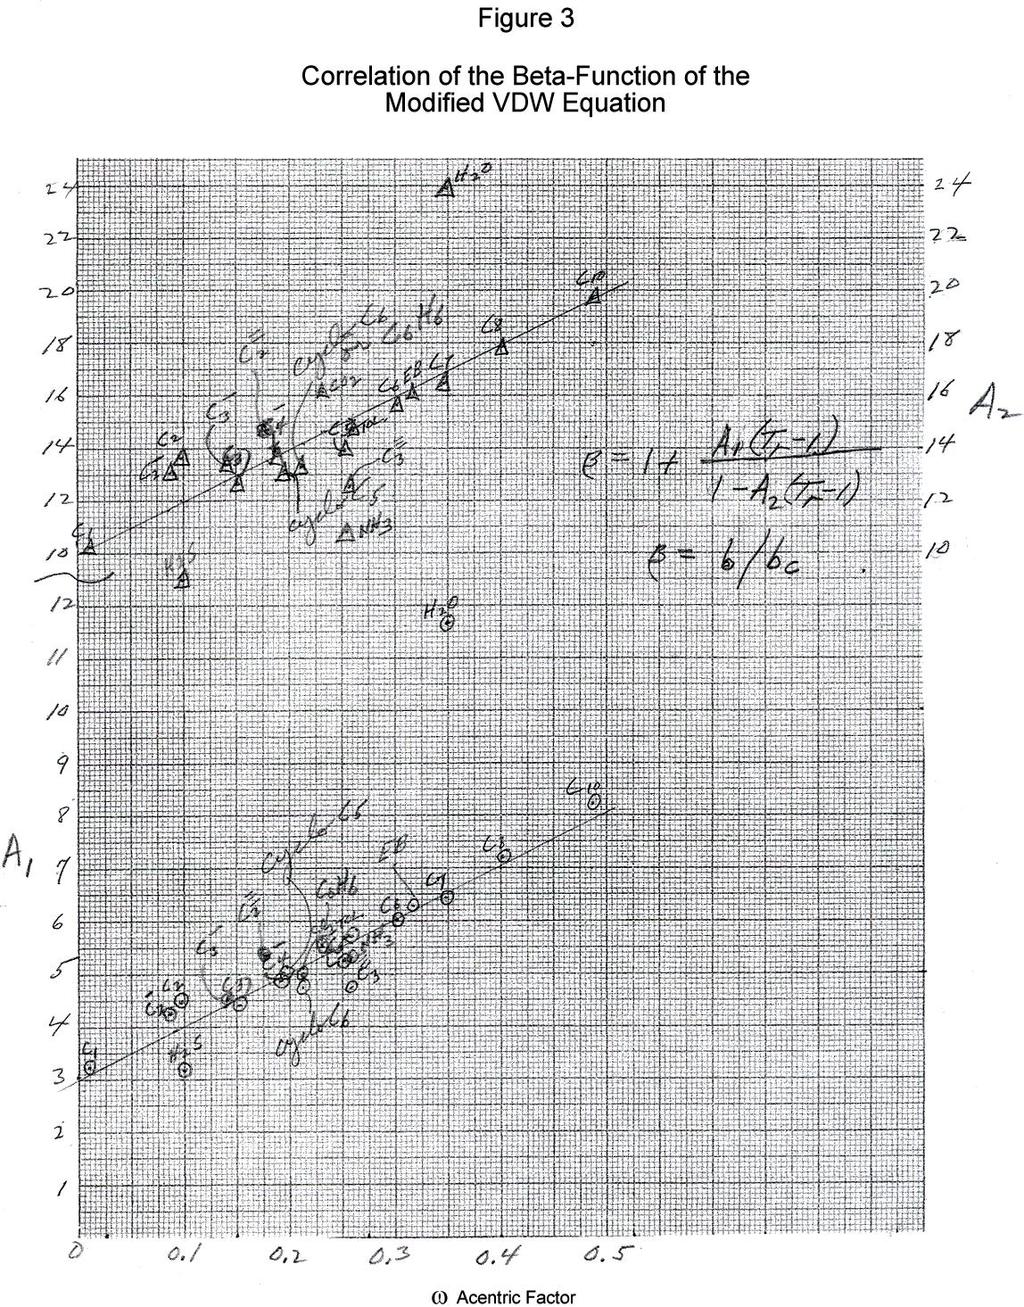
7 -7- It was determined that the form of the curves shown in Figure 2 can be represented by a rectangular hyperbola ( 9). For our particular application we employed a correlation equation of the (hyperbolic) form: r A T 1 1 A T (17) It is should immediately be noted here that Equation 17 is automatically constrained to the required condition that, 2 r 1as T r 1 A least squares regression routine found in the spreadsheet program EXCEL was used to fit the coefficients A 1 and A 2 of Equation 17. These coefficients are listed in Table 3 by component. In addition the percent trends and percent absolute average deviations showing the goodness of each fit are listed along with each component s value of the acentric factor. Figure 3 shows a set of cross plots of the coefficients A 1 and A 2 as a function of component Pitzer acentric factor defined by the classical expression: Log 10 P Pc sat Tr (18) The majority of the hydrocarbon points for A 1 and A 2 fall satisfactorily along separate straight lines each with a positive slope. The points for ammonia, hydrogen sulfide and especially water displayed significant departures from these lines. A least squares analysis for A 1 and A 2 as a function of was performed on all of the hydrocarbons plus CO 2. NH 3, H 2 S and H 2 O were excluded from these fits. This regression process led to following linear expressions: A (19) 1 A (20) 2 For the 19 points correlated here for each coefficient, the following statistical goodness of fit resulted:
8 -8- Coefficient % Trend % Abs. Avg. Dev. A A Prediction Accuracy Tables 4 through 6 show how well the proposed modified VDW equation predicts saturated liquid volumes for the components propylene, n-pentane and benzene. In addition, the predictions of the very popular Rackett equation (10) are also listed for further comparison purposes. The Rackett equation is given by the temperature-dependent expression: v SL RT Pc c Z 2 / T r RA (21) The author (10) reports Rackett factors Z RA for 64 hydrocarbons and 47 nonhydrocarbons and says that the accuracy of Equation 21 over the whole range of temperatures from the triple point to the critical point is generally better than 1 percent. For each of the three components tested, the temperature range of comparison extended from around the normal boiling point up to near the critical point. Individual point (percent) deviations in v L are defined by Equation 1. The overall percentage trends are summarized below: No. of Pts. Overall % Trend Overall % Trend Comp. Compared Modifed VDW Rackett Eqn.. Propylene n-pentane Benzene With the exception of n-pentane, the Rackett equation produces smaller overall trends than does the modified VDW equation. Close inspection of Tables 4-6 shows that the largest deviations in the Modified VDW predictions occur near the critical temperature. Here the predictions are high by as much as 20 percent. If we go back to Figure 2, we see that the -function generally rises very sharply as it nears the critical point (T r 1). Therefore, it is not surprising that the VDW deviations increase in this region because of the greater sensitivity of changes in the -function with small changes in temperature.
9 -9- Tables 7 and 8 show the prediction accuracy of the modified VDW equation for n- pentane and water in the compressed liquid regions. The constants A 1 and A 2 for water were not computed from Equations 19 and 20 but were read directly from Table 3. In all cases the modified VDW predicts the small isothermal decrease in the specific volume with increasing pressure or compression. For either of these components the prediction accuracy is very good; however, as the critical temperature is approached, the deviations begin to increase. The only advantage here of using the modified VDW equation is that the Rackett equation is applicable to saturated liquids only. Finally, we performed a check on the accuracy of the proposed modified VDW equation above for predicting the saturated vapor volume of n-pentane and water. This analysis is shown in Table 9. The overall results are summarized below along with a comparison with the overall predictions of the original VDW equation taken from Table 2. n-pentane (saturated vapor volume) No. of Pts. Overall % Trend Overall % Trend Compared Modified VDW Original VDW Water In Summary In this paper we are proposing a (3-parameter) modification to the van der Waals equation of state that will greatly enhance its ability to accurately predict saturated liquid specific volumes for pure component hydrocarbons and several nonhydrocarbons, including water. The main feature of this proposed work is the application of a temperature-dependent correction parameter Beta () for the van der Waals b constant which in turn is related to the volume occupied by the molecules of the species in question. A successful generalized correlation of the Beta-parameter (Equations 17, 19 and 20) as a function of Tr (reduced temperature) and (acentric factor) has been achieved. The exception would be for the components hydrogen sulfide, ammonia and water. For these nonhydrocarbons it is best to use the specific coefficients listed in Table 3 for use in Equation 17.
10 -10- The modified VDW provides a prediction accuracy for saturated liquid volumes that is commensurate with the classical Rackett equation except in the region of the critical point. In this region, the modified VDW predictions trend on the high side with deviations as high as 20 percent being possible. The modified VDW has one major advantage over the Rackett equation in that it can be applied to the compressed liquid region. In principle, the fundamental correlation approach presented here could also be applied to any of the other extensions of the original VDW (cubic in v) equation such as the Redlich-Kwong and Soave equations. The Peng-Robinson equation has already been adapted to effect a significant improvement in the prediction of saturated liquid volumes. A follow up paper to this one will provide a detailed comparison of the PR equation with the proposed modification of the VDW equation.
11 -11- List of References 1. Sage and Lacey, Industrial and Engr. Chem., Vol. 34, No. 6 (1942). 2. Redlich, O, and Kwong, J.N.S., Chemical Reviews, Vol. 44, (1949) Page Soave, G., Chemical Engr. Science, Vol. 27, No. 6-A, (1972) Page Peng, D-Y and Robinson, D.B., Ind. Engr. Chem. Fundam., Vol. 15, No. 1 (1976) Page Van Ness, H.C. and Abbott, M.M., Classical Thermodynamics of Nonelectrolyte Solutions, McGraw-Hill Book Co., (1982), Pages Data Book of the American Petroleum Institute (API), Division of Refining. 7. Keenan, Keyes, Hill and Moore, Steam Tables, John Wiley & Sons (1969) 8. Din, F, Thermodynamic Properties of Gases, Vol. 1, NH 3, CO 2, CO, Butterworths (1956). 9. Hohmann, E.C. and Lockhart, F.J. Remember the Hyperbola, Chem. Tech., (Oct. 1972), Page Rackett, H. G., Jr. Chem. Engr. Data, Vol. 15, (1970), Page 514.
12 Table 1 An Analysis of the Term v - b Generated From the Original van der Waals EOS for Saturated Liquid n-pentane VL * Vapor Measured bc = Temp. Pressure Liq. Volume Tc Pc (R/8)(Tc/Pc) VL - bc deg. F Psia Cuft/Lb deg. F Psia Cuft/Lb Cuft/Lb * Experimental saturated liquid volumes for n-pentane were taken from Sage and Lacey, IEC, Vol. 34, No. 6 (1942).
13 Table 2 Comparison of Predicted Saturated Liquid and Vapor Specific Volumes by the Original van der Waals EOS Against the Corresponding Experimental Values I. N-Pentane Sheet 1 Saturated Liquid Volumes Saturated Vapor Volumes Temp. Vapor Pressure VL, Cuft/Lb Deg. F Psia Exper.* VL, Cuft/Lb % Dev. VG, Cuft/Lb Orig. VDW ** Exper.* VG, Cuft/Lb % Dev. Orig. VDW ** Trend, % = * Experimental liquid and vapor specific volumes are taken from Sage and Lacey, IEC, Vol. 34 No. 6 (1942). ** % Dev = 100 * (V-Pred. - V-Exper.)/ V-Exper. II. Water Saturated Liquid Volumes Saturated Vapor Volumes Temp. Vapor Pressure VL, Cuft/Lb Deg. F Psia Exper. * VL, Cuft/Lb % Dev VG, Cuft/Lb Orig. VDW ** Exper.* VG, Cuft/Lb % Dev Orig. VDW ** Trend, % = * Experimental liquid and vapor specific volumes are taken from the steam tables of Keenan and Keyes. ** % Dev = 100*(V-Pred. - V-Exper.)/V- Exper.
14 Table 3 Summary of Values for the Constants A 1 and A 2 In Equation 17 by Component r A T A2 Tr 1 1 Comp. A 1 A 2 % Trend % Abs. Avg. Dev. Methane Ethane Propane n-pentane n-hexane n-heptane n-octane n-decane Ethylene Propylene Butene Cyclopentane Cyclohexane Acetylene Propyne Benzene Toluene Ethylbenzene H 2 S CO NH Water
15 Table 4 Vapor VL, Cuft/Lb Rackett Rackett Temp. Pressure SG VL, Cuft/Lb Modif. VDW % Dev. Tc Pc Tr = Pr = VL, Calc. VL, Calc. % Dev. Deg. F Psia Liquid * Exper. * ** *** Deg. F Psia T/Tc P/Pc (1 - Tr)^2/7 ZRA RTc/Pc Cuft/Lbmole MW Cuft/Lb *** N = 13 Trend, % = 2.01 Trend, % = * Experimental values are derived from specific gravities read from the charts of the API Data Book. ** VL values here are calculated from the modified van der Waals EOS employing the temperature-dependent Beta function for the term b I.e. Beta = b/bc. *** % Dev. = 100*(VL pred. - VL exper.)/ VL exper. Comparison of Predicted Saturated liquid Specific Volumes by the Modified van der Waals EOS and Rackett Equation Against the Corresponding Experimental Values Comp. = Propylene
16 Table 5 Comp. = n-pentane See Ref. 10 Vapor VL, Cuft/Lb Rackett Rackett Temp. Pressure VL, Cuft/Lb Modif. VDW % Dev. Tc Pc Tr = Pr = VL, Calc. VL, Calc. % Dev. Deg. F Psia Exper. * ** *** Deg. F Psia T/Tc P/Pc (1 - Tr)^2/7 ZRA RTc/Pc Cuft/Lbmole MW Cuft/Lb *** Trend, %= * Experimental VL values were taken from Sage and Lacey, IEC, Vol. 34, No. 6 (1942). ** VL values here are calculated from the modified van der Waals EOS employing the temperature-dependent Beta function for the term b I.e. Beta = b/bc. *** % Dev. = 100*(VL pred. - VL exper.)/ VL exper. Comparison of Predicted Saturated liquid Specific Volumes by the Modified van der Waals EOS and Rackett Equation Against the Corresponding Experimental Values
17 See Ref. 10 Vapor VL, Cuft/Lb Rackett Rackett Temp. Pressure SG VL, Cuft/Lb Modif. VDW % Dev. Tc Pc Tr = Pr = VL, Calc. VL, Calc. % Dev. Deg. F Psia Liquid * Exper. * ** *** Deg. F Psia T/Tc P/Pc (1 - Tr)^2/7 ZRA RTc/Pc Cuft/Lbmole MW Cuft/Lb *** N = 15 Trend, % = 2.75 Trend, % = * Experimental values are derived from specific gravities read from the charts of the API Data Book. ** VL values here are calculated from the modified van der Waals EOS employing the temperature-dependent Beta function for the term b I.e. Beta = b/bc. *** % Dev. = 100*(VL pred. - VL exper.)/ VL exper. Table 6 Comparison of Predicted Saturated liquid Specific Volumes by the Modified van der Waals EOS and Rackett Equation Against the Corresponding Experimental Values Comp. = Benzene
18 Table 7 Comparison of Predicted Liquid Specific Volumes by the Modified van der Waals Equation with Experimental Values Component: n-pentane Predictions are made using the modified van der Waals equation of state employing the Beta temperature correction function for the term b I.e. Beta = b/bc. * ** * ** * ** * ** * ** Temp. Press. VL, cuft/lb VL, cuift/lb Temp. Press. VL, cuft/lb VL, cuft/lb Temp. Press. VL, cuft/lb VL, cuft/lb Temp. Press. VL, cuft/lb VL, cuft/lb Temp. Press. VL, cuft/lb VL, cuft/lb deg. F Psia Exper. Predicted % Dev F Psia Exper. Predicted % Dev F Psia Exper. Predicted % Dev F Psia Exper. Predicted % Dev F Psia Exper. Predicted % Dev Trend % = * The data source is Sage and Lacy, IEC, Vol. 34, No. 6 (1942) ** % Dev = 100*(VL pred - VL Exper)/ VL Exper
19 Table 8 Comparison of Predicted Liquid Specific Volumes by the Modified van der Waals Equation with Experimental Values Component: Water Predictions are made using the modified van der Waals equation of state employing the Beta temperature correction function for the term b I.e. Beta = b/bc. * ** * ** * ** * ** Temp. Press. VL, cuft/lb VL, cuift/lb Temp. Press. VL, cuft/lb VL, cuft/lb Temp. Press. VL, cuft/lb VL, cuft/lb Temp. Press. VL, cuft/lb VL, cuft/lb deg. F Psia Exper. Predicted % Dev F Psia Exper. Predicted % Dev F Psia Exper. Predicted % Dev F Psia Exper. Predicted % Dev Trend % = * Steam Tables of Keenan and Keyes. ** % Dev = 100*(VL pred - VL Exper)/ VL Exper
20 Table 9 Comparison of Predicted Saturated Vapor Specific Volumes by the Modified van der Waals Equation with Experimental Values I. N-Pentane Vapor Temp. Pressure VG, Cuft/Lb VG, Cuft/Lb % Dev. deg. F Psia Exper. * Pred. ** *** * Experimental saturated vapor specific volumes are taken from Sage and Lacey, IEC, Vol. 34, No.6 (1942). Trend, % = 4.57 ** VG values here were predicted from the modified van der Waals EOS employing the temperature-dependent Beta function for the term b I.e. Beta = b/bc. *** % Dev. = 100*(VG-Pred. - VG-Exper.)/ VG-Exper. II. Water Vapor Temp. Pressure VG, Cuft/Lb VG, Cuft/Lb % Dev. deg. F Psia Exper. * Pred. ** *** * Experimental VG values reported here are taken from the steam tables of Keenan and Keyes. Trend, % = 6.39 ** VG values here were predicted from the modified van der Waals EOS employing the temperature-dependent Beta function for the term b I.e. Beta = b/bc. *** % Dev. = 100*(VG-Pred. - VG-Exper.)/ VG-Exper.
21
22
23
24 Appendix I Tabulation of P-V-T Data for Pure Component Saturated Liquids Vapor Liquid Acentric Temp. Pressure Specific Comp. NBP, deg. F Pc, Psia Tc, deg. F Mol. Wt. Factor deg. F Psia Gravity Methane Ethane Propane n-pentane
25 Appendix I (continued) Tabulation of P-V-T Data for Pure Component Saturated Liquids Vapor Liquid Acentric Temp. Pressure Specific Comp. NBP, deg. F Pc, Psia Tc, deg. F Mol. Wt. Factor deg. F Psia Gravity n-hexane n-heptane n-octane n-decane
26 Appendix I (continued) Tabulation of P-V-T Data for Pure Component Saturated Liquids Vapor Liquid Acentric Temp. Pressure Specific Comp. NBP, deg. F Pc, Psia Tc, deg. F Mol. Wt. Factor deg. F Psia Gravity Ethylene Propylene Butene
27 Appendix I (continued) Tabulation of P-V-T Data for Pure Component Saturated Liquids Vapor Liquid Acentric Temp. Pressure Specific Comp. NBP, deg. F Pc, Psia Tc, deg. F Mol. Wt. Factor deg. F Psia Gravity Cyclopentane Cyclohexane Acetylene Propyne
28 Appendix I (continued) Tabulation of P-V-T Data for Pure Component Saturated Liquids Vapor Liquid Acentric Temp. Pressure Specific Comp. NBP, deg. F Pc, Psia Tc, deg. F Mol. Wt. Factor deg. F Psia Gravity Benzene Toluene Ethylbenzene
29 Appendix I (continued) Tabulation of P-V-T Data for Pure Component Saturated Liquids Vapor Liquid Acentric Temp. Pressure Specific Comp. NBP, deg. F Pc, Psia Tc, deg. F Mol. Wt. Factor deg. F Psia Gravity Hydrogen Sulfide Carbon Dioxide TP Ammonia Water
30 Appendix II Tabulation of Beta Values Generated From BASIC Program BETAVW.BAS Comp. Methane Ethane Propane n-pentane Red. Temp. Red. Temp. Red. Temp. Red. Temp. Tr Beta Tr Beta Tr Beta Tr Beta Comp. n-hexane n-heptane n-octane n-decane Red. Temp. Red. Temp. Red. Temp. Red. Temp. Tr Beta Tr Beta Tr Beta Tr Beta
31 Appendix II (Continued) Tabulation of Beta Values Generated From BASIC Program BETAVW.BAS Comp. Ethylene Propylene 1-Butene Red. Temp. Red. Temp. Red. Temp. Tr Beta Tr Beta Tr Beta Comp. Cyclopentane Cyclohexane Red. Temp. Red. Temp. Tr Beta Tr Beta
32 Appendix II (Continued) Tabulation of Beta Values Generated From BASIC Program BETAVW.BAS Comp. Acetylene Propyne Red. Temp. Red. Temp. Tr Beta Tr Beta Comp. Benzene Toluene Ethylbenzene Red. Temp. Red. Temp. Red. Temp. Tr Beta Tr Beta Tr Beta
33 Appendix II (Continued) Tabulation of Beta Values Generated From BASIC Program BETAVW.BAS Comp. Hydrogen Sulfide Carbon Dioxide Red. Temp. Red. Temp. Tr Beta Tr Beta Comp. Ammonia Water Red. Temp. Red. Temp. Tr Beta Tr Beta
PREDICTION OF VAPOR PRESSURES AND MIXTURE VLE FROM A SECOND MODIFICATION OF THE VAN DER WAALS EQUATION. Part 3
 PREDICTION OF VAPOR PRESSURES AND MIXTURE VLE FROM A SECOND MODIFICATION OF THE VAN DER WAALS EQUATION Part 3 Review In the first two papers (1,2) in this series, we developed and tested a 3-parameter
PREDICTION OF PETROLEUM FRACTION ENTHALPIES FROM THE SECOND (ALPHA) MODIFICATION OF THE VAN DER WAALS EQUATION. Part 4. I. Review/Introduction
 MODIFICATION OF THE VAN DER WAALS EQUATION. Part 4. I. Review/Introduction") PREDICTION OF PETROLEUM FRACTION ENTHALPIES FROM THE SECOND (ALPHA) MODIFICATION OF THE VAN DER WAALS EQUATION Part 4 I. Review/Introduction In the first two papers (1,2) of this series, we developed and
PREDICTION OF PETROLEUM FRACTION ENTHALPIES FROM THE SECOND (ALPHA) MODIFICATION OF THE VAN DER WAALS EQUATION Part 4 I. Review/Introduction In the first two papers (1,2) of this series, we developed and
Index to Tables in SI Units
 Index to Tables in SI Units Table A-1 Atomic or Molecular Weights and Critical Properties of Selected Elements and Compounds 926 Table A-2 Properties of Saturated Water (Liquid Vapor): Temperature Table
ISENTHALPIC THROTTLING (FREE EXPANSION) AND THE JOULE-THOMSON COEFFICIENT
 AND THE JOULE-THOMSON COEFFICIENT") ISENTHALPIC THROTTLING (FREE EXPANSION) AND THE JOULE-THOMSON COEFFICIENT Charles R. Koppany, PhD, Chem. Eng. January, 014 ISENTHALPIC THROTTLING (FREE EXPANSION) AND THE JOULE-THOMSON COEFFICIENT This
ISENTHALPIC THROTTLING (FREE EXPANSION) AND THE JOULE-THOMSON COEFFICIENT Charles R. Koppany, PhD, Chem. Eng. January, 014 ISENTHALPIC THROTTLING (FREE EXPANSION) AND THE JOULE-THOMSON COEFFICIENT This
Equations of State. Equations of State (EoS)
") Equations of State (EoS) Equations of State From molecular considerations, identify which intermolecular interactions are significant (including estimating relative strengths of dipole moments, polarizability,
Equations of State (EoS) Equations of State From molecular considerations, identify which intermolecular interactions are significant (including estimating relative strengths of dipole moments, polarizability,
Predict Isothermal Bulk Modulus Values For Liquid Hydrocarbons With More Certainty. Background Of the Paper
 Predict Isothermal Bulk Modulus Values For Liquid Hydrocarbons With More Certainty Background Of the Paper All fluids are compressible under the application of pressure. The degree or extent of compressibility
"Energy Applications: Impact of Data and Models"
 "Energy Applications: Impact of Data and Models" Energy Applications refers in this particular case to the wide application of equations of state upstream in the Production of Oil and Gas. The petroleum
CALCULATION OF THE COMPRESSIBILITY FACTOR AND FUGACITY IN OIL-GAS SYSTEMS USING CUBIC EQUATIONS OF STATE
 CALCULATION OF THE COMPRESSIBILITY FACTOR AND FUGACITY IN OIL-GAS SYSTEMS USING CUBIC EQUATIONS OF STATE V. P. de MATOS MARTINS 1, A. M. BARBOSA NETO 1, A. C. BANNWART 1 1 University of Campinas, Mechanical
ChBE BIBLE. Robert A. Pinnick. 28 April 2006
 ChBE BIBLE Robert A. Pinnick 28 April 2006 Contents 1 Thermodynamics 2 1.1 Equations of State....................................... 2 1.1.1 Ideal Gas Law..................................... 3 1.1.2 Cubic
PETE 310 Lectures # 36 to 37
 PETE 310 Lectures # 36 to 37 Cubic Equations of State Last Lectures Instructional Objectives Know the data needed in the EOS to evaluate fluid properties Know how to use the EOS for single and for multicomponent
Hydrocarbon Components and Physical Properties Core COPYRIGHT. Basic Terminology
 3/7/2017 Learning Objectives Hydrocarbon Components and Physical Properties Core Basic Terminology By the end of this lesson, you you will will be be able able to: to: Describe the concept of atomic mass,
Comparison of the GERG-2008 and Peng-Robinson Equations of State for Natural Gas Mixtures
 RESEARCH ARTICLE OPEN ACCESS Comparison of the and Peng-Robinson Equations of State for Natural Gas Mixtures L. F. Baladão*, R. P. Soares**, P. R. B. Fernandes*** * (Virtual Laboratory for Properties Prediction,
MODELING OF PHASE EQUILIBRIA FOR BINARY AND TERNARY MIXTURES OF CARBON DIOXIDE, HYDROGEN AND METHANOL
 MODELING OF PHASE EQUILIBRIA FOR BINARY AND TERNARY MIXTURES OF CARBON DIOXIDE, HYDROGEN AND METHANOL Neil R. Foster *, Keivan Bezanehtak, Fariba Dehghani School of Chemical Engineering and Industrial
THERMODYNAMIC CONSISTENCY TESTS FOR PHASE EQUILIBRIUM IN LIQUID SOLUTE+SUPERCRITICAL SOLVENT MIXTURES
 THERMODYNAMIC CONSISTENCY TESTS FOR PHASE EQUILIBRIUM IN LIQUID SOLUTE+SUPERCRITICAL SOLVENT MIXTURES José O. Valderrama 1, and Víctor H. Alvarez 1 Fac. de Ingeniería, Depto. Ing. Mecánica, Univ. de la
On the Boyle temperature
 Indian Journal of Chemical Technology Vol. 1, September 1994, pp. 261-265 On the Boyle temperature Jaime Wisniak Department of Chemical Engineering, Ben-Gurion University of the Negev. Beer-Sheva. Israel
P1: IML/FFX P2: IML/FFX QC: IML/FFX T1: IML AT029-FM AT029-Manual AT029-Manual-v8.cls December 11, :59. Contents
 Contents Foreword Preface xvii xix Chapter 1 Introduction 1 Nomenclature 1 1.1 Nature of Petroleum Fluids 1 1.1.1 Hydrocarbons 3 1.1.2 Reservoir Fluids and Crude Oil 5 1.1.3 Petroleum Fractions and Products
Basic Thermodynamics Module 1
 Basic Thermodynamics Module 1 Lecture 9: Thermodynamic Properties of Fluids Thermodynamic Properties of fluids Most useful properties: Properties like pressure, volume and temperature which can be measured
Chapter 3 PROPERTIES OF PURE SUBSTANCES
 Thermodynamics: An Engineering Approach Seventh Edition Yunus A. Cengel, Michael A. Boles McGraw-Hill, 2011 Chapter 3 PROPERTIES OF PURE SUBSTANCES Copyright The McGraw-Hill Companies, Inc. Permission
r sat,l T sr sat,l T rf rh Ž 4.
 Fluid Phase Equilibria 150 151 1998 215 223 Extended corresponding states for pure polar and non-polar fluids: an improved method for component shape factor prediction Isabel M. Marrucho a, James F. Ely
Chapter 3 PROPERTIES OF PURE SUBSTANCES
 Thermodynamics: An Engineering Approach Seventh Edition in SI Units Yunus A. Cengel, Michael A. Boles McGraw-Hill, 2011 Chapter 3 PROPERTIES OF PURE SUBSTANCES Copyright The McGraw-Hill Companies, Inc.
PVTpetro: A COMPUTATIONAL TOOL FOR ISOTHERM TWO- PHASE PT-FLASH CALCULATION IN OIL-GAS SYSTEMS
 PVTpetro: A COMPUTATIONAL TOOL FOR ISOTHERM TWO- PHASE PT-FLASH CALCULATION IN OIL-GAS SYSTEMS A. M. BARBOSA NETO 1, A. C. BANNWART 1 1 University of Campinas, Mechanical Engineering Faculty, Energy Department
Reservoir Eng FOB :18 Page i Second Edition
 Second Edition C H A P T E R 1 FUNDAMENTALS OF RESERVOIR FLUID BEHAVIOR Naturally occurring hydrocarbon systems found in petroleum reservoirs are mixtures of organic compounds which exhibit multiphase
PROPERTIES OF PURE SUBSTANCES. Chapter 3. Mehmet Kanoglu. Thermodynamics: An Engineering Approach, 6 th Edition. Yunus A. Cengel, Michael A.
 Thermodynamics: An Engineering Approach, 6 th Edition Yunus A. Cengel, Michael A. Boles McGraw-Hill, 2008 Chapter 3 PROPERTIES OF PURE SUBSTANCES Mehmet Kanoglu Copyright The McGraw-Hill Companies, Inc.
Thermodynamics I. Properties of Pure Substances
 Thermodynamics I Properties of Pure Substances Dr.-Eng. Zayed Al-Hamamre 1 Content Pure substance Phases of a pure substance Phase-change processes of pure substances o Compressed liquid, Saturated liquid,
( stored on also accessible from )
") ( stored on http://www.stealthskater.com/articles/kfactors.doc also accessible from http://www.stealthskater.com/articles.htm ) Plant Notebook ------------------------------------------------------ AN
( stored on http://www.stealthskater.com/articles/kfactors.doc also accessible from http://www.stealthskater.com/articles.htm ) Plant Notebook ------------------------------------------------------ AN
CHAPTER SIX THERMODYNAMICS Vapor-Liquid Equilibrium in a Binary System 6.2. Investigation of the Thermodynamic Properties of Pure Water
 CHAPTER SIX THERMODYNAMICS 6.1. Vapor-Liquid Equilibrium in a Binary System 6.2. Investigation of the Thermodynamic Properties of Pure Water 2 6.1. VAPOR-LIQUID EQUILIBRIUM IN A BINARY SYSTEM Keywords:
Appendix A Physical and Critical Properties
 Appendix A Physical and Critical Properties Table A1 Physical properties of various organic and inorganic substances Compound Formula MW Sp Gr T m (K) T b (K) DH v (kj/kg) DH m (kj/kg) Air 28.97 Ammonia
is more suitable for a quantitative description of the deviation from ideal gas behaviour.
 Real and ideal gases (1) Gases which obey gas laws or ideal gas equation ( PV nrt ) at all temperatures and pressures are called ideal or perfect gases. Almost all gases deviate from the ideal behaviour
Vapor liquid equilibria of carbon dioxide with diethyl oxalate, ethyl laurate, and dibutyl phthalate binary mixtures at elevated pressures
 Fluid Phase Equilibria 181 (2001) 1 16 Vapor liquid equilibria of carbon dioxide with diethyl oxalate, ethyl laurate, and dibutyl phthalate binary mixtures at elevated pressures Kong-Wei Cheng, Muoi Tang
For an incompressible β and k = 0, Equations (6.28) and (6.29) become:
 and (6.29) become:") Internal Energy and Entropy as Functions of T and V These are general equations relating the internal energy and entropy of homogeneous fluids of constant composition to temperature and volume. Equation
Internal Energy and Entropy as Functions of T and V These are general equations relating the internal energy and entropy of homogeneous fluids of constant composition to temperature and volume. Equation
Vapour Liquid Equilibrium in Asymmetric Mixtures of n-alkanes with Ethane
 Turk J Chem 26 (22), 481 489. c TÜBİTAK Vapour Liquid Equilibrium in Asymmetric Mixtures of n-alkanes with Ethane Anca DUTA Transylvania University, Chemistry Dept., I. Maniu 5, RO-22 Brasov-ROMANIA e-mail:
New correlation for hydrogen-natural gas mixture compressibility factor
 New correlation for hydrogen-natural gas mixture compressibility factor Zahreddine Hafsi 1, Sami Elaoud 2, Mohsen Akrout, Ezzeddine Hadj Taïeb Laboratory of Applied Fluids Mechanics Process and Environment
Pure Substance. Properties of Pure Substances & Equations of State. Vapour-Liquid-Solid Phase Equilibrium
 Pure Substance Properties of Pure Substances & Equations of State Dr. d. Zahurul Haq Professor Department of echanical Engineering Bangladesh University of Engineering & Technology (BUET) Dhaka-1000, Bangladesh
Phase Diagrams. Department of Mechanical Engineering Indian Institute of Technology Kanpur Kanpur India
 Phase Diagrams 1 Increasing the temperature isobarically T-v diagram of constant-pressure phase-change processes of a pure substance at various pressures numerical values are for water. 2 Temperature -
Thermophysical Properties of Ethane from Cubic Equations of State
 Thermophysical Properties of Ethane from Cubic Equations of State MIHAELA NOUR, DANIELA DUNA, MIRELA IONITA, VIOREL FEROIU *, DAN GEANA Politehnica University Bucharest, Department of Inorganic Chemistry,
An augmented hard core equation of state generalized in terms of T,, P, and o
 Pure&App/. Chern., Vol. 61, No. 8, pp. 1413-1418, 1989. Printed in Great Britain. 0 1989 IUPAC An augmented hard core equation of state generalized in terms of T,, P, and o 1 2 Hasan Orbey and Juan H.
Review Article. VLE Properties from ISM Equation of State: Application to Pure and Mixture
 Review Article PHYSICAL CHEMISTRY RESEARCH Published by the Iranian Chemical Society www.physchemres.org info@physchemres.org Phys. Chem. Res., Vol., No. 1, 16-, March 015. DOI: 10.06/pcr.015.798 VLE Properties
PETROLEUM ENGINEERING 310 FIRST EXAM. September 19, 2001
 PETROLEUM ENGINEERING 31 FIRST EXAM September 19, 1 Do all your work on the test paper and the space provided for the answer, do no write on the back. Grading will be based on approach and answers. Remember
Equation of state. Contents. Overview. Historical. Boyle's law (1662)
") Equation of state From Wikipedia, the free encyclopedia For the use of this concept in cosmology, see Equation of state (cosmology) In physics and thermodynamics, an equation of state is a relation between
Equation of state From Wikipedia, the free encyclopedia For the use of this concept in cosmology, see Equation of state (cosmology) In physics and thermodynamics, an equation of state is a relation between
Accuracy of vapour ^ liquid critical points computed from cubic equations of state
 High Temperatures ^ High Pressures 2000 volume 32 pages 449 ^ 459 15 ECTP Proceedings pages 433 ^ 443 DOI:10.1068/htwu303 Accuracy of vapour ^ liquid critical points computed from cubic equations of state
Peng-Robinson Equation of State Predictions for Gas Condensate Before and After Lumping
 Advances in Petroleum Exploration and Development Vol. 2, No. 2, 2011, pp. 41-46 DOI:10.3968/ j.aped.1925543820110202.105 ISSN 1925-542X[Print] ISSN 1925-5438[Online] www.cscanada.net www.cscanada.org
Adam G. Hawley Darin L. George. Southwest Research Institute 6220 Culebra Road San Antonio, TX 78238
 USE OF EQUATIONS OF STATE AND EQUATION OF STATE SOFTWARE PACKAGES Adam G. Hawley Darin L. George Southwest Research Institute 6220 Culebra Road San Antonio, TX 78238 Introduction Determination of fluid
Thermodynamic Properties
 Thermodynamic Properties (TP) Thermodynamic Properties Define and articulate some of the critical language and concepts of Thermodynamics Distinguish between the universe, system, surroundings, and boundary
Chapter 2: The Physical Properties of Pure Compounds
 Chapter 2: The Physical Properties of Pure Compounds 2-10. The boiler is an important unit operation in the Rankine cycle. This problem further explores the phenomenon of boiling. A. When you are heating
RK-, SRK-, & SRK-PR-TYPE EQUATION OF STATE FOR HYDROCARBONS, BASED ON SIMPLE MOLECULAR PROPERTIES
 Journal of Applied Chemical Science International 2(2): 65-74, 2015 RK-, SRK-, & SRK-PR-TYPE EQUATION OF STATE FOR HYDROCARBONS, BASED ON SIMPLE MOLECULAR PROPERTIES KAMAL I AL-MALAH * Department of Chemical
Pure Substance. Properties of Pure Substances & Equations of State. Vapour-Liquid-Solid Phase Equilibrium
 Pure Substance Properties of Pure Substances & Equations of State Dr. d. Zahurul Haq Professor Department of echanical Engineering Bangladesh University of Engineering & Technology (BUET) Dhaka-1000, Bangladesh
Thermodynamic Properties of Refrigerant R116 from Cubic Equations of State
 Thermodynamic Properties of Refrigerant R116 from Cubic Equations of State DANIELA DUNA, MIRELA IONITA, VIOREL FEROIU *, DAN GEANA Politehnica University Bucharest, Department of Applied Physical Chemistry
A Cubic Hard-Core Equation of State
 Fluid Phase Equilibria An International Journal Volume 206, Pages 27 39, 2003 Mohsen Mohsen-Nia a, Hamid Modarress b,, G.Ali Mansoori c a Kashan University, Kashan, Iran b Amir-Kabir University of Technology,
Real Gases. Sections (Atkins 6th Ed.), (Atkins 7-9th Eds.)
, (Atkins 7-9th Eds.)") Real Gases Sections 1.4-1.6 (Atkins 6th Ed.), 1.3-1.5 (Atkins 7-9th Eds.) Molecular Interactions Compression factor Virial coefficients Condensation Critical Constants Van der Waals Equation Corresponding
Real Gases Sections 1.4-1.6 (Atkins 6th Ed.), 1.3-1.5 (Atkins 7-9th Eds.) Molecular Interactions Compression factor Virial coefficients Condensation Critical Constants Van der Waals Equation Corresponding
Overall: 75 ECTS: 7.0
 Course: Chemical Engineering Thermodynamics Language: English Lecturer: Prof. dr. sc. Marko Rogošić TEACHING WEEKLY SEMESTER Lectures 3 45 Laboratory 1 15 Seminar 1 15 Overall: 75 ECTS: 7.0 PURPOSE: Within
LECTURE 4 Variation of enthalpy with temperature
 LECTURE 4 Variation of enthalpy with temperature So far, we can only work at 25 C. Like c v we define a constant pressure heat capacity, c p, as the amount of heat energy needed to raise the temperature
Modeling Vapor Liquid Equilibrium of Binary and Ternary Systems of CO 2 + Hydrocarbons at High-Pressure Conditions
 A publication of CHEMICAL ENGINEERING TRANSACTIONS VOL. 57, 2017 Guest Editors: Sauro Pierucci, Jiří Jaromír Klemeš, Laura Piazza, Serafim Bakalis Copyright 2017, AIDIC Servizi S.r.l. ISBN 978-88-95608-48-8;
Chapter 3 PROPERTIES OF PURE SUBSTANCES
 Chapter 3 PROPERTIES OF PURE SUBSTANCES PURE SUBSTANCE Pure substance: A substance that has a fixed chemical composition throughout. Air is a mixture of several gases, but it is considered to be a pure
download instant at 2 Phase Diagrams of Pure Fluids
 2 Phase Diagrams of Pure Fluids 13 2. PHASE DIAGRAMS OF PURE FLUIDS Problem 2.1 Solution a) 25 ı C, 1 bar: liquid, because the temperature is below the saturation temperature at 1 bar (99.63 ı C). 10 bar,
CHAPTER. Properties of Pure Substances
 CHAPTER 2 Properties of Pure Substances A Pure Substance Is a substance that is chemically homogenous and fixed in chemical composition.(e.g. water, nitrogen, air & etc.) mixture of oil and water is not
PROPERTY TABLES AND CHARTS (SI UNITS)
") cen83321_ap1.qxd 4/15/2002 5:56 AM Page 823 PROPERTY TABLES AND CHARTS (SI UNITS) APPENDIX 1 823 cen83321_ap1.qxd 4/15/2002 5:56 AM Page 824 TABLE A 1 824 THERMODYNAMICS Molar mass, gas constant, and critical-point
cen83321_ap1.qxd 4/15/2002 5:56 AM Page 823 PROPERTY TABLES AND CHARTS (SI UNITS) APPENDIX 1 823 cen83321_ap1.qxd 4/15/2002 5:56 AM Page 824 TABLE A 1 824 THERMODYNAMICS Molar mass, gas constant, and critical-point
Chem 4501 Introduction to Thermodynamics, 3 Credits Kinetics, and Statistical Mechanics
 Chem 4501 Introduction to hermodynamics, 3 Credits Kinetics, and Statistical Mechanics Module Number 2 Active Learning Answers and Optional Problems/Solutions 1. McQuarrie and Simon, 2-6. Paraphrase: How
THERMODYNAMIC BEHAVIOR OF HYDROGEN/NATURAL GAS MIXTURES
 THERMODYNAMIC BEHAVIOR OF HYDROGEN/NATURAL GAS MIXTURES by R. R. Agahi, B. Ershaghi, M. C. Lin and G. A. Mansoori (*) PROCEEDINGS OF THE ANNUAL CONVENTION GAS PROCESSORS ASSOCIATION 1995, ISSUE 74, pages
Hydrate Formation: Considering the Effects of Pressure, Temperature, Composition and Water
 Energy Science and Technology Vol. 4, No. 1, 2012, pp. 60-67 DOI:10.3968/j.est.1923847920120401.397 ISSN 1923-8460[PRINT] ISSN 1923-8479[ONLINE] www.cscanada.net www.cscanada.org Hydrate Formation: Considering
Chapter 2 Natural Gas Physical Properties Under High Pressure
 Chapter 2 Natural Gas Physical Properties Under High Pressure It is commonly known that natural gas owns compressibility. When subjected to the reservoir pressure and temperature, the natural gas is in
All organic compounds contain carbon, however, not all carbon containing compounds are classified as organic. Organic compounds covalently bonded
 Chapter 20 All organic compounds contain carbon, however, not all carbon containing compounds are classified as organic. Organic compounds covalently bonded compounds containing carbon, excluding carbonates
P(N,V,T) = NRT V. = P(N,V,T) dv
 = NRT V. = P(N,V,T) dv") CHEM-443, Fall 2016, Section 010 Student Name Quiz 1 09/09/2016 Directions: Please answer each question to the best of your ability. Make sure your response is legible, precise, includes relevant dimensional
CHEM-443, Fall 2016, Section 010 Student Name Quiz 1 09/09/2016 Directions: Please answer each question to the best of your ability. Make sure your response is legible, precise, includes relevant dimensional
Phase Equilibria of binary mixtures by Molecular Simulation and PR-EOS: Methane + Xenon and Xenon + Ethane
 International Journal of ChemTech Research CODEN( USA): IJCRGG ISSN : 0974-4290 Vol.5, No.6, pp 2975-2979, Oct-Dec 2013 Phase Equilibria of binary mixtures by Molecular Simulation and PR-EOS: Methane +
2. Hydrocarbons. 2.1 Composition of Petroleum
 2. Hydrocarbons 2.1 Composition of Petroleum Naturally occurring petroleum is composed of organic chemicals: approximately 11 to 13% hydrogen and 84 to 87% carbon. Traces of oxygen, sulfur, nitrogen and
Calorimetry in the near-critical and supercritical regions. Nitrous oxide + hydrocarbon mixtures*
 Pure Appl. Chem., Vol. 71, No. 7, pp. 1197 1205, 1999. Printed in Great Britain. 1999 IUPAC Calorimetry in the near-critical and supercritical regions. Nitrous oxide + hydrocarbon mixtures* Juan A. R.
A Corresponding States Model for Generalized Engineering Equations of State
 International Journal of Thermophysics, Vol. 26, No. 3, May 2005 ( 2005) DOI: 10.1007/s10765-005-5573-7 A Corresponding States Model for Generalized Engineering Equations of State L. Sun 1,2 and J. F.
Table of Physical Properties for Hydrocarbons and Other Compounds of Interest to the Natural Gas and Natural Gas Liquids Industries
 GPA Midstream Standard 2145-16 Table of Physical Properties for Hydrocarbons and Other Compounds of Interest to the Natural Gas and Natural Gas Liquids Industries (Includes data previously published in
10 States of Matter. Aubrey High School AP Chemistry. Period Date / / 10.2 Problems - Liquids and Gases
 Aubrey High School AP Chemistry 10 States of Matter 1. Use the following table to answer these questions. Vapor Pressures of Various Liquids Temp. ( C) Ethyl alcohol Benzene Methyl salicylate Water Carbon
Chemical Engineering Thermodynamics
 Chemical Engineering Thermodynamics P Liquid P x 1 sat P 1 T sat T 2 T x 1 T x 1 T y 1 Liquid Vapour sat P 2 P x 1 P y 1 P y 1 Vapour sat T 1 x, y 1 1 x, y 1 1 Pradeep Ahuja Contents CHEMICAL ENGINEERING
Chapter 8. The Mole Concept
 Chapter 8 The Mole Concept Chapter 9 2 Avogadro s Number Avogadro s number (symbol N) is the number of atoms in 12.01 grams of carbon. Its numerical value is 6.02 10 23. Therefore, a 12.01 g sample of
EOS Higher Oil School 2017/5/26
 EOS lecture @Baku Higher Oil School 2017/5/26 Introduction What is EOS? Equation of State Also known as Cubic EOS because of equation of 3 rd degree Instrumental to calculate PVT Relationship between Pressure,
Fig Note the three different types of systems based on the type of boundary between system and surroundings.
 CHAPTER 1 LECTURE NOTES System, Surroundings, and States Fig. 1.4 Note the three different types of systems based on the type of boundary between system and surroundings. Intensive and Extensive Properties
A generalized set of correlations for plus fraction characterization
 370 Pet.Sci.(01)9:370-378 DOI 10.1007/s118-01-01-x A generalized set of correlations for plus fraction characterization JAMIALAHMADI Mohamad 1, ZANGENEH Hossein and HOSSEINI Seyed Sajad 1 Petroleum Engineering
Pressure Volume Temperature Relationship of Pure Fluids
 Pressure Volume Temperature Relationship of Pure Fluids Volumetric data of substances are needed to calculate the thermodynamic properties such as internal energy and work, from which the heat requirements
Chapter 3 PROPERTIES OF PURE SUBSTANCES. Thermodynamics: An Engineering Approach, 6 th Edition Yunus A. Cengel, Michael A. Boles McGraw-Hill, 2008
 Chapter 3 PROPERTIES OF PURE SUBSTANCES Thermodynamics: An Engineering Approach, 6 th Edition Yunus A. Cengel, Michael A. Boles McGraw-Hill, 2008 Objectives Introduce the concept of a pure substance. Discuss
Prediction of surface tension of binary mixtures with the parachor method
 Prediction of surface tension of binary mixtures with the parachor method Tomáš Němec 1,a Institute of Thermomechanics ASCR, v.v.i., Dolejškova, 18 Praha 8, Czech Republic Abstract. The parachor method
Gases and Kinetic Molecular Theory
 1 Gases and Kinetic Molecular Theory 1 CHAPTER GOALS 1. Comparison of Solids, Liquids, and Gases. Composition of the Atmosphere and Some Common Properties of Gases 3. Pressure 4. Boyle s Law: The Volume-Pressure
Preliminary Evaluation of the SPUNG Equation of State for Modelling the Thermodynamic Properties of CO 2 Water Mixtures
 Available online at www.sciencedirect.com Energy Procedia 26 (2012 ) 90 97 2 nd Trondheim Gas Technology Conference Preliminary Evaluation of the SPUNG Equation of State for Modelling the Thermodynamic
Imperfect Gases. NC State University
 Chemistry 431 Lecture 3 Imperfect Gases NC State University The Compression Factor One way to represent the relationship between ideal and real gases is to plot the deviation from ideality as the gas is
Phases of matter and phase diagrams
 Phases of matter and phase diagrams Transition to Supercritical CO2 Water Ice Vapor Pressure and Boiling Point Liquids boil when the external pressure equals the vapor pressure. Temperature of boiling
Chapter 3 PROPERTIES OF PURE SUBSTANCES SUMMARY
 Chapter 3 PROPERTIES OF PURE SUBSTANCES SUMMARY PURE SUBSTANCE Pure substance: A substance that has a fixed chemical composition throughout. Compressed liquid (sub-cooled liquid): A substance that it is
The Advanced Chemical Engineering Thermodynamics. The thermodynamics properties of fluids (II) Ji-Sheng Chang Q&A_-10-11/17/2005(10)
 Ji-Sheng Chang Q&A_-10-11/17/2005(10)") The Advanced Chemical Engineering Thermodynamics The thermodynamics properties of fluids (II) Q&A_-10-11/17/2005(10) Ji-Sheng Chang Property relations The residual Gibbs free energy The definition of residual
The Advanced Chemical Engineering Thermodynamics The thermodynamics properties of fluids (II) Q&A_-10-11/17/2005(10) Ji-Sheng Chang Property relations The residual Gibbs free energy The definition of residual
= = 10.1 mol. Molar Enthalpies of Vaporization (at Boiling Point) Molar Enthalpy of Vaporization (kj/mol)
 Molar Enthalpy of Vaporization (kj/mol)") Ch 11 (Sections 11.1 11.5) Liquid Phase Volume and Density - Liquid and solid are condensed phases and their volumes are not simple to calculate. - This is different from gases, which have volumes that
Ch 11 (Sections 11.1 11.5) Liquid Phase Volume and Density - Liquid and solid are condensed phases and their volumes are not simple to calculate. - This is different from gases, which have volumes that
Thermodynamics 1 Lecture Note 1
 Thermodynamics 1 Lecture Note 1 March 02, 2015 Kwang Kim Yonsei University kbkim@yonsei.ac.kr 39 8 7 34 53 Y O N Se I 88.91 16.00 14.01 78.96 126.9 Scientific Thinking - System under investigation - Description
Solids, Liquids and Gases
 WHY? Why is water usually a liquid and not a gas? Why does liquid water boil at such a high temperature for such a small molecule? Why does ice float on water? Why do snowflakes have 6 sides? Why is I
A New Three Parameter Cubic Equation of State
 Transactions C: Chemistry and Chemical Engineering Vol. 17, No. 2, pp. 177{184 c Sharif University of Technology, December 2010 A New Three Parameter Cubic Equation of State Abstract. A.A. Rabah 1; and
AP Chemistry A. Allan Chapter Six Notes - Thermochemistry
 AP Chemistry A. Allan Chapter Six Notes - Thermochemistry 6.1 The Nature of Energy A. Definition 1. Energy is the capacity to do work (or to produce heat*) a. Work is a force acting over a distance (moving
A New Two-Constant Equation of State
 Palmer, H. J., Berg, J. C., J. FIuidMech., 51, 385 (1972). Palmer, H. J.. Berg, J. C., A./.Ch.. J., 19, 1082 (1973). Plevan, R. E., Quinn, J. A,. A./.Ch.. J., 12, 894 (1966). Rhodes, F. H.. Bridges, C.
DEPARTMENT OF CHEMICAL ENGINEERING FACULTY OF ENGINEERING AND TECHNOLOGY SRM UNIVERSITY COURSE PLAN
 DEPARTMENT OF CHEMICAL ENGINEERING FACULTY OF ENGINEERING AND TECHNOLOGY SRM UNIVERSITY COURSE PLAN Course code : CH0217 Course Title : Stoichiometry and Engineering Thermodynamics Semester : III Course
FUNDAMENTALS OF THERMODYNAMICS
 FUNDAMENTALS OF THERMODYNAMICS SEVENTH EDITION CLAUS BORGNAKKE RICHARD E. SONNTAG University of Michigan John Wiley & Sons, Inc. Chemical Reactions 15 Many thermodynamic problems involve chemical reactions.
We are IntechOpen, the world s leading publisher of Open Access books Built by scientists, for scientists. International authors and editors
 We are IntechOpen, the world s leading publisher of Open Access books Built by scientists, for scientists 4,100 116,000 120M Open access books available International authors and editors Downloads Our
Chem 1100 Pre-Test 3. Multiple Choice Identify the choice that best completes the statement or answers the question.
 Chem 1100 Pre-Test 3 Multiple Choice Identify the choice that best completes the statement or answers the question. 1. An open-tube manometer is used to measure the pressure in a flask. The atmospheric
Rigorous calculation of LNG flow reliefs using the GERG-2004 equation of state
 Rigorous calculation of LNG reliefs using the GERG-2004 equation of state Luigi Raimondi Process Simulation Services www.xpsimworld.com Via Galvani 105, 20025 Legnano (MI) - Italy The design of process
ScienceDirect. Modelling CO 2 Water Thermodynamics Using SPUNG Equation of State (EoS) concept with Various Reference Fluids
 concept with Various Reference Fluids") Available online at www.sciencedirect.com ScienceDirect Energy Procedia 51 (2014 ) 353 362 7th Trondheim CCS Conference, TCCS-7, June 5-6 2013, Trondheim, Norway Modelling CO 2 Water Thermodynamics Using
Available online at www.sciencedirect.com ScienceDirect Energy Procedia 51 (2014 ) 353 362 7th Trondheim CCS Conference, TCCS-7, June 5-6 2013, Trondheim, Norway Modelling CO 2 Water Thermodynamics Using
Cooling Temperatures of Binary Mixed Refrigerants: Vapor-Liquid-Liquid Equilibrium versus Vapor-Liquid Equilibrium
 1 Cooling Temperatures of Binary Mixed Refrigerants: Vapor-Liquid-Liquid Equilibrium versus Vapor-Liquid Equilibrium N. Tzabar, H.J.M. ter Brake Energy Materials and Systems Faculty of Science and Technology
Surface Tension Prediction for Liquid Mixtures
 AIChE Journal, Volume 44, No. 10, pp. -32, October 1998 Surface Tension Prediction for Liquid Mixtures Joel Escobedo and G.Ali Mansoori (*) University of Illinois at Chicago (M/C 063) Chicago, IL 60607-7052,
A modification of Wong-Sandler mixing rule for the prediction of vapor-liquid equilibria in binary asymmetric systems
 Korean J. Chem. Eng., 28(7), 16131618 (2011) DOI: 10.1007/s1181401005347 INVITED REVIEW PAPER A modification of WongSandler mixing rule for the prediction of vaporliquid equilibria in binary asymmetric
SOLUBILITY OF CO 2 IN BRANCHED ALKANES IN ORDER TO EXTEND THE PPR78 MODEL TO SUCH SYSTEMS
 SOLUBILITY OF CO IN BRANCHED ALKANES IN ORDER TO EXTEND THE PPR78 MODEL TO SUCH SYSTEMS Fabrice MUTELET, Stéphane VITU and Jean-Noël JAUBERT (*) Institut National Polytechnique de Lorraine, Ecole Nationale
QUIZZES RIEPJCPIγPJEJJJY
 Che 3021 Thermodynamics I QUIZZES RIEPJCPIγPJEJJJY QUIZ 1. Find Molecular Weights: 1 1 CO 2 2 NaCl 3 Aspirin C 9 H 8 O 4 CO2 = NaCl = C9H8O4 = PIgPJC Quiz 1. Temperature conversion 1 Convert 94 o F, to
B 2, C 2, N 2. O 2, F 2, Ne 2. Energy order of the p 2p and s 2p orbitals changes across the period.
 Chapter 11 Gases Energy order of the p p and s p orbitals changes across the period. Due to lower nuclear charge of B, C & N there is no s-p orbitals interaction Due to high nuclear charge of O, F& Ne