Predicting the Effect of Catalyst Axial Active Site Distributions on a Diesel Oxidation Catalyst Performance
|
|
|
- Clarence Greene
- 5 years ago
- Views:
Transcription
1 Predicting the Effect of Catalyst Axial Active Site Distributions on a Diesel Oxidation Catalyst Performance by Suad Al-Adwani A thesis presented to the University of Waterloo in fulfillment of the thesis requirement for the degree of Doctor of Philosophy in Chemical Engineering Waterloo, Ontario, Canada, 2012 Suad Al-Adwani 2012
2 AUTHOR'S DECLARATION I hereby declare that I am the sole author of this thesis. This is a true copy of the thesis, including any required final revisions, as accepted by my examiners. I understand that my thesis may be made electronically available to the public. ii
3 Abstract Zone-coated diesel oxidation catalysts (DOCs) can be used to obtain overall improved performance in oxidation reaction extents. However, why this occurs and under what conditions an impact is expected are unknown. In order to demonstrate why these catalysts work better than their standard counterparts and how significant the improved performance is, the CO oxidation performance over a series of Pt Pd/Al 2 O 3 catalysts, each with a different distribution of precious metal down the length, while maintaining equivalent totals of precious metal, was modeled. Simulations with different flow rates, ramp rates, steady-state temperatures at the end of the ramp rate, different total precious metal loadings, and CO inlet values were compared. At conversions less than 50%, the most significant differences were noted when the temperature was ramped to just at the CO oxidation light-off point (a typical measure of 50% conversion/oxidation), with catalysts containing more precious metal at the downstream portions leading to better light-off conversion performance. However, in terms of cumulative emissions over a long period of time, a front-loaded design proved best. These results are readily explained by decreased CO poisoning and the propagation of the heat derived from the exotherm from the front to the rear of the catalyst. Also, although the trends were the same, regardless of change in the parameter, the impact of different distributions was more apparent under conditions where a catalyst would be challenged, i.e., at low temperature ramp rates, higher CO inlet concentrations, and lower amounts of total catalyst used. At higher ramp rates, the input heat from the entering gas stream played an increasingly important role, relative to conduction associated with the exotherm, dampening the effects of the catalyst distribution. Therefore, iii
4 although catalysts that are zone-coated with precious metals, or any active sites, could prove better in terms of performance than homogeneously distributed active site catalysts, this improvement is only significant under certain reaction conditions. In a mixture of three reactants, CO, C 3 H 6 and NO oxidation, it was found that a loading a larger amount of active sites in the catalyst middle, maintained better CO and C 3 H 6 oxidation but not NO oxidation, which required the whole catalyst length. A faster light-off conversion was also related to higher amount of precious metal at the catalyst outlet. The CO conversion performance for a variety of distributed precious metal designs was evaluated as a function of exposure time to sulphur and the spatial accumulation profile of sulphur along the monolith length was predicted. The results illustrate that the sulphur accumulates near the catalyst inlet and decreases toward the outlet, resulting in shifting the reaction zones further toward the catalyst outlet. With sulfation, light-off temperatures (T50) increased and the time for back to front reaction propagation also increased. A back loaded catalyst resulted in the best light-off conversion compared to the other catalyst designs and a middle loaded catalyst maintained a higher overall conversion if sulphur poisoning takes place. These catalyst designs were also tested under thermal aging conditions by using a second order sintering model integrated with the CO oxidation reaction model. The spatial normalized dispersion profiles along the monolith showed that the catalyst outlet experienced significant damage relative to the inlet due to sintering. A front loaded catalyst design had the highest catalytic activity due its resistance to sintering. iv
5 Acknowledgements My deepest gratitude goes to Allah (God) for providing me the blessings to complete this work. The every kind of favor is granted exclusively by him. I would like to thank my family. All the support, love and encouragement they have provided me over the years was the greatest gift anyone has ever given me. I would like to express my appreciation and gratitude to my supervisors Prof. Joao Soares and Prof. William Epling for the consistent support they provided me throughout this work. Their patience and guidance were greatly appreciated. Also I would like to thank my advisory committee members, Prof. Ali Elkamel, Prof. Eric Croiset, Prof. Abdul-Rahman Eihab and Prof. Hui Wang for agreeing to serve on my doctoral committee. Special thanks to my friends in the catalysis group for their kind friendship and helpful discussions. I am grateful to my friends in Waterloo, who made my stay pleasant and enjoyable. Finally, I would like to thank Kuwait University for providing the financial support throughout my Master and PhD degrees. v
6 Dedication To my beloved late father, Mohammed, God bless his soul & To my beloved mother, Whadha vi
7 Table of Contents AUTHOR'S DECLARATION... ii Abstract... iii Acknowledgements... v Dedication... vi Table of Contents... vii List of Figures... x List of Tables... xiv Chapter 1 : Introduction Motivation Research objectives Thesis outline... 5 Chapter 2 : Literature Review Health and environmental effects of diesel combustion emissions Emission regulation and control Catalytic technologies of diesel emission control Diesel oxidation catalyst (DOC) Control of NO x under lean-burn conditions Control of diesel exhaust particulate matter Oxidation reactions mechanisms Overview of modeling in monolithic catalytic converters Catalyst deactivation Thermal degradation [sintering] Poisoning Chapter 3 : Modeling the Diesel Oxidation Catalyst Overview Catalyst structure Model assumptions and justifications Model equations Boundary and initial conditions Reaction kinetics model vii
8 3.7 Mass and heat transfer in the catalyst channels Conclusions Chapter 4 : Kinetic parameter estimation Overview Experimental data Catalyst geometry and parameters for model simulation Optimization model CO, C 3 H 6 and NO oxidation Conclusions Chapter 5 : Axial precious metal distribution effects on monolith-supported catalyst CO oxidation Effect of using a higher heating rate Effect of catalyst density Effect of flow rate Effect of CO inlet concentration Combined effects Simultaneous oxidation reactions Conclusions Chapter 6 : Effects of sulphur on the performance of the axial precious metal distribution catalyst designs Overview Sulphur poisoning Results and Discussions Sulphur adsorption and desorption temperature versus axial length Sulphur accumulation profile along the monolith length at various temperatures and times Sulphur poisoning of five designs for axial catalyst distribution Conversion performance of CO oxidation for fresh and poisoned catalysts Conclusions Chapter 7 : Aging behavior of the five distributed precious metal catalyst designs Overview Sintering viii
9 7.3 Results and Discussions Precious metal dispersion Thermal aging effect on the five case scenarios CO oxidation performance before and after aging Conclusions Chapter 8 : Conclusions and future work Conclusions Recommendations for future work Appendix Nomenclature References ix
10 List of Figures Figure 1-1: NO x and PM standards progression for heavy-duty diesel engines exhaust and applied technologies [4]... 2 Figure 1-2: Honeycomb monolith [8] Figure 2-1: The NO x storage and the NO x release/reduction processes in NSR [35] Figure 2-2: Lean NO x control method in SCR where the reductant is a HC Figure 2-3: Lean NO x control method in SCR using ammonia Figure 2-4 : Thermal degradation mechanisms: a) sintering of precious metal particles, and b) sintering of the support [washcoat] [63] Figure 2-5: Phase transitions and surface areas of Al 2 O 3 as a function of temperature [63] Figure 3-1: Chemical and physical phenomena taking place in monolith channels [13] Figure 3-2: 1D representation of the monolith channel Figure 4-1: Predicted and measured CO concentrations Figure 4-2: Predicted and measured C 3 H 6 concentrations Figure 4-3: Predicted and measured NO concentrations Figure 4-4: Predicted and measured NO outlet concentrations compared to the corresponding thermodynamic equilibrium levels Figure 4-5: CO, C 3 H 6 and NO Arrhenius plots, logarithm of kinetic constants ln k and adsorption constants ln K ads as a function of reciprocal temperature (K -1 ) Figure 5-1: Five scenarios for axial catalyst distribution along the monolith Figure 5-2: CO conversion at the catalyst outlet as a function of time for the five case scenarios of axial catalyst distribution Figure 5-3: CO conversion and bulk gas temperature as a function of position and time for the uniformly deposited catalyst (Case 1) Figure 5-4: CO conversion and bulk temperature as a function of position and time for front-loaded monolith (Case 2) Figure 5-5: CO conversion and bulk gas temperature as a function of position and time for back-loaded monolith (Case 3) Figure 5-6: CO conversion and bulk gas temperature as a function of position and time for triangular distribution (Case 4) x
11 Figure 5-7: CO conversion and bulk gas temperature as a function of position and time for inverted triangular distribution (Case 5) Figure 5-8: Cumulative CO emissions as a function of time Figure 5-9: CO conversion as a function of time (heating rate of 30 K/min) Figure 5-10: Cumulative CO emissions as a function of time at the outlet of DOC (heating rate of 30K/min) Figure 5-11: CO conversion as a function of time (catalyst density: 16 g/ft 3 ) Figure 5-12: CO conversion as a function of time (Low flow rate of 10 L/min and high flow rate of 30 L/min) Figure 5-13: CO conversion as a function of time (800 and 400 ppm CO inlet) : CO conversion as a function of time (heating rate of 30K/min and 16 g/ft3 of catalyst density) Figure 5-15: CO, C 3 H 6 and NO conversion at the catalyst outlet as a function of time for Case Figure 5-16: CO conversion in a mixture at the catalyst outlet as a function of time for the five case scenarios of axial catalyst distribution Figure 5-17: C 3 H 6 conversion in a mixture at the catalyst outlet as a function of time for the five case scenarios of axial catalyst distribution Figure 5-18: NO conversion in a mixture at the catalyst outlet as a function of time for the five case scenarios of axial catalyst distribution Figure 5-19: a) CO, b) C 3 H 6, c) NO conversion and d) bulk gas temperature as a function of position and time for Case Figure 5-20: a) CO, b) C 3 H 6, c) NO conversion and d) bulk gas temperature as a function of position and time for Case Figure 5-21: a) CO, b) C 3 H 6, c) NO conversion and d) bulk gas temperature as a function of position and time for Case Figure 5-22: a) CO, b) C 3 H 6, c) NO conversion and d) bulk gas temperature as a function of position and time for Case Figure 5-23: a) CO, b) C 3 H 6, c) NO conversion and d) bulk gas temperature as a function of position and time for Case Figure 6-1: Sulphur concentration as a function of outlet temperature with a 15 ppm sulphur inlet on nonpoisoned uniformly distributed Pt-Pd/Al 2 O 3 catalyst xi
12 Figure 6-2: Sulphur accumulation profile as a function of the monolith axial length for 4, 16 and 32 hours of S exposure on Pt-Pd/Al 2 O Figure 6-3: Five case scenarios for axial catalyst distribution along the monolith (fresh versus poisoned catalyst with 15 ppm sulphur inlet, 4 hours, 550K and 600K Figure 6-4: CO conversion and bulk gas temperature as a function of position and time for the fresh/uniformly deposited catalyst: Case Figure 6-5: Time to inflection in conversion/temperature along the axial position for the five case scenarios of axial catalyst distribution for the fresh catalyst (same conditions as those described in Figure 6-4) Figure 6-6: Time to inflection in conversion/temperature along the axial position for the five case scenarios of axial catalyst distribution after poisoning with 15 ppm sulphur inlet, 4 hours of sulphur exposure at 550K Figure 6-7: CO conversion and bulk gas temperature as a function of position and time for Case 5 distribution after poisoning Figure 6-8: CO conversion at the catalyst outlet as a function of bulk temperature for the five case scenarios of axial catalyst distribution before and after Sulphur coverage for 4 hours at 550 K [adsorption mode] Figure 6-9: CO conversion at the catalyst outlet as a function of bulk temperature for the five case scenarios of axial catalyst distribution after Sulphur coverage for 4 hours at 600K (desorption mode) Figure 7-1: Normalized surface area as a function of axial length during sintering of Pt-Pd/Al 2 O 3 and temperature profile per cycle Figure 7-2: Five case scenarios showing the axial catalyst distribution along the monolith (fresh versus aged precious metal after 20 cycles of aging) Figure 7-3: CO conversion at the catalyst outlet as a function of time for the five case scenarios of axial catalyst distribution before and after aging Figure 7-4: Time to a) 50% and b) 90% CO conversions as a function of axial position for the five case scenarios of axial catalyst distribution before and after aging. Unaged/Fresh catalyst: solid line, Aged catalyst: dashed line Figure 7-5: CO conversion and bulk gas temperature as a function of axial length for Case 2 (Front loaded catalyst) after aging xii
13 Figure 7-6: CO conversion at the catalyst outlet as a function of bulk temperature for the five case scenarios of axial catalyst distribution before and after 20 cycles of aging xiii
14 List of Tables Table 2-1: Emissions Legislation Limits for the US (US HD Cycle; g/bhp-hr) [1]... 9 Table 2-2: Emissions Legislation Limits in Europe (HD Test Cycle; g/ bhp-hr) [18]... 9 Table 2-3: Catalyst deactivation mechanisms [59] Table 4-1: Feed compositions Table 4-2: Parameter values for model simulation Table 4-3: Summary of reaction scheme and model expressions Table 4-4: Initial and converged reaction and adsorption constants used in the model Table 5-1: Simulation conditions for CO conversion Table 5-2: Summary of the extent of impact that the axial precious metal gradient has on CO conversion performance Table 5-3: Conditions used in simultaneous reaction simulations Table 6-1: Sulphur adsorption and desorption constants used in the model Table 6-2: Percentage of precious metal content remaining active after sulphur poisoning Table 6-3: Simulation conditions of CO conversion for fresh and poisoned catalysts Table 6-4: Light off temperatures for the five designs before and after S poisoning Table 7-1: Simulation conditions used for aging cycle Table 7-2: Percentage of exposed precious metal remaining after each five cycles of thermal aging Table 7-3: Simulation conditions of CO conversion for fresh and aged catalysts Table 7-4: Light-off temperatures for the five designs of axial catalyst distribution before and after aging xiv
15 Chapter 1: Introduction 1.1 Motivation Diesel engine vehicles are expected to increase in popularity [1]. In Europe, they represent approximately 50% of the new cars sold. Their popularity is due to their high fuel efficiency, which is 30 to 50% higher than that of a gasoline engine with comparable power output. This higher fuel economy translates to less emitted carbon dioxide (CO 2 ) [1], greenhouse gas that contributes significantly to global warming. Besides these advantages, diesel engines emit low levels of carbon monoxide (CO) and hydrocarbon (HC) pollutants, since they operate in fuel-lean regimes where the relative air/fuel ratio, in terms of the stoichiometry for complete combustion, is greater than one. The major shortcoming of diesel engines is their high nitrogen oxide (NO x ) and particulate matter (PM) emissions, both of which are responsible for public health problems [2, 3]. Therefore, diesel vehicle emissions standards have become more stringent with time. The progression of NO x and PM standards for diesel high-duty engines and applied technologies is presented in Figure 1-1 [4]. Exhaust after-treatment systems are required in diesel vehicles to satisfy these pollutant emissions constraints. Two main technologies are currently used for NO x after-treatment, lean NO x traps (LNTs) and selective catalytic reduction (SCR) catalysts. Diesel particulate filters (DPFs) are used to control PM, while diesel oxidation catalysts (DOCs) are used to treat CO and HC and can oxidize nitric oxide (NO). 1
16 Figure 1-1: NO x and PM standards progression for heavy-duty diesel engines exhaust and applied technologies [4]. Diesel oxidation catalysts are the subject of this thesis. They are a key component of the aftertreatment system and are usually installed upstream of LNT, SCR and DPF components to provide NO 2 through NO oxidation, since NO 2 is a key intermediate or reactant for efficient performance of these technologies (engine out NO:NO 2 levels are typically on the order of 9:1) [5]. Diesel oxidation catalysts can also be used to increase downstream exhaust gas temperatures via CO and HC oxidation. This is sometimes done to generate the high temperatures required for DPF regeneration [6]. In terms of HC emissions, DOCs can effectively reduce aldehydes, polycylic aromatic hydrocarbons (PAHs) and the organic fraction of diesel particulate emissions [2]. They have 2
17 removal efficiencies of % for PM, which is composed of soot, soluble organic fractions (SOF) and sulfates. They can also oxidize up to 90% of CO and HC emissions at gas temperatures above 300 C [2, 7] ]. Diesel oxidation catalysts consist of a honeycomb/monolith substrate with parallel channels. The substrate is made of either metallic or ceramic materials coated with high surface area alumina or zeolite, called the washcoat. Precious metals, such as Pt, Pd or Pt/Pd blends, are dispersed on the washcoat surface. The washcoat provides a high surface area onto which the metal canbe deposited. The gas flow in the channel is usually laminar, even for high throughputs, due to the small diameters of the monolith channels. The geometric configuration of the monolith maximizes mass and heat transfer between gas and catalytic surface. Figure 1-2 shows an example of a honeycomb monolith [2, 5]. Figure 1-2: Honeycomb monolith [8]. Diesel oxidation catalysts usually have a homogeneous distribution of precious metal down the length of the monolith. This is primarily due to ease of manufacturing, although some metal zoning has been used to account for oxidation versus reduction reactions in gasoline exhaust 3
18 systems [9]. Some modeling studies [9-15] suggest that non-uniform catalyst distributions affect/enhance overall catalyst performance by taking advantage of the inherent reactant/reaction gradients during normal operation. Tronci et al. [10] observed that a higher catalyst concentration in the upstream section of the monolith, but with a fixed total catalyst amount, could minimize cold start emissions and achieve light off earlier than a catalyst with a uniform distribution [10]. It has also been shown for CO oxidation that an axial parabolic catalyst distribution results in shorter warm-up times compared to those obtained with a uniform catalyst distribution [11]. Oh and Cavendish suggested that faster converter light off can be achieved with smaller frontal area and higher Pt concentration in the catalyst upstream section [12]. Cominos and Gavriilidis developed a 2-D model to study the effect of axially non-uniform catalyst distribution on temperature and concentration gradients. They found that exponentially decreasing catalyst distributions initiate light-off at the inlet of the monolith [15]. In a recent study [13], a micro-genetic algorithm was used to predict the optimal precious metal distribution along a Pt/Rh catalyst, with the target to minimize cumulative CO emissions. The results showed that faster light-off temperatures and improved conversion performance occurred with a catalyst distribution that has a higher catalyst concentration in the upstream section of the monolith. These studies all indicate that gradients in active site concentrations could be used to improve catalyst performance. However, there has not been a systematic investigation of the effect of catalyst distribution on conversion performance. Also the effects of performance degradation on these catalyst designs has not been addressed. 4
19 1.2 Research objectives The first objective of this thesis was to employ a unidimensional mathematical model that accurately described the transient behaviour associated with DOC operation for uniform and non-uniform precious metal distributions, accounting for heat transfer, mass transfer, and chemical reaction phenomena inside the monolith. Oxidation kinetic rate parameters for CO, C 3 H 6, and NO were estimated using data obtained from a Pt-Pd/Al 2 O 3 catalyst. The second objective was to determine the effect of different catalyst distributions along the length of catalyst on CO, C 3 H 6 and NO oxidation performance. The kinetic model was used for this evaluation. Although there were differences in the axial distribution of catalyst concentration along the washcoat, the total amount of catalyst was kept constant. Different reactions were modeled to compare the conversion performance and cumulative emissions under a variety of operating conditions. Finally, the effect of catalyst activity loss through thermal aging and sulphur poisoning on the performance of these catalyst designs was evaluated. To achieve these objectives, COMSOL Multiphysics coupled with Matlab was used to solve the nonlinear system of partial and ordinary differential equations that describe the mass and energy balances for gas and solid phases in a monolith channel. A non-linear optimization method was used to estimate kinetic parameters that predict experimental data for CO, C 3 H 6, and NO oxidation along the Pt-Pd/Al 2 O 3 catalyst. 1.3 Thesis outline This thesis consists of seven chapters. Chapter 1 focuses on the research motivation and objectives. Chapter 2 summarizes the literature regarding catalytic technologies for diesel engine 5
20 emission control, as well as key studies that focus on DOC modeling. Chapter 3 describes the model used to simulate a DOC. Chapter 4 explains the selected reaction kinetics and the method that was used to estimate the global reaction kinetics for CO, C 3 H 6, and NO oxidation over a Pt- Pd/Al 2 O 3 catalyst. Chapter 5 describes the different designs for precious metal axial distribution and their effects on Pt-Pd/Al 2 O 3 catalyst performance. Chapter 6 explains the mathematical model used to describe sulphur poisoning along the length of a monolith. Chapter 7 presents the impact of thermal aging on the different catalyst designs. Finally, Chapter 8 summarizes the main conclusions and recommendations of this research project. 6
21 Chapter 2: Literature Review 2.1 Health and environmental effects of diesel combustion emissions Particulate matter emissions can cause aggravated asthma and lung damage. In addition, some hydrocarbons (HC) and their derivatives have been classified as human carcinogens. Carbon monoxide is an extremely toxic pollutant and symptoms of CO poisoning vary from dizziness and headaches to coma and death. Carbon monoxide poisoning symptoms include eye, nose and throat irritation, drowsiness and unconsciousness [16]. Diesel exhaust pollutants can also have a negative environmental impact. Particulate matter (PM) from diesel engines contributes to haze, which restricts visibility. In addition, NO contributes to ozone formation (a component of smog), where the ozone is produced through photochemical reactions between NO and volatile organic compounds. Acid rain results from acidic gases such as SO 2 and NO x, which dissolve in water and produce sulphurous, sulphuric, and nitric acids. Acid rain is responsible for building corrosion, vegetation and forest death, and water acidification [5, 16]. Carbon dioxide accumulates in the atmosphere, increasing global surface temperatures and is considered a primary component of global warming. Global climate change has become an extremely important topic for governments and international organizations. Climate warming is leading to glacial ice sheet melting, rising sea levels, tornadoes, and floods [5, 16]. 7
22 2.2 Emission regulation and control Canadian federal regulations establishing exhaust emission limits for gasoline and diesel on-road vehicles were first established in 1971 under the Motor Vehicle Safety Act, which was organized by Transport Canada. This authority was transferred to Environment Canada under the Canadian Environmental Protection Act 1999 (CEPA 1999). The standards include exhaust emissions of carbon monoxide (CO), hydrocarbons (HC), oxides of nitrogen (NO x ), diesel particulate matter (PM), evaporative hydrocarbon emissions (HC), and smoke capacity. Canada and the U.S have uniform vehicle emissions standards for model years By 2016, the new standards should reduce greenhouse gas emissions from vehicles by 25 % compared to 2008 models [17]. The need to control vehicle emissions in the United States was acted on in 1970, when the US Congress passed the Clean Air Act and established the US Environmental Protection Agency (EPA), chartered to make significant improvements in air quality [1]. To meet the current requirements of the Clean Air Act, improvements in engine design have not typically been enough. The need for catalytic after-treatment system integration is critical in lowering vehicle emissions to meet these standards. There is increasing demand for diesel powered light-duty (LD) and heavy-duty (HD) vehicles due to their higher fuel economy. In the US, Europe, and Japan, essentially all trucks and buses operate with diesel-fueled engines. The acceptable emissions standards differ for each application and region. Each vehicle must meet specific emission standards as measured in standardized driving cycles, which reflect the duty cycle expected for the particular engine. Diesel engines are the main source of NO x emissions in California, with 18% from on-road 8
23 vehicles, and 19% from off-road vehicles [18]. According to the California Air Resources Board (CARB), 70% of all air pollutants were related to PM. The control of emissions from diesel engines in the US was initiated in the mid-1980s, by both the EPA and CARB. Their goal was to reduce emissions from HD trucks and road vehicles by taking into account new emission standards for both NO x and PM. Table 2-1 summarizes the emissions legislation limits for the US [1]. In Europe, emissions standards for LD and HD engines were addressed by Euro IV and Euro V regulations. Further NO x emissions reductions (up to 90%) and PM emissions reductions are required through new Euro VI regulations. Table 2-2 shows the HD emissions limits in Europe. India, China, and Brazil have implemented EURO IV emissions standards starting in 2010 [1, 18]. Table 2-1: Emissions Legislation Limits for the US (US HD Cycle; g/bhp-hr) [1]. Year HC CO NO x PM Table 2-2: Emissions Legislation Limits in Europe (HD Test Cycle; g/bhp-hr) [18]. Year HC CO NO x PM 2000 (Euro III) (Euro IV) (Euro V)
24 2.3 Catalytic technologies of diesel emission control Diesel engines operate with high air/fuel ratios compared with stoichiometric spark-ignited gasoline engines. Oxygen is always in excess in diesel engine exhaust. This also leads to cooler combustion and less CO and HC emissions than those of a gasoline engine [2, 5]. However, the nature of the combustion process results in still too high emissions of particulate matter, or soot, and NO x, and the CO and hydrocarbon levels, although low, are still higher than regulations allow. In the following sections, the most important technologies for after-treatment diesel emissions control will be discussed in detail Diesel oxidation catalyst (DOC) Diesel emissions consist of three pollutant phases: 1. Solid: dry carbon or soot. 2. Liquid: unburned fuel, liquid fuel and oil adsorbed to particulate matter, called the soluble organic fraction (SOF), particulate sulfates and sulphuric acid. 3. Gas: CO, HC, nitrogen oxides and sulphur oxides. As introduced in Chapter 1, a honeycomb monolith support is used for the DOC (and all other exhaust catalysts) due to the following features: (1) low pressure drop, especially under high fluid throughputs; (2) reduction of external mass transfer and internal diffusion limitations; (3) low axial dispersion and backmixing, and therefore high product selectivity; (4) larger external surface area; (5) uniform distribution of flow (gas phase); (6) elimination of fouling and plugging, and thus extended catalyst lifetime; and (7) easy scale-up [19]. 10
25 The following oxidation reactions occur over a DOC: CO + ½ O 2 CO 2 (2.1) C n H 2m + (n+m/2)o 2 nco 2 + mh 2 O (2.2) NO + ½ O 2 NO 2 (2.3) SOF + O 2 CO 2 + H 2 O (2.4) Some undesirable products can be produced as a result of other oxidation reactions. Sulphur dioxide (SO 2 ) oxidation into sulphur trioxide (SO 3 ) may ultimately form sulphuric acid (H 2 SO 4 ), resulting in acidic emissions and possible formation of particulate sulphates that can reduce the catalyst effectiveness and contribute to total particulate matter emissions [5]: 2SO 2 + O 2 2SO 3 (2.5) As an example of selectivity concerns, a catalyst containing high surface-area bulk CeO 2 as an active part of the catalyst with a low level of Pt has been used to maximize SOF, HC and CO conversion, and minimize SO 3 production. This technology is already used in some medium-duty trucks [20]. Diesel oxidation catalysts can provide very effective control of HC and CO emissions, with efficiencies up to 90% [7] at exhaust temperatures over 300 C. The typical catalyst consists of Pt and/or Pd supported on Al 2 O 3, sometimes with addition of CeO 2 and a zeolite. Platinum as the active metal over Al 2 O 3 is commonly used as a model for DOCs [21, 22, 23, 24]. Platinum is preferred because it has good low-temperature HC oxidation activity. Palladium is sometimes added to improve catalyst stability against sintering at high temperatures and also to increase conversion [25, 26]. Substitution of Pt by Pd also reduces the catalyst cost since Pd is cheaper 11
26 than Pt [2]. Results also show that the addition of high surface-area CeO 2 leads to higher HC and CO conversions and to less SO 3 formation [27]. In order to help meet cold start emissions limits, zeolite materials are sometimes added to the catalyst. They adsorb and trap gas-phase hydrocarbons, only releasing them at about 250 C, which is above the HC oxidation light-off temperature for the Pt component [27]. Nitric oxide (NO) oxidation to NO 2 occurs over the noble metal component. NO 2 is a key intermediate or reactant for efficient NO x storage/reduction (NSR), selective catalytic reduction (SCR) or diesel particulate filter (DPF) performance. Therefore, DOCs are placed upstream of NSR, SCR and DPF technologies to provide NO 2 through NO oxidation (engine out NO:NO 2 levels are typically on the order of 9:1) [5]. This reaction is kinetically limited at low temperatures (< 350 C over Pt/Al 2 O 3 ) and thermodynamically limited at high temperatures. The thermodynamic limitation is more significant at the high end of the diesel exhaust temperature range [28]. Nitric oxide oxidation is a reversible, exothermic reaction and when catalyzed by Pt, it has been found to be product-inhibited by NO 2 [29]. Nitric oxide is kinetically not able to dissociate into O 2 and N 2 since the catalyst active sites have a high oxygen affinity [28, 29, 30, 31]. Adding Pd to a Pt/Al 2 O 3 catalyst can improve NO oxidation performance [32]. In mixtures of NO, CO and HCs, the NO oxidation reaction is inhibited by CO or HCs, with the oxidation of NO being minimal until CO and HC species are nearly completely consumed. This is because of reactant competition for active sites on the catalyst and NO 2 produced from NO oxidation is consumed as an oxidant for C 3 H 6 and CO oxidation [33, 34]. 12
27 2.3.2 Control of NO x under lean-burn conditions Under normal operating conditions, diesel exhaust contains 3-10% oxygen, which is advantageous for HC and CO oxidation, but not for NO x reduction to N 2. Currently, two catalytic systems have been developed to convert NO x to N 2 under the oxidizing conditions of lean-burn exhaust. They are selective catalytic reduction (SCR), and NO x storage and reduction (NSR) catalysis NO x storage/reduction (NSR) In NSR technology, NO x is stored as a nitrate on the catalyst during normal driving (which is fuel lean relative to air), and then periodically reduced during a short reductant-rich period when some amount of the NO x -trapping material becomes saturated. As shown in Scheme 2-1, oxidation of NO to NO 2 is the first step. 2NO+ O2 2NO NO + MCO MNO + CO Lean 2MNO3 2MO+ 2NO+ O2 MO+ CO2 MCO3 Rich 2NO+ 2CO N 2+ 2CO2 Figure 2-1: The NO x storage and the NO x release/reduction processes in NSR [35]. 13
28 M represents the storage component, typically an alkaline earth material such as Ba, or an alkali metal, such as K, for higher temperature operation [2, 5, 35] Selective catalytic reduction of NO x (SCR) In the second method, SCR, lean NO x control can be achieved by using a reductant that selectively reacts with NO x instead of O 2. In one form of SCR, the reductant is a hydrocarbon already present in the exhaust gas, as illustrated in Scheme 2-2. O2 H2O + CO2 HC NOx N2 + H2O + CO2 Figure 2-2: Lean NO x control method in SCR where the reductant is a HC. Selective catalytic reduction of NO x to N 2 can be also achieved using ammonia as the reductant. The ammonia SCR reactions are summarized in Scheme 2-3. Ammonia SCR has been used extensively for NO x removal in power generation and chemical plant exhaust gases. There are two primary reactions in the ammonia SCR process. The first reaction is called the standard reaction; the second reaction, which includes the reduction of equimolar concentrations of NO and NO 2 to N 2 by ammonia, is known to be faster than the first reaction [2] and is called fast SCR. The ammonia in vehicle applications can be obtained from the decomposition of urea that is sprayed into the system as an aqueous solution [2,5]. 14
29 4NO+ 4NH 3 + O 2 4N 2 + 6H 2 O 2NO+ 2NO 2 + 4NH 3 4N 2 + 6H 2 O Figure 2-3: Lean NO x control method in SCR using ammonia Control of diesel exhaust particulate matter Diesel particulate filters (DPF) are used to reduce soot emissions (the solid fraction of diesel particulates). Filter regeneration is needed periodically to reduce exhaust gas pressure drop in the filter as a result of accumulated particles. Oxidation of soot to CO 2 at a sufficient temperature, with an oxidant such as O 2 or NO 2, regenerates the filters for continued performance [5]. Soot can be oxidized by NO 2 at much lower temperatures than with O 2, as NO 2 is a much stronger oxidant [35]. 2.4 Oxidation reactions mechanisms The reaction mechanism for CO oxidation on Pt [36,37] follows the Langmuir-Hinshelwood dual-site mechanism. In this mechanism, the surface reaction between adsorbed CO adjacent to adsorbed oxygen is the rate limiting step. CO oxidation over Pd has also been observed to follow Langmuir-Hinshelwood kinetics [38]. Reaction steps for CO oxidation are as following: k1 CO+ [ ] [ CO ] k 1 k2 O2 + 2[ ] 2[ O ] k 2 k3 [ O ] + [ CO ] CO2 + 2[ ] (2.6) (2.7) (2.8) 15
30 CO has strong self-inhibition because the adsorption of CO blocks oxygen adsorption to the active sites and therefore inhibits the reaction [39,40]. CO self-inhibition decreases as temperature increases with no inhibition effects at temperatures above 370 C [41,42]. Accurate reaction kinetics for a given catalyst are required for reliable models to provide a reasonable prediction of the monolith reactor. The global kinetic approach is very common in catalytic converter kinetic modeling. In this approach, the reaction pathway can be described by a single algebraic expression. A typical kinetic rate equation that followed the Langmuir Hinshelwood mechanism for CO oxidation was given by Voltz et al., s R k y y s CO = CO CO O2 / G s 2 2 ads, CO CO ads, C H 3 6 ads, CO, C H 3 6 s 2 s s G = [1+ K y + K y C H ] [1+ K y CO y C H ] [1+ K ads, NO y s 0.7 NO ] (2.9) (2.10) They presented global oxidation kinetics for C 3 H 6 and CO over Pt-based catalysts where O 2 adsorption was the rate limiting step, and developed a model for an isothermal, catalytic converter based on kinetics associated with those reactions. A resistance term that includes CO, C 3 H 6, and NO inhibition effects was proposed for the oxidation reaction expressions [42]. It was proposed in another study with a similar rate expression that the inhibition term is independent of the number of sites as shown in Equation 2.11 [43]. r CO = k y CO a O2 CO CO q C3H 6 NO 2 [ 1+ K1 yco + K 2 yc 3 ] 3H + K y 6 NO y (2.11) where a and q are constants. 16
31 Hydrocarbon oxidation reactions also follow a Langmuir-Hinshelwood dual-site mechanism between adsorbed O 2 and HCs [42]. C 3 H 6 has a strong inhibition effect as adsorption of C 3 H 6 is stronger than O 2 [42]. Voltz et al. reported the same form of rate expressions described for CO, shown in Equations 2.9 and NO oxidation is kinetically limited at lower temperature and thermodynamically limited at higher temperatures [28]. Inhibition by NO increases with increasing temperature due to competitive adsorption of reactants on the catalyst surface [42]. Olsson et al developed a global kinetic model for the NO oxidation reaction over Pt/Al 2 O 3 for lean NO x traps [28]. R NO = k NO y NO y 0.5 O2 k K NO eq, NO y s NO2 (2.12) In a study by Mulla et al, it was shown that there is strong inhibition by NO 2 on NO oxidation over Pt, with the kinetics described by Equations (2.13) and (2.14). This was justified by the strong adsorption property of NO 2 on Pt [29]. Another study confirmed this finding [44]. R NO = k NO y a NO b c yo 2 yno 2 (1 β ) (2.13) β = K eq, NO y y NO2 NO y 0.5 O2 (2.14) 2.5 Overview of modeling in monolithic catalytic converters Mathematical models are used by catalyst manufacturers to account for the complexity of interactions between various physical and chemical processes that occur within the channels and 17
32 along the channel walls of a monolithic converter. They can be used to evaluate and to design new catalyst technologies. Several mathematical models have been developed for exhaust gas after-treatment systems. The first models described heat and mass transport phenomena using 0- dimensional [45] or 1-dimensional [46] models. Later 2- and 3-dimensional models were developed. They were more sophisticated but required significantly greater computational power [47,48]. In terms of chemical reaction kinetics and mechanisms, models range from considering a single reaction, commonly CO oxidation, to multiple reactions with stationary [isothermal] Langmuir-Hinshelwood type rate expressions [42], non-stationary rate expressions [49] and detailed microkinetic rate expressions [50]. However, global Langmuir-Hinshelwood rate expressions with a classical heterogeneous 1-D plug flow model are among the most commonly used approach in the literature [46] because of its relative simplicity, high accuracy, and reduced computational efforts. There are various modeling scales according to the monolith structure; washcoat (catalyst layer), single channel and multi-channel or full reactor. A washcoat or catalyst layer scale can be used when the reaction and diffusion phenomena are the main concerns. At this scale, mathematical models do not necessarily give a good picture of the entire reactor. Single channel scale modeling is widely used in describing diesel and gasoline after-treatment systems. At this scale of modeling, it is assumed that all other monolith channels operate under identical conditions and that the single channel model can represent the entire reactor. Multi-channel scale modeling can be used to account for non-uniform flows and heat transfer interactions between reactor channels and the surroundings [19]. It is difficult to extrapolate models at the washcoat scale for monolith 18
33 reactor design. Full scale models can provide the highest accuracy, but again require significantly more computation time. To make a compromise, modeling at the channel scale is currently still the most preferred choice. The modeling of a single channel includes two phases: the gas phase where the gas flows and the solid phase (or washcoat phase) where the gas adsorbs on the active sites and reacts to form products. The mass and energy balance equations need to be solved with suitable boundary and initial conditions. A single channel model can be formulated either in 1, 2 or 3 dimensions. Onedimension models can be obtained by neglecting radial variations in concentration and radial temperature gradients in the gas and solid phases [46, 51]. The main equations used in 1D monolith modeling are described in detail in Chapter 3. Mauviot et al. [52] developed a simplified dimensionless model for a monolith reactor, which considered reaction accuracy (being able to model the conversions and concentrations) as well as CPU time. The model was dynamic, and included non-isothermal conditions. The model s accuracy was illustrated by comparing the model s predictions to experimental results from a three-way catalyst (TWC), a DOC, a LNT system, a SCR system and a DPF. The simulation results were in good agreement with the experimental results [52]. Oh et al. modeled the transient behaviour of automobile monolithic converters [46]. A onedimensional, non-isothermal model was developed to evaluate the dynamic response and lightoff behaviour of the catalyst. CO, C 3 H 6, and H 2 oxidation reactions as a function of operating conditions were considered. They used the expression proposed by Voltz et al. to describe CO and C 3 H 6 oxidation reactions [46]. They examined the light-off as a function of catalyst design 19
34 parameters and also found that H 2 and CO oxidation rate expressions were similar, because both reactions were inhibited by CO in the same manner. Hayes et al. used a 2-dimensional and unsteady state model to study the transient behavior of a monolithic reactor in which methane was oxidized, investigating both start-up and shut-down procedures. Their model included axial diffusion in the gas phase, and axial conduction and radiation in the solid. Steady state conditions were assumed for the gas and a developing velocity profile was considered. They found that heat losses by convection are greater than heat losses by conduction and radiation under laminar flow condition [53]. Tischer et al. developed a 3-dimensional model of a monolithic catalyst, assuming steady state single channel flow fields and transient thermal behavior. This was due to the short residence time of the reactants relative to the inlet conditions and thermal response of the solid bulk. They studied methane combustion over a platinum-coated catalyst. High spatial resolution for surface and gas phase reactions was achieved. They found that most of the oxidation occurred in the hot inner channels during light-off [48]. Several studies have used modeling with global kinetics to capture the DOC performance in which the rate expressions are calibrated with the experimental data using a 1-dimensional model [54, 55, 56]. A 1-dimensional steady state model of a commercial DOC was developed using results obtained during actual vehicle operating conditions [54]. Kinetic parameters were estimated through a numerical fit of the experimental data for a wide range of conditions. The 20
35 model predictions for NO and NO 2 emissions at low engine loads and temperatures were poor due to poor NO oxidation at low temperatures, which was apparently not well captured, but it was fairly good for CO and HC emissions. They suggested that additional reactions, which would consider NO 2 reduction to produce NO, were required to capture the catalyst NO outlet concentrations at temperatures below 200 C. The model predictions at higher loads and temperatures were good for all of the chemical species involved in the reactions. One model [55] considered more complicated phenomena associated with zeolite-containing catalysts, including: (i) HC gas diffusion into the catalyst layer, and (ii) HC gas adsorption and desorption. The kinetic parameters were estimated from experimental data, and the simulation methodology was used to predict two-dimensional HC conversion efficiency across radial and axial positions of the monolith [55]. In a separate study, the performance of a commercial DOC under vehicle operating conditions was predicted, and the kinetic parameters, such as activation energies and pre-exponential factors, were estimated for CO, HC, and NO oxidation over a fresh Pt/Al 2 O 3 catalyst [56]. The model used was a transient, one-dimensional plug-flow reactor model. Non-uniform axial catalyst distributions on catalytic monoliths have also been investigated. Oh and Cavendish [12] predicted the behavior of packed-bed catalytic converters during warm-up under transient conditions using a 1D model with assumptions of flow uniformity in the packed bed and that heat loss from the converter is negligible. They reported that non-uniform distributions, with a high Pt concentration at the front, can shift the light-off position towards the inlet of the monolith. In addition, they found a smaller frontal area of the monolith is associated with the faster light-off. 21
36 Tronci et al [10] employed the one-dimensional model proposed by Oh and Cavendish with the assumption of negligible mass and heat accumulation in the gas phase. They investigated the axial catalyst distribution in a monolithic converter under the constraint of fixed total catalyst surface area. Cold start emissions were minimized with the optimal distribution, where a higher amount of catalyst was used upstream. Also they found that the steady state performance was not different when the uniform or non-uniform catalyst distributions were compared. Cominos and Gavriilidis [15] carried out theoretical work on the steady state and transient behaviour of a monolithic reactor in which methane was combusted. They developed a 2-D model to investigate temperature and concentration gradients on an axially non-uniformly distributed catalyst. The catalyst distribution was implemented by considering variable washcoat thickness as a function of axial location with a constant catalyst loading. It was found that exponentially decreasing catalyst distributions initiate light-off at the inlet of the monolith and reduce temperature gradients as compared with uniform catalyst distributions under steady state conditions. Psyllos and Philippopoulos [11] developed a 1-D model of a single channel in a monolithic reactor to investigate CO conversion performance with an axial parabolic catalyst distribution under various operating conditions. High conversions were achieved with parabolic distributions even when operating conditions fail to light-off the uniform catalyst distribution, for constant precious metal being used. 22
37 Kim and Kim [13] used a 1-D model to predict the transient thermal and conversion performance of a dual catalytic converter with a Pt/Rh catalyst. A micro-genetic algorithm was used to optimize the precious metal distribution along the catalyst, with the target being performance in terms of minimizing cumulative CO emissions. Also, faster light-off temperatures and improved conversion performances were investigated. Sixty percent reduction of the cumulative CO emissions with an optimal catalyst distribution was achieved compared to those obtained with a uniform catalyst distribution, where the optimal catalyst distribution had more active sites in the upstream section of the monolith and lower in the downstream section than that of the uniform distribution. Ramanthan et al [57] used a 1-D model to describe light-off behavior and cumulative emissions in a catalytic converter. They found that non-uniform catalyst loading with two zones of catalyst with more catalyst at the inlet prefers front-end ignition and therefore the transient time and the cumulative emissions were reduced and better steady state performance was achieved. It was also found that rectangular channel geometries had better transient performance. Kapur et al [58] presented a 2-D model to analyze light-off characteristics for CO oxidation in a diesel oxidation catalyst monolithic reactor by including non-uniform catalyst distributions in both the axial and radial directions. The axial catalyst distribution with more catalyst at the front resulted in better light off performance and lower net CO emissions. Under mass transfer limited conditions, the radial catalyst distribution with more catalyst near the washcoat interface reduced the net CO emissions. 23
38 2.6 Catalyst deactivation Catalyst deactivation is the loss of catalytic activity and/or selectivity over time, and can be classified as thermal, chemical and mechanical. Table 2-3 summarizes catalyst deactivation mechanisms [59]. In catalytic converter applications, including diesel after-treatment systems, mechanical deactivation as a result of physical breakage, attrition and crushing is relatively minimized in current monolith-supported catalysts. However, thermal and chemical deactivations are still of considerable concern and occur regularly [60], and are discussed in more detail below. Table 2-3: Catalyst deactivation mechanisms [59]. Mechanism Type Brief description Poisoning Fouling Thermal degradation Vapor formation Vapor solid and solid solid reactions Attrition/crushing Chemical Mechanical Thermal Chemical Chemical Mechanical Strong chemisorption of species on catalytic sites, thereby blocking sites for catalytic reaction Physical deposition of species from fluid phase onto the catalytic surface and in catalyst pores Thermally induced loss of catalytic surface area, support area, and active phase support reactions Reaction of gas with catalyst phase to produce volatile compound Reaction of fluid, support, or promoter with catalytic phase to produce inactive phase Loss of catalytic material due to abrasion Loss of internal surface area due to mechanicalinduced crushing of the catalyst particle Thermal degradation [sintering] Catalyst thermal degradation is caused by high operating temperature exposure and sudden temperature excursions, resulting in a loss of active catalytic area. Degradation occurs to both the catalyst support, due to crystal growth of either the bulk material or the active phase, and the 24
![precious metal via agglomeration of small metal particles into larger ones, decreasing the precious metal dispersion [61, 62]. Figure 2-1 compares these two mechanisms.](/docs-images/89/100356042/images/39-0.jpg "a) Crystallite Migration Atomic Migration Particle size growth b) Figure 2-4 : Thermal degradation mechanisms: a) sintering of precious metal particles, and b) sintering of the support [washcoat]")
39 precious metal via agglomeration of small metal particles into larger ones, decreasing the precious metal dispersion [61, 62]. Figure 2-1 compares these two mechanisms. a) Crystallite Migration Atomic Migration Particle size growth b) Figure 2-4 : Thermal degradation mechanisms: a) sintering of precious metal particles, and b) sintering of the support [washcoat] [63]. Alumina is commonly used as a washcoat for DOCs and has different phases. High temperatures can cause Al 2 O 3 phase transformation, decreasing the surface area of the catalyst. For example, γ-al 2 O 3, which has the highest surface area, converts to α-al 2 O 3 at temperatures above 1000 C [47]. Figure 2-5 shows the phase transformations of Al 2 O 3. In addition, the presence of water vapour can accelerate sintering [64]. Sintering reduces the surface energy of the support by decreasing dispersion and/or eliminating pores in the support [25]. If pores close, the precious metal particles inside the pores are lost in terms of the reaction, which of course reduces catalyst 25
40 activity [25]. However, addition of BaO, CeO 2, La 2 O 3 and ZrO 2 improves the stability of γ-al 2 O 3 towards sintering by limiting the phase transformations of alumina to the non-porous phase [65]. Figure 2-5: Phase transitions and surface areas of Al 2 O 3 as a function of temperature [63]. Two main factors affect precious metal sintering: the catalyst material itself and temperature. For example, Rh is considered the most sensitive metal toward sintering at high temperature [66]; sintering of Pt and other precious metals occurs at temperatures above 600 C [25]. Also, the 26
41 reaction atmosphere has a significant effect on metal sintering. For example, more rapid sintering occurs in oxidizing environments compared to neutral and reducing environments at high temperatures [51, 67]. The use of a bimetallic catalyst, such as Pd-Rh or Pt-Rh, can enhance long-term catalytic activity by slowing the sintering process at high temperatures [25, 26]. Other important factors in sintering are metal loading, the size and shape of the metal particles, and impurities in the support [25, 26]. In terms of spatial thermal deactivation, it is found that there are significant differences in the catalytic activity as a function of axial position in the monolith. It has been shown that the outlet region of catalytic converters suffers the highest damage due to reaction exotherms and the adiabatic nature of the converter package design [68]. The kinetics of sintering are a function of temperature, time, pressure and the concentrations of different components. The following simple correlation for sintering kinetics has been applied by a number of researchers [69, 70], d( D / D o ) = k s (D / D o ) n dt (2.12) where k s is the sintering rate constant, D is the metal dispersion or metal surface area, D o is the initial metal dispersion, and n is the sintering order. This expression assumes that after sufficient time, the metal surface area reaches zero. This assumption is not valid because even after long aging times some dispersion is still observed. An asymptotic approach which takes into account the dispersion versus time curve to a limiting dispersion, D eq, at finite time was developed by adding ( D eq /D o ) to equation (2.12) [71], 27
42 d ( D / D ) n dt o = k s ( D / D o D / D ) o (2.13) where D eq is the final metal dispersion. A more sophisticated study has been developed to incorporate a sintering model for the support material, Al 2 O 3, as well as Pt sintering. Both used an asymptotic approach [72]. In that study, a factor that includes an Al 2 O 3 phase change (crystal phase of the support material at high temperature) was used in a sintering model which resulted in better agreement with experimental data Poisoning Poisoning is a chemical mechanism whereby a loss of catalytic activity occurs due to the chemisorption of impurities on the active sites of the catalyst and/or changing the geometric structure of the catalyst surface. These impurities originate from the fuel and lubricants and accumulate on the precious metal or support surface preventing adsorption of the desired reactants [73]. Poisoning can be temporary or permanent. Permanent poisons interact strongly and irreversibly with the active sites. Temporary poisons can desorb or be removed, thereby regenerating the catalyst activity, fully or at least partially [60, 74]. Typical DOC poisons are lead (Pb), sulphur (S), phosphorus (P), zinc (Zn), calcium (Ca), and magnesium (Mg). However, sulphur is the most common poison on DOCs [73] and sulphur poisoning is reversible on automotive catalysts. 28
43 Sulphur effect Fuel contains small amounts of sulphur. New requirements concerning fuel sulphur content were introduced in the standard for ultra-low sulphur diesel fuel is 15 ppm sulphur for on-road vehicles in Canada and the U.S. [75]. Sulphur in the exhaust is produced from sulphur bound in hydrocarbon species, such as thiophenes, and exits the engine as SO 2 during combustion. Sulphur poisoning can form new inactive compounds on the catalyst surface and also can cause changes in the morphology, catalyst structure and electronic properties [76]. It is found that CO and HC oxidation performance decreases in the presence of sulphur on the catalyst [77]. Also the adsorbed sulphur compounds on the soot and PM increases the DPF system load [78]. Sulphur poisoning on the catalyst is reversible, and the poisoned catalyst can be regenerated and the catalyst activity can be partially restored via thermal treatment [60, 74]. A significant amount of SO 2 is oxidized to SO 3 at temperatures above 300 C. The produced SO 3 is stable up to 700 C and can act as a catalyst poison or interact with basic components of the washcoat (ceria/al 2 O 3 ) or water vapour to form sulphuric acid and contribute to the total particulate matter [25]. Sulphur dioxide and SO 3 adsorb on the catalyst surface at low temperatures (< 300 C) and react with catalyst components. In rich conditions (fuel-air ratio is high), both SO 2 and SO 3 are reduced to produce hydrogen sulfide (H 2 S). A precious metal that is not active for SO 2 oxidation would be great in terms of limiting DOC sulphur poisoning. Unfortunately, Pt is very effective in SO 2 oxidation. Palladium is an attractive option because it has a lower intrinsic SO 2 oxidation activity than Pt [80], but is not as active for key reactions over a DOC such as CO, HC and NO oxidation reactions. 29
44 A catalyst support that is less sensitive to sulphur adsorption is required since sulfate formation as a result of reaction between sulphur compounds and washcoat components is an important source of DOC deactivation. It can reduce the active surface area of the washcoat by changing the support structure and limiting the diffusion and adsorption of reactant molecules onto precious metals. Increase in sulphur deposits and a large decrease in BET surface area were found on an alumina-based catalyst after aging. However, no changes in the surface area of a silica-zeolite mixed oxide support were noted. The difference is due the formation of aluminum sulfates that reduce the catalyst surface area [81]. Indeed, aluminum sulfates (Al 2 (SO 4 ) 3 ) are considered a main source of DOC deactivation. Axial penetration profiles of sulphur poisoning, along the catalyst length and across the washcoat thickness, have been observed. It is found that more sulphur accumulated at catalyst upstream positions and the concentration gradually decreased toward downstream [38, 64, 82]. Sulphur (as sulfate) was noticed throughout the washcoat [64] and was homogeneously distributed within the washcoat layer [25] Desulfation Catalyst activity can be recovered by removing the sulphur from the catalyst surface, often called desulfation. Efficient desulfation can be achieved with H 2 reduction and increased temperature. For example, sufficient desulfation was achieved at 500 C and above via H 2 reduction of a pelleted Pt-based three way catalyst examined by Beck et al [83]. In another study, Pt/Al 2 O 3 desulfation was examined [84], and the results indicate that the process of desulfation involved initially a reduction of surface sulfates to SO 2, then a reduction to H 2 S. The authors suggested 30
45 that the desulfation process is mass transfer limited by the sulphur species diffusing to the Pt sites for reduction or H diffusing from its adsorbed location to the sulphur sites. This was based on the high apparent reaction order with respect to sulphur. Sulphur release was greatly increased with increasing temperature and increasing H 2 reductant concentration. The amount of sulphur released was 75% by treatment with H 2 reduction at 400 C [84]. It was found in another study that treatment with O 2 was effective in regenerate Pd/Al 2 O 3, using a lean atmosphere at very high temperatures ( C) [85]. Surface sulphur on a Pd catalyst cannot be significantly reduced in a reducing environment because of PdS formation in the presence of H 2 [85]. Sufficient CO and HC oxidation activity following sulphur exposure using a bimetallic Pt-Pd monolithic DOC was obtained by Tagawa et al [86]. They reported that smaller amounts of Pd relative to Pt can maintain high conversion of HCs even after very long driving distances, proving that the ratio of Pt:Pd is an important factor in the duration of sulphur exposure with respect to HC conversion [86]. 31
.")
46 Chapter 3: Modeling the Diesel Oxidation Catalyst 3.1 Overview After-treatment exhaust converters use monolith-supported catalysts, which have numerous narrow channels (a typical order of magnitude is 400 cells per square inch). This geometric configuration is an efficient design to maximize mass and heat transfer between the gas phase and catalytic surface. The most important processes in the monolith channel are convection of exhaust gas, heat and mass transfer between the flowing gas and the washcoat, internal diffusion, catalytic reactions in/on the washcoat, heat and mass accumulation and heat conduction. An illustration of these processes is shown in Figure 3-1. Figure 3-1: Chemical and physical phenomena taking place in monolith channels [13]. 32
47 The main phenomena taking place inside a DOC monolith may be described using a single channel model. This assumption is accurate for adiabatic operation and uniform inlet flow distribution. A 1D mathematical model that accounts for the physical and chemical processes occurring within the channels and along the channel walls of a DOC is used in this chapter. 3.2 Catalyst structure The catalyst model in this study has monolith channels with square cross sections. Each channel is coated with alumina, with 8 g/ft 3 loading of 1:2 Pt:Pd [87]. For modeling purposes, the monolith channel is divided into the gas phase, where the gaseous reactants and products flow, and the washcoat, where the reactant gases are adsorbed onto the free sites of the noble metals and react to form products. Figure 3-2 shows the 1D representation of the monolith channel. The channel cross section (2R) was measured and is 1.1 mm. The washcoat was assumed to have a uniform surface area with a thickness of 40 microns, and this thickness is labeled (σ). 40 microns was chosen as a mid-point of values used in previous studies, where microns have been used [10, 12, 67]. 33
48 Gas species Half monolithic wall Washcoat Free site Surface reaction R R+σ Bulk z Figure 3-2: 1D representation of the monolith channel. The monolith sample modeled in this work had a cell density of 400 cells per square inch (cpsi), a diameter of 20.4 mm and a length of 35 mm. The sample had 203 channels based on the cell density and the sample diameter. The gas velocity was calculated to be 1.6 m/s based on the volumetric gas flow rate, which was L/min, the number of channels and the channel diameter. 3.3 Model assumptions and justifications The basic assumptions used in the proposed model are: 1. The DOC reactor can be accurately described with a one-dimensional model in the monolith channels. Radial variations in the gas phase and washcoat phase are neglected due to the high aspect ratio of channel length to diameter [46, 49]. 2. All reactions occur on the surface of the catalyst coating the monolith walls (washcoat), since there is no catalyst anywhere else in the monolith. 34
49 3. The diesel exhaust gas contains 8 components: CO, O 2, N 2, CO 2, NO, NO 2, H 2 O and HC. 4. The hydrocarbons in the diesel exhaust can be represented by C 3 H 6 for simplicity. This assumption is commonly made in modeling [10, 13, 54, 55] and experimental [42, 88] investigations. 5. The monolith operates adiabatically. 6. The flow is laminar, based on the gas velocity in the monolith channels. 7. The gas velocity is assumed to be constant in and along the monolith channel, since the concentration of the reactive species is relatively small and the gas volume is not expected to vary significantly. 8. The axial diffusion in the gas phase is negligible because of the high flow rate and gas velocity (1.6 m/s) commonly encountered in DOC monoliths. Axial convection in the gas phase is the main mass transfer mechanism. 9. The effects of surface adsorption, desorption and pore diffusion are lumped together in the values estimated for the apparent rate constants in the global kinetic rate expression used in this investigation. 10. Axial heat conduction in the washcoat is included because it has an important role in warming up the monolith. 35
50 3.4 Model equations The mole balance for the gas components flowing down the monolith channel is given by the classic diffusion-reaction equation, including accumulation, convection and external mass transfer, y k t ( yk ) k c a s = υ + ( yk yk ), k = CO, O g 2, CO 2, C 3 H 6, H 2 O, NO, NO 2 (3.1) z ε where y k gas-phase concentration of the k th component, mol/m 3 y s k washcoat concentration of the k th component, mol/m 3 υ k c linear gas velocity, m/s gas/washcoat mass transfer coefficient, m/s a gas/washcoat interfacial area per unit reactor volume, m 2 /m 3 g ε z t monolith channel void fraction monolith axial coordinate, m time, s The mole balance in the washcoat, including accumulation, external mass transfer and catalytic reaction, is given by the following expression, y t s k kc a = ( y g ε 1 ε ) 1 ) + s ε J s k y s k ( j= 1 v k j R j, k = CO, O 2, CO 2, C 3 H 6, H 2 O, NO, NO 2 (3.2) where s ε vk j washcoat porosity stoichiometric coefficient of the k th component in the j th reaction 36
51 37 j R rate of the j th reaction, mol/m 3 s The energy balance for the gas phase, including accumulation, convection and gas-solid heat transfer, is given by the following expression, ( T) T a k c z T t T c s g h g p g p g + = ε ρ υ ρ (3.3) where g ρ gas-phase density, kg/m 3 g p c gas-phase heat capacity, J/kg K T gas-phase temperature, K s T washcoat temperature, K h k heat transfer coefficient, J/m 2 s K The energy balance in the washcoat, including accumulation, axial heat conduction, gas-solid heat transfer and heat of reaction, is given by the following expression, = + = J j j j r s g h s s s s p s R H T T a k z T t T c 1, 2 2 ) ( 1 ε λ ρ (3.4) where s ρ washcoat density, kg/m 3 s p c washcoat heat capacity, J/kg K s λ effective axial heat conductivity in the washcoat, J/m s K
52 H r, j reaction enthalpy of the j th reaction 3.5 Boundary and initial conditions To solve Equations (3.1) to (3.4), a set of boundary and initial conditions that describe the upstream and downstream concentrations and temperatures in the monolith channel needs to be specified. Inlet concentrations and temperature in the gas phase are specified with the equations, y k (0, t) = y in k = inlet concentration (3.5) T (0, t) = T in = inlet temperature (3.6) The change of the washcoat temperature with respect to axial position at the inlet and outlet of channel equals zero, T s z T s z (0, t) = 0, upstream of the DOC (3.7) (L,t) = 0, downstream of the DOC (3.8) where L is the length of the DOC channel. Initial conditions for all variables are: y k (z, 0) = 0 (3.9) s y k (z, 0) = 0 (3.10) s s T (z, 0) = T o (3.11) T (z, 0) = T o (3.12) 38
53 3.6 Reaction kinetics model The main function of a DOC is to oxidize NO, CO and HCs. Diesel exhaust is typically lean, with high levels of O 2, from about 3 to 10%. The following CO, C 3 H 6, and NO oxidation reactions on the DOC will be considered in the model, 1 CO+ O2 CO2 (3.13) 2 9 C3H 6+ O2 3 CO2+ 3 H 2O (3.14) 2 1 NO+ O2 NO2 (3.15) 2 Oxidation reactions for CO and C 3 H 6 are assumed to follow the well-known Langmuir- Hinshelwood mechanism. Rate-law expressions originally suggested by Voltz et al. are commonly used in the literature to model these reactions [42]. The kinetic rate parameters with a global kinetic reactions approach are adjusted to fit experimental data obtained by Irani [87] as will be discussed in detail in Chapter 4. The reaction rate expressions for CO and HC oxidation are given by the equations, R R s = k y CO y s O G (3.16) CO CO 2 / s = k y C H y s O G (3.17) C H C H / The term G is called the inhibition factor and is given by the expression [42], s 2 2 ads, CO CO ads, C H 3 6 ads, CO, C H 3 6 s 2 s s G = [1+ K y + K y C H ] [1+ K y CO y C H ] [1+ K ads, NO y s 0.7 NO ] (3.18) 39
54 The first term in G, s s 2 ads, CO yco Kads, C H y C3H ] [ 1+ K + 6, accounts for inhibition effects due to 3 6 chemisorption of CO and C 3 H 6 onto the catalyst sites. The second term, 2 2 ads, CO, C H 3 6 s s [1+ K y CO y C H ], is required to fit the experimental data at higher concentrations of 3 6 CO and C 3 H 6. This term is empirically related to the decrease of adsorbed O 2 adjacent to 0.7, NO NO s adsorbed CO and C 3 H 6 at high concentrations. Finally, [1+ K ads y ] accounts for the inhibition effect of NO on the oxidation rate. The adsorption constants, K ads,j, obey the Arrhenius law. The rate law expression for NO takes into account the fact that this reaction is reversible by introducing the equilibrium constant K eq,no [28]. R NO k s s 0.5 NO s = k NO y NO y O2 y NO 2 (3.19) K eq, NO The equilibrium constant K eq,no can be calculated from the change in the Gibbs free energy, which is strongly temperature dependent and can be obtained from the reaction enthalpy, H, and the reaction entropy, S [89], K G, G / RT, = e, G = H T S (3.20) eq NO The variables k j and y s j are the reaction rate constants and concentrations of the species in the washcoat, respectively. The reaction rate constants, k j, follow the Arrhenius law, k j = A j e E / RT j (3.21) From stoichiometry, the reaction rate for oxygen is given by, 1 R O = ( RCO + 9 RC3H + R NO ) (3.22) 40
55 3.7 Mass and heat transfer in the catalyst channels The mass and heat transfer coefficients in Equations (3.1) to (3.4) were estimated based on empirical correlations for the Sherwood and Nusselt numbers, Sh Dk kc = (3.23) dh k h = Nuλ dh g (3.24) The Sherwood and Nusselt numbers were calculated based on correlations valid for laminar flow in square channels [90], Sh = 2.98[ Re Sc d ] L 0.45 (3.25) Nu = 1.86[ Re Pr d L ] 1/ 3 (3.26) The binary diffusivity of individual trace species in a mixture with nitrogen was calculated using the Fuller correlation [91], D k = 10 3 T 1.75 P[ ε +ε 1/ 3 k 1 M k 1 + M 1/ 3 N 2 ] 2 N2 (3.24) where, dh Mk hydraulic diameter of the channel, m molecular weight of species k M N 2 molecular weight of nitrogen 41
56 ε k ε N2 P Re Sc Pr diffusion volume of species k diffusion volume of nitrogen pressure, atm Reynolds number Schmidt number Prandtl number λ g gas thermal conductivity, W/(m k) d L diameter of the channel, m length of the monolith, m 3.8 Conclusions In this chapter, a mathematical model used to describe mass transfer, heat transfer, and chemical reaction phenomena occurring inside a monolith-supported DOC, as well as the global kinetics model used in the simulation is described. The main assumptions and justifications leading to the proposed model were specified. Matlab connected to COMSOL Multiphysics was used to solve the model, where a finite element method was used to solve the nonlinear system of partial and ordinary differential equations that describe the mass and energy balances for gas-phase flow and solid-phase properties in a single channel. The isothermal, steady-state version of this model will be used to estimate the reaction kinetic parameters for CO, C 3 H 6, and NO oxidation and will be validated against the experimental data over a Pt-Pd/Al 2 O 3 DOC in Chapter 4. Also, the physical parameter values for model simulation will be listed in Chapter 4. 42
57 Chapter 4: Kinetic parameter estimation 4.1 Overview The development of appropriate reaction schemes and the evaluation of kinetic parameters are achieved using either a micro kinetic approach [92] or a global kinetic approach [28, 42, 49, 54, 93]. A detailed reaction pathway is described using a micro kinetic approach when the kinetic constants for each of the elementary reactions are determined by fitting the experimental data to the reaction model. The global kinetic approach is the most popular in exhaust after-treatment modeling. In this approach, the reaction rates are modeled via global reaction mechanisms where adsorption, reaction and desorption steps are lumped together to reduce the overall number of kinetic parameters. The kinetic parameters are adjusted to fit experimental data. The rate constants are determined by minimizing the error between the rate model predictions and the experimental data. The oxidation rate expressions suggested by Voltz et al. [42] can be used to describe CO and C 3 H 6 oxidation over Pt-based catalysts in a packed bed reactor. The model used a Langmuir- Hinshelwood type rate expression, with CO, C 3 H 6, and NO inhibition terms and assumed isothermal conditions. This rate expression has been used to describe the oxidation reactions in TWCs and DOCs by many researchers [10, 13, 47, 49, 93]. In this chapter, the overall catalyst model, including geometric catalyst parameters and the global reaction kinetics, is described and will be shown to accurately represent the reactions of interest over a Pt-Pd/Al 2 O 3 DOC. The isothermal, steady state version of the 1D-model explained in 43
58 Chapter 3 was used to estimate the rate parameters of the kinetic expressions for CO, C 3 H 6, and NO oxidation over the catalyst 4.2 Experimental data The data used were obtained from steady-state experiments performed by Irani [87]. A monolithsupported Pt-Pd/Al 2 O 3 catalyst, with 8 g/ft 3 loading of 1:2 Pt:Pd, was used in these experiments. The gas flow rate was L/min (equivalent to a space velocity of 100,000 hr -1 ). The experimental data were CO, C 3 H 6, and NO concentrations as a function of axial position in the monolith and temperature. The feed composition used in these experiments is shown in Table 4-1. Table 4-1: Feed compositions. Gas Component CO C 3 H 6 NO Composition 800 ppm 800 ppm 200 ppm O 2 10% N 2 Balance 4.3 Catalyst geometry and parameters for model simulation The monolith used to collect the reaction kinetic data was 35 mm in length, 20.4 mm in diameter, had a cell density of 400 cells per square inch [cpsi], and 203 channels. The gas velocity was calculated to be 1.6 m/s based on the volumetric gas flow rate, the number of channels and the channel diameter. Table 4.2 shows the parameter values that were used in the model. 44
59 Table 4-2: Parameter values for model simulation. References Substrate cell density 400 (cells per square inch - cpsi) Monolith sample length 3.5 (cm) Monolith sample diameter 2.04 (cm) Velocity, υ 1.6 (m/s) s Washcoat porosity, ε 0.65 (assumption, [12]) g Monolith channel void fraction, ε 0.93 (bulk vol./ total vol. = π R 2 L/ π (R+σ) 2 L) Gas/washcoat interfacial area 3333 (2π (R+σ)L/π (R+σ) 2 L) per unit reactor volume, a (m 2 /m 3 ) Washcoat heat capacity, (J/(kg K)) Gas-phase heat capacity, (J/(kg K)) s c T s /T s2 [94] p g c p T [94] Effective axial heat conductivity, (J/(m s K)) s λ [94] 4.4 Optimization model In order to estimate the rate parameters of the kinetic expressions for CO, C 3 H 6, and NO oxidation over a Pt-Pd/Al 2 O 3 DOC, the isothermal, steady-state version of the 1D-model discussed in Chapter 3 was used. The experimental data used to estimate the reaction kinetic 45
60 parameters were collected at steady-state [87] at near isothermal reaction conditions due to low levels of reactant species used. Therefore, Equations (3.1) and (3.2) were simplified to reflect these conditions to the forms shown below. yk z = k a s ( y y ) c g k k υ ε (4.1) y s k = y k + J g ( 1 ε ) j= 1 k c v a k j R, j (4.2) These equations were solved using COMSOL Multiphysics. The COMSOL software implements the finite element method for the solution of partial and ordinary differential equations. The reaction scheme and rate expressions that were used in the model are summarized in Table 4.3. To estimate the rate parameters for CO, C 3 H 6, and NO, an objective function, S(θ ), was developed which was used to evaluate the model predictions against experimental observations (the concentrations of CO, C 3 H 6, and NO along the monolith) at different temperatures for each species as shown in Figures 4-1, 4-2 and 4-3. The objective in this case is to minimize the square of the differences between the predicted and experimental values. The estimation is obtained by selecting the values of (θ ), and rate and adsorption constants (k j, K ads,j ) that minimize the squared residuals: S = n 2 ( θ ) ( yexp, i ycalc, i ) i= 1 (4.3) 46
61 where n is the number of experimental data points along the reactor axis. Model predictions of the axial concentrations for each data point of interest within the objective function are generated with a steady-state 1D reactor model, which solves the mole balance equations for the solid and gas phases. The simplex method, which is a nonlinear optimization method, was used to minimize the objective function and get a set of rate parameters that best fit the experimental results over the entire domainusing MATLAB software. The optimization routine outputs are the adsorption and rate constants that follow the Arrhenius law, Equation (3.13). To obtain preexponential factors and activation energies for the rate constants, Arrhenius plots were used (logarithm of kinetic constants and adsorption constants plotted against the inverse temperature). Table 4-3: Summary of reaction scheme and model expressions. `Reaction Rate expressions s CO+ 0.5O CO R = k y CO y s O G 2 2 CO CO 2 / s C3H O2 3CO2 + 3H2O R k y C H y s 3 6 O2 G C H = C H / s s k s NO + 0.5O2 NO 0.5 NO 2 R NO = ( k NO y NO y O2 y NO 2 ) / G K eq, NO Inhibition term [G]: s ads, CO CO ads, C H 3 6 s 2 G = [1+ K y + K y C H ] [1+ K 3 6 ads, NO y s 0.7 NO ] 4.5 CO, C 3 H 6 and NO oxidation To estimate the rate constants for the oxidation reactions over the DOC, minimization of the square of the differences between the predicted and measured concentrations along the Pt- 47
62 Pd/Al 2 O 3 catalyst was run for CO, C 3 H 6, and NO. The feed composition used in the model is detailed in Table 4.1. Table 4-4 lists the kinetic and adsorption parameters that were used as initial guesses and the converged values that gave the best fit with the experimental data. The reaction rate constants are consistent with other reported values [54, 93]. Figures 4-1 and 4-2 compare experimental data and the model fit for CO and C 3 H 6 concentrations at different temperatures. The pre-exponential factors for CO and C 3 H 6 are 2 orders of magnitude lower than those obtained with the results reported in reference [49]. This is due to the low catalyst loading (8 g/ft 3 ) of the catalyst modeled. This means less frequent collisions between the reactive species and the active catalyst sites and therefore lower pre-exponential factor values. The initial guess values for all activation energies are similar to the results predicted using the optimization routine. The adsorption constant activation energy values for CO and C 3 H 6 are higher than those first guessed, again likely related to the low levels of active sites compared to normal literature described catalysts, thus leading to stronger inhibition via adsorption of these species. However, the NO reaction and inhibition constants are in line with the initial values from references [42, 28]. 48
63 Table 4-4: Initial and converged reaction and adsorption constants used in the model. Reactions Initial values From references Converged values CO oxidation exp[-95000/rt] [49] exp[-86700/rt] C 3 H 6 oxidation exp[ /rt] [49] exp[ /rt] NO oxidation exp[-40000/rt] [28] exp[-41700/rt] Adsorption constants: K, 65.6 exp[961/t] [42] 8.56 exp[2000/t] ads CO K exp[361/t] [42] exp[520/t] ads, C3H 6 K, exp[-3733/t] [42] exp[-3100/t] ads NO CO conc. [PPM] z[m] 403 K 428 K 438 K 458 K Figure 4-1: Predicted and measured CO concentrations. 49
64 C 3 H 6 conc. [PPM] z[m] 473 K 523 K 573 K 623 K 673 K Figure 4-2: Predicted and measured C 3 H 6 concentrations. As discussed in Chapter 3, the NO oxidation reaction is reversible in the temperature range of interest. Therefore the equilibrium constant was calculated based on the change in the Gibbs free energy, G, Equation (3.12). G can be obtained from the reaction enthalpy, H, and the reaction entropy, S, and is a function of temperature. The enthalpy change value for the reaction is kj/mol and the entropy change value is -76 J/mol-K [89]. Predicted and measured NO concentrations are shown in Figure 4.3. The temperature range used to calculate the equilibrium constants was K. 50
65 NO conc. [PPM] z [m] 523 K 573 K 623 K 673 K 723 K Figure 4-3: Predicted and measured NO concentrations. The outlet measured and predicted NO concentrations are also compared with the thermodynamic concentration limitations, and are shown in Figure 4-4. The NO conversion becomes limited by thermodynamics above 700 K under the conditions tested, but for lower temperatures, the NO oxidation conversion is limited by reaction kinetics. 51
66 NO outlet conc. [PPM] Temperature [K] NO- measured NO- predicted NO- thermodynamics Figure 4-4: Predicted and measured NO outlet concentrations compared to the corresponding thermodynamic equilibrium levels. The results from the optimization routine at different temperatures are plotted using Arrhenius plots. Figure 4-5 shows the Arrhenius plots obtained for CO, C 3 H 6, and NO oxidation. The activation energies and pre-exponential factors for the oxidation reaction constants were calculated using the Arrhenius equation. 52
67 ln k CO /T ln K ads,co /T ln k C3H /T ln K ads,c3h /T ln k NO /T ln K ads,no /T Figure 4-5: CO, C 3 H 6 and NO Arrhenius plots, logarithm of kinetic constants ln k and adsorption constants ln K ads as a function of reciprocal temperature (K -1 ). 53
68 4.6 Conclusions In this section, a global kinetic model was developed and the reaction rates parameters for CO, C 3 H 6 and NO were estimated based on the data obtained from a Pt-Pd/Al 2 O 3 model catalyst. CO and C 3 H 6 reactions were assumed to follow Langmuir- Hinshelwood mechanisms with the form originally suggested by Voltz. A simplified isothermal, 1D model integrated with an optimization routine was used to predict the reaction kinetic parameters and adsorption constants for the inhibition term. This model was used to evaluate the effect of axial catalyst distributions of precious metal along a Pt-Pd/Al 2 O 3 catalyst on the reactions detailed above. 54
69 Chapter 5: Axial precious metal distribution effects on monolithsupported catalyst In this chapter, a mathematical model that accounts for physical and chemical processes occurring within the channels of a monolithic converter was used to explain the reasons for changes in performance as a function of catalyst distribution, with five axial catalyst distributions chosen for comparison, each with a different distribution of precious metal down the length, while maintaining the same total mass of precious metal in the monolith. Conversions for CO, C 3 H 6, and NO oxidation performance of the catalyst and total cumulative emissions were evaluated using the reaction kinetic constants estimated for the Pt-Pd/Al 2 O 3 catalyst described in the previous chapter. To model the catalyst distribution, the pre-exponential factor is assumed to be a function of catalyst amount deposited in the washcoat. According to the chemical reaction collision theory [95], for a reaction to take place the molecules that are reacting have to collide with enough energy. The pre-exponential factor in the Arrhenius law equation, A, is a function of the collision frequency k = A e E j / RT (5.1) More frequent collisions with enough energy lead to an increase in the rate of reaction. For a catalytic reaction, collisions between the reactant molecules take place on the surface of the catalyst. Therefore, collision frequency and catalyst site density are directly related. A key assumption in the proposed model is that changes in catalyst site density affect the collision frequency that will lead to chemical reactions. Therefore, if the value of the pre-exponential 55
70 factor is made a function of catalyst position in the bed, the catalyst distribution along the length of monolith is changed. The CO, C 3 H 6, and NO oxidation pre-exponential factors for a sample with a homogeneous distribution of catalyst down the monolith were listed in Table 4-5. Figure 5-1 describes the five cases assessed in this investigation, represented by the value of the CO oxidation pre-exponential constant as a function of catalyst position in the washcoat. For Case 1, the distribution is uniform and the pre-exponential factor is constant for all positions along the monolith. For Case 2, the active site concentration decreases linearly from the upstream to downstream ends of the catalyst bed. Case 3 is the opposite, starting with no catalyst at the inlet of the monolith and increasing linearly along the bed length. Case 4 follows a triangular distribution profile, while Case 5 follows an inverted triangular distribution. These precious metal gradients are of course fictitious, they are idealizations and are not meant to represent the monolith catalyst distributions currently used in practice. With these varieties though, they serve as excellent models to describe limiting behaviors in these systems. They can, therefore, be used to guide catalyst fabrication and development based on conditions that would be encountered in different driving cycles. 56
71 Case 1 Case 2 4E+14 8E+14 A [mol/m 3.s] 3E+14 2E+14 1E A [mol/m 3.s] 6E+14 4E+14 2E z [cm] z [cm] Case 3 Case 4 8E+14 8E+14 A [mol/m 3.s] 6E+14 4E+14 2E A [mol/m 3.s] 6E+14 4E+14 2E z [cm] z [cm] Case 5 8E+14 A [mol/m 3.s] 6E+14 4E+14 2E z [cm] Figure 5-1: Five scenarios for axial catalyst distribution along the monolith. 57
72 5.1 CO oxidation In the simulations, the inlet gas temperature is increased from ambient to a target final temperature of 450 K. This temperature was chosen based on simulations showing that light-off occurred in this temperature region and a high steady-state conversion could be achieved after light-off. Two heating rates (5 K/min and 30 K/min) three reactant mixture flow rates (10, and 30 L/min), two precious metal loadings (8 and 16 g/ft 3 ), and two inlet CO concentrations (400 and 800 ppm) were evaluated in the simulations. Figure 5-2 compares CO conversion as a function of time for the five different cases for the lower heating rate of 5 K/min. The conditions used for simulations are shown in Table 5-1. Table 5-1: Simulation conditions for CO conversion Heating rate 5 K/min Final temperature 450 K Flow rate L/min Precious metal loading 8 g/ft 3 Inlet concentration 800 ppm CO, 10 % O 2 For uniform precious metal distribution along the bed (Case 1), 50% conversion a typical measure for light-off conversion is achieved after 27 minutes of reaction when the inlet temperature reaches 435K. The CO conversion increases with time/ temperature and ultimately reaches 99% conversion at steady state. The conversion profile follows a typical oxidation reaction light-off profile. Carbon monoxide conversion and bulk gas temperatures as a function of position and time for the uniformly distributed catalyst are shown in Figure 5-3a and 5-3b. 58
73 Outlet CO conversion [%] Case 1 Case 2 Case 3 Case 4 Case 5 Inlet Temperature Temperature [K] Time [min] Figure 5-2: CO conversion at the catalyst outlet as a function of time for the five case scenarios of axial catalyst distribution. The monolith initially warms up via convective heat transfer from the increasingly hot inlet gas. As the oxidation reaction starts, heat is released due to the exothermic oxidation reaction. The increase in temperature along the monolith length after 25 to 27 minutes shown in Figure 5-3b is caused by some of the CO oxidizing down the monolith length, as is also shown in the top portion of Figure 5-3a. At 28 minutes, reaction light-off becomes apparent via the inflection in both the conversion profile and temperature curve at approximately 2.6 cm. The distinct increase in conversion indicates that the temperature is high enough at that point to overcome CO selfpoisoning, which is of course also assisted by the lower CO levels at the catalyst outlet from upstream oxidation. The upstream oxidation reactions liberate heat that is convectively carried downstream. This leads to the small increase in temperature observed prior to light-off. Once enough heat is available to overcome CO self-poisoning, the oxidation rates increases and more 59
74 heat is generated and transferred upstream by conduction through the catalyst. This back-to-front reaction wave propagation is evident in Figure 5-3b and has been reported previously [36, 88, 96, 97]. The CO conversions for all the cases are similar prior to approximately 26 minutes, as are the temperature profiles and as shown in Figure 5-2, indicating that the catalyst warms up primarily by convective heat transfer to that point, with little reaction occurring, leading to slight increases in temperature from the reaction exotherm. a CO conversion [%] min 27 min 28 min 29 min 30 min Axial length [cm] b Bulk Temperature [K] min 27 min 28 min 29 min 30 min Axial length [cm] Figure 5-3: CO conversion and bulk gas temperature as a function of position and time for the uniformly deposited catalyst (Case 1). 60
75 For Case 2, the precious metal loading decreases linearly from the front to back of the monolith. The outlet conversion results shown in Figure 5-2 demonstrate that there is a more rapid increase in CO conversion once light-off begins relative to the uniform catalyst distribution; 99% conversion is reached between 28 and 29 minutes. Carbon monoxide conversion and bulk gas temperatures as a function of position and time for the front-loaded catalyst are shown in Figure 5-4. As with the uniform distribution, the reaction front also travels from back to front under these conditions, with the only difference being that the propagation time is faster for Case 2. Reaction light-off starts at about 1.5 cm, which is more upstream than that for the uniform distribution. This is observed because there are fewer active sites at the back of the catalyst. As the reaction wave moves from the back to the front of the monolith, the density of active sites gradually increases causing the CO oxidation light off to occur later. However once light-off takes place the complete conversion was attained more quickly. 61
76 a CO conversion [%] min 26 min 27 min 28 min 29 min 30 min Axial length [cm] b Bulk Temperature [K] min 26 min 27 min 28 min 29 min 30 min Axial length [cm] Figure 5-4: CO conversion and bulk temperature as a function of position and time for front-loaded monolith (Case 2). Case 3 is the opposite of Case 2, where the precious metal amount increases linearly from front to back of the monolith. Here, the increase in conversion occurs earlier when compared with Cases 1 and 2, as shown in Figure 5-2, where at 27 minutes there is a rapid increase in CO conversion. However, the increase in conversion just after this point, at around 27.3 minutes, becomes slower than that for the first two designs, due to a decreasing amount of precious metal from back to front. 62
77 The CO conversions and bulk gas temperatures as a function of catalyst position and time for Case 3 are shown in Figure 5-5a and 5-5b. The reaction zone moves from back to front through the catalyst with time, again through conductive heat transfer in the washcoat The inflection points in conversion and temperature rise are observed in the downstream portion of the catalyst, but as the reaction moves toward the front, the reaction zone stops at about 1.5 cm into the catalyst. The upstream portion of the catalyst is not catalyzing the reaction to any significant extent, with no significant temperature rise in that region, corresponding to the lack of significant conversion/reaction occurring. This is due to less active site density and the CO concentration is still high enough to cause the self-poisoning phenomenon on the small amount of catalyst in that portion of sample. Although higher conversions are attained at earlier times, ultimately Case 3 distribution is the worst in overall conversion once steady-state is reached due to the low precious metal content of the upstream portion of the monolith. 63
78 a CO conversion [ %] min 27 min 28 min 29 min 30 min 31 min Axial length [cm] b Bulk Temperature [K] min 27 min 28 min 29 min 30 min 31 min Axial length [cm] Figure 5-5: CO conversion and bulk gas temperature as a function of position and time for back-loaded monolith (Case 3). Case 4 follows a triangular distribution profile, where the precious metal amount in the center of the monolith sample is highest and the amounts at the entrance and exit are zero. In this case, the performance is intermediate between Cases 2 and 3, as would be expected. Figures 5-6a and 5-6b compare CO conversion and bulk gas temperatures along the monolith axis at several times for Case 4. The reaction propagation at first follows the same trends as in Case 2, but is still more rapid due to the steeper increase in active site density from the back to the middle of the catalyst and the gas temperature and CO conversion continuously increase from back to the middle. After the reaction front reaches the middle of the reactor, however, propagation slows down due to the drop off in amount of catalyst toward the inlet and the reaction stops at 1 cm from the catalyst 64
79 inlet since there is not enough active site density to overcome CO self-poisoning in the catalyst upstream region. As discussed above, high catalyst density in the back portion (Case 3) is responsible for the faster light off conversion once poisoning is overcome. a CO Conversion[ %] min 26 min 27 min 28 min 29 min 30 min Axial length [cm] b Bulk Temperature [K] min 26 min 27 min 28 min 29 min 30 min 31 min Axial length [cm] Figure 5-6: CO conversion and bulk gas temperature as a function of position and time for triangular distribution (Case 4) For case 5, the inverted triangular distribution, the precious metal in the very back and front of the catalyst are equally high with decreasing amounts toward the middle of the catalyst. In terms of light-off, this case initially shows the same conversion profile as that for Case 3, with the inflection in conversion observed again at approximately 27 minutes, as shown in Figure 5-2. As 65
80 discussed earlier, this is because of the high catalyst density in the downstream portion of the catalyst with the back-to-front reaction wave propagation occurring under these conditions. The reaction propagation then slows as the reaction wave moves forward through the back half of the catalyst toward the middle point due to the decreasing amount of catalyst. There is an inflection upward in conversion observed at about 28.7 minutes, and afterwards 99% conversion is achieved. The upstream of the catalyst has high catalyst density which is sufficient to achieve high conversion as was observed with case 2. Figures 5-7a and 5-7b compare CO conversion and bulk gas temperatures with position and time for Case 5. CO conversion and bulk temperature continuously increase from back to front with time in the back half of the catalyst. Between 28.5 and 29 minutes, the reaction wave jumps from the back half to the very front of the catalyst, i.e. the reaction front does not smoothly propagate from the middle to the front of the catalyst. This is due to the temperature at the front of the catalyst, which has increased due to convective heat transfer from the inlet gas as well as conductive heat transfer from the hotter outlet portion of the catalyst, exceeding that required to overcome CO poisoning, and the significantly higher amount of active sites relative to the middle portion. Thus there are two reaction light-off positions during this simulation. One occurs at the outlet, as was the case for the other designs, and one that occurs later at the front, resulting in an unsmooth reaction light-off profile. 66
81 a CO conversion [%] min 27 min 28 min 28.5 min 29 min 30 min Axial length [cm] b Bulk Temperature [K] min 27 min 28 min min 30 min Axial length [cm] Figure 5-7: CO conversion and bulk gas temperature as a function of position and time for inverted triangular distribution (Case 5). 67
82 335 Case 1 Case 2 Case 3 Case 4 Case 5 Cumulative CO emissions [grams] Time [min] Figure 5-8: Cumulative CO emissions as a function of time. Ultimately, the desired objective of a catalytic converter is to decrease cumulative CO emissions. For the conditions investigated above, a comparison of cumulative CO emissions as a function of time for the five cases is presented in Figure 5-8. For the first 27 minutes, they are identical, as expected based on the results shown in Figure 5-2, but afterwards differences are noted. Even after 60 minutes, the cumulative emissions increase for all cases with time since 100% conversion was not attained under these conditions. However, Case 2 results in the lowest emissions as compared to the others, since a high steady-state conversion was achieved earliest with respect to the other design cases. 68
83 5.1.1 Effect of using a higher heating rate A 5 K/min ramp rate is admittedly slow for diesel engine applications. Therefore, a higher ramp rate of 30 K/min to a final inlet temperature of 450-K was also simulated. Outlet conversions are shown in Figure 5-9. The light-off time for all catalyst distributions decreases, but there are also less significant differences as a function of time between the cases. This is due to a larger contribution from convective heat transfer from the hotter inlet gases, which makes the reaction wave propagation less dependent on conduction from the downstream Therefore the effect of the precious metal concentration distribution is dampened. For Case 5, there is a smooth increase in conversion, without the jump after light-off as compared with the slower heating rate data, which is due to the higher ramp rate providing sufficient convective heat from the inlet gases such that the jump in light-off position is not observed, i.e. the propagation of the reaction front due to conduction originating from the exotherm is insignificant in terms of the conversion versus time profile. Overall, however, the trends are similar to those observed in Figure 5-2 for the 5 K/min ramp rate, but with significantly smaller differences in performance. 69
84 Outlet CO conversion [%] Case 1 Case 2 Case 3 Case 4 Case Time [min] Figure 5-9: CO conversion as a function of time (heating rate of 30 K/min) The cumulative emissions for the 30 K/min heating rate simulations are shown in Figure These emissions follow the same pattern as those with the slower heating rate, except the emissions are reduced since the high steady-state conversions were achieved earlier. For Case 2, 88 g were emitted after 10 minutes, 89 g for Cases 1 and 5, 90 g for Case 4, and 93 g for Case 3, which was again the distribution that had the worst performance. 70
85 100 Cumulative CO emission [grams] Time [min] Case 1 Case 2 Case 3 Case 4 Case 5 Figure 5-10: Cumulative CO emissions as a function of time at the outlet of DOC (heating rate of 30K/min) Effect of catalyst density To test the effect of the total catalyst amount, the total density of catalyst was doubled to 16 g/ft 3. For the 5 K/min heating rate, the higher catalyst density improves conversion, with light-off achieved earlier for all cases, as shown by comparing Figure 5-11 and Figure 5-2. Increasing the catalyst density increases CO conversion along the reactor axis and the heat released in the combustion, favoring heat conduction from back to front of the monolith. However, the same trends observed in Figure 5.2 are still observed here, even the two light-off locations noted in Case 5. 71
86 Outlet CO conversion [ %] Case 1 Case 2 Case 3 Case 4 Case Time [min] Figure 5-11: CO conversion as a function of time (catalyst density: 16 g/ft 3 ) Effect of flow rate The effect of reactant flow rates are shown in Figure 5-12 for 10 L/min and 30 L/min (52,466 and 157,398 hr -1 space velocities, respectively). Under low flow rates, the differences between the catalyst distributions become less evident, although the same trends are still observed; 100% conversion is achieved at 27.5 minutes for all cases and 40% conversion is reached at the same time for all cases as shown in Figure This is due to the increased reactant residence time in the DOC under low flow rate. At high residence times, the CO and O 2 molecules remain for longer time throughout the entire reaction zone, which permit oxidation reactions to come to completion before CO exits the reactor bed. Differences between the configurations are more significant at higher flow rates and all cases require longer time to reach even 20% conversion; afterwards similar trends to those shown in 72
87 Figure 5-2 are observed. For a flow rate of 30 L/min, the catalyst bed was not long enough to achieve 100% for all 5 case studies investigated. Outlet CO conversion [%] Low flow rate High flow rate Time [min] Case 1 Case 2 Case 3 Case 4 Case 5 Figure 5-12: CO conversion as a function of time (Low flow rate of 10 L/min and high flow rate of 30 L/min) Effect of CO inlet concentration The effect of a lower CO inlet concentration, 400 ppm, was also evaluated. Again, all trends in terms of differences between the designs were the same. With the 8 g/ft 3 loading and a 5K/min ramp rate to 450K, the extents of the differences were also similar. Light off is achieved earlier with the lower CO concentration due to less significant CO self-poisoning. 73
88 100 Outlet CO conversion [%] ppm 800 ppm Time [min] Case 1 Case 2 Case 3 Case 4 Case 5 Figure 5-13: CO conversion as a function of time (800 and 400 ppm CO inlet) Combined effects For the 16 g/ft 3 case and the 30K/min ramp rate conditions, individually and combined, the differences between catalyst bed configurations were less significant due to the significantly decreased CO self-poisoning phenomenon as a result of high contribution of convective heat from the inlet gases as well as the high exotherms that rapidly move from back to front of the monolith. For the higher ramp rate of 30 K/min and a doubled catalyst load, the effect of changing the axial catalyst distributions on overall conversion performance was again less significant as shown in Figure Light off was achieved within almost 4 minutes for all cases. The reasons are the same as those discussed in regards to Figure There are also much less significant 74
89 differences as a function of time between the cases. Table 5-2 compares the effects as a summary of the differences between the designs on CO oxidation performance. 120 Outlet CO conversion [%] Time [min] Case 1 Case 2 Case 3 Case 4 Case : CO conversion as a function of time (heating rate of 30K/min and 16 g/ft3 of catalyst density). Table 5-2: Summary of the extent of impact that the axial precious metal gradient has on CO conversion performance. Low heating rate Low catalyst density High heating rate High catalyst density Low flow rate Low CO conc. High flow rate High CO conc. Significant More significant Less significant Significant These trends indicate that when the catalyst is under harsh conditions, i.e. lower amount of precious metal, low temperature, slow temperature ramp, high flow rate, and high CO 75
90 concentration, an axial gradient in precious metal content can show a measurable difference in CO oxidation conversion. However, under less challenging conditions, the impact of the distribution becomes less meaningful. The simulations show that it is a combination of the significance of CO self-poisoning and of the reaction exotherm versus convective heat transfer from the inlet gases that determine whether the catalyst axial distribution is consequential. The former is related to the amount of Pt versus CO flux at any point in the catalyst, and therefore the distribution will have a direct impact on performance. The latter is related to the rest of the parameters evaluated. For example, with a faster temperature ramp rate, conductive heat transfer due to the exotherm generated from CO oxidation, with light-off at the back of the sample, is too slow to contribute versus the heat being brought in with the inlet gas. The effect of a lower steady-state inlet temperature would follow the same logic. Less CO not only lessens the selfpoisoning effect, but also leads to smaller exotherms generated, and thus less contribution again. Therefore, under specific conditions, the precious metal distribution along the catalyst length can contribute to improved CO oxidation performance relative to a homogeneously distributed sample, with those conditions correlated to the amount of Pt and significance of the exotherm. 5.2 Simultaneous oxidation reactions In this section, the CO, C 3 H 6 and NO oxidation performance as a function of the five axial precious metal distributions are evaluated and compared. Table 5-3 lists the conditions used in the simulation. The temperature was ramped from room temperature, 298 K, to 700 K at 30 76
91 K/min. The outlet oxidation conversions for the uniform axial precious metal distribution are shown in Figure Table 5-3: Conditions used in simultaneous reaction simulations Heating rate 30 K/min Final temperature 700 K Flow rate L/min Precious metal loading 8 g/ft 3 Inlet 800 ppm CO 800 ppm C 3 H ppm NO 5% H 2 O 10% O 2 N 2 balance Outlet conversion [%] CO C3H6 NO NO Thermodynamics Inlet T Inlet Temperature [K] Time [min] Figure 5-15: CO, C 3 H 6 and NO conversion at the catalyst outlet as a function of time for Case 1. 77
92 Carbon monoxide conversion begins first, followed by C 3 H 6 conversion. Fifty percent CO conversion was reached at 9.2 minutes when the inlet temperature was 575 K. Fifty percent C 3 H 6 conversion was obtained after CO light off, at 9.4 minutes and an inlet temperature of 580 K. This is due to the inhibition effect of CO on C 3 H 6 which is related to strong chemisorption of CO on the catalyst surface and thus poisoning the active sites [42]. The 100% conversions CO and C 3 H 6 were achieved at 9.6 minutes and an inlet temperature of 580 K. Carbon monoxide and C 3 H 6 inhibit NO oxidation. This inhibition effect is previously described in Equation Nitric oxide conversion starts to increase just after the CO and C 3 H 6 conversions approach 100% because once CO and hydrocarbons are consumed over the front of the catalyst, NO oxidation occurs in the remaining portion of the monolith [33, 34]. The maximum conversion reached for NO was 29% at 11.2 minutes at an inlet temperature of 640 K. Just after 11.2 minutes, the NO conversion decreased with increasing temperature. NO oxidation is kinetically controlled at low temperatures and thermodynamically controlled at high temperatures [28]. The thermodynamic limitation as a function of time and temperature is also plotted for reference in Figure Figure 5.16 compares CO conversion as a function of time for the five different bed configurations. The overall conversion trends are similar to those observed for only CO oxidation. However, the inlet temperature required to reach a given CO conversion is higher than that noted for the pure CO case due to inhibition by the other species competing for adsorption sites. 78
93 There is almost no apparent difference in the 50% conversion of CO for the five different catalyst designs. However, more severe operating conditions [high flow rate, low ramping rate] were known to result in more significant differences in light off conversion between these designs when just CO oxidation was evaluated (section 5.1). The light-off conversions for all cases were achieved at 9.2 minutes, corresponding to 575 K, and then conversions increased with time to reach 100%. There was no conversion of the species prior to 5.5 minutes indicating there were no oxidation reactions taking place on the catalyst at that time/temperature. Outlet CO conversion [%] Case Case 2 Case Case 4 Case Inlet T Time [min] Inlet Temperature [K] Figure 5-16: CO conversion in a mixture at the catalyst outlet as a function of time for the five case scenarios of axial catalyst distribution. Similar conversion trends to CO oxidation were observed during C 3 H 6 oxidation for the five different catalyst designs (shown in Figure 5.17). However, the C 3 H 6 reactions started later, at 79
94 approximately 6.5 min. As stated, CO and C 3 H 6 inhibit NO oxidation. Therefore, NO conversion for all the five catalyst designs started just after CO and C 3 H 6 light off, as shown in Figure Also, the thermodynamic equilibrium conversions were reached at temperatures above 700 K. Outlet C3H6 conversion [%] Case Case 2 Case Case 4 Case Inlet T Time [min] Inlet Temperature [K] Figure 5-17: C 3 H 6 conversion in a mixture at the catalyst outlet as a function of time for the five case scenarios of axial catalyst distribution. 80
95 Outlet NO conversion [%] Case 1 Case 2 Case 3 Case 4 Case 5 Inlet T Inlet Temperature [K] Time [min] Figure 5-18: NO conversion in a mixture at the catalyst outlet as a function of time for the five case scenarios of axial catalyst distribution. Conversions and bulk gas temperatures as a function of position and time for the uniformly distributed catalyst, Case 1, are shown in Figure At 8.4 minutes, about 20% CO conversion was observed at the outlet with only 10% conversion for C 3 H 6 at the same position. With increasing CO and C 3 H 6 extent of reaction, exothermic heat was generated and transferred conductively upstream through the catalyst as shown in Figure 5.19.d. Therefore, the CO and C 3 H 6 oxidation reaction zones moved further upstream. This same back to front reaction wave trend was previously observed [36, 88, 96, 97] when just CO oxidation was evaluated (section 5.1). CO oxidation light off conversion was achieved prior to C 3 H 6, occurring between cm from the catalyst inlet (which is right at the outlet face) at 9.2 minutes, indicated by a sudden increase in the temperature profile at the same time and position. 100% conversion was achieved 81
96 once the reaction zones had moved into the front portion of the catalyst. Changes in NO conversion started at 9.5 minutes and a maximum conversion of about 29% was achieved at 11.2 minutes in the back portion of the catalyst. These data clearly demonstrate that NO is oxidized after CO and C 3 H 6 light off, proving significant inhibition impact of CO and C 3 H 6 on the NO oxidation reaction. This effect is evident in equation 3.18, which takes into account the inhibition effects of CO and C 3 H 6 on the NO oxidation reaction rate. CO, C 3 H 6 and NO conversion increased with time and temperature. However, NO conversion was limited thermodynamically after 11.6 minutes, with conversion plateauing at the back of catalyst as shown in Figure 5.19.c. a CO conversion [%] b C3H6 conversion [%] Axial length [cm] Axial length [cm] c NO conversion [%] d Bulk Temperature [K] Axial length [cm] Axial length [cm] 8.4 min 8.8 min 9.2 min 9.6 min 10 min 10.4 min 10.8 min 11.2 min 11.6 min 12 min 12.4 min Figure 5-19: a) CO, b) C 3 H 6, c) NO conversion and d) bulk gas temperature as a function of position and time for Case 1. 82
97 In Case 2, which is the front loaded catalyst, CO oxidation light off was similar to the uniformly distributed catalyst and was achieved prior to C 3 H 6 oxidation light off. Again once light-off began, there was rapid increase in both reactant conversions when compared to the uniform distribution, as shown in Figure 5.16 and Nitric oxide oxidation started at 9.5 minutes and reached a maximum conversion of about 29% at minutes. Conversions and bulk gas temperatures as a function of position and time for Case 2 are shown in Figure The reaction wave propagation moved from back to front more quickly relative to the uniform distribution as the active site concentration gradually increased toward the inlet. The lesser number of active sites at the back of the catalyst do not affect the light off conversion for CO and C 3 H 6 as compared with Case 1 because in this case, the catalyst front reacted some amount of CO and C 3 H 6 prior to light off, leading to heat transferred conductively to the catalyst back along with the heat transferred convectively from the hot inlet gases. This increases the reaction temperature for initiating the light off at the back. The same trends were noticed in NO conversion, but again there was no conversion until 9.5 minutes. Twenty nine percent NO conversion was noticed earlier, at minutes, relative to that for Case 1. However, thermodynamic limitations were observed at the same times for Cases 1 and 2. Overall, in this case higher conversions and temperature rises are predicted sooner, or at lower inlet temperature, when compared with case 1. 83
98 a CO conversion [%] Axial length [cm] b C3H6 conversion [%] Axial length [cm] c NO conversion [%] Axial length [cm] d Bulk Temperature [K] Axial length [cm] 8.4 min 8.8 min 9.2 min 9.6 min 10 min 10.4 min 10.8 min 11.2 min 11.6 min 12 min 12.4 min Figure 5-20: a) CO, b) C 3 H 6, c) NO conversion and d) bulk gas temperature as a function of position and time for Case 2. For Case 3, the conversions for all species started earlier when compared with Case 1 and Case 2, as shown in Figures 5.16, 5.17 and There were accelerated increases in CO and C 3 H 6 at 9.25 minutes, but this was followed by slow increases in both conversions, ultimately requiring more time to reach full conversions, ~ 9.9 minutes, as shown in Figures 5.16 and Nitric oxide conversion also began earlier, ~9.3 minutes, then became slower with time, reaching a maximum conversion of 26%. The conversions and bulk gas temperatures as a function of catalyst position and time for Case 3 are illustrated in Figure
99 Case 3 shows better conversion at earlier time/lower temperature for all species but this design needs a longer time to reach steady state conversion as compared with Case 1 and Case 2. The reaction zone moved slowly toward the inlet, where there are less active sites and the temperature was not high enough to overcome the inhibition associated with the different reactants adsorbing to those few sites. a CO conversion [%] Axial length [cm] b C3H6 conversion [%] Axial length [cm] c NO conversion [%] Axial length [cm] d Bulk Temperature [K] Axial length [cm] 8.4 min 8.8 min 9.2 min 9.6 min 10 min 10.4 min 10.8 min 11.2 min 11.6 min 12 min 12.4 min Figure 5-21: a) CO, b) C 3 H 6, c) NO conversion and d) bulk gas temperature as a function of position and time for Case 3. 85
100 For Case 4, the light off conversions for CO and C 3 H 6 were similar to those of Case 2, as shown in Figures 5.16 and Once light off began, there were more rapid increases in CO and C 3 H 6 conversions as compared with Case 2, reaching 100% conversion at 9.5 minutes. Nitric oxide conversion was slightly better up to the first 17% then slowly increased with time to reach a maximum conversion of 26% at 11 minutes as shown in Figure Figure 5.22 compares the species conversions and bulk gas temperatures with position and time for Case 4. Carbon monoxide and C 3 H 6 conversion rapidly increased from the back to the middle due to the steeper increase in active site density toward the middle, reaching full conversion at 9.4 minutes. This leaves more catalytic zone for the NO oxidation reaction to occur. Therefore better NO (17%) conversion was reached at 9.6 minutes at earlier times when compared with other designs. However, just after the reaction front reached the middle, the catalyst site density decreased toward the inlet, resulting in slower NO conversion changes; meanwhile, most of CO and C 3 H 6 oxidized before reaching the catalyst front prior to reaching the steady state. Therefore, Case 4 is the best catalyst design in overall conversions for CO and C 3 H 6 when compared with others. 86
101 a CO conversion [%] Axial length [cm] b C3H6 conversion [%] Axial length [cm] c NO conversion [cm] Axial length [cm] d Bulk Temperature [K] Axial length [cm] 8.4 min 8.8 min 9.2 min 9.6 min 10 min 10.4 min 10.8 min 11.2 min 11.6 min 12 min 12.4 min Figure 5-22: a) CO, b) C 3 H 6, c) NO conversion and d) bulk gas temperature as a function of position and time for Case 4. For Case 5, Carbon monoxide and C 3 H 6 have the same conversion profiles as in Case 3, as shown in Figures 5.16 and Nitric oxide conversion initially showed the same performance as compared with Case 3, as presented in Figure This is because of the high catalyst density at the back of the catalyst. Figure 5.23 compares the conversions and bulk gas temperatures with position and time for Case 5. As the reaction moved from the back toward the middle, the reaction propagation for all species slowed due to the decreasing amount of catalyst. There is a jump in NO conversion and temperature profiles from the back to the front at minutes. 87
102 This is due to convective heat transfer from the inlet gas contributing to increasing temperature at the front of the catalyst and the low catalyst density in the middle of the catalyst. Thus the propagation of the reaction zones slows along the middle, as is also apparent by the relative flat portion of the conversion profile at the middle catalyst positions for all species, leaving more time for the inlet gas to contribute its heat to the front of the monolith, so that the reaction zone either propagates through the middle of the catalyst monolith quickly, or jumps as was observed in section 5.1. Unlike NO conversion which takes place along most of the catalyst length, CO and C 3 H 6 conversion have smooth profiles since both species require more time to achieve full conversion before reaching the catalyst upstream due to the inhibition by CO and C 3 H 6. The catalyst site density in the middle zone is less than the back and the front zones. The reaction propagations move slower from the center to the front as compared with pure CO reaction although higher conversions for CO and C 3 H 6 were achieved at earlier times. This is due to the effects of poisoning by CO, C 3 H 6 and NO species which prevent significant reaction to occur at the catalyst upstream portion at early times/low temperatures, and before reaching the steady state temperature (or nearly complete conversion temperature). All of the CO and C 3 H 6 are oxidized in the front portion of the catalyst (1cm) at higher inlet temperature. 88
103 a CO conversion [%] Axial length [cm] b C3H6 conversion [%] Axial length [cm] c NO conversion [%] Axial length [cm] d Bulk Temperature [K] Axial length [cm] 8.4 min 8.8 min 9.2 min 9.6 min 10 min 10.4 min 10.8 min 11.2 min 11.6 min 12 min 12.4 min Figure 5-23: a) CO, b) C 3 H 6, c) NO conversion and d) bulk gas temperature as a function of position and time for Case Conclusions A one-dimensional, transient model was used to simulate and compare the performance characteristics of CO oxidation, and CO, C 3 H 6 and NO oxidation, with these 3 present in a mixture, over five Pt-Pd/Al 2 O 3 catalysts, each with a different axial precious metal distribution. With just CO oxidation, the results show that differences in the conversion profiles are more significant when the effect of the exotherm generated during CO oxidation has some significant impact on the catalyst surface temperatures. For example, with slow temperature ramp rates, the 89
104 different axial metal content profiles led to different reaction propagation rates through the catalyst, which led to different times required to reach steady state, and thus total cumulative CO emissions differed. Increasing the ramp rate led to smaller differences as the heat associated with the inlet gas dominated the surface temperature profiles, minimizing the impact of the exotherm. Under conditions where meaningful differences were observed, a higher precious metal loading at the outlet portion led to earlier light-off, but ultimately higher cumulative CO emitted, whereas a front-loaded catalyst led to the lowest cumulative CO emitted. These results demonstrate that precious metal distribution can impact CO oxidation, but under relatively specific conditions. For the mixture of the three reactants, CO, C 3 H 6 and NO oxidation, the results point out that faster lightoff conversion performance for the mixture is directly related to a larger amount of precious metal at the back of catalyst, as in Case 3 and 5. The more significant amount of precious metal in the middle portion of the catalyst also led to better CO and C 3 H 6 conversions when in a mixture, different than what was observed with a single reactant, where front loaded designs proved favorable. This is related to the high exotherm from CO and C 3 H 6 oxidation being generated at the back of the catalyst, with high active site densities in the middle, so that oxidation reactions for both species are completed before reaching the catalyst upstream. Therefore, case 4 can be a good design for CO and C 3 H 6 conversion but not for NO conversion, which requires the whole catalyst length. The front loaded catalyst can improve overall conversion performance for NO, and for CO and C 3 H 6 once there is a significant amount of active sites in the catalyst middle. 90
105 Chapter 6: Effects of sulphur on the performance of the axial precious metal distribution catalyst designs 6.1 Overview Performance degradation is a common issue in automotive catalysis. Two primary modes of degradation are thermal aging and sulphur poisoning. With increasingly stringent environmental regulations being implemented, improved and more durable catalysts are desired. DOCs are usually installed upstream of NO x storage and reduction (NSR) catalysts, selective catalytic reduction (SCR) catalysts, and diesel particulate filter (DPF) technologies in order to provide NO 2 through NO oxidation, since NO 2 can increase performance efficiency of these technologies [5]. DOCs also play an important role in controlling the exhaust line temperature, using the heat produced from CO and HC exothermic oxidation reactions to increase exhaust line temperatures. For example, a temperature between 450 C and 600 C is required for active particulate filter regeneration in the presence of oxygen [2], whereas exhaust temperatures are typically much cooler. As the DOC is the first catalytic unit placed in the exhaust after-treatment systems, it is exposed to higher sulphur levels [98]. Sulphur poisoning occurs due to the chemisorption of sulphur species, inherent in diesel fuel or gasoline, on the catalyst active sites, causing changes in the geometric structure of the catalyst surface. Current Canadian and U.S. legislations requiring no more than 15 ppm sulphur content in fuel (ultra-low sulphur diesel) for on-road vehicles started in 2006, and for off-road vehicles in 2010 [75]. But with exposure time, sulphur will eventually accumulate on the catalyst surface. Sulphur is the most common poison found on DOCs [73]. 91
106 In terms of spatial deactivation, significant differences have been found in catalytic activity as a function of axial position of the monolith. Sulphur poisoning is observed upstream in the catalyst, with a gradual decrease toward downstream [99, 100]. Differences in spatial deactivation can change or limit the reaction zone along the catalyst bed. The goal of this study was to use a 1-D mathematical model to understand DOC performance as a function of catalyst distribution for a variety of distributed precious metal designs under conditions that include sulphur poisoning. The model includes the ability to predict, as a function of exposure time, the catalyst activity loss due to sulphur poisoning along the catalyst bed. The effect of the loss of catalyst activity on the conversion performance of these catalyst designs with respect to CO oxidation was evaluated. The CO conversion performance of a Pt-Pd/Al 2 O 3 catalyst was modeled with various distributions of the precious metal, while maintaining the total amount of catalyst. 6.2 Sulphur poisoning Sulphur poisoning on the catalyst is a reversible reaction. The catalyst can be regenerated so that the catalyst activity can be at least partially restored via thermal treatment [60, 74]. Sulphur is the most common poison on a DOC, and usually comes in the form of SO 2 and as particulate matter [77]. A significant amount of SO 2 is oxidized to SO 3 at temperatures above 573 K [77]. Sulphur dioxide and SO 3 adsorb on the catalyst surface at lower temperatures (<573 K) and react with the catalyst components. In this work, SO 2 was considered as the sulphur source. It was assumed that SO 2 adsorption begins at 298 K. The maximum SO 2 uptake was found at 573 K. At temperatures between
107 and 723 K, sulphur is released from catalyst surface and at temperatures higher than 723 K it was assumed that no sulphur uptake would occur. This assumption were based on data obtained over a 1 % Pt/Al 2 O 3 catalyst, where adsorbed sulphur species were oxidized and released at higher temperatures (>573 K) [101]. Sulphur adsorption/desorption model: The sulphur poisoning reaction is considered to be a first order reaction with respect to sulphur concentration (S) and to the amount of active adsorption sites on the catalyst surface (A), with the adsorption leading to an inactive deposit (I), S ka + A I (6.1) kd The forward reaction term represents the rate of sulphur adsorption on the active sites in the washcoat [95]. The backward reaction term was added to represent the rate of sulphur removal from the active sites (desorption rate). The following expression describes the sulphur poisoning reaction rate: R s = k a y s s y s A k d y s I where k a, k d are the adsorption and desorption constants; y s s is the concentration of the sulphur (6.2) component in the washcoat; s y and A s y represent the concentration of the active and inactive I sites in the washcoat. The fraction of inactive sites is described by the equation, f I t = k a y s s ( f I) kd f I 1 (6.3) 93
108 where f I is the fraction of the adsorption sites covered with an inactive deposit (I). The monolith is assumed to be initially unpoisoned, f = 0. The concentration of the sulphur I component in the gas phase and washcoat was calculated by applying molar balance Equations (3.1) and (3.2) from chapter 3. As a simulation temperature-programmed oxidation technique was used to evaluate catalyst performance, sulphur poisoning occurred under nonisothermal conditions, so the energy balances in the gas phase and the washcoat, Equations (3.3) and (3.4), were solved together with the mass balance. The CO reaction model and the sulphur accumulation model were solved simultaneously, with the CO reaction rate being decreased by (1- f I ) as the poisoning increased. The corresponding model equations in the solid phase will be y t s k kc a = ( y g ε 1 ε ) 1 ) + s ε J s k y s k ( j= 1 v k j R j (1 f ), k = CO, O 2, CO 2, N 2, SO 2 (6.4) I s ρ c s p T t s 2 s T = λ 2 z s kh a + g 1 ε ( T T s ) J j= 1 H r, j R j (1 f I ) (6.5) 6.3 Results and Discussions Sulphur adsorption and desorption temperature versus axial length Sulphur is present in the exhaust gas at ~1 ppm [64]. In the simulations shown in this chapter, the inlet sulphur amount in the gas phase was set to 15 ppm to accelerate the trends. The rate constants k a and k d in Equation (6.2) were calculated to reflect the fact that sulphur adsorption begins at 298 K (adsorption of 50% of the entering sulphur is assumed to occur at room 94
109 temperature this is a purely speculative assumption) and continues until the maximum uptake of 90%, which occurs at 573 K. This is based on our parameter values of adsorption and desorption rate constants used for the simulations. These values are listed in Table 6-1. Table 6-1: Sulphur adsorption and desorption constants used in the model. Adsorption constant, k a Desorption constant, k d exp[-9770/rt] exp[ /rt] Sulphur desorption begins after 573K because sulphur reaction is reversible thus the amount on the catalyst is less than that at saturation. All sulphur is removed from the active sites on the catalyst by 723 K. These assumptions are consistent with the literature [101]. Figure 6-1 illustrates what the outlet sulphur concentration would be, when exposing afresh, non-sulphur containing Pt-Pd/Al 2 O 3 sample to the 15 ppm-containing inlet gas stream, as a function of the outlet temperature. This plot does not describe a temperature ramp with continuous exposure to sulphur. Each point shown in Figure 6-1 represents data that would be obtained on a fresh, nonpoisoned catalyst. 95
110 Sulfur [ppm] Outlet bulk temperature [K] Figure 6-1: Sulphur concentration as a function of outlet temperature with a 15 ppm sulphur inlet on nonpoisoned uniformly distributed Pt-Pd/Al 2 O 3 catalyst Sulphur accumulation profile along the monolith length at various temperatures and times Figure 6-2 shows how the adsorbed sulphur accumulates along the monolith channel with exposure time [after 4, 8, and 16 hours] at 550K. As previously stated, SO 2 is adsorbed on the catalyst surface and at temperatures below 573 K there is no desorption, but at higher temperatures desorption occurs. Therefore, at 550 K, sulphur is in purely adsorption mode. After the exposure times listed at 550K, the catalyst temperature was raised to 600 K, at which point sulphur desorption can occur, leading to a less S-saturated surface of the poisoned catalyst. Equation (6.3) was applied in order to define the sulphur coverage, f, shown in Figure 6-2. It I can be clearly seen that the accumulation of sulphur is greater near the catalyst inlet and that it gradually decreases toward the catalyst outlet. Sulphur accumulation also increases with increasing exposure time. The sulphur coverage along the catalyst length is higher at 550 K than at 600 K because sulphur begins to release after 573 K during the desorption process. Increased 96
111 poison accumulation near the catalyst inlet has been previously experimentally observed [99, 100], and the model shows consistency with such results Sulfur coverage f I h 32 h 4 h 16 h 16h 32 h Axial length [cm] 550K 600K Figure 6-2: Sulphur accumulation profile as a function of the monolith axial length for 4, 16 and 32 hours of S exposure on Pt-Pd/Al 2 O Sulphur poisoning of five designs for axial catalyst distribution. Figure 6-3 describes the Pt-Pd distributions of the five cases of precious metal distributions (for a fixed precious metal amount) as a function of axial position for fresh and poisoned catalysts. Four-hour contact time was simulated for the poisoned profiles exposed to 15 ppm of sulphur at 550 and 600K. Since sulphur tends to accumulate near the catalyst inlet, it will have a larger impact on catalyst designs that are front loaded. For all catalyst designs, the exposed amount of precious metal is lower at 600 than 550K, due to some desorption at the higher temperature. It 97
112 is apparent that for Case 1, in which the precious metal is uniformly distributed, there is a significant loss of available precious metal at the front of the catalyst, with the catalyst outlet portion remaining less affected by sulphur poisoning. In Case 2, in which the precious metal loading decreases linearly from front to back, the catalyst inlet is significantly degraded in terms of catalyst activity compared with the other cases. Pt distribution 6E+14 5E+14 4E+14 3E+14 2E+14 1E+14 Case 1 Pt distribution 6E+14 5E+14 4E+14 3E+14 2E+14 1E+14 Case 2 Fresh Poisoned- 550K Poisoned- 600K Axial length [cm] Axial length [cm] 6E+14 5E+14 Case 3 6E+14 5E+14 Case 4 Pt distribution 4E+14 3E+14 2E+14 1E+14 Pt distribution 4E+14 3E+14 2E+14 1E Axial length [cm] Axial length [cm] 6E+14 5E+14 Case 5 Pt distribution 4E+14 3E+14 2E+14 1E Axial length [cm] Figure 6-3: Five case scenarios for axial catalyst distribution along the monolith (fresh versus poisoned catalyst with 15 ppm sulphur inlet, 4 hours, 550K and 600K. 98
113 In Case 3, the precious metal amount increases linearly from front to back, and in Case 4, the precious metal follows a triangular distribution profile. In both of these cases, the amount of precious metal content remaining active is higher than those with the other designs. Table 6-2 lists the percentage of the precious metal content not poisoned after the S exposures at 550 and 600 K. In Case 5, in which the precious metal has an inverted triangular distribution, the loss in catalyst dispersion at the catalyst inlet is greater; however, there is high amount of precious metal that exists at the back of the catalyst. As expected and as illustrated in Table 6-2, Case 3 results in the highest remaining amount of precious metal while Case 2 results in the lowest because the sulphur accumulation leads to the greatest loss of the inlet catalyst fraction. Table 6-2: Percentage of precious metal content remaining active after sulphur poisoning. Temperature Case 1 Case 2 Case 3 Case 4 Case 5 550K 58% 45.4% 70.6% 59.5% 56.5% 600K 75.4% 67.1% 83.7% 76.4% 74.5% Conversion performance of CO oxidation for fresh and poisoned catalysts Figure 6-4 compares the CO conversions and bulk temperature as a function of axial position and time for a fresh and uniformly deposited catalyst. Table 6-3 shows the conditions used in our simulation. 99
114 Table 6-3: Simulation conditions of CO conversion for fresh and poisoned catalysts. Heating rate 30 K/min Final temperature 550 K Flow rate L/min Precious metal loading 8 g/ft 3 Inlet concentration 800 ppm CO, 10 % O 2 Initially, the monolith warms up, due primarily to the convective heat transfer from the hot inlet gas, which is ramped from ambient temperature to 550 K at 30 K/min. Convective heat from the hot gas warms the catalyst, as well as some CO conversion with the exotherm resulting in some conduction which is transferred downstream, leading to some, although small, levels of CO conversion occurring by the back of the catalyst. With the build-up in heat and CO conversion, which also leads to less CO poisoning at the rear of the catalyst, at 4.73 minutes, the distinct CO oxidation becomes apparent at the back of the catalyst (3.2 cm). The inflection in the conversion and temperature then rapidly propagates with time from back to front, highlighted by the x symbol. At 5.3 minutes, the front of the catalyst reaches a significantly high temperature and the inflection in CO conversion is observed at the very front (0.05 cm). At this point, the solid temperature and the inlet gas temperature keeps increasing at the monolith entrance until reaching the steady state temperature. 100
115 100 CO conversion [%] Axial length [cm] Bulk Temperature [K] Axial length [cm] 4.5 min 4.6 min 4.7 min 4.73 min 4.8 min 4.9 min 5 min 5.1 min 5.2 min 5.3 min Figure 6-4: CO conversion and bulk gas temperature as a function of position fresh/uniformly deposited catalyst: Case 1. and time for the The comparison of time to inflection in conversion and temperature along the axial position for the five designs of precious metal distribution before poisoning is shown in Figure 6-5. For the Case 1 distribution, as explained previously (Figure 6-4), the inflection in conversion and temperature starts at approximately 3.2 cm, at the very back, and moves upstream through the catalyst with time. This is due to the convective and conductive heat leading to higher temperatures at the back. For the Case 2 distribution, which is a front-loaded catalyst, the 101
116 reaction front also moves from back to front. The inflection in conversion and temperature is first observed at 2 cm, closer to the inlet when compared with Case 1, indicating that there is a lack of reaction occurring at the back of the catalyst prior to 2 cm because of the lower precious metal content, but once enough conduction heat is produced from the CO reaction, the reaction zone moves rapidly and a faster propagation time than in Case 1 is observed. Time to inflection [min] Case 1 Case 2 Case 3 Case 4 Case Axial length [cm] Figure 6-5: Time to inflection in conversion/temperature along the axial position for the five case scenarios of axial catalyst distribution for the fresh catalyst (same conditions as those described in Figure 6-4). In Case 3, which is a back-loaded catalyst, the inflection in conversion and temperature also moves from back to front with time. At the beginning, the inflection can be observed at the very back of the catalyst (3.4 cm) due to the high downstream density of the catalyst. However, the movement of this inflection towards the inlet takes longer time, due to the smaller amount of exothermic heat, corresponding to the lack of significant reaction occurring with a smaller number of active sites available upstream. 102
117 In Case 4, the highest amount of precious metal is in the middle of the catalyst, with the lowest amounts at the very back and in the front portions. The performance level is midway between those of Cases 2 and 3. No reaction propagation is observed at the downstream locations prior to 2.4 cm since there are not enough active sites to initiate the conversion/temperature inflection. The upstream propagation is initially rapid due to the increase in the active site density toward the middle part. However, after the reaction reaches 1 cm, the propagation slows due to the decrease in the active site density toward the inlet and takes long time to complete: up to 7.2 min as in Case 3. Case 5 is the opposite of Case 4: the precious metal contents in the back and front of the catalyst are equally high, with decreasing amounts toward the middle of the catalyst. With a back-to-front reaction wave propagation, for this case, the propagation starts at the same position as in Case 3 (3.4 cm) because of the high precious metal amount in the catalyst back. The reaction propagation then stops toward the middle portion of the catalyst due to the lack of active site density, and an inflection in the conversion and temperature appears again at 0.5 cm toward the catalyst inlet. Complete CO conversion is achieved rapidly at 5 minutes: the same time as for Case 2. The jump in the inflection is due to the existence of the higher number of active sites at the inlet relative to the middle part and the temperature of the front section of monolith, which has increased due to heat transfer from the hot inlet gas and conduction originating from the downstream reaction exotherm. 103
118 Figure 6-6 shows the time to inflection as a function of axial position for the five sulphur poisoned catalyst designs. For Case 1 after S exposure, the increasingly hot inlet gas heats up the catalyst and the heat accumulates throughout and enough is at the back of the catalyst prior to 5 minutes, with lower CO due to some oxidation and some heat via the exotherm generated upstream. Once enough heat is generated, the inflection in conversion and temperature can be seen at 3.2 cm at the very back. The inactive portion upstream produces a smaller amount of heat via exotherm, thus increasing the time required for the reaction to propagate toward the catalyst upstream. The time to achieve 100% CO conversion is slower compared to that of the fresh catalyst due to the slower reaction wave propagation. 8.5 Time to inflection [min] Case 1 Case 2 Case 3 Case 4 Case Axial length [cm] Figure 6-6: Time to inflection in conversion/temperature along the axial position for the five case scenarios of axial catalyst distribution after poisoning with 15 ppm sulphur inlet, 4 hours of sulphur exposure at 550K. 104
119 For Case 2 after S exposure, the appearance of the inflection occurs nearer the outlet and a later time than it does in the fresh case (at 2 cm and 4.75 minutes): at 2.5 cm and at 5.3 minutes. The front-loaded catalyst design experiences the greatest amount of S poisoning degradation, leaving a wider zone for the CO reaction to propagate compared with the fresh case. The time required for the reaction to propagate upstream is also increased, and full CO conversion occurs at 6 minutes, which is faster than the time for the poisoned Case 1 because the front portion of the catalyst, which has the highest reduction in the catalyst activity in Case 2, still has a higher remaining amount of precious metal than Case 1. With poisoning, Case 3 ends up with the minimum number of inactive sites. The inflections still occur at the very back of the catalyst, as in the fresh case, corresponding to the reaction zone still starting in the outlet section. However, the severely poisoned upstream section leads to the requirement for more time for the reaction to propagate in order to overcome CO poisoning. In the poisoned Case 4, the reaction inflection begins at the same position it did with the fresh catalyst (at 2.4 cm) but at a later time. There is no significant change in catalyst activity at the back of the catalyst and there is enough heat generated via the exotherm, making the reaction inflection remains in a similar position even after sulphur poisoning. The propagation also requires more time to overcome the CO poisoning at the inlet. With poisoning, Case 5 shows the same trend at the back of the catalyst as in Case 3 and in the front of the catalyst as in Case 2, with a slight difference in the middle portion of the catalyst. Figure 6-7 shows the axial profiles of CO conversions and bulk temperatures as a function of time and position for Case 5, with the precious metal distribution overlaid. The increase in CO conversion 105
120 and temperature with time from back to front along the catalyst length is again observed. However, there are interesting patterns in CO conversion in the middle zone of the catalyst, highlighted by the arrows. The catalyst activity in the middle zone is considerably less than the back and the front zones due to the small amount of active catalyst site density. Although lightoff occurs at the back, there is increasing conversion in the front cm, but after this zone, there is little to no conversion in the middle due to the small amount of catalyst. Once past cm, the conversion increases more significantly again. The small catalyst density in the middle region makes it prone to CO poisoning. Once enough heat has built up in the front section (1.5 cm), then substantial conversion is occurring, CO poisoning decreases downstream and once these two have reached some level, corresponding to 5.45 minutes, the reaction propagates very rapidly from the center to the front, since once it passes the middle, small precious metal density zone, the increasing amount of catalyst induces the rapid reaction zone rate. 106
121 a CO conversion [%] Pt-Pd distribution Axial length [cm] b Bulk Temperature [K] Axial length [cm] 5.1 min 5.3 min 5.45 min 5.5 min 5.6 min 5.7 min Figure 6-7: CO conversion and bulk gas temperature as a function of position and time for Case 5 distribution after poisoning. As can be seen from these results, for all catalyst design distributions, poisoning of the catalyst inlet increases the time required for reactions to propagate from back to front for all cases and increases the reaction zone width for Case 2, resulting in a delay in CO oxidation light-off. This effect is clearly illustrated in Figure 6-8, which shows a comparison of the outlet CO conversion as a function of the bulk gas temperature before and after sulphur poisoning for the five case scenarios. For the fresh catalyst, Case 1 reaches light-off conversion at 439 K, and then CO conversion increases with time and temperature to reach 100% conversion at 445 K. The 107
122 conversion profile follows a typical oxidation reaction light-off profile. For Case 2, which is a front-loaded catalyst, the light-off conversion is achieved at 438 K, with only 1 K difference from the Case 1 light-off temperature. However, once light-off is reached, 100% conversion occurs more quickly than in Case 1. In Case 3, which is a back-loaded catalyst, the light-off conversion occurs at a lower temperature than in Case 1 or 2. However, in this catalyst design, the increase in CO conversion becomes slower after light-off due to the smaller amount of precious metal at the catalyst front, making the steady state performance slowly achieved. Outlet CO conversion [%] 100 Fresh catalyst Poisoned catalyst Inlet Temperature [K] Case 1 Case 2 Case 3 Case 4 Case 5 Figure 6-8: CO conversion at the catalyst outlet as a function of bulk temperature for the five case scenarios of axial catalyst distribution before and after Sulphur coverage for 4 hours at 550 K [adsorption mode]. 108
123 Table 6-4: Light off temperatures for the five designs before and after S poisoning. Catalyst Design Fresh Poisoned Case K 446 K Case K K Case K K Case K 445 K Case K K The performance for Case 4, with the middle-loaded catalyst, is midway between that of Cases 2 and 3. Case 5 results in an earlier light-off conversion at a lower temperature than does Case 3 due to the high catalyst density at the outlet. However, an inflection in the conversion can be observed at 445 K, afterwards resulting in 100% conversion due to the increase in the active site density toward the catalyst inlet relative to the middle portions. With poisoning, the light-off temperature in all catalyst designs increases as a result of the loss of precious metal content. Table 6-4 shows the light-off temperature for all cases before and after poisoning. Case 3 shows the best light-off conversion compared with the other cases due to the higher amount of active sites available after deactivation. However, this design requires a higher temperature for complete conversion due to the low active site density at the catalyst front before and after poisoning. Case 2 is the worst design with respect to light off conversion since it is more affected by sulphur poisoning. In Case 5, the absence of active sites in the catalyst front is responsible for the reduction in the overall performance and the disappearance of the upward inflection in the conversion. The Case 4 design is considered to be the best in overall conversion, of 90% and above. In this design, there is enough catalyst activity concentrated at the middle portion of the catalyst even after sulphur poisoning. 109
124 Outlet CO conversion [%] Poisoned catalyst 600 K Inlet Temperature [K] Case 1 Case 2 Case 3 Case 4 Case 5 Figure 6-9: CO conversion at the catalyst outlet as a function of bulk temperature for the five case scenarios of axial catalyst distribution after Sulphur coverage for 4 hours at 600K (desorption mode). Catalyst activity was also evaluated after partial desulfation for the various axial catalyst distributions of the poisoned catalyst. When the operating temperature increases to a higher value (>573K), sulphur is released, and some activity is partially restored in the poisoned catalyst. The CO conversions as a function of temperature obtained for the five catalyst designs when switching from adsorption mode to partial desorption mode [4 hours of poisoning at 600K] are shown in Figure 6-9. The percentage of precious metal content remaining after sulphur poisoning under these conditions is shown in Table 6-2. Compared with the results shown in Figure 6-8, these data are midway between those of the fresh and poisoned catalyst, and the light-off temperatures are reduced in all cases relative to those poisoned at the lower temperature. In Case 1, Case 2 and Case 5, where the damage caused by sulphur poisoning was more severe, clearly 110
125 some restoration of the catalyst activity at the front portion is attained and all were able to reach 100% conversion at lower temperature. Case 2, the front loaded catalyst design, proved the best in overall conversion performance before poisoning. However, after poisoning, this design experiences the highest sulphur damage and the reaction zone is shifted further toward downstream. Sulphur damage makes the reaction light off occur at higher temperature to overcome sulphur and CO poisoning relative to other catalyst designs. The sulphur damage did not widen the reaction zone for other catalyst designs under this condition of sulphur poisoning. However, the light off temperatures increased for all catalyst designs and the time for back to front reaction propagation also increased after poisoning. 6.4 Conclusions A 1D mathematical model that describes the transient behaviour associated with a DOC was used to describe CO conversion performance after sulphur poisoning for five catalyst designs that vary with respect to the distribution of precious metal down the length of the catalyst. A sulphur accumulation model was included in order to describe sulphur adsorption/desorption along the length of the modeled catalyst. The model predicts that the sulphur accumulates near the catalyst inlet and then decreases toward the outlet. With sulphur exposure, catalyst activity is reduced in the upstream portion, an area that plays an important role in overall DOC performance. Although the back-loaded designs (Case 3 and 5) show the best light-off temperature relative to the other cases, these designs also result in the worst steady state 111
126 conversion performance. However, Case 3 has better light-off conversion than Case 5 since Case 3 is less affected by S exposure. When the catalysts operate at higher temperatures (> 573 K), the catalysts are more active due to less S accumulation. Case 4 is considered to be the best catalyst design in terms of maintaining a high overall conversion, and Case 3 is considered to be good catalyst design in terms of low light-off temperature and therefore the minimum cold start emissions if sulphur poisoning takes place. 112
127 Chapter 7: Aging behavior of the five distributed precious metal catalyst designs 7.1 Overview A primary deactivation mode in automotive exhaust catalysis is thermal degradation. Exposure to high temperatures sinters the precious metals, causing a loss in active surface area. The sintering of precious metals is significant above 600 C [63, 79]. In terms of degradation, significant differences have been found in catalytic activity as a function of monolith axial position. For thermal degradation, the downstream section of the catalytic converter exhibits the greatest damage because of the adiabatic nature of these systems and the exotherms generated during reaction [68]. Distributing the active sites non-uniformly is of interest as a means of improving the overall performance of the catalyst. Modeling results for gasoline engine exhaust systems show that gradients in precious metals could affect the catalyst performance [10-15]. However, there are no studies investigating the loss of catalyst performance of non-uniformly distributed catalysts. The target of this part of the research was to use the 1-D mathematical model to understand the DOC performance as a function of catalyst distribution for a variety of distributed precious metal designs under conditions that include thermal aging. The model simulates thermal aging as a function of temperature and time and the effect of the loss of catalyst activity on the conversion performance of these catalyst designs with respect to CO oxidation. 113
128 7.2 Sintering Precious metal sintering model: The kinetics of sintering are a function of temperature, time, pressure and environmental conditions for a given catalyst. The following simple correlation has been applied by a number of researchers to describe catalyst sintering [69, 70]: d ( D / D ) n dt o = k ( D / D ) (7.1) s o where k s is the sintering rate constant, D is the metal dispersion or metal surface area, D o is the initial metal dispersion, and n is the sintering order. In this study, a second order correlation was used to describe the aging conditions in the developed catalyst designs. This correlation was obtained in a previous literature study of a 5% Pt/Al 2 O 3 sample. The activation energy was 97 kj/mol and the pre-exponential factor was 238 s -1 for the sintering rate constant [102]. To simulate catalyst aging, a second order sintering model combined with the CO oxidation reaction model was used. The simulation included aging the Pt-Pd/Al 2 O 3 sample through exposure to 20 cycles of temperature ramps in series. Each cycle had a gas flow rate of L/min (equivalent to a space velocity of 100,000 hr -1 ). The feed gas contained 5000 ppm C 3 H 6, 10% oxygen, and a balance of N 2. During each cycle, the inlet gas temperature was increased from ambient temperature to 550 K at a 30 K/min ramp rate. The temperature difference across the catalyst was approximately 250 K due to the heat generated by the exothermic oxidation reaction of the 5000 ppm C 3 H 6. The dispersion of Pt-Pd over alumina was calculated by predicting the normalized dispersion as a function of the axial length after each aging cycle. The CO oxidation conversion performance of the aged catalyst after a given cycle was also evaluated by simulating the mole and energy balances in the gas and solid phases, Equations (3.1), (3.2), 114
129 115 (3.3) and (3.4), listed in Chapter 3. However, the catalytic activity decreases with each cycle, which is modeled by multiplying the reaction rate with sintering rate (Equation (7.1)). The final value of the precious metal dispersion at the end of the cycle is the initial value for the later cycle. The corresponding model equations in the solid phase are, ) / ( 1 ) ( ) (1 ), ( 0 1 t T j J j j k s s k k g s c s k D D R v y y a k t y = + = ε ε ε k = CO, O 2, CO 2, N 2 (7.2) = + = J j t T j j r s g h s s s s p s D D R H T T a k z T t T c 1 ), ( 0, 2 2 ) / ( ) ( 1 ε λ ρ (7.3) 7.3 Results and Discussions Precious metal dispersion Thermal aging was simulated with aging conditions listing in Table 7-1 for each cycle. Twenty cycles were run in series. For each cycle, the inlet gas temperature was ramped at 30 K/min from ambient temperature to 550 K and then the inlet temperature was held constant for 6.6 minutes, with the total simulation time of 15 minutes. A cycle of 15 minutes was chosen so that a complete combustion of 5000 ppm C 3 H 6 can occur under the operating temperature of 30 K/min to generate a high exotherm. Table 7-1: Simulation conditions used for aging cycle. Heating rate 30 K/min Final temperature 550 K Flow rate L/min Precious metal loading 8 g/ft 3 Inlet concentration 5000 ppm C 3 H 6, 10 % O 2
130 With the reactor being modeled as adiabatic, the exothermic reaction increased the temperature at the back of the catalyst to 800 K. A greater degree of sintering occurred at this section, while the catalyst front had the least damage. The temperature profile along the catalyst length at the end of the 15 minutes is shown in Figure 7-1. The normalized dispersion (the ratio of the precious metal at any position to the initial value) as a function of the axial length for every five cycles of aging is shown in Figure 7-1 as well. The sintering rate increases exponentially with temperature. The precious metal particles sinter rapidly in the first ten cycles, then sintering becomes less sensitive to temperature. This effect corresponds to the limiting dispersion that is usually observed after a long period of sintering. Extending the aging time at high temperature results in further activity loss, due to the loss in precious metal dispersion, but at a slower rate relative to the initial effects. 116
131 Normalized dispersion T profile/cycle Axial length [cm] Bulk temperature [K] Cycle 5 Cycle 10 Cycle 15 Cycle 20 T Figure 7-1: Normalized surface area as a function of axial length during sintering of Pt-Pd/Al 2 O 3 and temperature profile per cycle Thermal aging effect on the five case scenarios The precious metal distributions as a function of the position of the catalyst length before and after the 20-cycle thermal aging simulation, for the 5 case designs discussed above, are shown in Figure 7-2. The damage at the back of the catalyst is more significant than that at the front for all designs. For all designs, the integral amounts of precious metal are the same for the fresh catalyst cases. With aging, the differences in the amounts of the precious metal do not change, but their dispersion does, resulting in less catalytic surface area. Table 7-2 shows the percentage of exposed precious metal remaining after each five cycles of thermal aging. In Case 1, the uniformly distributed catalyst, significant loss in dispersion occurs at the back of the catalyst. The amounts of exposed precious metal are clearly higher for Cases 2 and 5. Both designs 117
132 involve a front-loaded catalyst and are thus less sensitive to the thermal aging process simulated here. The damage in Cases 3 and 4 are more severe, and the amounts of exposed precious metal (active sites) remaining are extremely small: 18% and 19% for Case 3 and Case 4, respectively. 6E+14 5E+14 Case 1 6E+14 5E+14 Case 2 Fresh catalyst Pt distribution 4E+14 3E+14 2E+14 1E+14 Pt distribution 4E+14 3E+14 2E+14 1E+14 Aged catalyst Axial length [cm] Axial length [cm] 6E+14 5E+14 Case 3 6E+14 5E+14 Case 4 Pt distribution 4E+14 3E+14 2E+14 1E+14 Pt distribution 4E+14 3E+14 2E+14 1E Axial length [cm] Axial length [cm] 6E+14 5E+14 Case 5 Pt distribution 4E+14 3E+14 2E+14 1E Axial length [cm] Figure 7-2: Five case scenarios showing the axial catalyst distribution along the monolith (fresh versus aged precious metal after 20 cycles of aging). 118
133 Table 7-2: Percentage of exposed precious metal remaining after each five cycles of thermal aging. Aging Case 1 Case 2 Case 3 Case 4 Case 5 Cycles 5 69% 73% 66% 65% 74% 10 49% 55% 43% 43% 55% 15 35% 42% 28% 29% 42% 20 26% 34% 18% 19% 33% CO oxidation performance before and after aging Simulations were run for both fresh and thermally aged catalysts. The outlet CO conversions as a function of time were compared with the results shown in Figure 7-3. The conditions used for simulations are shown in Table 7-3. The data were obtained from the catalyst outlet after each five cycles of aging. Table 7-3: Simulation conditions of CO conversion for fresh and aged catalysts. Heating rate 30 K/min Final temperature 550 K Flow rate L/min Precious metal loading 8 g/ft 3 Inlet concentration 800 ppm CO, 10 % O 2 For Case 1 with fresh catalyst, light-off conversion is reached at 4.7 minutes, or an inlet temperature of 439 K, and then conversion increases with the time to reach 100 % conversion at 4.9 minutes, or 445 K. With thermal aging, light-off conversion takes a longer time to reach for each subsequent aging cycle due to the increasing loss in catalytic activity associated with the increasing loss in exposed active sites. Prior to light off, some heat was generated via the 119
134 exotherm generated from the small amount of CO converted. This heat is carried downstream, leading to more CO oxidation, which is accelerated by the decreasing amount of CO and thus self poisoning. With enough heat and less CO, light-off at the outlet occurs. With thermal aging, the CO oxidation reaction light-off condition therefore requires a higher temperature (longer time) in order to overcome the lower level of the reaction downstream as well s higher CO poisoning due to the smaller amount of exposed metal relative to the CO, so that light-off conversion after 20 aging cycles occurs at 5.4 minutes (457.5 K) for Case 1. However, an almost consistent delay time is evident in the overall conversion profiles for every five-cycle interval. After the first five aging cycles, T50 (5) increased by 5 K. In other words, the drop in catalyst activity at the back of the catalyst due to the loss in precious metal dispersion, of 31%, after the first five aging cycles requires a higher temperature, of 5 K, to initiate the light-off conversion. In comparing the T50 difference profiles between each five cycles, it is found that the T50 (10),T50 (15) and T50 (20) increased by 4, 4 and 3.5 K, respectively. This indicates that under these conditions the limiting dispersion was not approached. For Case 2 with fresh catalyst, light-off conversion is achieved at 4.7 minutes (438 K), and 100 % conversion is reached more quickly than with Case 1. When the conversion profiles for each five-cycle interval are compared, it is apparent that the increase in time (or inlet temperature) before light-off increases up to 10 cycles, and after, although they still increase, the changes are not as significant. In other words, after 10 cycles, the Case 2 design becomes less sensitive to thermal aging. Case 2 also proves better overall performance relative to Case 1, with light off after 20 aging cycles occurring earlier, or at lower inlet temperature. Prior to light off, the higher 120
135 level of catalyst upstream (double the value compared to Case 1 at the very inlet) results in more CO conversion and heat generated. Furthermore, in this catalyst design less number of active sites are distributed downstream which means less catalyst activity was lost at the back of the catalyst when compared to the uniform distribution. Case 2 is therefore considered a good catalyst design under these conditions of thermal aging, because the drop in catalyst activity is less affected by aging compared with Case 1. For Cases 3 and 4 with aging, the loss in catalyst activity continually increased with thermal aging cycle number for both cases, indicating there that the dispersion lower limit was not approached under these conditions. The T50 difference profiles between each five cycles for Case 3; T50 (5),T50 (10), T50 (15) and T50 (20) increased by 4.5, 7, 7 and 6 K, respectively. It is noted that the increase in light-off temperature after the first five cycles is lower compared with subsequent aging cycles. This is unusual aging behavior, as normally the most significant aging is observed at first, with subsequent aging being less severe. This suggests that there was still sufficient catalyst activity after the first aging cycle set so that the T50 change was not significant, but then more critical loss was suffered during the 2 nd set. Therefore, although the back of the catalyst was affected, the remaining catalyst amount in the outlet section was still sufficient to catalyze the reaction until the 2 nd set of aging, wherein there was too much catalyst lost, resulting in the small amounts of metal in the middle and front sections not being effective enough. 121
136 Also, it is found that no significant differences in light-off temperatures were observed between the five cases after the first five cycles. This is because there is still enough precious metal dispersion in all cases, even with the various axial precious metal distributions. Case 4 shows almost similar trends in light-off temperature delay between each five cycles. Cases 3 and 4 show the worst level of CO conversion with respect to time for each cycle. Both designs have lower levels of active sites at the catalyst front. Case 3 has most of the precious metal at the outlet region, which suffers the most thermal degradation. Case 4, the triangle distribution, also has little at the front, but also little at the back. However, the damage in the middle is still more extensive than that at the inlet, resulting in this design also proving poorer relative to Case 2. Overall, prior to light off, the catalyst front reacted less CO, since there is less precious metal, leading to a smaller amount of heat transferred to the aged back, where there is poorer catalyst activity due to the thermal aging damage. In Case 5 with fresh catalyst, as described earlier, the reaction moves with a back-to-front wave propagation, with the high catalyst density at the catalyst outlet responsible for the earlier lightoff and the higher catalyst density in the upstream allowing high conversions to be reached relatively rapidly, as with Case 2. With aging, the earlier light-off behaviour is no longer evident due to the loss of active site density in the back of the catalyst. As well, the inflection in conversion after light-off is no longer observed. After aging, the downstream activity is significantly decreased, thus the remaining activity is not enough to induce significant reaction extents, making light-off occur upstream. Case 5 is then similar to Case 2 and is less sensitive to 122
137 thermal aging, especially after the first 10 cycles as both have almost similar dispersion after aging. Outlet CO conversion Case 1 Fresh catalyst 5 cycles 10 cycles 15 cycles 20 cycles Inlet T Inlet Temperature Outlet CO conversion Case Inlet Temperature Time min Time min Outlet CO conversion Case Inlet Temperature Outlet CO conversion Case Inlet Temperature Time min Time min Outlet CO conversion Case Inlet Temperature Time min Figure 7-3: CO conversion at the catalyst outlet as a function of time for the five case scenarios of axial catalyst distribution before and after aging. 123
138 To further analyze the effects of aging on these catalyst designs, the times required to reach 50% and 90% conversions along the monolith for the five catalyst designs before and after aging (20 cycles) were compared and are shown in Figure 7-4. For the Case 1 design, the time to reach 50% conversion increases with length for the fresh catalyst, as shown in Figure 7-4a, since the reaction propagates from back to front. Light-off conversion begins at 2.5 cm/4.3 minutes and the reaction zone moves toward the inlet. With aging, more significant damage at the back of the catalyst occurs, leading to an increase in the time required to reach light-off conversion. At this point, light-off conversion is predicted to be at 5.4 minutes, and also occurs deeper into the catalyst when compared to the unaged catalyst. During the warm-up period, the aged part at the back of the catalyst is inactive and the heat conducted from any upstream oxidation and due to the inlet portion being initially warmer contributes less to oxidation. However, once the temperature is high enough to reach light-off conditions, the reaction wave moves much more rapidly along the monolith toward the inlet than it does in the fresh catalyst. This is because the inlet temperature is now higher, which means the remaining exposed sites are more active, and with more at the front, the reaction will propagate faster. Data were also compared for catalyst performance after light-off: with 90% chosen as a measure and the data are shown in Figure 7-4b. Similar trends, relative to 50% conversion, are observed. The time required for 90% conversion is higher after aging, and once the catalyst reaches the required temperature for 90% conversion, the conversion travels more rapidly from back to front than was observed with the fresh catalyst. Unlike the 50% conversion behaviour, the reaction 124
139 zone location for 90% conversion is wider and shifted more toward the catalyst downstream in the fresh catalyst than in the aged one, due to the lower level of catalyst activity at the back of the catalyst after aging. Of course, higher temperature is required to achieve higher conversion (90%). a Time to 50% conversion Case 1 Case 2 Case 3 Case 4 Case 5 b Time to 90% conversion Axial length [cm] Figure 7-4: Time to a) 50% and b) 90% CO conversions as a function of axial position for the five case scenarios of axial catalyst distribution before and after aging. Unaged/Fresh catalyst: solid line, Aged catalyst: dashed line. For Case 2, prior to aging light-off starts at 2.3 cm from the inlet, this is closer to the inlet than the other designs. As the reaction moves from back to front through the catalyst with time, the 125
140 active site density increases, resulting in the reaction propagating upstream. Once light off occurs, a faster propagation time is observed compared with the other designs, due to the increasing catalyst density. With aging, light-off moves toward the outlet and occurs at an earlier time (5.1 minutes) relative to the other designs. In this case, the larger amount of precious metal at the front of the catalyst, where less dispersion loss occurs, results in more CO conversion along the front section, leading to less CO poisoning downstream and more heat generated via the oxidation reaction to be carried downstream. Once light-off occurs, the conversion travels more quickly from back to front because the active site density is high toward the inlet. For Case 2, 90% conversion is first observed at 2.5 cm with the fresh catalyst, and after steady state is reached, it is achieved by 1.5 cm. However, with the aged catalyst, although 50% conversion was reached deeper in the catalyst, 90% conversion was not. In other words, although significant levels of oxidation were occurring in the outlet portion, there was not enough activity to reach high conversion. However, once the reaction wave reaches the front, high conversions can be achieved, but this results in the 90% conversion appearing at 1.5 cm (at one position of reaction zone along the catalyst), as highlighted by the dot sign. Carbon monoxide conversions and bulk gas temperatures as a function of axial length are shown in Figure 7-5, and the results demonstrate that 50% conversion and below are attained at the back of the catalyst. With time, the reaction propagation moves very quickly form back to front, where there is higher catalyst activity and therefore higher conversion. 126
141 a CO conversion [%] Axial length [cm] b Bulk Temperature [K] Axial length [cm] 5 min min min min 5.1 min min Figure 7-5: CO conversion and bulk gas temperature as a function of axial length for Case 2 (Front loaded catalyst) after aging. As a reminder, for Case 3 prior to aging, light-off is achieved at a lower temperature (or earlier) and begins more toward the back of the catalyst when compared to cases 1 and 2. This was previously related to the higher density of catalyst at the outlet. However, more time is required to attain the same conversions at upstream positions due to the decreasing active site density. And since most of the precious metal is distributed downstream, which is where the largest impact of 127
142 thermal degradation is realized, after aging, Case 3 takes longer to reach the 50% light-off conversion than do the other designs. A similar trend is observed for the 90% conversion. A minimum level of the catalyst activity at the upstream is required to generate enough heat from reaction to achieve high conversions. The Case 4 design prior to aging results in light-off conversion at 2.5 cm/4.7 minutes. The propagation slows as it approaches the inlet due to the smaller number of active sites at the inlet relative to the middle. The same trend is observed for 90% conversion, which starts at 4.7 minutes, with the only difference being that this conversion is reached initially at the extreme back of the catalyst. The highest active site density is in the middle portion, which has the effect of shifting the zone where high conversions are achieved more toward the outlet. In general, this design is midway between Case 2 and Case 3 because the active site density is highest in the middle part of the catalyst. With aging, this design results in a longer time for the initiation of light-off due to the low level of catalyst activity at the outlet region, as in Case 3, but better light off performance (faster) is observed as the reaction propagates from back to front. The loss in the catalyst activity in the middle for Case 4 is less than Case 3 (Figure 7-2). Also, more time is required in order to attain 90% conversion at the front of the catalyst for the same reason. For Case 5 prior to aging, the 50 and 90% conversions are achieved at the back of the catalyst, due to the high catalyst density at the back. The reaction propagation then moves slowly toward the middle of the catalyst due to the decreasing catalyst density. Past the middle, the reaction moves more rapidly toward the inlet due to the increasing amount of active sites, and ends up being similar to Case 2. With aging, both conversions are initially achieved more toward the 128
143 inlet; 50 and 90% conversions are reached by 0.5 and 1.5 cm. The back-to-front propagation of the reaction from the outlet of the monolith does not occur due to the insufficient amount of the active zone in the middle and the back portions of the catalyst after aging. Outlet CO conversion [%] Fresh 70 Aged Inlet Temperature [K] Case 1 Case 2 Case 3 Case 4 Case 5 Figure 7-6: CO conversion at the catalyst outlet as a function of bulk temperature for the five case scenarios of axial catalyst distribution before and after 20 cycles of aging. The outlet CO conversions as a function of the bulk temperature for both the aged and unaged catalysts are shown in Figure 7-6. These data are in agreement with the CO conversion data displayed in Figures 7-3 and 7-4. Both were evaluated under identical conditions. The five designs of precious metal distribution before aging, within specified operating conditions, differ slightly with respect to light-off conversion. After thermal aging and then evaluated under the same conditions the differences are more significant. As stated earlier, the remaining activity in Case 2 and Case 5 are the highest and therefore both cases result in the best performance, followed by Case 1. Case 3 has the worst light-off performance as well as steady state 129
144 performance due to the smaller number of active sites in the upstream in this catalyst design. Case 4 shows better steady state conversion relative to Case 3. Table 7-4 lists the T50 values for the aged and unaged catalysts for each design. The worst performances are achieved with the Case 3 and 4 designs. Under conditions of thermal aging, the preferable catalyst design is one with more active sites upstream. Table 7-4: Light-off temperatures for the five designs of axial catalyst distribution before and after aging. Catalyst Design Unaged Aged Case K K Case K K Case K 462 K Case K K Case K 451 K 7.4 Conclusions A 1D mathematical model that describes the transient behavior associated with a DOC was used to describe CO conversion performance after thermal aging for five catalyst designs that vary with respect to the distribution of precious metal down the length of the catalyst. A second order sintering model was used with the transient CO oxidation model in order to evaluate the performance of the DOC after thermal aging. The precious metal dispersion profile shows that the catalyst outlet was more significantly damaged compared to the inlet. For all five catalyst designs, the outlet CO conversions as a function of temperature were compared before and after aging. In all cases, in the aged scenarios, the light-off conversions occurred at higher 130
145 temperatures due to decreased exposed active site content in the back portion of the catalyst after aging. The front-loaded designs were the least affected by thermal aging. 131
146 Chapter 8: Conclusions and future work. 8.1 Conclusions In this thesis, the transient behavior of a monolith-supported DOC (diesel oxidation catalyst), as used in after-treatment systems of diesel vehicles, has been studied. A one-dimensional, nonsteady state model that accounts for physical and chemical processes occurring within the channels of a monolithic converter was used to simulate the oxidation reactions of CO, C 3 H 6, and NO. Five axial catalyst distributions of Pt-Pd/Al 2 O 3 catalyst were chosen for comparison to explain the reasons for improved or decreased performance as a function of catalyst distribution, each with a different axial precious metal distribution down the length, while maintaining equivalent totals of precious metal. This performance was evaluated under both fresh and deactivated catalytic activity. Two categories of catalytic activity loss have been considered: sintering and sulphur poisoning. The marked features of this work are as follows: 1. Global oxidation reaction kinetics were developed for CO, C 3 H 6, and NO over a Pt-Pd/Al 2 O 3 DOC. A simplified isothermal 1-dimensional model associated with an optimization routine was used to estimate the rate parameters of the kinetic expressions based on the data obtained over Pt-Pd/Al 2 O 3. This rate model was used to predict the oxidation reaction performance under variety of axial catalyst distributions of precious metal. 2. For CO oxidation performance, flow rates, temperature ramp rates, total precious metal loading, and CO inlet values were compared. Under specific conditions where measurable differences were observed, a higher precious metal loading at the outlet portion led to earlier 132
147 light off, but ultimately higher cumulative CO emitted, whereas a front-loaded catalyst led to the lowest cumulative CO emitted. These results prove that precious metal distribution can impact CO oxidation, but under relatively specific conditions, and can also be used to guide catalyst design to optimize a system for distinct drive cycle applications. 3. The impact of the exotherm was more apparent for the mixture of the three reactants, CO, C 3 H 6 and NO oxidation. It was found that a middle-loaded catalyst proved the best in CO and C 3 H 6 conversion performance with the reasoning correlated to the significance of the exotherm. This did not hold for NO conversion, which requires the whole catalyst length. Also a back-loaded catalyst led to faster light-off conversion as was observed with just CO oxidation. 4. A 1-D mathematical model was developed which can describe the sulphur accumulation profile along the monolith length for a variety of distributed precious metal designs. The catalyst activity loss due to sulphur poisoning was predicted as a function of exposure time to the poison. The effect of the loss of catalyst activity on the conversion performance of these catalyst designs with respect to CO oxidation was evaluated. The results demonstrate that the sulphur accumulates near the catalyst inlet and then decreases toward the outlet. As a consequence, the catalysts experienced the highest damage in the catalyst upstream and the reaction zone was shifted further toward downstream. A back-loaded catalyst showed the best light-off temperature relative to the other cases, but also still results in the worst steady state conversion performance. A middle loaded catalyst was considered to be the best catalyst design in terms of maintaining a high overall conversion if sulphur poisoning takes place. 133
148 5. A second order sintering model integrated with the CO oxidation reaction model was used to describe the catalyst activity loss of distributed precious metal designs after thermal aging. The simulation included aging the Pt-Pd/Al 2 O 3 sample through exposure to 20 cycles of temperature ramps in series. The normalized dispersion as a function of the axial length over Pt-Pd/Al 2 O 3 was calculated after each aging cycle. The results show that the catalyst outlet had more significant damage compared to the inlet. The performance of the catalyst designs with respect to CO oxidation was evaluated after the catalyst activity loss. Under conditions of thermal aging, the front-loaded designs were the preferable catalyst design. 8.2 Recommendations for future work The work presented here can be extended in the following directions. First, the reaction between C 3 H 6 and NO 2 can be added since NO 2 acts as an oxidant in the reaction with C 3 H 6. One of the main functions of the DOC is to provide NO 2 through NO oxidation, since NO 2 is a key intermediate or reactant for efficient performance of downstream LNT, SCR and DPF technologies. However, C 3 H 6 reduces NO 2 outlet levels. The axial precious metal distribution designs could be used for evaluating the best design that increase the NO 2 output. Second, the global kinetic expressions used here can be replaced with more detailed microkinetic models to account for finite rates of adsorption, desorption, and interactions at the catalytic site level. Third, more complex washcoat structures where the precious metal loading varies with the washcoat depth can be modeled to study the effect of radial gradients in concentration and 134
149 temperature on conversion performance. Fourth, the model can be used to analyze the effects of various precious metal distributions on cooling performance of the monolith to maintain high catalyst activity and good heat conductivity under conditions where the catalyst temperature decreases, as when the vehicle slows or stops/idles. Fifth, parametric sensitivity analysis can be conducted to improve the catalyst performance by changing washcoat thickness, BET surface area, monolith wall thickness, total monolith volume or monolith length. Sixth, sulphur penetration profiles across the washcoat depth can be described and the conversion performance after its exposure to the poison can be evaluated. 135
150 Appendix A 1D-mathematical model used to solve DOC channel (m-file): function G = Monolith1Dmodel % COMSOL Multiphysics Model M-file % Generated by COMSOL 3.5a (COMSOL , $Date: 2008/12/03 17:02:19 $) flclear fem tic % COMSOL version clear vrsn vrsn.name = 'COMSOL 3.5'; vrsn.ext = 'a'; vrsn.major = 0; vrsn.build = 603; vrsn.rcs = '$Name: $'; vrsn.date = '$Date: 2008/12/03 17:02:19 $'; fem.version = vrsn; % Geometry g1=solid1([0,0.036]); %Monolith length % Analyzed geometry clear s s.objs={g1}; s.name={'i1'}; s.tags={'g1'}; fem.draw=struct('s',s); fem.geom=geomcsg(fem); % Initialize mesh fem.mesh=meshinit(fem,'hmax',0.0002); % Step size of the monolith length % Application mode 1 % Mass balance: Gas phase clear appl appl.mode.class = 'FlPDEC'; appl.dim = {'u_co','u_o2','u_co2','u_c3h6','u_h2o','u_no','u_no2','u_n2',... 'u_co_t','u_o2_t','u_co2_t','u_c3h6_t','u_h2o_t','u_no_t','u_no2_t',... 'u_n2_t'}; 136
151 appl.name = 'c_bulk'; appl.gporder = 4; appl.cporder = 2; appl.assignsuffix = '_c_bulk'; clear bnd bnd.r = {0,{'CO_in';'O2_in';'CO2_in';'C3H6_in';'H2O_in';'NO_in';'NO2_in';... 'N2_in'}}; bnd.type = {'neu','dir'}; bnd.ind = [2,1]; appl.bnd = bnd; clear equ equ.f = {{'kc_co*sg*((us_co*(us_co>0))- (u_co*(u_co>0)))';'kc_o2*sg*((us_o2*(us_o2>0))-(u_o2*(u_o2>0)))';... 'kc_co2*sg*((us_co2*(us_co2>0))- (u_co2*(u_co2>0)))';'kc_c3h6*sg*((us_c3h6*(us_c3h6>0))-(u_c3h6*(u_c3h6>0)))';... 'kc_h2o*sg*((us_h2o*(us_h2o>0))- (u_h2o*(u_h2o>0)))';'kc_no*sg*((us_no*(us_no>0))-(u_no*(u_no>0)))';... 'kc_no2*sg*((us_no2*(us_no2>0))- (u_no2*(u_no2>0)))';'kc_n2*sg*((us_n2*(us_n2>0))-(u_n2*(u_n2>0)))'}}; equ.c = 0; equ.be = 'v'; equ.ind = [1]; appl.equ = equ; fem.appl{1} = appl; % Application mode 2 % Mass balance: Solid phase clear appl appl.mode.class = 'FlPDEC'; appl.dim = {'us_co','us_o2','us_co2','us_c3h6','us_h2o','us_no','us_no2',... 'us_n2','us_co_t','us_o2_t','us_co2_t','us_c3h6_t','us_h2o_t','us_no_t',... 'us_no2_t','us_n2_t'}; appl.name = 'c_washcoat'; appl.gporder = 4; appl.cporder = 2; appl.sshape = 2; appl.assignsuffix = '_c_washcoat'; clear prop clear weakconstr weakconstr.value = 'off'; weakconstr.dim = {'lm17','lm18','lm19','lm20','lm21','lm22','lm23','lm24',... 'lm25','lm26','lm27','lm28','lm29','lm30','lm31','lm32'}; prop.weakconstr = weakconstr; appl.prop = prop; clear bnd bnd.type = {'dir','neu'}; bnd.ind = [1,2]; appl.bnd = bnd; 137
152 clear equ equ.f = {{'(kc_co*ss*((u_co*(u_co>0))-(us_co*(us_co>0)))- r1)/e_s';'(kc_o2*ss*((u_o2*(u_o2>0))-(us_o2*(us_o2>0)))-0.5*r1-4.5*r2-0.5*r3)/e_s';... '(kc_co2*ss*((u_co2*(u_co2>0))- (us_co2*(us_co2>0)))+r1+3*r2)/e_s';'(kc_c3h6*ss*((u_c3h6*(u_c3h6>0))- (us_c3h6*(us_c3h6>0)))-r2)/e_s';... '(kc_h2o*ss*((u_h2o*(u_h2o>0))- (us_h2o*(us_h2o>0)))+3*r2)/e_s';'(kc_no*ss*((u_no*(u_no>0))- (us_no*(us_no>0)))-r3)/e_s';... '(kc_no2*ss*((u_no2*(u_no2>0))- (us_no2*(us_no2>0)))+r3)/e_s';'(kc_n2*ss*((u_n2*(u_n2>0))- (us_n2*(us_n2>0))))/e_s'}}; equ.c = 0; equ.ind = [1]; appl.equ = equ; fem.appl{2} = appl; % Application mode 3 % Energy Balance: Gas phase clear appl appl.mode.class = 'FlPDEC'; appl.dim = {'u_t','u_t_t'}; appl.name = 'c_bulktemp'; appl.sshape = 2; appl.assignsuffix = '_c_bulktemp'; clear prop clear weakconstr weakconstr.value = 'off'; weakconstr.dim = {'lm33','lm34'}; prop.weakconstr = weakconstr; appl.prop = prop; clear bnd bnd.r = {0,'TQ'}; %here bnd.type = {'neu','dir'}; bnd.ind = [2,1]; appl.bnd = bnd; clear equ equ.f = 'kh*sg*((u_ts*(u_ts>0))-(u_t*(u_t>0)))'; equ.da = 'p*cp'; equ.c = 0; equ.init = {{'T_init';0}}; equ.be = 'v*p*cp'; equ.ind = [1]; appl.equ = equ; fem.appl{3} = appl; 138
153 % Application mode 4 % Energy Balance: Solid phase clear appl appl.mode.class = 'FlPDEC'; appl.dim = {'u_ts','u_ts_t'}; appl.name = 'c_washcoattemp'; appl.sshape = 2; appl.assignsuffix = '_c_washcoattemp'; clear prop clear weakconstr weakconstr.value = 'off'; weakconstr.dim = {'lm35','lm36'}; prop.weakconstr = weakconstr; appl.prop = prop; clear bnd bnd.type = 'neu'; bnd.ind = [1,1]; appl.bnd = bnd; clear equ equ.f = '(kh*ss*((u_t*(u_t>0))-(u_ts*(u_ts>0))))-(delta_h1*r1)-(delta_h2*r2)- (delta_h3*r3)'; equ.da = 'ps*cps'; equ.c = 'lenda'; equ.init = {{'Ts_init';0}}; equ.ind = [1]; appl.equ = equ; fem.appl{4} = appl; fem.frame = {'ref'}; fem.border = 1; clear units; units.basesystem = 'SI'; fem.units = units; % Constants fem.const = {'Rg','8.314',... % Gas constant 'Sg','(2* )/(.00056^2)',... % gas interfacial area per unit reactor volume 'Ss','(2* )/(.0006^ ^2)',... % washcoat interfacial area per unit reactor volume 'e_s','0.65',... % Washcoat porosity 'p','0.8',... % Gas phase density 'ps','1501',... % Solid phase density 'lenda','1.675'}; % Effective axial heat conductivity time=0; % Global expressions fem.globalexpr = {'CO_in','(0.0008*101325*(flc2hs(t- 0.01,0.01)))/(8.314*T_in)',... % CO inlet mol/m^3 139
154 'O2_in','(0.1*101325*(flc2hs(t-0.01,0.01)))/(8.314*T_in)',... % O2 inlet 'CO2_in','0',... % CO2 inlet 'C3H6_in','(0.0008*101325*(flc2hs(t-0.01,0.01)))/(8.314*T_in)',... % C3H6 inlet 'H2O_in','0',... % H2O inlet 'NO_in','(0.0002*101325*(flc2hs(t-0.01,0.01)))/(8.314*T_in)',... % NO inlet 'NO2_in','0',... % NO2 inlet 'N2_in','(0.7978*101325*(flc2hs(t-0.01,0.01)))/(8.314*T_in)',... % N2 inlet 'v','(19.06/(1000*60*203))/(.00056^2*3.14)',... % velocity 'F','(T_in*10^6*8.314)/(101325)',... % Fraction to convert PPM to mol/m^3 'T_in','TQ',... % T x=0 'T_init','298',... % t=0 'Ts_init','298',... % t=0 'r1','a1*k1*((us_co*(us_co>0))*(us_o2*(us_o2>0)))/g',... % CO reaction rate 'r2','a2*k2*((us_c3h6*(us_c3h6>0))*(us_o2*(us_o2>0)))/g',... % C3H6 reaction rate 'r3','((k3*(us_no.*(us_no>0))*(us_o2.*(us_o2>0))^0.5)- ((us_no2.*(us_no2>0))*k3/keq))/g',... % NO reaction rate 'k1','a1*exp(-86700/rg/(u_ts*(u_ts>0)))*(flc2hs(t-0.01,0.01))',... 'k2','a2*exp( /rg/(u_ts*(u_ts>0)))*(flc2hs(t-0.01,0.01))',... 'k3','a3*exp(-41716/rg/(u_ts*(u_ts>0)))*(flc2hs(t-0.01,0.01))',... 'A1','2.9*10^14',... 'A2','1.167*10^16',... 'A3','4.695*10^6',... 'G',' ((1+K1*(us_CO.*(us_CO>0))+K2*(us_C3H6.*(us_C3H6>0)))^2)*(1+K3*((us_CO.*(us_CO >0))^2)*((us_C3H6.*(us_C3H6>0))^2))*(1+K4*((us_NO.*(us_NO>0))^0.7)) ',... % Inhibition term 'K1','65.6*exp(961/u_Ts)',... 'K2','2080*exp(361/u_Ts)',... 'K3','(4.79*10^5)*exp(-3733/u_Ts)',... 'Cp',' (0.2182*u_T)',... % Gas-phase heat capacity J/(kg K) 'Cps','1071+(0.156*u_Ts)-(3.435*10^7*u_Ts^-2)',... % Washcoat heat capacity J/(kg K) 'dg','( *u_ts*(u_ts>0)) ',... 'Keq','exp(-dG/8.314/(u_Ts*(u_Ts>0)))*((Rg*u_Ts/100000)^0.5)',... % NO to NO2 equilibrium 140
155 'delta_h1','-( cp*((u_t*(u_t>0))-298))'... % CO heat enthalpy 'delta_h2','-( cp*((u_t*(u_t>0))-298))'... % C3H6 heat enthalpy 'delta_h3','-(56570+cp*((u_t*(u_t>0))-298))'... % NO heat enthalpy 'D_CO','( /10000)*(u_T)^1.75',... % Binary diffusivity 'kc_co','(3*d_co)/ '... % Mass transfer coefficient 'D_CO2','( /10000)*(u_T)^1.75',... 'kc_co2','(3*d_co)/ '... 'D_O2','( /10000)*(u_T)^1.75',... 'kc_o2','(3*d_co)/ '... 'D_C3H6','( /10000)*(u_T)^1.75',... 'kc_c3h6','(3*d_co)/ '... 'D_H2O','( /10000)*(u_T)^1.75',... 'kc_h2o','(3*d_co)/ '... 'D_NO','( /10000)*(u_T)^1.75',... 'kc_no','(3*d_no)/ '... 'D_NO2','( /10000)*(u_T)^1.75',... 'kc_no2','(3*d_no)/ '... 'D_N2','( /10000)*(u_T)^1.75',... 'kc_n2','(3*d_no)/ '... 'lendas','2.260*10^-4*u_t^0.832',... 'kh','( *lendas)/ ',... % heat transfer coefficient 'TQ','(298+(0.5*t))*(t<=804)+700*(t>804)'}; % ramping rate equation: T increased from 298K to 700K at 30K/min % Different ramping rate functions: %((298+(5*t/60))*(t<=4824)+700*(t>4824)) %(298+(0.5*t))*(t<=804)+700*(t>804) 5C/MIN. 700K 30C/MIN. 700K % Case 1 distribution for corresponding reactive species, CO, C3H6 and NO: %A1= 2.9*10^14 %A2= 1.167*10^16 %A3= 4.695*10^6 % Case 2 distribution: %A1=((-5.8*10^14/0.036)*x)+5.8*10^14 %A2=((-2.334*10^16/0.036)*x)+2.334*10^16 %A=3((-9.39*10^6/0.036)*x)+9.39*10^6 % Case 3 distribution: %A1=((5.8*10^14/0.036)*x) 141
156 %A2=((2.334*10^16/0.036)*x) %A3=((9.39*10^6/0.036)*x) % Case 4 distribution: Triangle shape: %A1=((5.8*10^14/0.018)*x)*(x<=0.018)+(((-5.8*10^14)/0.018)*(x )+(5.8*10^14))*(x>0.018) %A2=((2.334*10^16/0.018)*x)*(x<=0.018)+(((-2.334*10^16)/0.018)*(x )+(2.334*10^16))*(x>0.018) %A3=((9.39*10^6/0.018)*x)*(x<=0.018)+(((-9.39*10^6)/0.018)*(x )+(9.39*10^6))*(x>0.018) % Case 5 distribution: V shape %A1=(((-5.8*10^14)/0.018)*x+(5.8*10^14))*(x<=0.018)+((5.8*10^14/0.018)*(x ))*(x>0.018) %A2=((( *10^16)/0.018)*x+(2.334*10^16))*(x<=0.018)+((2.334*10^16/0.018)*(x ))*(x>0.018) %A3=(((-9.39*10^6)/0.018)*x+(9.39*10^6))*(x<=0.018)+((9.39*10^6/0.018)*(x ))*(x>0.018) % ODE Settings clear ode clear units; units.basesystem = 'SI'; ode.units = units; fem.ode=ode; % Multiphysics fem=multiphysics(fem); % Extend mesh fem.xmesh=meshextend(fem); % Solve problem fem.sol=femtime(fem,... 'solcomp',{'u_o2','u_co2','u_co','u_t','us_co2','u_ts','us_o2','us_co','u_c3h 6','us_C3H6','u_H2O','u_NO','u_NO2','u_N2','us_H2O','us_NO','us_NO2','us_N2'},... 'outcomp',{'u_o2','u_co2','u_co','u_t','us_co2','u_ts','us_o2','us_co','u_c3h 142
157 6','us_C3H6','u_H2O','u_NO','u_NO2','u_N2','us_H2O','us_NO','us_NO2','us_N2'},... 'tlist',[colon(0,1,900)],... 'atol',{'1e-6'},... 'rtol',1e-4,... 'maxorder',2,... 'tout','tlist'); % Save current fem structure for restart purposes fem1=fem; % Plot solution dlmwrite('u_co.txt',[postinterp(fem1,'t',0,'solnum','all')+time postinterp(fem1,'u_co*f',fem1.mesh.p,'solnum','all')], 'delimiter', '\t','precision', '%.6f'); dlmwrite('us_co.txt',[postinterp(fem1,'t',0,'solnum','all')+time postinterp(fem1,'us_co*f',fem1.mesh.p,'solnum','all')], 'delimiter', '\t','precision', '%.6f'); dlmwrite('u_co2.txt',[postinterp(fem1,'t',0,'solnum','all')+time postinterp(fem1,'u_co2',fem1.mesh.p,'solnum','all')], 'delimiter', '\t','precision', '%.6f'); dlmwrite('u_o2.txt',[postinterp(fem1,'t',0,'solnum','all')+time postinterp(fem1,'u_o2',fem1.mesh.p,'solnum','all')], 'delimiter', '\t','precision', '%.6f'); dlmwrite('u_c3h6.txt',[postinterp(fem1,'t',0,'solnum','all')+time postinterp(fem1,'u_c3h6*f',fem1.mesh.p,'solnum','all')], 'delimiter', '\t','precision', '%.6f'); dlmwrite('us_c3h6.txt',[postinterp(fem1,'t',0,'solnum','all')+time postinterp(fem1,'us_c3h6*f',fem1.mesh.p,'solnum','all')], 'delimiter', '\t','precision', '%.6f'); dlmwrite('u_h2o.txt',[postinterp(fem1,'t',0,'solnum','all')+time postinterp(fem1,'u_h2o',fem1.mesh.p,'solnum','all')], 'delimiter', '\t','precision', '%.6f'); dlmwrite('u_no.txt',[postinterp(fem1,'t',0,'solnum','all')+time postinterp(fem1,'u_no*f',fem1.mesh.p,'solnum','all')], 'delimiter', '\t','precision', '%.6f'); dlmwrite('us_no.txt',[postinterp(fem1,'t',0,'solnum','all')+time postinterp(fem1,'us_no*f',fem1.mesh.p,'solnum','all')], 'delimiter', '\t','precision', '%.6f'); dlmwrite('u_no2.txt',[postinterp(fem1,'t',0,'solnum','all')+time postinterp(fem1,'u_no2',fem1.mesh.p,'solnum','all')], 'delimiter', '\t','precision', '%.6f'); dlmwrite('u_n2.txt',[postinterp(fem1,'t',0,'solnum','all')+time postinterp(fem1,'u_n2',fem1.mesh.p,'solnum','all')], 'delimiter', '\t','precision', '%.6f'); dlmwrite('u_t.txt',[postinterp(fem1,'t',0,'solnum','all')+time postinterp(fem1,'u_t',fem1.mesh.p,'solnum','all')], 'delimiter', '\t','precision', '%.6f'); 143
158 dlmwrite('u_ts.txt',[postinterp(fem1,'t',0,'solnum','all')+time postinterp(fem1,'u_ts',fem1.mesh.p,'solnum','all')], 'delimiter', '\t','precision', '%.6f'); dlmwrite('g.txt',[postinterp(fem1,'t',0,'solnum','all')+time postinterp(fem1,'g',fem1.mesh.p,'solnum','all')], 'delimiter', '\t','precision', '%.6f'); dlmwrite('a1.txt',[postinterp(fem1,'t',0,'solnum','all')+time postinterp(fem1,'a1',fem1.mesh.p,'solnum','all')], 'delimiter', '\t','precision', '%.6f'); dlmwrite('a2.txt',[postinterp(fem1,'t',0,'solnum','all')+time postinterp(fem1,'a2',fem1.mesh.p,'solnum','all')], 'delimiter', '\t','precision', '%.6f'); dlmwrite('a3.txt',[postinterp(fem1,'t',0,'solnum','all')+time postinterp(fem1,'a3',fem1.mesh.p,'solnum','all')], 'delimiter', '\t','precision', '%.6f'); toc fclose('all'); %% close all load('u_co.txt') load('us_co.txt') load('u_co2.txt') load('u_o2.txt') load('u_c3h6.txt') load('us_c3h6.txt') load('u_h2o.txt') load('u_no.txt') load('us_no.txt') load('u_no2.txt') load('u_n2.txt') load('u_t.txt') load('u_ts.txt') load('g.txt') load('a1.txt') load('a2.txt') load('a3.txt') T_in= 298; F=(T_in*10^6*8.314)/(101325); figure(1) plot([0:0.0002:0.036],u_co(2:end,2:end));hold on; legend ('CO') 144
159 figure(2) plot([0:0.0002:0.036],u_c3h6(2:end,2:end));hold on; legend ('C3H6') figure(3) plot([0:0.0002:0.036],u_no(2:end,2:end));hold on; legend ('NO') figure(4) plot([0:0.0002:0.036],u_t(2:end,2:end));hold on; legend ('T') figure(5) plot([0:0.0002:0.036],u_ts(2:end,2:end));hold on; legend ('Ts') figure(6) 145
160 146
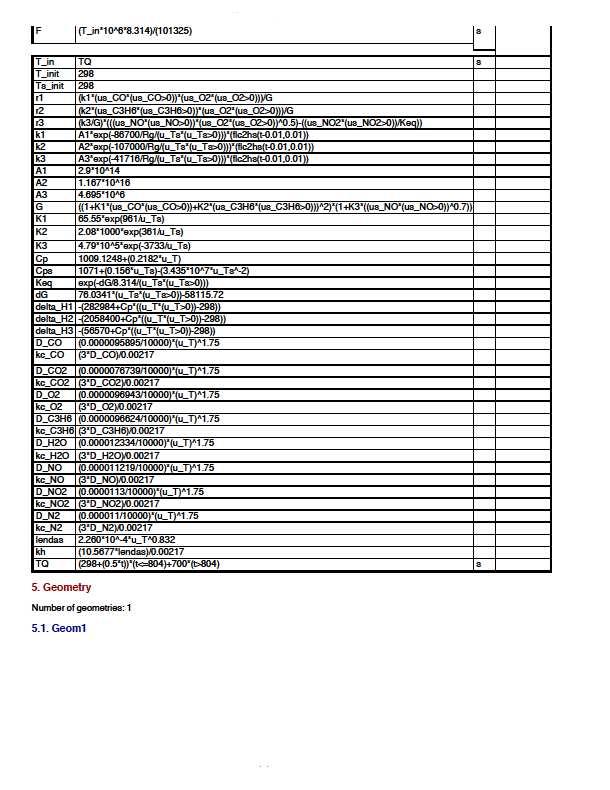
161 147
162 148
163 149
164 150
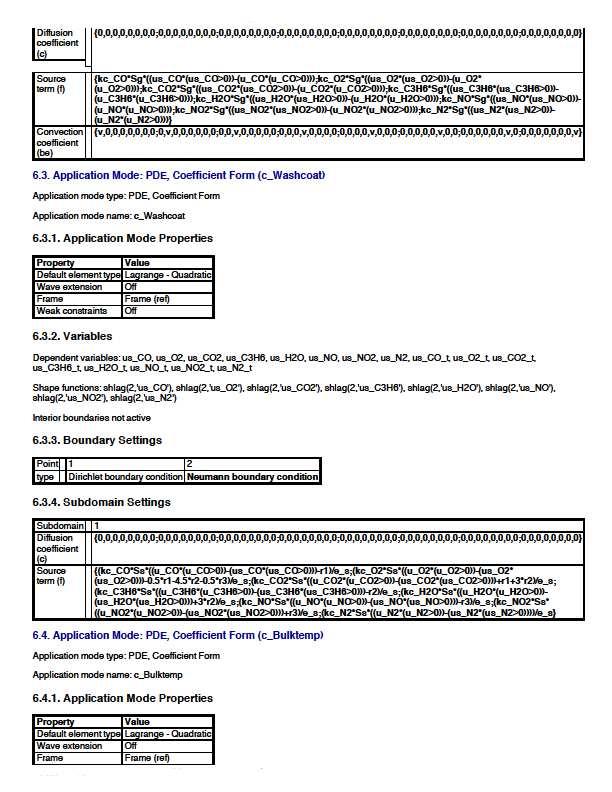
165 151
166 152
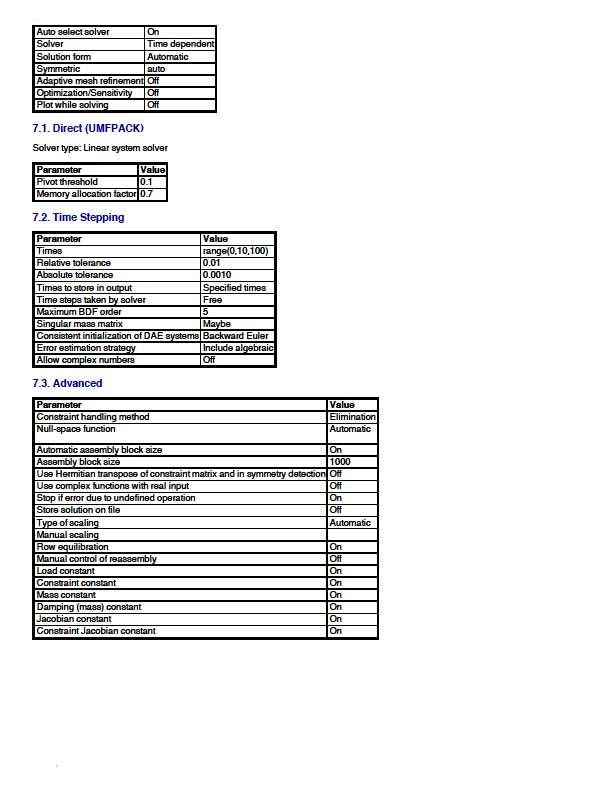
167 153
INTRODUCTION TO CATALYTIC COMBUSTION
 INTRODUCTION TO CATALYTIC COMBUSTION R.E. Hayes Professor of Chemical Engineering Department of Chemical and Materials Engineering University of Alberta, Canada and S.T. Kolaczkowski Professor of Chemical
AUTOMOTIVE EXHAUST AFTERTREATMENT
 AUTOMOTIVE EXHAUST AFTERTREATMENT CATALYST FUNDAMENTLS Catalyst in its simplest term is a material that increase the rate (molecules converted by unit time) of a chemical reaction while itself not undergoing
Emissions Catalyst Design using GT-SUITE. Dr. Chaitanya Sampara Viridis Chemicals Private Limited
 Emissions Catalyst Design using GT-SUITE Dr. Chaitanya Sampara Viridis Chemicals Private Limited Viridis Chemicals Background Originated at KSRM College of Engineering (212) Research Focus Develop tailored
Karishma Vistasp Irani 2009
 Characterization of competitive oxidation reactions over a model Pt-Pd/Al 2 O 3 diesel oxidation catalyst by Karishma Vistasp Irani A thesis presented to the University of Waterloo in fulfilment of the
Application of Environmental Technology Management. (ETM) to Automobile Exhaust Emission Reduction. Meshari AL-Harbi
 to Automobile Exhaust Emission Reduction. Meshari AL-Harbi") Application of Environmental Technology Management (ETM) to Automobile Exhaust Emission Reduction by Meshari AL-Harbi A thesis presented to the University of Waterloo in fulfillment of the thesis requirement
Application of Environmental Technology Management (ETM) to Automobile Exhaust Emission Reduction by Meshari AL-Harbi A thesis presented to the University of Waterloo in fulfillment of the thesis requirement
Emissions Catalyst Design using GT-SUITE. Dr. Chaitanya Sampara Mr. Dominik Artukovic
 Emissions Catalyst Design using GT-SUITE Dr. Chaitanya Sampara Mr. Dominik Artukovic Viridis Chemicals Background Specialize in developing catalyst specific reaction kinetics Chemistries Gasoline TWC Diesel
A SCR Model based on Reactor and Engine Experimental Studies for a Cu-zeolite Catalyst
 Michigan Technological University Digital Commons @ Michigan Tech Dissertations, Master's Theses and Master's Reports - Open Dissertations, Master's Theses and Master's Reports 213 A SCR Model based on
BAE 820 Physical Principles of Environmental Systems
 BAE 820 Physical Principles of Environmental Systems Catalysis of environmental reactions Dr. Zifei Liu Catalysis and catalysts Catalysis is the increase in the rate of a chemical reaction due to the participation
Simulation of Engine Exhaust Aftertreatment with CFD using Detailed Chemistry
 Simulation of Engine Exhaust Aftertreatment with CFD using Detailed Chemistry J. M. Deur, S. Jonnavithula, S. Dhanapalan, K. Schulz, B. Raghunathan, and H. Nakla Analysis and Design Application Co., Ltd.
Combustion Generated Pollutants
 Combustion Generated Pollutants New Delhi Peking Climate change Combustion Generated Pollutants Greenhouse gases: CO 2, methane, N 2 O, CFCs, particulates, etc. Hydrocarbons: Toxins and a major contributor
Department of Chemical and Petroleum Engineering Sharif University of Technology, Iran
 Tayebeh Hamzehlouyan Department of Chemical and Petroleum Engineering Sharif University of Technology, Iran ETH-Conference on Combustion Generated Nanoparticles June 0, 018 1. Motivation. Experimental
Simulation of Selective Catalytic Reduction using DARS 1D Tool
 Simulation of Selective Catalytic Reduction using DARS 1D Tool Best Practice Training: Combustion & Chemical Reaction Modeling STAR Global Conference 2013 Karin Fröjd & Adina Tunér LOGE AB Outline Introduction
2011 DOE Crosscut Workshop on Lean Emissions Reduction Simulation April 2011 Dearborn, MI
 Renewable energies Eco-friendly production Innovative transport Eco-efficient processes Sustainable resources 2011 DOE Crosscut Workshop on Lean Emissions Reduction Simulation April 2011 Dearborn, MI Research
3.2 Alkanes. Refining crude oil. N Goalby chemrevise.org 40 C 110 C 180 C. 250 C fuel oil 300 C 340 C. Fractional Distillation: Industrially
 3.2 Alkanes Refining crude oil Fractional Distillation: Industrially Petroleum is a mixture consisting mainly of alkane hydrocarbons Petroleum fraction: mixture of hydrocarbons with a similar chain length
Kinetic Parameter Identification for a DOC Catalyst Using SGB test and Advanced Optimization Algorithms
 Kinetic Parameter Identification for a DOC Catalyst Using SGB test and Advanced Optimization Algorithms Mahsa RAFIGH - Politecnico di Torino Federico MILLO - Politecnico di Torino Paolo FERRERI General
An Introduction to Chemical Kinetics
 An Introduction to Chemical Kinetics Michel Soustelle WWILEY Table of Contents Preface xvii PART 1. BASIC CONCEPTS OF CHEMICAL KINETICS 1 Chapter 1. Chemical Reaction and Kinetic Quantities 3 1.1. The
Balancing chemical reaction equations (stoichiometry)
") Balancing chemical reaction equations (stoichiometry) This worksheet and all related files are licensed under the Creative Commons Attribution License, version 1.0. To view a copy of this license, visit
Balancing chemical reaction equations (stoichiometry) This worksheet and all related files are licensed under the Creative Commons Attribution License, version 1.0. To view a copy of this license, visit
Three Way Catalyst and Lean NO x Trap Modeling for a Lean Burn SIDI Gasoline engine
 Three Way Catalyst and Lean NO x Trap Modeling for a Lean Burn SIDI Gasoline engine Jian Gong, Christopher J. Rutland Presented at CLEERS on April 12 th, 213 Engine Research Center University of Wisconsin-Madison
Smog, Catalytic Converters and You
 Smog, Catalytic Converters and You APPENDIX A Outcomes: 1. Describe a reaction mechanism and a catalyst s role in a chemical reaction. (ACC-3) 2. Describe collision theory and its connection to factors
DARS overview, IISc Bangalore 18/03/2014
 www.cd-adapco.com CH2O Temperatur e Air C2H4 Air DARS overview, IISc Bangalore 18/03/2014 Outline Introduction Modeling reactions in CFD CFD to DARS Introduction to DARS DARS capabilities and applications
Rate of reaction refers to the amount of reactant used up or product created, per unit time. We can therefore define the rate of a reaction as:
 Rates of Reaction Rate of reaction refers to the amount of reactant used up or product created, per unit time. We can therefore define the rate of a reaction as: Rate = change in concentration units: mol
In terms of production, nitric acid is the third most widely produced acid across the world.
 In terms of production, nitric acid is the third most widely produced acid across the world. It has a wide range of uses in agriculture, industry and medicine where it is used as a fertiliser and in the
DETAILED MODELLING OF SHORT-CONTACT-TIME REACTORS
 DETAILED MODELLING OF SHORT-CONTACT-TIME REACTORS Olaf Deutschmann 1, Lanny D. Schmidt 2, Jürgen Warnatz 1 1 Interdiziplinäres Zentrum für Wissenschaftliches Rechnen, Universität Heidelberg Im Neuenheimer
Be prepared to discuss the quantitative comparison method in the oral exam.
 Subject: Ring Experiment III 8 Shell and Tube Heat Exchanger Control The shell and Tube Heat Exchanger has two control valves: one on the process fluid flowing to the tubes and one on the cooling water
Zeolite HC Traps: Experiments and Simulations
 CLEERS 2013 Zeolite HC Traps: Experiments and Simulations Presenter - Ford Motor Company April 10, 2013 p. 1 Chemical Engineering Department Outline -Introduction -Mathematical model development and simulation
Correlation between LNT NH 3 and N 2 O selectivities under fast cycling conditions
 Correlation between LNT and N 2 O selectivities under fast cycling conditions Jae-Soon Choi, Josh Pihl, Miyoung Kim, Bill Partridge, Stuart Daw Oak Ridge National Laboratory Petr Kočí Institute of Chemical
Combustion. Indian Institute of Science Bangalore
 Combustion Indian Institute of Science Bangalore Combustion Applies to a large variety of natural and artificial processes Source of energy for most of the applications today Involves exothermic chemical
State how a catalyst speeds up a chemical reaction. ...
 Q1. This question is about the use of transition metals as catalysts. (a) State how a catalyst speeds up a chemical reaction. State the characteristic property of transition metals that enables them to
Lecture (9) Reactor Sizing. Figure (1). Information needed to predict what a reactor can do.
 Reactor Sizing. Figure (1). Information needed to predict what a reactor can do.") Lecture (9) Reactor Sizing 1.Introduction Chemical kinetics is the study of chemical reaction rates and reaction mechanisms. The study of chemical reaction engineering (CRE) combines the study of chemical
Lecture (9) Reactor Sizing 1.Introduction Chemical kinetics is the study of chemical reaction rates and reaction mechanisms. The study of chemical reaction engineering (CRE) combines the study of chemical
C (s) + O 2 (g) CO 2 (g) S (s) + O 2 (g) SO 2 (g)
 + O 2 (g) CO 2 (g) S (s) + O 2 (g) SO 2 (g)") Combustion The rapid combination of oxygen with a substance. A major type of chemical reaction. When elemental carbon or carbon-containing compounds burn in air, oxygen combines with the carbon to form
Combustion The rapid combination of oxygen with a substance. A major type of chemical reaction. When elemental carbon or carbon-containing compounds burn in air, oxygen combines with the carbon to form
Kinetic Parameters Estimation using Vehicle Data for Exhaust Aftertreatment Devices
 Kinetic Parameters Estimation using Vehicle Data for Exhaust Aftertreatment Devices Karthik Ramanathan India Science Lab General Motors, Global Research and Development Center Bangalore, India Acknowledgments:
Explanation: They do this by providing an alternative route or mechanism with a lower activation energy
 Catalysts Definition: Catalysts increase reaction rates without getting used up. Explanation: They do this by providing an alternative route or mechanism with a lower Comparison of the activation energies
Combustion Theory and Applications in CFD
 Combustion Theory and Applications in CFD Princeton Combustion Summer School 2018 Prof. Dr.-Ing. Heinz Pitsch Copyright 201 8 by Heinz Pitsch. This material is not to be sold, reproduced or distributed
Ammonia Selective Catalytic Reduction of NO in a Monolithic Reverse Flow Reactor
 Ammonia Selective Catalytic Reduction of NO in a Monolithic Reverse Flow Reactor Emilio Muñoz Vega*, Salvador Ordoéz García, Fernando V. Díez Sanz Department of Chemical and Environmental Engineering,
1. A. Define the term rate of reaction. The measure of the amount of reactants being converted into products per unit amount of time
 Name answer key period IB topic 6 Kinetics 1. A. Define the term rate of reaction. The measure of the amount of reactants being converted into products per unit amount of time b. the reaction between C
DISPLAY YOUR STUDENT ID CARD ON THE TOP OF YOUR DESK NOW UNIVERSITY OF VICTORIA. CHEMISTRY 102 Midterm Test 1 February 1, pm (60 minutes)
") SECTION: (circle one): A01 MR (Dr. Lipson) A02 (Dr. Briggs) A03 MWR (Dr. Brolo) NAME Student No. V0 (Please print clearly.) DISPLAY YOUR STUDENT ID CARD ON THE TOP OF YOUR DESK NOW Version A UNIVERSITY
SECTION: (circle one): A01 MR (Dr. Lipson) A02 (Dr. Briggs) A03 MWR (Dr. Brolo) NAME Student No. V0 (Please print clearly.) DISPLAY YOUR STUDENT ID CARD ON THE TOP OF YOUR DESK NOW Version A UNIVERSITY
SCR Catalyst Deactivation for PRB-Firing Coal Utility Boilers
 SCR Catalyst Deactivation for PRB-Firing Coal Utility Boilers Christopher Bertole Cormetech, Inc. Presentation Outline Cormetech Experience Catalyst Deactivation from Ca, P, and Na Impact on Catalyst Activity
Development of New Diesel Oxidation and NH3 Slip Catalysts
 Downloaded from orbit.dtu.dk on: Feb 11, 218 Development of New Diesel Oxidation and NH3 Slip Catalysts Hansen, Thomas Klint; Jensen, Anker Degn; Hansen, Brian Brun; Janssens, Ton V.W. Publication date:
Rates of Reaction HL
 Name: Rates of Reaction Objectives 16. Rates of Reaction -define rate of reaction -define catalysis -monitor the rate of production of oxygen from hydrogen peroxide, using manganese dioxide as a catalyst
Chemical Kinetics Computations of Fuel Decomposition to Aldehydes for NOx Reduction in Engine Exhaust Gas
 International Journal of Chemical Engineering and Applications, Vol. 7, No. 4, August 216 Chemical Kinetics Computations of Fuel Decomposition to for NOx Reduction in Engine Exhaust Gas Shigeto Yahata,
TRITIUM RECOVERY FROM WASTE USING A PALLADIUM MEMBRANE REACTOR
 TRITIUM RECOVERY FROM WASTE USING A PALLADIUM MEMBRANE REACTOR Stephen A. Birdsell and R. Scott Willms Los Alamos National Laboratory MS C348, Los Alamos, New Mexico 87545 ABSTRACT A large quantity of
PAPER No. 4: Environmental Chemistry MODULE No. 19: Photochemical reaction in atmosphere and smog formation
 Subject Chemistry Paper No and Title Module No and Title Module Tag 4, Environmental Chemistry 19, Photochemical reaction in atmosphere and smog formation CHE_P4_M19 TABLE OF CONTENTS 1. Learning Outcomes
AP Chem Chapter 14 Study Questions
 Class: Date: AP Chem Chapter 14 Study Questions 1. A burning splint will burn more vigorously in pure oxygen than in air because a. oxygen is a reactant in combustion and concentration of oxygen is higher
8.8 - Gases. These are assumptions that can be made about 99% of the gases we come in contact with which are called ideal gases.
 Gases The substance that we come in contact with every second of every day is in fact the substance we never think about. This substance is a mixture of gases known as the atmosphere. Gases have the weakest
Project-Based Inquiry Science: Air Quality Storyline. Air Quality: What s the Big Question? How Can You Improve Air Quality in Your Community?
 Project-Based Inquiry Science: Air Quality Storyline Air Quality: What s the Big Question? How Can You Improve Air Quality in Your Community? In the Introduction to Air Quality, students read a parable
Laminar Premixed Flames: Flame Structure
 Laminar Premixed Flames: Flame Structure Combustion Summer School 2018 Prof. Dr.-Ing. Heinz Pitsch Course Overview Part I: Fundamentals and Laminar Flames Introduction Fundamentals and mass balances of
Rajesh Dorai and Mark J. Kushner University of Illinois Deparment of Electrical and Computer Engineering Urbana, IL 61801
 EFFECT OF MULTIPLE PULSES ON THE HETEROGENEOUS AND HOMOGENEOUS CHEMISTRY DURING THE PLASMA REMEDIATION OF X AND OXIDATION OF SOOT USING DIELECTRIC BARRIER DISCHARGES * Rajesh Dorai and Mark J. Kushner
Understanding NH 3 emissions over a three-way catalyst in lean/rich conditions.
 Understanding NH 3 emissions over a three-way catalyst in lean/rich conditions. Tiago Casinhas Ribeiro tiago.casinhas@ist.utl.pt Instituto Superior Técnico, Lisboa, Portugal December 215 Abstract Current
Engineering. Green Chemical. S. Suresh and S. Sundaramoorthy. and Chemical Processes. An Introduction to Catalysis, Kinetics, CRC Press
 I i Green Chemical Engineering An Introduction to Catalysis, Kinetics, and Chemical Processes S. Suresh and S. Sundaramoorthy CRC Press Taylor & Francis Group Boca Raton London New York CRC Press is an
PART I Fundamentals COPYRIGHTED MATERIAL
 PART I Fundamentals COPYRIGHTED MATERIAL 1 Catalyst Fundamentals 1.1 INTRODUCTION Chemical reactions occur by breaking chemical bonds of reactants and by forming new bonds and new compounds. Breaking
ONE-DIMENSIONAL HIGH-FIDELITY AND REDUCED-ORDER MODELS FOR THREE- WAY CATALYTIC CONVERTER
 ONE-DIMENSIONAL HIGH-FIDELITY AND REDUCED-ORDER MODELS FOR THREE- WAY CATALYTIC CONVERTER ONE-DIMENSIONAL HIGH-FIDELITY AND REDUCED-ORDER MODELS FOR THREE- WAY CATALYTIC CONVERTER By Tongrui Li, B.Eng.
Elements and Their Oxides
 Elements and Their Oxides An oxide is a. Oxides can form when an element reacts with oxygen, often in air. This reaction can be rapid with the release of a great deal of energy, as in the combustion of
An in-situ infrared and XAS study on NO adsorption on Pd/zeolite under complex gas feed
 An in-situ infrared and XAS study on NO adsorption on Pd/zeolite under complex gas feed Donna Liu, Loredana Mantorosie, H. Islam, V. Novak, M. Sarwar, H.Y. Chen, J. E. Collier and D. Thompsett Outline
The impacts of Pdin BEA zeolite on decreasing cold start HC emission of an E85 vehicle
 CLEERS presentation October, 2017 The impacts of Pdin BEA zeolite on decreasing cold start HC emission of an E85 vehicle Lifeng Xu*, Jason Lupescu, Jeffery Hepburn, Giovanni Cavataio, Kevin Guo, Paul Laing,
A mini review on the chemistry and catalysis of the water gas shift reaction
 A mini review on the chemistry and catalysis of the water gas shift reaction Abstract: Bifunctional/bimetallic catalysts are a set of important catalytic materials that find their applications in many
Model-based analysis of TWCcoated filters performance aspects
 Model-based analysis of TWCcoated filters performance aspects G. Koltsakis, M. Mitsouridis Aristotle University of Thessaloniki, Greece D. Karamitros Exothermia SA, Greece 18-Sep-2018 CLEERS 2018 How different
Reference pg and in Textbook
 Reference pg. 154-164 and 188-202 in Textbook Combustion Reactions During combustion (burning) of fossil fuels, collisions between the molecules of the fuel and oxygen result in the formation of new molecules.
Chemical Reactions and Kinetics of the Carbon Monoxide Coupling in the Presence of Hydrogen
 Journal of Natural Gas Chemistry 11(2002)145 150 Chemical Reactions and Kinetics of the Carbon Monoxide Coupling in the Presence of Hydrogen Fandong Meng 1,2, Genhui Xu 1, Zhenhua Li 1, Pa Du 1 1. State
Engineering and. Tapio Salmi Abo Akademi Abo-Turku, Finland. Jyri-Pekka Mikkola. Umea University, Umea, Sweden. Johan Warna.
 Chemical Reaction Engineering and Reactor Technology Tapio Salmi Abo Akademi Abo-Turku, Finland Jyri-Pekka Mikkola Umea University, Umea, Sweden Johan Warna Abo Akademi Abo-Turku, Finland CRC Press is
Lecture 8 Laminar Diffusion Flames: Diffusion Flamelet Theory
 Lecture 8 Laminar Diffusion Flames: Diffusion Flamelet Theory 8.-1 Systems, where fuel and oxidizer enter separately into the combustion chamber. Mixing takes place by convection and diffusion. Only where
Application Challenges for Nanostructured Porous Materials
 Application Challenges for Nanostructured Porous Materials Dr Liz Rowsell Director, Johnson Matthey Technology Centre 1 Paradigm Shift in Automotive NOx Control Catalysts A paradigm shift describes a fundamental
Hydrogen addition to the Andrussow process for HCN synthesis
 Applied Catalysis A: General 201 (2000) 13 22 Hydrogen addition to the Andrussow process for HCN synthesis A.S. Bodke, D.A. Olschki, L.D. Schmidt Department of Chemical Engineering and Materials Science,
Catalytic bead sensors are used primarily to detect
 Chapter 3 Catalytic Combustible Gas Sensors Catalytic bead sensors are used primarily to detect combustible gases. They have been in use for more than 50 years. Initially, these sensors were used for monitoring
2. (i) Infrared (radiation absorbed) by (C H) bond vibration ALLOW bond stretching OR bond bending DO NOT ALLOW molecules vibrating 2
 Infrared (radiation absorbed) by (C H) bond vibration ALLOW bond stretching OR bond bending DO NOT ALLOW molecules vibrating 2") . (i) Species with an unpaired electron ALLOW atom, molecule or particle with an unpaired electron ALLOW has an unpaired electron ALLOW particle formed by homolytic fission DO NOT ALLOW particle with a
. (i) Species with an unpaired electron ALLOW atom, molecule or particle with an unpaired electron ALLOW has an unpaired electron ALLOW particle formed by homolytic fission DO NOT ALLOW particle with a
Development of Spatially-Resolved FTIR Gas Concentration Measurements inside a Monolith-Supported Selective Catalytic Reduction Catalyst
 Development of Spatially-Resolved FTIR Gas Concentration Measurements inside a Monolith-Supported Selective Catalytic Reduction Catalyst by Xuxian Hou A thesis presented to the University of Waterloo in
DARS Digital Analysis of Reactive Systems
 DARS Digital Analysis of Reactive Systems Introduction DARS is a complex chemical reaction analysis system, developed by DigAnaRS. Our latest version, DARS V2.0, was released in September 2008 and new
(a) Reaction rates (i) Following the course of a reaction Reactions can be followed by measuring changes in concentration, mass and volume of
 Reaction rates (i) Following the course of a reaction Reactions can be followed by measuring changes in concentration, mass and volume of") (a) Reaction rates (i) Following the course of a reaction Reactions can be followed by measuring changes in concentration, mass and volume of reactants or products. g Measuring a change in mass Measuring
(a) Reaction rates (i) Following the course of a reaction Reactions can be followed by measuring changes in concentration, mass and volume of reactants or products. g Measuring a change in mass Measuring
Mathematical Investigation and CFD Simulation of Monolith Reactors: Catalytic Combustion of Methane
 Presented at the COMSOL Conference 2008 Hannover Mathematical Investigation and CFD Simulation of Monolith Reactors: Catalytic Combustion of Methane Maryam Ghadrdan Norwegian University of Science and
(g) 2NH 3. (g) ΔH = 92 kj mol 1
 2NH 3. (g) ΔH = 92 kj mol 1") 1 The uses of catalysts have great economic and environmental importance For example, catalysts are used in ammonia production and in catalytic converters (a) Nitrogen and hydrogen react together in the
1 The uses of catalysts have great economic and environmental importance For example, catalysts are used in ammonia production and in catalytic converters (a) Nitrogen and hydrogen react together in the
Design of an optimal oxidation catalyst for particle trapping
 Design of an optimal oxidation catalyst for particle trapping Master of Science Thesis Rodrik Fällmar Department of Chemical and Biological Engineering Division of Chemical Reaction Engineering CHALMERS
MARIYA INTERNATIONAL SCHOOL. Work sheet II. Term II. Level 8 Chemistry [Paper IV] Name: SULFUR AND AIR AND WATER
![MARIYA INTERNATIONAL SCHOOL. Work sheet II. Term II. Level 8 Chemistry [Paper IV] Name: SULFUR AND AIR AND WATER](/thumbs/87/95831550.jpg "MARIYA INTERNATIONAL SCHOOL. Work sheet II. Term II. Level 8 Chemistry [Paper IV] Name: SULFUR AND AIR AND WATER") MARIYA INTERNATIONAL SCHOOL Work sheet II Term II Level 8 Chemistry [Paper IV] Name: SULFUR AND AIR AND WATER 1. Nitrogen dioxide and other oxides of nitrogen are formed in car engines. a) Explain how
MARIYA INTERNATIONAL SCHOOL Work sheet II Term II Level 8 Chemistry [Paper IV] Name: SULFUR AND AIR AND WATER 1. Nitrogen dioxide and other oxides of nitrogen are formed in car engines. a) Explain how
Overview of LNT Modeling Approaches
 Overview of LNT Modeling Approaches -1- Institute of Chemical Technology, Prague, Czech Republic Overview of LNT Modeling Approaches Miloš Marek, Petr Kočí http://www.vscht.cz/monolith CLEERS Workshop
Chapter Chemical Kinetics
 CHM 51 Chapter 13.5-13.7 Chemical Kinetics Graphical Determination of the Rate Law for A Product Plots of [A] versus time, ln[a] versus time, and 1/[A] versus time allow determination of whether a reaction
5. Collection and Analysis of. Rate Data
 5. Collection and nalysis of o Objectives Rate Data - Determine the reaction order and specific reaction rate from experimental data obtained from either batch or flow reactors - Describe how to analyze
A Systematic Approach for Performance Comparisons of NO x Converter Designs. Michelle Bendrich. Master of Science. Chemical Engineering
 A Systematic Approach for Performance Comparisons of NO x Converter Designs by Michelle Bendrich A thesis submitted in partial fulfillment of the requirements for the degree of Master of Science in Chemical
Name AP CHEM / / Chapter 12 Outline Chemical Kinetics
 Name AP CHEM / / Chapter 12 Outline Chemical Kinetics The area of chemistry that deals with the rate at which reactions occur is called chemical kinetics. One of the goals of chemical kinetics is to understand
Author Index. See https://pubs.acs.org/sharingguidelines for options on how to legitimately share published articles. Affiliation Index.
 Author Index Downloaded via 148.251.232.83 on July 5, 2018 at 02:15:59 (UTC). See https://pubs.acs.org/sharingguidelines for options on how to legitimately share published articles. Bart, J. M., 42 Bent,
TABLE OF CONTENT. Chapter 4 Multiple Reaction Systems 61 Parallel Reactions 61 Quantitative Treatment of Product Distribution 63 Series Reactions 65
 TABLE OF CONTENT Chapter 1 Introduction 1 Chemical Reaction 2 Classification of Chemical Reaction 2 Chemical Equation 4 Rate of Chemical Reaction 5 Kinetic Models For Non Elementary Reaction 6 Molecularity
ALE 1. Chemical Kinetics: Rates of Chemical Reactions
 Name Chem 163 Section: Team Number: ALE 1. Chemical Kinetics: Rates of Chemical Reactions (Reference: Sections 16.1 16.2 + parts of 16.5 16.6 Silberberg 5 th edition) How do the surface area, concentration
NAME Student ID No. UNIVERSITY OF VICTORIA. CHEMISTRY 102 Term Test I February 4, 2011
 NAME Student ID No. Section (circle one): A01 (Dr. Lipson) A02 (Dr. Briggs) A03 (Dr. Brolo) UNIVERSITY OF VICTORIA Version A CHEMISTRY 102 Term Test I February 4, 2011 Version A This test has two parts:
Unit 12: Chemical Kinetics
 Unit 12: Chemical Kinetics Author: S. Michalek Introductory Resources: Zumdahl v. 5 Chapter 12 Main Ideas: Integrated rate laws Half life reactions Reaction Mechanisms Model for chemical kinetics Catalysis
Research on energy-saving and exhaust gas emissions compared between catalytic combustion and gas-phase combustion of natural gas
 Research on energy-saving and exhaust gas emissions compared between catalytic combustion and gas-phase combustion of natural gas Shihong Zhang,*, Zhihua Wang Beijing University of Civil Engineering and
Well Stirred Reactor Stabilization of flames
 Well Stirred Reactor Stabilization of flames Well Stirred Reactor (see books on Combustion ) Stabilization of flames in high speed flows (see books on Combustion ) Stabilization of flames Although the
Warning!! Chapter 5 Gases. Chapter Objectives. Chapter Objectives. Chapter Objectives. Air Pollution
 Warning!! Larry Brown Tom Holme www.cengage.com/chemistry/brown Chapter 5 Gases These slides contains visual aids for learning BUT they are NOT the actual lecture notes! Failure to attend to lectures most
ICSE Board Class IX Chemistry Paper 5 Solution
 ICSE Board Class IX Chemistry Paper 5 Solution SECTION I Answer 1 i. Dalton used the symbol for oxygen and the symbol for hydrogen. Symbol represents gram atom(s) of an element. i Symbolic expression for
Introduction. Mathematical model and experimental
 COMPARISON OF THE PERFORMANCE OF A REVERSE FLOW REACTOR AND NETWORKS OF NON-STATIONARY CATALYTIC REACTORS FOR CATALYTIC COMBUSTION OF METHANE IN LEAN MIXTURES Miguel A. G. Hevia 1, Davide Fissore 2, Salvador
association adilca FUEL COMBUSTION
 FUEL COMBUSTION Where does the energy that drives the motors come from? What are hydrocarbons made of? Why does it need air to burn fuel? What is the amount of energy released by combustion? How to calculate
The Effects of Ceria Addition on Aging and Sulfation of Lean NOx Traps for Stand Alone and LNT-SCR Applications
 University of Kentucky UKnowledge Theses and Dissertations--Chemical and Materials Engineering Chemical and Materials Engineering 2013 The Effects of Ceria Addition on Aging and Sulfation of Lean NOx Traps
NATIONAL SENIOR CERTIFICATE EXAMINATION
 NATIONAL SENIOR CERTIFICATE EXAMINATION PHYSICAL SCIENCES: CHEMISTRY (P2) JUNE 2015 QUESTION PAPER GRADE 11 MARKS: 150 TIME: 3 HOURS This paper consists of 10 pages, 2 data sheets and 1 graph paper. INSTRUCTIONS
CFD Simulation of Catalytic Combustion of Benzene
 Iranian Journal of Chemical Engineering Vol. 6, No. 4 (Autumn), 9, IAChE CFD Simulation of Catalytic Combustion of Benzene A. Niaei 1, D. Salari, S. A. Hosseini 3 1- Associate Professor of Chemical Engineering,
Computational Fluid Dynamic Study On The Decomposition Of Methane Gas Into Hydrogen And Solid Carbon In A Packed Bed Fluid Catalytic Cracking Reactor
 IOSR Journal of Applied Chemistry (IOSR-JAC) e-issn: 2278-5736. Volume 4, Issue 2 (Mar. Apr. 2013), PP 32-41 Computational Fluid Dynamic Study On The Decomposition Of Methane Gas Into Hydrogen And Solid
Modeling heterogeneous and homogeneous reactions in the high-temperature catalytic combustion of methane
 Chemical Engineering Science 54 (1999) 5791}5807 Modeling heterogeneous and homogeneous reactions in the high-temperature catalytic combustion of methane C. T. Goralski Jr., L. D. Schmidt* Department of
Ch 9 Stoichiometry Practice Test
 Ch 9 Stoichiometry Practice Test Multiple Choice Identify the choice that best completes the statement or answers the question. 1. A balanced chemical equation allows one to determine the a. mole ratio
Method and process for combustion synthesized supported cobalt catalysts for fixed bed Fischer Tropsch reaction
 Method and process for combustion synthesized supported cobalt catalysts for fixed bed Fischer Tropsch reaction Center for Sustainable Technologies Indian Institute of Science Bangalore IDF presentation
Overview of Reacting Flow
 Overview of Reacting Flow Outline Various Applications Overview of available reacting flow models Latest additions Example Cases Summary Reacting Flows Applications in STAR-CCM+ Chemical Process Industry
Developing Carbon Tolerance Catalyst for Dry Methane Reforming
 745 A publication of CHEMICAL ENGINEERING TRANSACTIONS VOL. 32, 2013 Chief Editors: Sauro Pierucci, Jiří J. Klemeš Copyright 2013, AIDIC Servizi S.r.l., ISBN 978-88-95608-23-5; ISSN 1974-9791 The Italian
SCR Catalyst Layer Addition Specification and Management
 SCR Catalyst Layer Addition Specification and Management The 13th Sulfur Dioxide, Nitrogen Oxide, Mercury and Fine Particle Pollution Control Technology & Management International Exchange Conference Wuhan,
Chemical Reaction Engineering Prof. Jayant Modak Department of Chemical Engineering Indian Institute of Science, Bangalore
 Chemical Reaction Engineering Prof. Jayant Modak Department of Chemical Engineering Indian Institute of Science, Bangalore Lecture No. # 26 Problem solving : Heterogeneous reactions Friends, in last few
EVALUATION OF ATMOSPHERIC PROCESSES FOR OZONE FORMATION FROM VEHICLE EMISSIONS
 EVALUATION OF ATMOSPHERIC PROCESSES FOR OZONE FORMATION FROM VEHICLE EMISSIONS by WILLIAM P. L. CARTER STATEWIDE AIR POLLUTION RESEARCH CENTER, and COLLEGE OF ENGINEERING CENTER FOR ENVIRONMENTAL RESEARCH
Ozone in the Atmosphere
 Ozone in the Atmosphere Why are we concerned with ozone? This simple molecule affects us in very important ways. It protects us, as well as all animals and plants on our planet, from the harm that ultraviolet