Cold Darnage B and Plant Mortality in Experimental Provenance Plantations with Scots Pine in Northern Sweden
|
|
|
- Kenneth Owen
- 6 years ago
- Views:
Transcription
1 STUDIA FORESTALIA SUECICA Nr Cold Darnage B and Plant Mortality in Experimental Provenance Plantations with Scots Pine in Northern Sweden Roldskudor och plantdod i proveniensforsok med tall i Norrland by VILHELMS EICHE SKOGSHOGSROLAN STOCKHOLM
2 Ms received Feb. 7th 1966 his rnottaget 7 febr Esselte. Sthlm 66
3 CONTEXTS Introduction... Abbreviations used General information on experimental plantations Provenance material tested in the experiments Design, layout and tending of the experiments Weather conditions during the years when severe injury to plants occurred Cold damage in coilnection with weather conditions \Teather in single years Extreme weather conditions causing scvcre cold damage Injury to plants and damage patterns Damage patterns Injury of the main stem Basal stein girdle and frost canker Girdle with resin flov and rents in the hark Girdle and fungus canker Circular sloughing of the bark Lesions in the bark hlining damage by bark beetle Girdling of the main stem in the upper part of the tree Diehack of the top of the plant Distortion of the stem and the crown by snow Relationship het~vcen different kinds of injury Lo plants Mortality rates in plants among provenances Biological and statistical concepts of death in plants Single experimental plantations Cumulative mortality and mortality in single years Cumulativc mortality rates in relation to the transfer of the provenances Cause of damage to plants Physical factors Destruction and diebacli of cambium, phloem and cortex Factors causing the damage Pathogens 6. Cold damage. healing of ~~ounds and mortality-connected phenomena in a chain of biological processes in plants Cold and winter hardiness Injury. recovery and mortality Environment and genetic background... Summary... Acltnovilcdgenients... References... Sammanfattnin~... List of figures... List oftables...
4 Introduction This paper deals with the problem of severe cold damage to Scots pine, which causes heavy mortality among plants. It is not only the extent and the intensity of the damage, but also its somewhat unusual type and origin that will be discussed here. Of all the different and intricate manifestations of cold damage, the emphasis is laid here upon the dieback of the cambium or of the phloem and cortex around the stem, resulting both in basal stem girdle (Figs. 1 and 2) and in the development of frost canker (Fig. 3). It is true that several other kinds of damage occur simultaneously (Fig. 4), and that not seldom, but it is the basal stem girdle that decides the fate of the damaged plants and young trees, and this more than often results in heavy mortality among plants. The manifestation of the singular cold damage should to a great extent be connected with the extreme climate in some years. On the other hand, in years with normal weather conditions no damage to Scots pine has been observed, and one is almost inclined to say that it does not occur at all. It is most interesting to note some peculiar features in the weather conditions in the years when severe cold damage occurs. Rainy and also comparatively frequent cool summers and autumns, followed by sudden drops of temperature and fluctuations in the weather conditions during the winters, with periods of extreme low temperatures, should be mentioned in the first place. Conspicuous fluctuations of the diurnal air temperature in late winter and early spring complete the picture. The compact snow cover in minter, alternate freezing and thawing of the snow in spring, make up the second characteristic feature of the extreme climatic conditions. It is not easy to estimate the effect of a single weather factor and also the interaction of several meteorological factors upon the origin of cold damage. Cold damage as a phenomenon associated with the hardening processes in plants thus becomes an intricate problem. The manifestation of basal stem girdle is functionally associated with years of extreme weather conditions and takes place after indefinite intervals over a period of some years. Although cold damage of this kind does not often occur, it exercises a grave negative influence upon the development of individual plants and plantations, and results in devastating consequences to practical silviculture. During the last decade widespread cold damage was particularly conspi-
5 C Fig. 1. Basal stem girdle of 1960/61, at ground surface. The damaged trees died in the autumn of The photographs were taken in September a, experimental plantation 21, provenance 23; b, experimental plantation 12, provenance 50; c, experimental plantation 11, provenance 49.
6 Fig. 2. Basal stem girdle of 1960/61, cnl above ground surface. The completely girdled trees lingered on until the autumn of 1963, owing to the survival of some living branches below the girdle: a, experimental plantation 28, provenance 84; b, experimental plantation 22, provenance 23.
7 Fig. 3. Basal stem girdle of and heavy frost canker: a, transverse section at the centre of the frost canker; b, longitudinal section of the portion affected by basal stem girdle; c, short terminal and lateral shoots developed during the growing season of 1961; d, the portion of the basal stem girdle. The damaged tree died in the autumn of Photographs were taken: a and b in 1963: c and d in the autumn of 1961.
 and")
8 Fig. 1. Basal stem girdle of 1960/61 (at the height corresponding to the height of the tree in 1955) and dieback of the leader of 1960 during the winter 1960/61. The photograph was +?ken in September 1961.
9 cuous on afforestation and natural reproduction areas in the uplands of northern S\\eden and other localities xith similar climatic conditions. Plantations of high quality \yere IT-holly or partially laid n aste on account of cold mjury. (Sorrlands Skogsv5rdsforbunds exkursion till Lappland, Norrbottens lan, 1961.) The unusual type of damage and its variable manifestation caused surprise, and attempts were made to explain the causes of this intricate phenomenon. 3Iisinterpretations did not fail to crop up. In endeavouring to elucidate this phenomenon an unproportionally large role was attributed to secondary agents and other accessory factors. Injury to Scots pme caused by temperatures below freezing point is not an unfamiliar pheno~nenon either in Sweden, or in other countries with similar clirnatic conditions. h detailed and systematic historical survey of cold damage lies outside the scope of this paper, yet it is not out of place to mention some kinds of cold injury and also the investigations connected with the problem under discussion. Anlong different experiments dealing with cold damage to forest trees and plants, provenance experiments play an outstanding role. In SM eden pro\ e- ilance tests were started more than 60 years ago. During this period most valuable information on the sensibility of plants to cold injury in relation to the origin of seeds has been collected. The susceptibility of plants is clearly re\ ealed when seeds are transferred from their natural habitat to areas with a more severe cllmate. Cold resistance is one of the aspects in the variability of physiological qualities that have heen studied in Scots pine. The different silvicultural ~alues of provenances are closely connected with cold damage to plants. In this connection reference should be made to: SCHOTTC (1910, 1923), WIBECK (1912, 1913, 1929, ), ENEKOTH ( , 1928, 1930) and LANGLET (1929, 1934, 1936,1945,1952, 1959). It should also be mentioned here that the problem of cold resistance has heen touched upon in many papers on the provenances of Scots pine by authors outside Sweden (Ref.: LANGLET, 1936, 1938, 1959; KALELA, 1937). In silvicultural practice in Sweden, different kinds of cold injury to Sctos pine have been observed. One of the most notorious examples is the extensive cold damage to Scots pine which took place in the year 1903 (ORTENBLAD, 1903; ANDERSSON, 1905). There is an evident connection between the manifestation of cold damage to Scots pine in the year 1903 and the weather conditions prevailing at that time in Sweden. The summer of 1902, cool and rainy, was followed by an early cold wave but by a mild winter later; in the early spring of 1903 there was a period of narm weather and then a severe cold wave. Dieback of the shoots, plant tips and of the crowns occurred in Scots pine of different ages, and even in older trees on natural growth localities.
10 The cold damage of 1903 serves as an example of the manifestation of the damage comprising a large region, namely, the north of Sweden. The effect of the general neather conditions in this particular case is obvious. The variations of local climate in individual areas within the boundaries of the region exercise a modifying influence on the intensity of the cold damage, either strengthening or weakening it, subject to the topographic situation on the particular place of growth and the character of the ground surface. In this paper attention will be focussed particularly on cold damage in the north of Sweden. However, it should be mentioned that the type of cold damage which occurred in 1903 was not the same as was observed in this region during the last decade and has nothing in common with basal stem girdle. The effect of cold as a cause of injury to plants on a large scale has been registered also during other years (FRIES, 1918; SYLVEN, 1924). However, cold injuries on frost localities occur rather frequently. Most often they take place in northern Sweden. Of the different kinds of cold damage in the vegetative organs of Scots pine the most common are distortion and killing of living cells in needles, buds and shoots. Injury to needles results in partial or complete loss of foliage in seedlings, plants and young trees. The same may be said of injuries to buds. Part of them on terminal and lateral shoots may be killed. Injury to phloem, cambium and cambium rays, as well as other parenchyn~atous elements of tissues, results in dieback of shoots (Figs. 5 and 6) or total dieout of plants. On the other hand, injury to old wood in Scots pine is considered a rare occurrence, but in many other coniferous species this type of damage is common and occurs in young stems (DAY, 1928). Cold damage to old wood in Scots pine has been mentioned in literature in connection with the phenomenal spring frosts in 1935 in England when "in one area a number of pines died in the autumn and were found to have been girdles at the base caused almost certainly by the May frost" (DAY and PEACE, 1946, p. 51). At the same time it is stated that "Scots pine is fundamentally resistant to late frosts regardless of its state of development" (ibid. p. 50). As regards the type of cold damage to Scots pine it is said that "... where damage was recorded it was usually very slight... and... damage was entirely confined to the side shoots." Using data obtained from extensive afforestation areas, DAY proposes to plant Scots pine and Norway spruce in frosty localities where other species are killed outright by cold injury. Severe injury by the June frost, which caused dieback of the top of pines, has occurred in Germany in frosty localities (DENGLER, 1910, 1932). The state of the development of plants and the physiological processes connected with the seasonal changes play a decisive role in the occurrence of
 and killed leader of 19601 (during the winter of 1960/61); b, killed leaders of 1956 and 1957 (during the \?")
11 a Fig. 5. Dieback of top and forked stems: a, liilled lead& of 1957 (during the winter of 195il5S) and killed leader of (during the winter of 1960/61); b, killed leaders of 1956 and 1957 (during the \?inter of 1960/61). Experimental plantation 16, provenances 38 and 23. The photograpl~s were Laken in September Fig. 6. Dieback of top, killed leaders and lateral branches: a, during the winter of 1960/61, experimental plantation 12, provenance 56; b, during the severe spring frost of 1963, experimental plantation 25, provenance 4.-
12 cold damage. It is believed that most cold damage appears during the growing season and is due to either late or early frosts. However, it should be stressed at the same time that cold injury may occur in any season (PARKER, 1963, p. 128). Cold injuries are usually classified depending on the season when they occur, for instance, damage by winter cold, by spring or late frost, and by early or autumn frost. In Sweden cold injury can be observed in the seedlings and plants of Scots pine. Cold damage occurs during some years in nurseries and on plantations, but most of all on natural reproduction areas, in frost hollows, frost pockets and on flat heathland. At this stage of development of individuals the rate of losses is sometimes considerable. However, it should be emphasized that the type of damage might be described as slight. These injuries occur in young plants susceptible to cold during the growth season, in spring and autumn, and even in the middle of summer. The cause of this type of cold damage is due to advective and radiation frosts, which often arise simultaneously (DAY, 1946, p. 14 f.). The same kind of cold damage occurring during the growth season in the north of Sweden is also to be met with in countries with a similar climate. Although the effect of cold damage is plainly visible and conspicuous, it has not yet attracted the due attention of foresters in the north of Sweden. The concealed injuries which occur not only to plants, but also to young trees, often remain quite unnoticed on frosty localities. Formation of abnormal wood and structural changes in both xylem and cortex elements may be perceived only when careful analysis of the damage is made. In the north of Sweden the most characteristic internal injuries are frost rings and bark rents. Plants and young trees having damage only of this kind usually survive. On the other hand, insect attacks on the weakened individuals and infection of the injured places by fungi can be fatal to most plants and trees injured by cold. In such cases the initial cause of death often remains unnoticed. It has already been mentioned that cold damage to Scots pine in the north of Sweden which occurs during the growth season is of a comparatively slight character. In the natural growth places where spring and summer frosts have occurred, severe cold damage to old wood, that is, girdles at the stem base, is seldom met with on frost localities simultaneously with other, slighter types of injury. The author has not met with such damage, with the exception of some cases of severe dieback of the plant top, that is, girdling of the main stem in the upper part of the tree (Chap ). Thus, Scots pine shows a very high degree of hardiness in these environmental conditions, although extremely low temperatures occur during the growth season, in some cases falling several degrees below 0" C. However, as regards the susceptibility of Scots pine to cold, mention should be made of the results obtained by DAY and PEACE (1934, pp. 16 and 52) in

13 their experiments on the artificial production of frost damage in young trees. Scots pine proved to be surprisingly susceptible to winter cold and rather susceptible to early spring frosts. The origin of seeds in these experiments was not known and the authors are of the opinion that the origin of seeds may have played a considerable part in the production of cold damage. Severe and extensive cold damage to old wood, that is, basal stem girdle, which is the subject of this paper, is identical with damage patterns described by DAY (1928) in other species of conifers, but as regards the cause of cold damage there exists a great difference between the two cases. Basal stem girdle in the climatic conditions of the north of Sweden has another time of occurrence than that observed in England and Scotland, and also a different process of development. Basal stem girdle originates in late winter and early spring, when diurnal fluctuations coincide with the thawing of the snow and the development of ice crust. The problem of the hardiness of Scots pine is rather paradoxical. During the extremely severe spring frosts in 1935 in England, and on similar occasions in the north of Sweden, Scots pine proved to be highly resistant to cold during the growth period, when plants are supposed to be susceptible to cold. But during the years of extreme climatic conditions many young trees were killed and some plantation areas were even destroyed in the north of Sweden before the growth period set in. Undeniably, basal stem girdle is the most conspicuous type of damage. It occurs not only in plants, but also in young trees. It damages and kills plants and trees even with well-developed thick bark at the time when they are wellprotected against environmental influences. Basal stem girdle may occur simultaneously with other types of cold damage in one and the same plant or tree, and in the same year. However, this principal type of damage has not yet been noticed in the north of Sweden. A preliminary report on this question was published in 1962 (EICHE), in which the damage was described as a "strangulation" phenomenon. The analysis of damage caused by basal stem girdle is continued in this paper. More extensive research material and a more thorough approach to the problem are made use of. The data were obtained from a provenance experimental series with Scots pine which includes 30 experimental plantations comprising 36 ha laid out by the Department of Forest Genetics at the Royal College of Forestry during the period Owing to the fact that each plant in the series was the object of individual attention, this specific type of damage did not pass unnoticed. Observations acquired on the experimental areas were checked by comparing then1 with the corresponding phenomena on the surrounding natural reproduction areas. A great number of provenances of different origin played a prominent role

14 in the analysis of the problem. There were marked differences in the resistance to cold between different provenances. The frequencies of damaged and killed plants were varied among the provenances tested. Differences were also observed in the intensity of the damage and in healing of the ~ounds in the injured individuals of different provenances. In addition, the manifestation of the damage showed certain deviations in different provenances. Basal stem girdle mas discovered by the author already in 1946 on experimental provenance plantations laid out by SCHOTTE and n'rncc~c in A limited number of badly-injured trees, which had not completely recovered from wounds, had survived and bore witness to old, severe cold damage. The trees belonged to provenances susceptible to cold. After the long and serere winter of considerable frequencies of this type of damage were observed on experimental plantations laid out during The plants were only four years old, and the external sign of damage was inconspicuous. It could easily he mistaken for another, and very common, type of damage, i.e., dieback of the plant top. There were also other factors which hindered the analysis of the phenomenon. But in the following years characteristic basal stem girdle damage-the circular peeling off of the bark and the infiltration of resin into the xylem of the damaged place-could be perceived in the dead plants. The type of damage of was frequently found later on natural reproduction areas. After the winter of 1960/61 extensive damage to ten-year-old trees suddenly appeared again. The further development of the experimental plantations was influenced by the severe damage of The effects of the damage were recorded every year and the data obtained comprised the period up to September The analysis of cold damage is part of the plan of the experimental series with Scots pine. The death or survival of single individuals shows in general outline the ability of provenances to adapt themselves to the climatic conditions on experimental sites. At the same time the problem of cold damageits occurrences and consequences-is closely connected with the practical aims in silviculture. However, from the point of view of silviculture, several other approaches are possible as regards cold and other weather factors influencing the afforestation of vast logged-off areas. only part of the research data accumulated from the year when the experimental provenance series were laid out have been made use of in this paper. This refers to the records obtained from the plantations, to the archive photos and to the histological analyses made in the laboratory. At the same time a lack is felt of some data on the subject, which as yet it has not been possible to collect. References to literature and to investigations upon similar phenomena fill the gap only partially. It is necessary to expand the boundaries of
15 research work into the causes of basal stem girdle. Further, it is of utmost importance to investigate this type of damage in artificial, controlled laboratory conditions. It would be most desirable to know more about the correlation between the meteorological factors on the one hand, and the origin of the damage on the other. The influence of the ecological factors on the origin of the damage, in its turn, gives rise to a desire for a deeper contact with the branches of biology dealing with cold and winter hardiness, hardening and dormancy in plants. The type of cold damage discussed in this paper is related to several branches of science, dealing with the problems of cold resistance, which are common for many countries. Of all the abundant literature on cold damage in plants and on plant resistance to cold, the author would like to mention the work of those scientists who have essentially contributed to the analysis of the problem under discussion. (References are to be found in the literature cited.) It is thanks to the British scientist W. R. DAY that the causes and the occurrence of the basal stem girdle have been examined and elucidated in several species of conifers in the climatic conditions of England and Scotland. His investigations also dealt with other types of cold damage and were carried out at the Department of Forestry, University of Oxford, during in collaboration with T. R. PEACE, and during recent years with D. K. BAR- RETT. It is most gratifying to state that the results of these investigations can also be successfully applied to the analysis of cold damage in climatic conditions in Sweden. The problems under discussion have also been thoroughly examined by the American scientist J. SH. BOYCE in "Forest Pathology". It would be by no means superfluous to remark that in the manifestation of cold damage the scientists mentioned above closely analysed the importance not only of the role of the physiogenic, but also that of the pathogenic factors. The review on "Cold Resistance in Woody Plants" by J. PARKER, Yale School of Forestry, Yew Haven, Connecticut, U.S.A., is of particular interest tothe author, since it was published when this paper was being written. Some time after 1940 the author of this paper had the opportunity of reading I. I. Tul~r~nrov's work on "Physiological Foundations of Winter Hardiness in Plants" (in Russian). By studying the experimental work of I. I. TUMANOY and his collaborators, D. A. KRASAVCEV, P. A. GENKEL and others, at the K. A. Timirjasev's Institute of Plant Physiology, Academy of Science U.S.S.R., Moscow, it has been possible to avail oneself of the achievements of the Soviet scientists as regards the problems of plant cold hardiness. hlention should also be made of "The Reports of the Conferenceon Physiology of Plant Hardiness, 3-7 March, 1959" (in Russian) and to the "Resolution of the
16 Conference on Physiology of Plant Hardiness, Adopted Alfarch 7, 1959" (in Russian). The fundamental monographs by J. LEVITT, University of Missouri, Columbia, on "The Hardiness of Plants" and on "Frost, Drought and Heat Resistance" have greatly helped the author in his search for finding references and clues to the problems connected with cold damage and plant resistance to cold. A series of studies on frost-hardening processes and frost-hardiness of woody plants have been carried out during the recent decennium by A. SAKAI, at the Institute of Low Temperature Science, Hokkaido University, Sapporo, Japan. The research work of this scientist, just as the investigations and experiments of the American and Soviet scientists, is directed towards the elucidation of biochemistry and biophysics of living cells and tissues in connection with cold hardiness in plants. "Ecological Studies on the Subalpine Zone with the 17ieru of Afforestation of Uplands" (Mitt. der Forstl. Bundes-Versuchsanst., Nariabrunn, H. 59,1961 and H. 60, 1963) comprise the works of W. TRAUQUILLINI, 1-1. AULITZKY, A. PISEIC and other authors. These investigations deal with ecological problems similar to those in northern Sweden. A. VEGIS has carried out extensive experiments on dormancy and the rest period in higher plants at the Institute of Physiological Botany in Uppsala. A. VEGIS'S works on the above problems printed in the "Encyclopedia of Physiology" and in the "Annual Review of Plant Physiology" may be looked upon as comprehensive on the subject. Investigations on the physiology of winter hardiness in relation to dormancy in woody plants is being carried out by L. I. SERGEJEV and his collaborators at the Institute of Biology, Cral branch of the Academy of Science, in the Soviet Union. In this connection "Summary on Reports at the 2nd Ural Conference on Ecology and Physiology in Woody Plants, Ufa, 1965" should also be mentioned. From earlier investigations the classical works of B. LIDFORSS, at the University of Lund, Sweden, and of N. A. MA~IMO~, at the Forest Institute, Department of Plant Physiology, St. Petersburg and later at the K. -1. Timirjasev's Institute of Plant Physiology, Academy of Science U.S.S.R., Moscow, deserve attention. The investigations on mortality in plants caused by cold, and on plant resistance to cold, were carried out by the Swedish scientist A.,$I<ERMAN, at the Swedish Seed Association, Svalov, continued there by G. XNDERSSOX. Of the investigations of several German scientists at the end of the 19th century and the beginning of the 20th, dealing with the problems of cold as the cause of damage and death in plants, those of R. HARTIG, at the Uni-
17 versity of Munich, and of A. WINKLER, University of Leipzig, are closely connected with the problems discussed in this paper. As far back as 1883 R. HARTIG described the occurrence of the basal stem girdle (Einschniirung) in transplants of silver fir and Norway spruce in nurseries, but was not sure as to the causes of its origin and was rather reserved in his conclusions. BSG CM EP 31 S PR SMH I SYRI Abbreviations used basal stem girdle cumulative mortality experimental plantation n~eteorological station provenance Swedish Rleteorological and Hydrological Institute single-year mortality = mortality in single years
18 1. General information on experimental plantations The experimental series with Scots pine was planned in 1948 by TIREN, GUSTAFSSON, LAXGLET, EICHE. When drawing up the plan for the new experimental series, experience and knowledge gained from a series of EPs laid out in 1911 by SCHOTTE (1923) and WIBECIC, as well as from the international PR experiment series laid out by LANGLET in 1938, were taken into consideration. The new series was laid out during by LANGLET, EICHE. This series comprises 30 EPs distributed over the whole country with a total area of 36 ha, of which 29 EPs occupy an area of 24 ha, and one an area of 12 ha (Figs. 7 and 8) Provenance material tested in the experiments The experimental series of include 100 PRs, originating from natural growth localities of Scots pine. Seed was procured during by collecting cones from 3,100 standing individual trees in 90 populations. Between twenty-five to thirty trees were chosen from each population. Mother trees to represent the whole population mere chosen at random. However, in some upland regions, as well as in northern regions, collection was made from all productive trees, and in some cases it appeared to be necessary to double the number of the trees in order to obtain the necessary quantity of seeds. The experimental series of , as mentioned above, included 90 populations, representing a progeny of 2,200 individual trees. Eight of these 90 populations were supplemented by seed from bulk collections. A further ten populations were raised from bulk collections only, originating from Germany and the Xetherlands (Fig. 7). An archive consisting of photos, measurements, records, cones, needles, seed, samples and analyses testing the quality of seed was established. It contains all necessary data concerning individual trees and collected seeds. Planting stocli was raised in two nurseries, one in the province of Stockholm (p: 59" 25', %: 18" lo', H,: 20 m) and the other in Vasternorrland (p: 63" 30', A: 16" 42', Hs: 200 m). The sowing of seed from individual PRs and individual trees was carried out under uniform conditions in nurseries, in seed beds side by side in simple inventory. The data on the rate of seed germination in nursery conditions and on the growth of seedlings were obtained by minute and consistent recording.
19 Fig. 7. EPs laid out during (No and No. 51) and natural habitats of populations tested in the experiments (No ). Isolines (100, 120, 140, 160, 180 and 200) show the length of the growing season ("vegetation period").

20 1.2. Design, layout and tending of the experiments On 29 EPs PR experiments were conducted in randomised blocks with restriction similar to YOUDEK square design and with 2 x 2 replications with a planting space of 2 x 2 metres and 1.25 x 1.25 metres respectively. PRs in the EPs were chosen on the basis of a definite, adopted plan. On the EPs where seven PRs were represented their composition was as follows: a local PR, two standard PRs, which were also represented on all other EPs, and two plus two PRs, whose natural habitats lie to the north or to the south of the experimental locality respectively. In both cases, that is, both in the northern and in the southern variants, one of the PRs originates from a higher and the other from a lower altitude in comparison with the altitude of EP. Whenever it was possible to introduce standard PRs in the adopted design in such a way that two more PRs could be added, they were chosen from the same latitude where the locality of the EP was situated-one from the higher and the other from the lower altitude than the altitude of the EP (LANGLET, 1952). As regards the transfer of the PRs from their natural habitat to the experimental site, the maximum accepted distance in the north of Sweden was 150 krn in meridional direction and 100 m in vertical scale (LANGLET, 1945), with a few deviations on some occasions. On EPs where the number of PRs was 2 x 7, the PRs mere chosen according to the plan mentioned above, but the remaining seven PRs were taken from more remote habitats in relation to the locality of the EP, than in the case mentioned earlier. This gave the possibility of simultaneously testing PRs transferred from reasonable distances and from remote habitats. The plantation space in two randomised blocks was 2 x2 metres, in two other blocks 1.25 x 1.25 metres. Each PR plot in the blocks of the sparse plantation contained 50 plants and covered an area of 200 m2, the plot size being 20x 10 metres, whereas each plot on the dense plantation had an area of 125 m2 and contained 80 plants, the plot size being 12.5 x 10.0 metres. Progenies of the individual trees were tested in randomised rows. In two blocks progenies of ten trees, and in two other blocks progenies of ten other mother trees from the same population were tested. Thus 13 plants in the experiment represent the progeny of one tree. This is a figure which can give some guidance in testing the hereditary characters of a tree. It should be mentioned that progeny from the same tree was also tested on other EPs. Each PR in the EP was represented by 5O+5O = 260 plants. In 1955 this experimental series was extended by an EP (Fig. 7, No. 51) with three randomised blocks, containing 20 PRs laid out on an area of 12 ha with a planting space of 2.5 x 2.5 metres. Each PR plot in the blocks covered an area of 50 x 37.5 = 1,875 m2 and contained 20 x 15 = 300 plants. In each
21 Fig. 8. EPs (No. 1-29, black dots), hiss (Table 1, circles) and isolines shoving the date when snow melted in the spring of 1961, e. g =20th April. Regions I and 11, subregions II:l, II:2 and II:3 are described in Chaps. 2, 4 and 6.3.
22 block progenies of 20 trees were tested. Each mother tree in the experiment was represented by 15 x 3 = 45 plants. It should be emphasized that the layout of the experiments was accompanied by certain difficulties. It was not easy to find a sufficiently large area with uniform edaphic conditions in the north of Sweden. It was easier to find the site for seven PRs with an area of 0.63 ha than a site for a double number of PRs with an area of 1.25 ha. Preparation of the area for the EPs was made during the period Careful scarifying was applied where necessary. Planting in open pits was carried out by using seedlings (2 and transplants (2fl and 2f2). Up to 1955 losses were replaced by transplants from nurseries; later, reserve plants grown on the site of the experimental plot were used. Fencing of the EPs with the view of protecting them against the attacks of reindeer (Rangifel, tarandus) appeared to be necessary on many EPs in the north of Sweden, and in southern and central Sweden similar protection was necessary against elk (Alces alces alces) and roe (Cupreolus capreolus). Every autumn, on all EPs north of the river Dalalven, that is, practically in the whole of Xorrland, seedlings and plants were sprayed to protect them against snow blight (Phacidium infestans), which causes injuries and plant death on a great scale in the north of Sweden. Weeding, eradication of insects, rats, mice and lemming, as well as other kinds of routine work, were carried out where necessary. Observations and assessment of EPs were carried out every year, and in some cases even twice a year. Mortality and changes in plants were examined; where possible, factors causing them were stated. Thus each plant became a permanent experimental object. PR tests ( ) were extended by an analysis of populations, based on the same PRs and on individual trees. Observations were carried out in nurseries, hothouses and in the laboratory. The problems examined deal chiefly with chlorophyll mutations, the variation of anthocyanin pigmentation at juvenile stage and formation of Lammas shoots. Grafting of pine populations, which together with their progeny constitute PR tests, was started in 1952 and has not yet been completed. A tree bank was established with the view of examining the characteristic traits of clones and of the genotypical characters of trees. Grafts were planted on the experimental field at Bogesund, near Stockholm, covering an area of 7 ha and containing about 1,400 clones.
23 2. Weather conditions during the years when plants suffered severe injury 2.1. Cold damage in connection with weather conditions It has already been mentioned that extensive, heavy and intricate injuries appeared on the EPs after the long and severe winter of 1960/61. The high frequencies of these injuries occurred in the region which chiefly comprises the uplands of the north of Sweden (Xorrland and the northern part of the province of Kopparberg, \V). Outside this region damage occurred only sporadically. Il'ithin the boundaries of the region the variation of frequencies attained in some places a most striking expression. These two statementsthe distribution of cold damage within a large region and the connection of the occurrence of the damage with the peculiar winter climate of 1960/61- will be verified in the chapters that follow. Soine types of injuries were caused by the direct effect of low temperatures, 'The dieback of the buds and of the tips of the plants is a characteristic example of this. Other types of damage originated owing to snow or ice crust, which mechanically, by its weight, had injured either the whole crown of the plant, some individual whorls of the branches, or some individual branch in a whorl. The cause of the principal type of damage, BSG, is most complicated. There is evidence which points to the combined effect of low temperatures and other elements of winter climate. The position of the damage along the stem of the tree varies. The level of damage above the surface of the ground shows that it is connected with the changes in the depth of the snow cover in late winter and early spring. Another type of damage, winter sunscald, is connected with the S or SIT7 side of the tree. This circumstance leads to the conclusion that the causes of the damage are the extreme fluctuations of temperatures in the tissues of the tree, called forth by diurnal insolation and fall of temperature in early spring. The various types of damage are by no means confined to these examples. Only most characteristic and striking examples are mentioned here. However, these examples prove that it is necessary to apply meteorological aspects in the analysis of cold damage. At the same time the traditional approach of checking the origin of cold damage with weather records should be referred to. M'hen emphasizing the fundamental importance of weather conditions in analysing the manifestation of cold damage, it is necessary to mention those difficulties and hindrances which prevent the elucidation of the role played by
24 Table 1. Meteorological stations (MS) of the SMHI, whose observation data were used for characterizing the climatic conditions on experimental provenance plantations (EP). E P 11s EP EP RIS EP &IS 11s EP RIS EP 11s EP 31s E P \IS E P \IS E P.\IS EP 31s EP.\IS.\IS E P 11s EP ;\IS E P \IS us EP 41s EP MS.\IS EP.\IS E P RIS XIS EP I<iruna, Kauppiaen Kiruna flygplats Gallivare, Linaloinbolo Gallivare, Linalombolo Nalmberget Korpilombolo, Ohtanajarvi I<ompelusvara Pajala KBbdalis, Rahaberget Suddesjaur Alvsbyn, Asplovberg Xlvsby skogsskola Tarnaby, Snebacken Tarnaby Lh~gsjoby, Ronnhagen LAngvattnet Lgcksele, Storberget ulvoberg Vindeln, Svartberget I<ulbackslideu Robertsfors Lo~Hnger Harrsjon Gadclede 3lunsvattnet Vallboglrden *%re Bispgarden, Torresjolandet Fanbergstorp Bramoil Bramo Haljum hls._ 012 Gavle Idre, HiminerAsen Grovelsjon Bunkris Sarna Trangslet Orsa, HogstAsen Mora Gravendal Lejen Skattlosberg Alvkarleby Symbols used in Table 1: Province BD (= 0 for &ISs)- Norrbotten Province X - Gavleborg AC (- A for &ISs) - Vasterbotten C - Uppsala Z - Jamtland P- North latitude Y \'asternorrland 2 - East longitude from Greenwich \t' - Kopparberg Hs - Altitude in metres

25 weather factors. In the first place it should be stressed that no special meteorological observations, connected with the PR experiments discussed in this paper, were carried out. It was intended to furnish each EP with some kind of automatic meteorological equipment, registering weather conditions. It was impossible to carry out these plans on account of technical hindrances. The only information obtainable on weather conditions was procured from SMHI. It should be emphasized that the available meteorological data are insufficient for the purpose of elucidating the relation between the cause of damage and its manifestation. Most of the MSs are situated in populated places where local climate is different from that in the woodlands, and often lie at a considerable distance from the EPs. The author's choice of the MSs fell on those which might best characterize weather conditions on the EPs under discussion (Table 1, Fig. 8). To some EPs it mas possible to apply weather records from two neighbouring stations. The con~parison between the meteorological data obtained simultaneously from two 3ISs gave a more reliable account of the weather conditions in a certain territory. It is well known that many site factors can considerably modify the general climate even in a limited area. The topographical situation of the site, the microtopography on the EP and the surrounding vegetation are of importance when considering the origin of the damage. Site factors exercise a considerable influence on the piling up of snow in winter and on the accumulation of the cold air during frost spells in the growth period. \Vhen interpreting certain types of cold damage, reference will be made to site conditions on individual EPs. However, weather conditions in the vast region where extensive severe damage occurred have certain features in common. From the available meteorological data that are closely connected with the cause of cold damage, diurnal fluctuations of air temperature and the nature of the snow cover best of all characterize the general climate of the region. Data on air temperatures are shown on diagrams in Figs Diurnal maximum and minimum temperatures express the daily fluctuations of temperature and also the variation of temperature during the seasons of the year. A diagram on the depth of snow cover supplements the diagram on temperature. Both diagrams are synchronized. Their values refer to the same date. The amount of precipitation as well as mean air temperatures are given for a single month and are shown on the diagram above the horizontal axis. These values are supplemented in some diagrams by average values for the period Each diagram comprises a time interval beginning in July and ending in June in the following year. Thus a year makes a complete

26 annual~cycle of the biological processes connected with cold hardiness in plants. The summer season is connected with the growth processes in plants, while the hardening processes set in during the autumn. The physiological processes which take place in plants during these seasons follow each other in a certain sequence. It is a well-known fact that the degree of cold hardinesswhich plants attain in the autumn is decisive for their resistance to cold and other unfavourable weather conditions in winter and early spring. Xevertheless, frost can injure plants as early as in the summer or early autumn, when they are susceptible to cold. Sudden drops in temperature and severe cold waves in late autumn, before the plants become winter hardened, may be the cause of severe damage. The appearance of BSG in Scots pine in 1960/61 is closely connected with the fluctuations of temperature and with the thawing of the snow in late winter and early spring of that year. Unfortunately, the available meteorological data characterizing those seasons are incomplete and this renders it difficult to estimate the damage fully. With the advance of the spring season the physiological activity in plants increases and simultaneously their resistance to cold diminishes. Teather conditions during this season are characterized by intermittent warm and cold periods. Particularly destructive are periods when early warm spells are followed by cold waves. The spring frost of 1963 discussed here serves as an individual example of how cold damage, a typical case of the dieback of the plant top, and formation of abnormal wood occur. It is important to note that the maximum and minimum temperatures supplied by MSs and expressed here in diagrams are screen temperatures and refer to standard level, i.e., cm above the ground. It is well known that actual differences between extreme diurnal temperatures in ground air zone, i.e., 0-50 cm above the ground, are greater than those taken at standard level. According to data mentioned in literature on the subject (TICHOMIROV, 1963, p. 65) the difference between temperatures on standard level and in ground air zones can attain 40" C in arctic regions. In England during the May frosts of 1935 the maximum difference between minimum temperatures at both levels attained 6.5" C (DAY and PEACE, 1946). During radiation frosts the temperature in the ground air zone is considerably lower than at standard level, but on sunny days it is higher. Inversion of air temperature at both levels occurs in connection with its extreme diurnal fluctuation. Heat absorption on a sunny day and loss of heat during the night owing to outgoing radiation when the air is clear and still, are dependent on the topography and on the surface of the ground. In this particular case the ground
27 is covered by snow during that season of the year when BSG occurs. The depth and the structure of the snow cover, the physical qualities of the surface of the snow, albedo and the capacity of heat conductivity, together with the fluctuations of the temperature of the air, constitute the intricate climatic environment and take part in calling forth cold damage in the stems of the trees at the nearest level above the ground. Meteorological observations furnish us only with infornlation about the depth of snom cover. The data on snow cover are shown in diagrams for each day. The dynamics of snow cover are revealed both in the increase of its depth owing to precipitation, and in the diminishing of the depth of the snow cover. Of these two processes the most important is the thawing of the snom cover and its packing up. These phenomena are connected with the variations of air temperature, particularly during those days when diurnal maximum and minimum temperatures are above 0" C. Attention should be paid to extreme fluctuations of diurnal temperatures during the thawing periods of the snow in early spring. Behind this outward facade, i.e., the fluctuations of temperature and the alterations in the snow depth, important changes take place in the structure of the snow cover. These changes are closely connected with weather conditions, when shorter or longer thaw periods are followed by cold m7aves. During normal weather conditions the snow cover, on the other hand, preserves its porous structure until spring and protects against cold those parts of the plant lying under it. No meteorological data are available on the structure of the snow cover, with the exception of some records made by reporters from ShIHI observation stations. Valuable information on the qualities of the snow cover is supplied by A. HAMBERG (1907) and H. E. HARIBERG (1912). A. HAMBERG gives an analysis of the weather conditions during a period of four years in the Sarek mountain region (north of latitude 67"). In these altitudes winter cold is, as a rule, continuous, and periods of thaw occur rarely and in odd years. In the coniferous forest zone (altitude lower than 550 m) snow forms a layer of uniform depth and melts away in May. On the mountain plateau, i.e., in snow dune zones (altitude 550-1,850 m) the wind transports the snow and forms complicated, compact snow drifts and also influences the thawing of the snow. The studies of H. E. HAMBEKG in 1910/11 comprise northern Sweden, but refer chiefly to the province of Norrbotten. During years of intermittent thawing periods in winter and spring, when snow melts interruptedly, a snow crust and an ice crust are formed. Thus the structure of the snow cover becomes most intricate, since several strata of ice crust, with layers of compact snow between them, are formed. Even in late winter, in the month of March, the wind thickens the snow cover with new compact layers of snow. During
28 some years ice crust is formed directly on the ground already in October, when the first snow has partly melted away. On the elevated places of the ground surface the mass of wet snow remains on the ground in patches and it is here that the ice crust is formed. In the depressions of the ground, on the other hand, after the periods of thaw, the remaining part of the snow cover is thicker and here the ice crust is formed over the snow cover. \\'hen snow melts, its structure changes. The intermediate layers of snow disappear gradually and the ice layers melt together. The water resulting from the melting of the snow filters through the snow cover and is amassed above the ice crust on the ground. As regards the structure of the snow, considerable variations have been observed even on small areas. Judging from the scarce information obtainable in literature, the packing up of the snom cover and the formation of ice crust is a well-known phenomenon not only in Scandinavia, but also in vast regions of northern Europe. In the arctic regions of the Soviet Union the accumulation of thick snow layers in the depressions of the ground is connected with the delayed thawing of the snow in late spring and summer and with the transformation of snow into ice (TICHOMIROV, 1963, p. 73). The negative effect of ice crust on the vegetation in other climatic regions of the Soviet Union is mentioned by GALACHOV (1959, p. 174). A new perspective on ice crust as an ecological factor causing cold damage is opened up by Tuiu~xov's investigations into winter cereals (1940, 1951, p. 46). Much attention has been devoted to this question and the necessity of further investigations has been stressed. (Ref.: Resolution of Conference on Physiology of Plant Hardiness, Adopted March 7, 1959, in Leningrad. Fiziologija rastenij, 8: 5, p. 644.) The connection between the cold damage of 1960/61, on the one hand, and the fluctuations of temperature and the thaw period of snom, on the other hand, is evident. When examining the position of the damage on the stems, it is easy to reconstruct the level of the snow cover during the time damage occurred. Frequencies of injuries are often correlated to insignificant variations of the ground surface. Depressions in the surface of the earth, areas on the lee side etc., favour accumulation of snow and delay its melting in spring. It is important to note that sites with thick snow cover are not always identical with the sites in the microtopography of the ground surface, where cold air is amassed during radiation frosts. On natural reproduction areas high frequencies of BSG can be registered not only in hollows, but also on N and NE slopes, where the melting of the thick snow layer is delayed. A striking example is the manifestation of BSG on flat areas along narrow belts of snowsheltering fences by the roadsides (Fig. 25). The geographical aspect of the manifestation of cold damage is shown in Fig. 8. Isolines showing the date when snow cover melted in the spring of

29 1961 also express the gradient of the frequencies of the BSG on EPs. The isoline of April 20 draws an approximate demarcation line for the region where severe cold damage had occurred. Outside this region, approximately to the south of 61" N latitude, damage occurred only sporadically. Insignificant damage also occurred north of latitude 61" N, in the transition zone, along the Gulf of Bothnia. This conclusion was arrived at owing to the data on CR4 rate in plants obtained from EPs. EPs 9 (Fig. 36), 10 (Fig. 37), as well as 14, (Fig. 38) are situated outside the region of cold damage. EPs 11 (Fig. 39), 17 (Fig. 40) and 18 (Fig. 41), located in the transition zone, belong to the region of cold damage, although frequencies of damage and death-rates in plants are not particularly high here. The uplands of northern Sweden constitute the region where the manifestation of BSG predominates. Isolines in Fig. 8 show the connection of this phenomenon with the delayed melting of snow cover in the spring of EPs 22 (Fig. 42), 12 (Fig. 43), 13 (Fig. 44), 16 (Fig. 43, 20 (Fig. 47), 21 (Fig. 48), 24 (Fig. 50), 25 (Fig. 51) as well as EPs 26 and 29 (Figs. 52 and 53) and EP 27 (Fig. 54) are characteristic examples of the severe cold damage of Nevertheless, it would not be out of place to point to some exceptions. On EPs in mountain districts damage and mortality rates were not high. This refers to EPs 15 (Fig. 56), 19 (Fig. 57) and 23 (Fig. 58). One is inclined to think that several causes might explain these divergencies. General climatic conditions in these districts are less liable to thawing periods in minter. The microclimatic conditions of the site provide better protection against wind and exclude the accumulation and compression of the snow. In connection with the occurrence of cold damage under discussion, attention should be paid to solar radiation as one of the weather factors which exercise considerable influence in late winter and early spring, when the soil is covered by snow and the air temperature is lorn. As an example of this should be mentioned the months of April and parts of the months of May in 1961 and 1962 (Figs. 13 and 14) in northern regions. The differences between diurnal extreme temperatures in the diagrams give indirect evidence of the frequencies of sunny days. Although strong solar radiation during this season appears almost every year, presumably it exercises a negative influence only during certain years. Owing to the direct absorption of the solar radiation the temperature in the different parts of the plant in the middle of the day can be higher, for instance, 5" C and more, than the temperature of the air (ODIN, 1964; TICHOMIROV, 1963). When insolation ceases the temperature falls rapidly. The sudden changes of temperatures and their considerable amplitudes cannot but affect harmfully the sensitive parts of the plants.

30 In 1962 a high mortality rate of plants injured during the preceding year was registered. This phenomenon should be considered as the direct effect of the BSG of the year 1961, irrespective of the weather conditions of At least in part of the plants a deterioration of the old, unhealed wounds was noticeable at the same time. The development of large frost canker from small canker (Figs ) must to a great extent be explained by the weather conditions in the spring of The more extensive dieback of the upper part of the crown, where cold injury and mechanical damage had occurred in the previous year, should be explained in the same way. It is well 1tno.vr-n that parts of the plant which have previously suffered cold injury or mechanical damage are most susceptible to cold (DAY, 1934). It is undeniable that in the case of dieback of the crown an important role mas played by the disturbances in the moisture balance of the injured trees during late winter. A more intensive dehydration in the injured parts of the trees is a well-known phenomenon (LEVITT, 1956, 1958). However, ne\t manifestations of cold injury caused by solar radiation and fluctuations of temperature in the late winter of 1962 were insignificant. They were limited to the browning of the foliage in young trees on the S and S\Y sides. On some sites bud-killing and bark injury were observed. The manifestation of damage was connected with the microtopography of the site. Late spring frosts in 1962, which caused considerable damage in southern regions, had little effect in the north of Sweden. New manifestations of cold damage occurred in At the same time the dying-back of trees damaged in 1960/61 proceeded as an inevitable result subsequent to severe BSG. The types of damage of 1960/61 and those of 1963 might, at first glance, seem identical. However, the injuries of 1963 were a typical case of dieback of the leading shoots. Their cause and manifestation were so evident that they might serve as a demonstration object. They occurred at the end of May and in June as a result of a cold wave, which set in after an early warm period in the beginning of May (Figs ). Most frequent were slight injuries, killed leaders, often in combination with killed lateral branches. There were also cases where the whole tree was injured beyond recovery. In frost localities damage mas recorded even in trees of a height of 5 metres. Formation of abnormal wood, i.e., of frost rings, complemented the types of damage mentioned above and gave evidence as to the time of its commencement and its character. The most intense damage had occurred in the N\V part of northern Sweden. The isoline, showing +3" C deviation of main air temperature in May from the normal (Fig. 91, marks the approximate limit of the distribution of the damage within the region in SE direction. The actual temperatures in the be-
31
32 ginning of May were strikingly high (Figs ), which induced an early start of growth in trees. Particular attention should be paid to a limited district in the province of Norrbotten, shown by +Go C isoline (Fig. 9). EP 27, situated in the district in which most frequent cases of frost injuries had occurred, serves as a representative example of this damage (Figs. 54 and 55, Table 18). In the second half of July in 1964 new manifestations of cold damage, analogous to those of the preceding year, occurred. They were almost exclusively limited to frost localities and their frequencies were insignificant. It is difficult to give a comprehensive answer to the question as to what extent the spring and summer frosts of 1963 and those of 1964 affected the trees damaged in In some of the trees, girdled and cankered in , the healing of the wounds \yas so successful that after four growing seasons in the autumn of it was difficult to find outward signs of the damage. Simultaneously, in some of the damaged trees, frost canker developed further and the dying-back of the trees proceeded. Concluding this report on cold damage in connection with weather conditions during 1960/61 and it can be inferred that two principal types of damage are the most important. Firstly, BSG, which occurred in when trees on EPs were ten years old. High death-rates in trees and the extensive geographical distribution characterize this type of damage in Scots pine, which is rather unfamiliar. Secondly, the diebacli of the top of the trees, that is, of the leading and lateral shoots, which occurred in 1961, 1963 and The age of plants on EPs was 10, 12 and 12 yearsrespectively. The trees had already grown out of the dangerous air zone and death-rate in plants was insignificant, except on EP 27 (Fig. 55) Weather in single years For technical reasons, from all available meteorological data (Table 1) only 13 diagrams, elucidating weather conditions during single years from 1960 to 1963, and two diagrams from , are used in this paper. They are chosen with the view of illustrating graphically weather factors connected with the occurrence of cold damage in single years. Yaturally, a few diagrams do not embrace all possible variations of weather conditions prevailing at that time, but give only representative examples. Short eluciclatory comments supplement the contents of the diagrams, showing weather conditions by means of curves month after month, in succession. Most attention is devoted to weather conditions during 1960/61.
33
34
35
36
37

38 Figs Weather during 1960/61 RISs: \;V 107, d 435, 0 521, 0 726, 0 575, situated vithin the region of severe BSG In the months of July and August air temperature was higher than normal. The thermal excess in Norrland mas +2 -$3.50 C. Precipitation amounted to % of the normal. ("Normal values of temperature and precipitation" are mean values for the period ) An exceptional position is held by a belt in the north of Korrbotten, on the site of EPs 25 and 27, where the summer was warm and sunny and precipitation normal. September was somewhat warmer than normal, with a mean temperature from lo to 2' higher than normal. Precipitation was approximately 70 % of the normal. The weather was cloudy, with insignificant differences in maximum and minimum temperatures from September 1st to 27th (Fig. 10); from September 11th to 27th (Fig. 13) and from September 21st to 27th (Figs. 11 and 12). This peculiar cool, "greenhouse" weather period was suddenly interrupted by a cold wave. In the NE part of the region the temperature dropped more gradually (Fig. 13). In October the mean temperature was 2'-5' C lower than normal. Precipitation amounted to 60 % of the normal and in the NE part of the region to only 10 % of the normal. In the southern part of the cold damage region the first snow, and rain mixed with snow, fell as early as the 5th of October. The formation of snow cover began on the 9th (Figs. 11 and 12), the 11th (Fig. 10) and the 21st of October respectively (Fig. 13). Snow fell in great quantities, but partly melted away between the 14th and the 18th of October (Figs. 10 and 12). \17hen cold set in, the snow packed up by thaw and rain congealed and a possibility arose for the snow crust Lo be formed in different variations, often on ground which was not yet frozen. In November cold and warm periods alternated intermittently. The mean temperature of this month did not differ considerably from the normal. The amount of precipitation in Norrland was 168 % of the normal. However, the amount of precipitation in the northern part of the province of Norrbotten reached only 46 % of the normal, but in the south of Norrland it rose at the same time to three times above the normal. The changes in the depth of the snow cover, caused by thaw, are shown in Figs. 10 and 11. The mean temperature in December mas normal, or somewhat higher than normal. Precipitation in Norrland was 128 O/, of the normal. It was reported that large quantities of snow impeded forest exploitation. The periods of thaw were similar to those in November. In January an unusual spell of warm weather prevailed for a short time, beginning with January 15th, when the temperature rose suddenly and then fell abruptly (Fig. 10). During the thaw rain cleared the trees of snow (Reporter: Borgardet, IT). The temperature fluctuated considerably even in the second half of the month. The mean temperature in January was lower by 1"-2' C than normal. The depth of the snow cover increased at the beginning of the month. The snow cover was compact and granular (Reporter: Vinliden, AC). To all appearances the layers of ice crust had already been formed in November and December, and thaws in January, in their turn, made it more compact.

39 February began with cold spells, northerly winds and snowstorms, followed by a period rich in precipitation and hard south-westerly winds. About the middle of the month came a lengthy warn1 spell, interrupted in places by snowstorms and westerly and south-westerly winds. In clear weather considerable fluctuations in diurnal temperature were noticeable. In central Norrland the mean temperature of the month was 5'-6' C above the normal. Precipitation in the whole of Norrland was 116 O/, of the normal, at some places with a variation from 104 % to 139 %. I11 the beginning of the month the depth of the snow cover increased, but after snowstorms and during the thaw period the snow was packed up and cox ered with a glass-like hard ice crust (Reporters: Vinliden, AC; Duved, Z; Bolestrand, Z and other ineteorological stations). During the thaw period sludge from the melting snow formed under the snow in a thick layer (Reporter: Kosa, Y). The rest of the snow cover consisted of frozen crusty snow under which the soil was not frozen (Reporter: Flath, IT). The meteorological accounts of the weather reporters supply valuable evidence, which compensates for the somewhat scarce data on the qualities of the snow. In the beginning of March the unusual warm spell for this time of the year continued, with south-westerly and westerly winds. In the mountain regions frequent snowstorms with plenty of snow occurred. From the 12th of March a cold wave set in in northern Norrland, which expanded to the south. The cold wave, coming into contact with the moist air over southern Norrland, caused a snowfall on the 18th of March. The rest of the month was stormy, with low temperatures. Although a cold wave set in in the end of the month, the mean March temperature was higher by 2'-3.5' C than normal. The depth of the snow cover diminished in connection with the thaw. Snow was packed up, forming a hard ice crust. The accounts of several reporters give the same inforination with some rariations. The ice crust in some places was so hard that a horse-drawn sledge loaded with lumber did not break it (Reporters: Vinliden, -4C; Bredtrask, AC). In April the cold wave continued with north-westerly winds. From the 14th to the 17th of April a cyclone from the west brought with it snow and was followed by a cold wave. Another dry and warm wave from the south resulted in a spell of warm weather. From April 23rd to 25th maximum recorded temperatures in southern Norrland were +lgo-+22' C. Then came a cold wave from NE, moving to the south and causing a considerable fall in temperature. During the last days of the month the temperature repeatedly fluctuated from +Is0 C to -10' C. On sunny days the fluctuations of diurnal temperatures were most conspicuous, and a rapid thawing of the snow cover was recorded. The weather in May was mixed, with intermittent short spells of warm and cool weather. Rainy periods were followed by spells of dry, fine weather. The minimum recorded diurnal temperature was -3.5' C. I11 the north of Norrland snow cover melted away slowly and gradually (Reporter: Korpilombolo, BD). In the beginning of June a spell of unusually warm and sunny weather was experienced. From the 10th to the 30th of the month the weather was unsettled. Light night frosts were recorded in Norrland. However, no new cases of cold damage were observed. The mean temperature in June in Norrland was 2.5' C above the average. The diagrams discussed (Figs ) contain many coniinoii features as regards fluctuations of inaximuni and minimum temperatures and thaw
40
41
42
43 periods, as well as regarding the changes of the depth of the snow cover. When summarizing the report 011 weather conditions during 1960/61, it should be definitely stressed that no new cases of cold damage occurred on the EPs after the snow had melted in the spring of From the 15th of May to the 20th of June that year mortality rates and injuries to plants were carefully examined. On some EPs the checking-up was made immediately after the snow had melted. Already at that time the fresh, open rents at the basal part of the stem and the high mortality rates in PRs susceptible to cold were striking. The characteristic traits of girdling and frost canker appeared only later in the autumn and the years to follow. Fig. 15. RIS S 012, situated outside the region of severe BSG It is evident that the diagram on Fig, 15 differs from those on Figs The gradual fall of temperature in the autumn is conspicuous. The duration of snow cover was short, in fact not longer than three months. The depth of the snow corer was only half of that at other stations. However, the periods of thaw alternated even more frequently, but the minimum temperatures were not so low as on previous diagrams. The few cases of the girdling of the main stem on EP 10 attract attention, since they appeared on two different levels above the ground surface. In some of the damaged trees the position of the girdle on the stem corresponded to the maximal depth of the snow cover. The damage probably occurred in connection with thaws in January aud February (Fig. 15). On other trees the damage occurred on the ground level and probably in March. Damage of the latter kind was also observed in seedlings on natural reproduction areas in the vicinity of the EP 10 (Fig. 28). It should be mentioned that girdling of the main stem on a higher level above the ground surface is the only modification among this type of cold damage, which sporadically occurs in districts lying farther to the south of the region of severe cold damage of 1960/61. Weather during 1%1/62 Figs. 16 and 17. RISs: W 107 and 0 '726 It has already been mentioned that no new manifestations of severe cold damage were observed. The two diagrams (Figs. 16 and 17) are chosen to illustrate the differences in weather conditions between twelve months in and the preceding twelve months, when severe cold damage occurred (Figs. 10 and 13). RISs Sarna, W and Kompelusvara, 0 (BD), whose weather records are made use of in the diagrams of the two corresponding years, are situated within the region of BSG of 1961 at its most remote points in a south to north direction. However, it should be stressed that the differences between the weather conditions during the two years under discussion were, according to the records supplied by other MSs, which geographically lie between the two stations mentioned above, similar to those shown in Figs. 16 and 17. In the summer and autumn of 1961 (Figs. 16 and 17) the precipitation of rain mas moderate. Temperature fell gradually until the winter season set in. This circumstance had a great and beneficial effect on the hardening processes which took place during this season. Snowfalls began as late as December (Fig.
44
45
46 -30 J ~C/rnm i00pejo +98"/iO, ~96"/640,,, +lio~?o,, +ji?j'930,,,,, I 1 1: i :i a el A M 3 3 A 11 Fig. 20. IYeather during spring and surnmer, his 0 i22, Nalmberget. Fig. 21. Weather during spring and surnmer of _\IS 0 555,.klvsb\ skogssliola. (Data on the amount of monthly precipitation from.4pril to August 1963, nhich are not shown in the diagram, are as follows: 20, 26, 18, 18, and 93.)
47 16). There were no thawing periods during winter. Maximu~n temperatures above 0" C were recorded during a few days only. In their accounts reporters did not mention any formation of ice crust. Fluctuatioris of temperature began in April, when large quantities of fresh, loose snow fell. Thus, the composition of the snow cover was quite different from that of the preceding year. Solar radiation and slight cold injuries have already been mentioned in Chap. 2.1 of this paper. Weather during Figs %: W 107, 0 726, and Weather conditions in until May 1963 were almost similar to those in No new cases of the girdling of the main stem occurred, and according to the data furnished by the diagrams and to the accounts of the reporters, they could not be expected either, since the necessary prerequisites for their manifestation were lacking. However, in 1963 there were considerably more manifestations of cold damage caused by spring frosts than in other years. The causes of damage and its extent have been mentioned previously (Chap. 2.1, Fig. 9). The early spring of 1963 turned out to be exceptionally warm. The early wave of warm weather in May is shown on the diagrams in Figs In the region of cold clamage in 1963 the mean temperature was considerably above the average and was the highest recorded for the past 100 years. It might seem that the minimum values of the temperature frorn the 11th to the 20th of June were not sufficiently low to cause cold injury to trees. Nevertheless, one might assume that the extreine values of temperatures below 0" C during frost periods on the EPs had been considerably lower than on the sites of the RISs, since some of the EPs are situated on frost localities. At the same time it should be mentioned that on EPs surrounded by forest stands, and thus protected against the wind, even the maximum values of temperatures during the warn1 wave were probably considerably higher than those recorded on the sites of the 1LISs. Weather during 1959/60 Fig. 22. &IS During this year neither severe girdling nor injuries of dieback of plant tips had been observed on the EPs. According to outside information, some BSG cases were observed on natural reproduction areas. The author, however, did riot succeed in finding manifestations of cold damage which might have originated in Weather records shown on the diagram were obtained frorn Kompelusvara station, 0 726, which is situated in the district where the abovementioned possible cases of stem girdling might have occurred. However, the data on the diagram do not furnish convincing evidence in connection with the possibility of the manifestations of BSG in this year. On the other hand, the weather conditions in the early winter were such as might contribute to the formation of ice crust in connection with October and Xovember thaws. The sudden fall of temperature in the middle of October, in its turn, was not favourable for the development of hardiness in plants. But no thaws occurred during the whole winter up to as late as the second half of March. In February and March of 1960 the author, during his stay in Norrland in the region under discussion, could observe that the snow cover in woodlands had reached a
48 depth of 1.3 metres. The snow was unpacked and skiing was impeded by the loose composition of the snow. It is difficult to imagine that in connection with thawing in the second half of March, followed by a cold spell, the con~position of the snow cover would have been similar to that of 1960/61. Another point of great importance is that the fluctuations of temperature during the period of thaw in April and May were very moderate. Weather during Figs. 23 and 24. MSs: \\' 107 and It has already been mentioned that severe BSG occurred duriug this year. However, no attempts were made during that time to elucidate the geographical distribution of the damage. The diagrams (Figs. 23 and 24) illustrate weather conditions in the regions where such damage occurred. JVhen comparing the two diagrams with the diagrams (Figs. 10 and 12) of the same hlss during 19601'61 several similarities might be established. Attention should be paid to thaws in October, November and December and to the fluctuations of the temperature in April during the period of thaw. During his stay in Norrland in October 1934 the author had the opportunity of observing the formation of the ground ice crust in some districts. The melting of the snow cover in the spring of 1955 was delayed, as was the case in Extreme weather conditions causing severe cold damage in general IVhen suminarizing the role of the weather factors in the manifestation of severe BSG, these factors should be approached from three different points: 1. Weather conditions during the hardening processes in plants before the occurrence of cold damage. 2. ll'eather conditions causing cold damage. 3. Weather conditions after the occurrence of cold damage and their influence, favourable or unfavourable, on the recovery of plants and healing of wounds. With the view of concentrating attention on the most important part of the problem, the role of weather factors causing cold damage is approached in the first place. The histological analysis of the BSG (Chap ) shows that its occurrence is connected with the death of cambium and phloem, or with the injuries in cortex elements. Damage round the stem occurs at different levels above the ground. The cause of this type of damage is the effect of low temperatures on living cells. BSG occurs only when extreme weather conditions prevail. RIoreover, to cause this type of damage the weather factors must exercise their influence on a limited area on the stem at a certain level above the ground. In some coni-
49
50
51
52 fers in England this type of damage occurred during spring frosts, after cambial activity had begun. Cold damage occurred most frequently on sites where the ground vegetation consisted of coarse grasses. The level of the damage on the stem above the ground coincided with the tip level of the grasses, that is, with that level in the ground air zone where extremely low temperatures were recorded during the frost period (the so-called grasses temperature) (DAY, 1928: DAY and PEACE, 1946). BSG in Scots pine, the subject under discussion in this paper, occurs before the snow has melted and before the growth period sets in. Even in this case the decisive role in killing-off the living cells mas played by the low temperatures. The effect of low temperatures is not single, but occurs repeatedly; in winter when periods of thaw and cold alternate, and in spring during the fluctuations of diurnal temperature when snow melts (Pigs ,21 and 22). Snow cover in the north of Sweden plays the same role as the canopy of grasses in England, that is, it determines the level of the BSG above the ground. However, the role played by the snow cover is much more important and intricate. Actually, it is packed snow which, during the period of thaw and with the infiltration of water from melted snow and subsequent freezing, is turned into a strata of ice and snow layers and, in extreme cases, into entire ice crust (H. E. I-IAMBERG, 1912). During winters with normal temperature the snow cover remains unpacked up to as late as the end of April. Ice crust on snow appears only in late spring during iluctuations of diurnal temperature (A. HARIBERG, 1907). AGEII (1964) in "Sfudies on fhe Climate in h70rth and Central Sweden" gives mean values covering a ten-year period (1946/ ) on the qualities of the struc- ture of the snow co-ver. The frequency of the type of snow cover, "Snow crest carrying a person", was below 10 % in March, and in April approximately 20 %. In some regions in Norrland such snow crust was formed as early as in December, January and February, but its frequencies were insignificant. It has to be remembered that the year 1953/55 with variable weather conditions and a striking manifestation of severe cold damage also belongs to the period mentioned above. However, mean values do not furnish any information on the question as to n hat extent the year differs from the other years during this period. For those parts of the plant which lie under unpacked snow corer, the latter provides a good protection against low temperatures and their fluctuations. This kind of snow cover also protects trees against the action of wind. This protection is particularly decisive for vegetation in the north of Scandinavia at timberline (KIHLMAN, 1890). On the other hand, during those winters when snow is packed up and turns into an ice crust, it does not exercise any protective influence at all. Ice crust formed on the ground becomes
. Most often one must reckon with the combined effect of these two factors upon the formation of the snow cover.")
53 most dangerous for the plants (TUMANOV, 1940,1951,1959; GALACHOV, 1959; TICHOMIROV, 1963). Wind and thaw are principal agent factors which decide the character of snow (A. HAMBERG, 1907; H. E. HAMBERG, 1912). Most often one must reckon with the combined effect of these two factors upon the formation of the snow cover. However, during the years of severe cold damage the decisive role in the formation of packed snow is played by the thaw. The diminishing of the depth of the snow cover is functionally connected with the setting-in of thaw (Figs ,23 and 24). Records of the MSs furnish us with information regarding the depth of snow and its dynamics. The accounts of the reporters give insight into the intricate and extreme forms of the changes in the characteristics of the snow cover. The topography of the sites on which EPs are situated is varied. Some of the EPs were laid out on large clear-felled areas, which came into being recently in connection with modern logging methods. On these logged-off areas the wind can easily transport snow and pack it up. The variation of microtopography favours an uneven accumulation of snow with different characteristics, which make themselves felt during alternate periods of thaw and cold. We may assume that the formation of snow cover on logged-off areas takes place in circumstances which resemble those existing in the zone of snow dunes above the timberline, described by A. HAMBERG (1907). This is particularly true as regards EPs situated on high altitudes, that is, near the timberline. In this connection it may be appropriate to emphasize that the EPs, which are situated on large logged-off areas, show a higher rate of plant mortality as a result of severe cold damage than other EPs. These are EPs 29 (Fig. 53), 26 (Fig. 52), 25 (Fig. 51), 24 (Fig. 50), 20 (Fig. 47), 16 (Fig. 45) and 12 (Fig. 43). However, EPs 12, 16, 20 and 25 differ from other EPs as regards their singular position in topography and the surrounding vegetation, consisting of thin stands, left intact after logging, which provide shelter against the wind, but at the same time favour the accumulation of considerable masses of snow. It would be precipitate to draw the conclusion that snow is packed up exclusively by the wind and that the wind is the decisive factor in the production of severe cold damage. The manifestation of cold damage occurs in years with extreme climatic conditions. Of all available meteorological data, the fluctuations of the temperature and the periods of thaw in winter and spring mark the difference between the years when severe cold damage occurred and those with normal climatic conditions. However, the problem of plant mortality on these EPs is most intricate. Attention should also be paid to other external factors which are different on

54 Fig. 25. Varying degrees of severity and varying length of the portion of BSG in trees along narrow belt of snow-shelteringfences by the roadside in the vicinity of Moskosel, in the province of Norrbotten. each individual plantation. It should be remembered that site conditions which determine the accumulation of snow on EPs undergo certain changes in connection with the unequal density of plants on PR plots. PR plots with insignificant losses of plants, before the manifestation of severe cold damage, serve as shelters against snow in winter. The thick snow cover frequently piles up in the belt lying close to such plots, just as is the case in connection with snow-sheltering fences by the roadsides (Fig. 25). It has been stressed in this paper that one of the weather factors exercising a decisive influence on the occurrence of severe cold damage is the length of time the snow cover and ice crust remain on the ground in spring. This refers to the manifestation of damage on EPs in connection with the variations in microtopography and uneven distribution of the snow, and this also refers to the geographical distribution of the cold damage (Chap. 2.1, Fig. 8). Extreme weather conditions in 1960/61 were caused by cyclonic activity in
55 the North Atlantic and in the north of Europe. In northern Sweden it brought about a variation of temperature and precipitation, which resulted in deviations from normal climate, particularly in winter and early spring, with alternating periods of thaw and cold. In summer and autumn, on the other hand, these differences were not equally represented in the region of severe cold damage. The sudden fall of temperature in October, which occurred in the southern (Fig. 10) and central part (Fig. 11) of the region was not so conspicuous in the northern part of the region (Figs ). It is true that in the different parts of the region differences existed in the intensity and modification of the cold damage. However, it would be hasty to assert that, on the basis of the differences of temperature in the autumn in the individual parts of the region, different hardening processes are alone responsible for the modifications in the types of thc damage. Weather conditions in (Figs. 10 and 12) and those in (Figs. 23 and 24) have some common characteristics, which were the cause of the occurrence of BSG in those years. The scope of the damage and its distribution were not gone into in In addition, information on the characteristics of the snow corer in is scarce. When estimating the significance of extreme weather conditions as regards the occurrence of severe cold damage, available meteorological data, the accounts of the reporters, and literature dealing with allied problems mere used. Nevertheless, these data provide only a small foothold for considerations regarding the kind of weather conditions when damage occurred. The weather diagrams which contain data on diurnal fluctuations of temperature and on the depth of the snow cover give indications, firstly, regarding the changes which might take place in the snow cover, and secondly, of the time of the possible occurrence of the cold damage. On the other hand, the accounts of the weather reporters give indications regarding the changes in the snow cover, and they also supply evidence regarding the extreme weather conditions requisite for the occurrence of cold damage. The analysis of the types of the damage and its modifications supply, in their turn, direct evidence on the relation existing between the cold damage and the weather factors.
56 3. Injury to plants and damage patterns Of all the various kinds of damage occurring in plants in field experiments, only those injuries which manifested themselves on a large scale during , and which were caused by cold as a damaging factor, are discussed in this paper. At the same time injuries whose manifestation is connected with other hibernal climatic factors and which have a certain connection with cold are also touched upon here. Reservation should be made here as regards the manifold secondary phenomena, e.g., the activity of fungi and insects, which usually follow the cold damage. Injuries caused by fungi and insects claim a special penetration into the question Damage patterns Cold damage occurring in the above-ground part of the plants falls into two conspicuous groups of damage, namely, injury at the main stem and diebacli of the plant top. The first group consists mainly of BSG injuries. Thus, such grouping of cold damage protides the possibility of analysing separately the two parts of the plant abo\ e ground which are most susceptible to cold damage. However, it should be added that in the following chapters cases of severe cold damage \\ill be discussed where both types of damage merge, the result being the immediate death of the tree Injury of the main stem Various modifications of this kind of damage appeared in It should be emphasized that the plants, that is, young trees, had at that time reached the age of ten years. In most of the trees thick bark had already been formed at those places where damage occurred, and the maximum diameter of injured trees was 6 cm at the base of the stem Basal sfem girdle and frosf canker To most plant breeders the manifestation of this type of damage in Scots pine on such a large scale as occurred in is hardly known and often inconceivable. One of the most conspicuous manifestations of this type of damage is the constriction in the lower part of the damaged tree (Fig. 1). However, this indication, which originates in connection with the death of the cambium at the damaged place, appears earliest in the following growth

57 Fig. 26. BSG of 1960/61 encircles the stem leaving only a narrow string of cambium unimpaired (a and c). a, transverse section at the centre of the frost canker showing a sector of unimpaired xylem with the thin annual ring of b, swelling of the stem above the girdle; a short leader and short lateral shoots developed during the growing season of c, longitudinal section of the portion affected by BSG. The damaged tree (EP 16, PR 42) died in the early spring of ; a and c in October 1963.

58 period, after the occurrence of the damage. No external signs of injury could be noticed in these trees in May, immediately after the melting of the snow. At the same time there were on the EPs damaged trees with other modifications of injury, with other external signs of damage. In August and September some callusing and characteristic swelling had appeared above the girdle (Fig. 26). The bark of the stem at the damaged section was ruptured owing to the development of the callus. The other external sign of the damaged trees was that the leading and lateral shoots of the recent year were shorter than the normal ones. These indications were so reliable that damaged trees could be easily discerned on the plantation area even in those cases when the girdled section was not easily noticeable. The length of the shoots varied from a few cm up to normal, and from the length of the shoot it was possible to estimate the degree of the injury. On the other hand, the yellowing or reddening of the needles and the debility of the crown manifested themd selves only in the severely injured trees (Fig. 4). In some of the injuretrees the green colour of the needles was even darker than in the undamaged trees. The injury of the stem was located at different levels above the ground. Most of the girdles had occurred almost on ground level (Fig. 1). However, on some occasions girdling had taken place at a height of cm above the ground, and in exceptional cases at a level of 60 cm. Fig. 2 shows a case where a peculiar shape had been formed with a thin stem below the girdle and an unproportionally thick stem above it. That the tree had been able to grow further and that its root system could function during three growing seasons after the damage had occurred, might be explained by the fact that a few small living branches with foliage capable of assimilation had survived below the girdle. On those occasions where the damaged tree had some vigorous green branches left below the girdle, the difference between the thickness of the tree below and that above the constricted section was less conspicuous, and in some cases no difference could be noticed at all. In some cases the only difference which could be noticed was the constriction of the injured section. Special attention should be devoted to those cases where the girdle had occurred immediately below the surface of the ground (Fig. 27). Damage had occurred in that section of the stem whose level corresponded to the hypocotyl and epicotyl of the ontogeny during the first year. In field experiments, when planting out, this section of the transplant not infrequently happens to come under the surface of the ground. It should be emphasized that on these occasions the root system, as well as the stem of the tree and its crown, are unimpaired. Even if such damage does not occur too often, it deserves attention and should not be confounded with other types of injury.
.il as dying. Fig. 28.")
59 Fig. '. BSG of 1960/61 located immediately below the surface of the ground. a, damaged portion of the stem, b, lonnitudinal section of the damaged portion and of the root affected by black spots. The photographs vere taken in July 1962 when the damaged tree (EP 19, PR 42).il as dying. Fig. 28. BSG of 1960/61 located exactly at the ground surface level in a naturally regenerated plant in the vicinity of EP 10. a, a five-year old damaged plant; b, the portion of BSG with characteristic swelling above the girdle; c, longitudinal section. The damaged plant died in the autumn of The photographs were talien in May 1963.
.")
60 On EPs BSG was discovered in trees of different diameter and height. Injured trees in each PR were to be found in all dimensions, with the exception of the thickest individuals. On natural reproduction areas in the vicinity of EPs injuries were recorded even in seedlings a few years old (Fig. 28). On tlie whole it might be said that damage occurred in plants at all ages, at the seedling stage and also in trees which had attained tlie age of 15 and even 20 years, and which sometimes reached a height of 3.5 metres and a diameter of 6 cm. The death of the cambium, which caused girdling at the stem base, did not always occur uniformly round the whole stem. Often the cambium n as killed at several separate patches in the girdle. The callus overgrowth at the edge of the wound and the development of frost canker began soon after tlie injury had occurred (Fig. 3). On those occasions when cambium was killed only at small separate patches the wound soon healed, and the injury remained unnoticed (Fig. 63). The great majority of damaged trees were only partially girdled, i.e., only one side of the tree was injured (Fig. 64). In some cases only a narrow string of cambium in the girdle, uniting the lower and the upper part of the tree, remained unimpaired (Fig. 26). Xevertheless, such "navel string" helped the injured tree to survive one or tn7o years longer. The death of cambium was followed by the dieback of the living cells in the cambium rays as well as by the diebacli of the epithelium cells in resin ducts. The subsequent infiltration of resin coloured the injured parts, and those lying close to them, brown or dark-brown. Another matter worth mentioning is that the colour of the whole xylem sector turned dark bronn in the section of the stem where the death of cambium had occurred (Fig. 63). Cambium injuries and frost canker were often accompanied by a conspicuous frost ring, lying in the limit zone of the annual rings of 1960 and Another point of importance is that the manifestation of damage was most variable, and only some of the cases were so definitely expressed as in Figs. 1, 2 and 26. The majority of injuries were different combinations of this kind of damage with other modifications described on the folloning pages. Often no swelling appeared above the girdle of the damaged trees, and tlie location of the injury as well as its character could be revealed only by cutting off the bark and determining the death of the cambium. Owing to the death of the cambium and the callus overgrowth on damaged sections, the shape of the stem often changed its form in both the vertical and in the horizontal directions; for instance, the flattening and the crooking of the stem were often secondary consequences of the damage. Girdling at the stem base is well known as one of the different kinds of cold damage in forest trees. The oldest references to this phenomenon are to be found in literature as early as 1853 in Germany, and deal with seedilngs
 and 1962 (a). Photographs were taken in July 1962. Fig. 30. RSG and Dasyscypha fizscosanguinea canker.")
61 a b Fig. 29. BSG with resin flow and rents in the bark. a, small rents filled with resin (EP 12, PR 40); b, the damaged section is uniformly crusted over by resin flow (EP 25, PR 19). The damaged trees died in the autumn of 1961 (b) and 1962 (a). Photographs were taken in July Fig. 30. RSG and Dasyscypha fizscosanguinea canker. Yellow apothecium cupules cover the portion of BSG (EP 11, PR 33). The damaged tree died in the autumn of The photograph was take in July Fig. 31. Girdles of 1960/61 located at several levels. BSG and the dieback of the top merge in this tree. The damaged tree died in the early spring of The photograph was talten in July 1962.
62 and transplants of Norway spruce and European silver fir (R. HARTIG, 1883). Adetailed analysis of this type of cold damage in Douglas fir, Sitka spruce and other conifers was made by DAY (1928 a, b; 1931), by DAY and PEACE (1937, 1946) in England, and by BOYCE (1938, 1961) in U.S.A. In Scots pine this type of cold damage was considered very rare, owing to a remarkable cold resistance characteristic for this species. In this paper the author wishes to provide evidence proving that BSG was the predominant type of injury in Scots pine in 1960/61. This type of damage in the four-year plants was already noticed and recorded as early as 1954 on the EPs and in the nursery near Stockholm, where the PR material was raised Basal sfem girdle with resin flow and rents in the bark This kind of damage differs from the one mentioned above in the first place by its external characteristics. The flow of resin from the damaged section is most conspicuous. Penetrating through small rents in the bark, resin flow reveals their texture (Fig. 29a). In most cases the damaged section is uniformly crusted over by resin flow (Fig. 29b). As regards the location of the girdle on the stem, as well as the age and size of the injured trees, this modification of damage does not differ from the one described in Chap Large cavities filled with resin were usually formed under the bark, wherever damage had occurred. These were located throughout the girdle, but more often they were to be found at the edge of the frost canker. Killed cambium either encircled the stem or appeared in patches where the overgrowth of callus then took place. However, the dissection of the damaged parts leads to the assumption that in many cases cortex tissues might have been killed by the cold in the first place and that dieback of the phloem and of the cambium occurred later, in the same or in the following year. Injured trees lingered on for two and sometimes four years before dying. The sections of the stem of the tree round the living branches lingered oh longest. Just these cases of damage should be given a histological and anatomical check at the time when damage occurs. No such analyses had been made. The dissections of the damaged parts of the tree, made in the second and third year after the occurrence of the damage, confirm the prevailing views on the subject (cf. Chap ). It is of interest that this kind of damage occurred most frequently in PRs fairly resistant to cold. On some plantations in the province of Norrbotten it was the predominant type of injury Basal sfem girdle and fungus canker It is not the purpose of this paper to make a study of the primary infection of plants by fungus diseases and of the development of fungus canker in the
63 injured sections of the tree. In this investigation attention is paid to the infection by Dasyscypha fuscosanguinea which may occur in BSG caused by cold. The development of fungus canker after the infection can take place independently or simultaneously with the development of frost canker. The emergence of Dasyscypha fuscosanguinea on the basal part of the stem and the connection of this disease with the manifestation of BSG is obvious. Fig. 30 shows the swelling of the stem which characterises the girdle, the rupturing of the bark, rents in the bark and, at the same time, the yellow apothecium cupules of the fungi. The position of the D. fuscosanguinea disease on the stem fully coincides with the different possible levels of the BSG above the ground. A fungus may form a complete circle, but often only one side of the stem is affected, just as is the case with BSG. Not only do the levels of the attack by fungi and those of BSG on the tree coincide, but also does the pattern, which may assume the form of a circle or appear in patches (Chaps and ). D. sanguinea disease is frequently met with in the north of Sweden (LAGER- BERG, 1912). BJ~RKNAN (1957) draws attention to the frequent occurrence of D. fuscosanguinea in Scots pine in the north of Sweden on spaced out or thin plantations on trees two to three metres high, and associates this phenomenon with mechanical injuries. As regards the ecology of this fungus, it is known that it belongs to the so-called wound parasites. A primary factor must be at hand, which causes damage and rents in the bark of the tree and creates favourable preconditions for the infection. As a possible cause of the wounds in butt-swelling, BJORI~AN mentions the heavy frost heaving of the soil. According to BOYCE (1938, cit. DAY 1945, p. 4) D. fuscosanguinea disease and formation of fungus canker in U.S.A. are mostly restricted to high elevations or to poor sites. In 1962 and 1963, that is, in the second and third year after the occurrence of severe cold damage D. fuscosanguinea appeared on the BSG on some of the injured trees. The disease was also recorded after the cold damage of 1955 and in a smaller degree after that of The manifestation of the disease a year or two after the occurrence of the severe cold damage is striking. On the EPs trees are sometimes subject to root rot. However, injuries caused by Fomes annosus bear no relation to BSG caused by cold. In trees suffering from Fomes annosus, external signs in the section of butt-swelling are sufficiently manifest in order not to mistake them for BSG. It is true that a superfluous examination of the dying trees and particularly of the dieback of their crowns may, owing to a great similarity in both kinds of damage, lead to hasty conclusions. Luckily enough the region where the distribution of Fomes annosus occurs does not include the north of Sweden and only in n
; b, circular sloughing on a naturally regenerated seedling (EP 17); c, sloughing located only on one side of the tree (EP 12, PR 50).")
64 Fig. 32. Sloughing of the bark. a, circular sloughing on a tree (EP 11, PR 58); b, circular sloughing on a naturally regenerated seedling (EP 17); c, sloughing located only on one side of the tree (EP 12, PR 50). The damaged trees and the seedling died in the autumn of Photographed in October 1961 (c) and in July 1962 (a and b). Fig. 33. Vertical lesions in the bark. a and b, rents ran along the whole length of the stem on its S\\'side (EP 16, PR 38); c, vounds located only on one section of the tree (EP 12, PR 50). The damaged trees died in the autumn of 1961 and 1962 respectively. Photographed in September and October 1961.

65 small part of central Sweden does it coincide with the regional distribution of BSG Circular sloughing of the bark The peeling off of the dead bark in the injured sections of the tree took place already in the first or the following year after the cold damage had occurred. Thus BSG, which otherwise may remain unnoticed, in dead trees becomes visible. On the other hand, circular sloughing off of the living bark, which is being discussed here, occurs simultaneously with the occurrence of BSG. This probably takes place owing to some mechanical action of an external factor. The edge of the bark at the section where sloughing occurs is uneven (Fig. 32a), but in all other respects the damaged section resembles the artificial circular incision, that is, ring-barking. Owing to its fringy character this type of damage is easily distinguished from damage caused by rodents, which occurs in mountainous districts. The sloughing of the bark takes place at the same level above the ground as does BSG, and occurs both in seedlings (Fig. 32b) and in trees up to the height of 4 metres. Not always does the sloughing occur round the whole stem. Very often it appears in patches (Fig. 32c). The wound in the section of the damage is usually deep enough to lay bare the xylem, but cases were recorded where the layer of cambium was intact. The sloughing of the bark occurred in geographically limited districts in the provinces of Kopparberg and Vasterbotten. Its manifestation was probably connected with conspicuous thawing periods, which occurred in these districts in the winter of The ice crust, which developed a disruptive action when the periods of thaw and cold alternated, may be considered as the cause of the damage Other kinds of lesions in the bark In the spring of 1961 different kinds of fresh wounds, both shallow and deep, were recorded in trees. Contrary to the wounds mentioned in the previous chapter, which encircled the stem, these lesions ran in vertical directions, that is, in the direction of the stem. The character of these injuries was most complicated. Most injuries were caused by ice crust and at the same time had the characteristics of damage by cold. In some of the trees such vertical wounds ran along the whole length of the stem (Fig. 33b), but in some cases they appeared only in individual sections (Fig. 33c). These lesions bore a striking resemblance to the winter sunscald wounds (FILEWICZ and MODLIBOWSKA, 1955) which, as is well known, are rather rare in Scots pine.
66 In most cases wounds occurred on the south-west side, but they were also spread over a wider circumference from the south-east to west sides. Some of these lesions might have resulted from ice coatings (POMERLEAU, 1944; PARKER, 1963, p. 147; SCHNELLE, 1963, p. 397). The lesions so caused predominated on the west and north-west sides of the trees. These injuries were most prominent in the PRs susceptible to cold and they were not sufficiently serious by themselves to cause the death of the tree. However, on injured trees severe BSG occurred simultaneously with lesions, and this decided the fate of the tree. The open lesions in the bark, in their turn, provided a favourable ground for new cold injuries and infection by fungi in the following years Mining damage by bark beeiles The colonisation by insects of trees damaged by severe cold was already recorded in the summer of The gallery system under the bark and the exit holes of the Hylastes ater beetles, as well as the beetles themselves, were observed first of all in the BSG on dead or dying areas of the stem. In the third summer after the occurrence of the damage, i.e., in 1963, damaged trees were to a great extent infested by Pissodes weevils. The gallery system had been built in the section of the girdle and was limited chiefly to the last two annual rings, that is, to those rings which were formed after the damage had occurred (Figs. 3 and 64). Larvae, found in tunnels, were those of Pissodes notatus, but attacks by other bark-beetles were also observed. The infestation of the cold-damaged trees by Pissodes weevils in the sections of the BSG, is a proof that cold is the primary cause of the damage. In uninjured trees no such insect attacks were found. However, damage by Pissodes weevils can by no means be regarded as insignificant. When examining the injured trees, one was under the impression that at least some of the cankered trees would have survived if no insect attacks, which radically decided the fate of the injured trees, had occurred. Observations made by the author on insect infestation in cold-injured trees, and views expressed in this paper, correspond to the conclusions arrived at by DAY (1928, 1945), CHRYSTAL (1928) and BOYCE (1961) Girdling of the main stem in the upper part of the tree Girdling of the leading shoots caused by cold is a well-known kind of injury in most of the conifers. In fact, this kind of damage belongs rather to the next type (Chap ), that is, the dieback of the top of the plant. The cause of the injury is clearly ascertained by DAY and PEACE (1934) and DAY and BARRETT (1962) by experimental production of injuries by freezing. On these
67 occasions the girdle of dead bark and dead cambium conlpletely encircle the lower part of the last year's shoot. However, the girdle is often located at the whorl of the lateral branches or at the lower part of two-year, three-year, and sometimes even older, shoots. This kind of cold damage differs from the BSG by its location above the ground as well as by its origin. In trees suffering from it the upper part of the tree above the girdle usually dies sinlultaneously with the occurrence of the damage, or shortly after it has taken place. On EPs, girdling of the shoots at the main stem was recorded during se~eral years. In 1958, and on some EPs also in 1959, this was the main type of damage. In most cases the location of the damage was limited to the top of the tree, and defects of the stern occurred (forked stems, posthorn bends arid tortuous bends) when, instead of killed leaders, compensatory shoots developed (Fig. 5). In 1958 and 1959 the plants had not yet grown out from the dangerous ground air zone. During the periods of cold waves, not only the tops of the plants, but also the plants themselves, were killed. The frequencies of losses in plants belonging to PRs susceptible to cold were rather considerable (Chap. 4.2). This kind of damage was recorded again after the cold winter of 1961 and after the cold spell in the spring of Dieback of the top of the plants and of the crown of the tree Injuries caused by cold in the top of the plants and in the crown of the young trees may be of different character. Injuries of variable degrees of intensity were recorded from the time of the layout of the experiment until 1964 in plants of different ages, during single years and in all seasons. The scope of the subject does not permit the penetration into all kinds of injuries in detail. Only the most frequent types of damage are taken up for discussion here. It has already been mentioned that, next to the basal stem section, the top of the plant is the part of the plant above the ground that is most susceptible to cold (DAY, 1931; KRAE~OJ ef al., 1961). The amount of injuries is most frequent in the top of the plant. However, in young trees with a developed crown, injuries can manifest themselves simultaneously also in the lower part of the crown. The characteristic external and internal signs of injury to pine are summarked by D.~Y (1945, pp. 7f. and 1961, p. 150). On the basis of the data obtained from experimental freezing of plants, DAY and BAKRETT (1962, p. 38) showed clearly these types of injury on the diagram. The objects of investigation in DAY'S experiments were Corsican pine and Black pine respectively, Analogy between cold damage in these species and the injuries
; b, in some patches all living tissues TTere killed and the ~nedula was injured (EP 23, PR 19). Pholographed in October isg3.")
68 Fig. Diebacli of top during the severe spring frosl of a, girdle located at the whorl of the lateral branches (EP 25, PR 13); b, in some patches all living tissues TTere killed and the ~nedula was injured (EP 23, PR 19). Pholographed in October isg3. b Fig. 35. Distortion of the stern by snow. a. sulit stem (EP 12. PR 50): 6, stem bent and broken at the base (EP 16, PR 23); c, upper part of the tree bent and frozen; In different nllorls several branches mere pulled out of the stein (EP 12, PR 50); d, several branches \\ere pulled out of the stem (EP 12, PRs 50 and 56). Trees a and c died in the autumn of 1961, trees b and d survived. Photographed in September 1961.

69 recorded in PR experiments in the north of Sweden in Scots pine is striking indeed. Killed terminal buds are the most frequent kind of injury; simultaneously the adjacent part of the leader is also killed. The length of the section killed by cold can be less than 0.5 cm, but it can also be the whole of the previous year's shoot (Fig. 6). The injury of the section affected by cold can manifest itself in many different ways. Often only cambium is injured. It appears in longitudinal dissections as a narrow brown line between xylem and unimpaired cortex. It can happen that only the outer part of the cortex is injured and that the dead tissue does not extend through to cambium. Injury to bark may occur in local centres as smaller or larger patches. In some patches all living tissues are killed and the inner part of the stem, the medula, is injured (Fig. 34). The most severe type of injury is when dead bark and dead cambium encircle the stem (Chap ). It is of interest that girdling can occur not only on the main stem, but also on branches and twigs. Discolouration of the needles appears on the injured parts of the crown and they turn brown or red. However, injury to needles can occur independently of other kinds of damage. Such needle damage manifested itself in the late winter of 1962 and in the summer of 1964 (in the second half of July). When comparing the cases of dieback of the top during the three years (severe winter cold damage of 1961, some cases of cold injury in 1962 and extensive late frost damage of 1963), one can say that they hardly show any external differences. On all occasions injury occurred before flushing took place. Only in exceptional cases (see Chap. 4.2, EP 27) in 1963 did the damage take place before and during the flushing, and newly developed shoots were killed by late spring frosts. As regards injuries by autumn frost, it is hardly possible to come to any definite conclusions. Such injuries were manifested frequently in 1954 among PRs susceptible to cold, but there is no evidence that they might have occurred during Spring cold injuries in Scots pine in May and June are well known (HOFF- MANN, 1895; DENGLER, 1910, 1932; STAUDACAER, 1924). Differences between damage by cold in winter and in spring are revealed in internal signs. Formation of frost ring and abnormal wood bears witness to the time when damage occurred. When sectioning plants and young trees both in longitudinal and transverse sections, those internal cold damage signs which otherwise would have remained concealed become visible. This particularly refers to PRs susceptible to cold.

70 Distortion of the stem and crown by snow Of all the different kinds of damage caused by the weight of the snow upon individual parts of the tree, only damage connected with severe cold injury to trees in 1960/61 is taken up for consideration here. In this connection damage by snow is of twofold interest. The bending force of the snow can injure young trees mechanically beyond recovery, and it can also result in wounds in the crown and on the stem, which later become liable to cold injury and fungus diseases. Damage by snow can be divided into two groups, according to the nature of the injury. 1. A plant or a tree may be bent by the weight of the snow amassed on the crown. In such a case, either the whole tree can be partially bent down, it can be completely pressed down to the ground, or it can be bent in the upper part only (Fig. 4). Stems and leaders can be fractured or broken at the bend (Fig. 35b). 2. Owing to the packing up of the snow, the frozen-in branches of the crown are pulled down. Sometimes either individual or several branches are pulled out of the stem at the whorl, leaving an open wound (Fig. 35c and d). In extreme cases the stem is split along the whole length of the tree (Fig. 35a). Often deformation and buckling of the stem in different directions occur in the same individual. Damage by snow has been recorded in the north of Sweden (HOLMERZ and ORTENBLAD, 1886) and in individual years in central Sweden (MATTSON- MARN, 1922). The recorded types of damage correspond to a great extent to those described by BOERKER (1914) in the U.S.A. Of the injuries belonging to the first group, bends in the upper part of the stem were the most frequent. In the part of the stem below the bend, no deformation was observed in the injured trees. Damage was probably caused by the snowstorms which raged in February and March of 1961, that is, at the time when stems were embedded in deep and packed-up snow and only the crown of the tree above the snow cover was subjected to deformation by snowstorms. On the other hand, in 1961 trees were seldom bent at the base and pressed to the ground, which can probably be explained by the fact that in November of 1960 no storms, characteristic for this season, occurred (Meteorol. irsbok, 1960). However, the bending of the trees by snowstorms was observed in other years, e.g., in The other kind of severe damage by snow in 1961 was caused by heavy packing of the frozen snow cover. The wounds from those branches which had been pulled out by snow were healed over in the ensuing years. On the other hand, damage by snow in the small trees resulted in the dieback of the plant top and even in losses of plants.
71 It may be of interest if mention is made of the peculiarities in the structure of wood which arise in trees under the influence of the bending force of the snow. Formation of uneven wood fibres on the opposite side of the stem in the corresponding section of the bend has been dealt with in Scandinavia (MORK, 1946). The growth stress of stems and formation of reaction wood in young trees are well-known phenomena (~IETZGER; 1908; J~cons, 1945; SINNOTT, 1952; \TARDROP, 1958; SENEFIELD and J~ARDROP, 1962). Any small bend of the tree results in the formation of a brown or reddish-brown reaction wood in the corresponding sections of the tree. Rut, strange as it may seem, internal cold damage may occur at the same time in the same plants and young trees. The formation of abnormal reddish brown wood and frost rings may cause confusion with reaction wood, mentioned above, when longitudinal sections of tlle trees in question are examined. However, the anatomical and histological differences are most conspicuous when the formation of the wood in both cases is examined Relationship between different kinds of injury to plants Several kinds of damage can manifest themselres in one and the same tree. This is clearly shown in Fig. 4, in which particular case the most severe kind of damage was BSG. It caused debility of the crown, discolouration of needles, defoliation and, at last, the death of the tree, which in this concrete case occurred in the late summer of the following year, after the occurrence of the damage. Dieback of the top of the plant (Chap ) is here an independent case of cold damage, \vhich manifested itself in connection with the girdling of the main stem in the upper part of the tree (Chap ). In this particular case the cumulative effect of two different kinds of severe cold damage was clearly disclosed. The relationship between the two main types of cold damage, namely, BSG and the dieback of the plant top, is rather intricate. Trees suffering from severe BSG, as well as heavily cankered trees, die after lingering on a shorter or a longer time, irrespective of the diehack of tlle top of the plant. This can be seen by comparing Fig. 4 \\-it11 Fig. 26. However, in those cases where only the top of the tree was damaged, but no BSG had occurred, compensatory shoots developed in the ensuing years, the stem of the tree became more or less deformed, height growth was delayed and the whole habitus of the tree \\as permanently altered. The most severe cases were, however, those where BSG had occurred at several levels in the part of the tree up to approximately 50 cm above ground surface. Frequently the whole upper part of the tree vias at the same time severely affected and cambium was killed (Fig. 31). Both types of damage, BSG and the dieback of the top, merged in such trees. The whole stem of the
72 tree was damaged by cold from the tip of the plant to the gro~md surface. The result of this damage was the immediate death of the tree. On the EPs in the spring of 1961, soon after the snow had melted, such trees did not show any signs of life. High death-rates in PRs susceptible to cold mere already recorded in spring (Chap. 4.2 and 4.3). The causes of violent death were the two types of severe cold damage mentioned above. In Fig. 4 the tree suffering from cold damage had also been affected by the mechanical action of the snow; it was bent in the upper part (Chap ). In the same tree attacks by Pissodes weevils (Chap ) were recorded in the basal stem section. It might be assumed that infection by saprophyte fungi would also hare been found if the necessary examination had been made. Summarizing, it can be stated that the winter cold of 1960/61 has on these occasions been of primary importance, and that the several types of damage by cold discussed above are closely connected with one another. IVhen comparing different kinds of damage which manifest themselves in single trees, one notices a definite relationship between them. In the first place this can be said of BSG (Chap ) and other kinds of damage which were consistently manifested in the basal part of the stem (Chaps ; ; ). Of these, the most difficult to discern were the ruptures in the bark, which provided favourable conditions for infection by fungus diseases, which latter were then folloned by fungus canker (Chap ). Next to the ruptures, and more serious and significant, is the girdle with resin flow (Chap ), where cortex tissues, and probably partly cambium, are also affected. The most severe kind of damage is BSG, where cambium is killed and frost canker develops. Circular sloughing of the bark (Chap ), on the other hand, is that kind of damage which manifests itself either quite independently or together with other kinds of damage. This mechanical kind of damage gives proof of the impetus of those external forces \vhich mork on the basal part of the stern. In this connection it is relevant to melition those processes which are associated with alternate thawing and freezing of the snow and with the packing of the snow cover. Circular slougl~ing of the barli or peeling off of the patches of bark can he explained by the fact that ice crust freezes to the barli and develops a hauling force, when snow cover packs down. Howerer, this is only one of several physical actions (Chap ) in the sphere of ice crust which are connected nith the processes causing cold damage in the basal part of the stein. The manifestation of BSG and high death-rate of plants on EPs 20 and 24, and partly also on EPs 12, 16, 26 and 29 (see Chap. 4.2), coincides with damage to trees by snow. It is on these EPs that branches were often pulled out of the main stem, and the upper parts of the trees were fractured. In
73 Chap it has already been mentioned that this kind of damage intensified the dieback of the top of the plant. Nevertheless, it is clear that this kind of snow damage has nothing in common with BSG. When damage by snow occurred to the top of the trees, the stems of the trees had frozen in into the snow cover, reaching a depth of 1 metre. Neither the weight of the snow nor the influence of the wind could at that time affect the basal part of the stem. Consequently no bends, breaks or fractures were recorded there. However, if the manifestation of both kinds of damage, i.e., BSG and the damage by snow in the upper part of the crown, takes place in the same tree, it can be explained by the heavy packing of the snow cover and the development of the ice crust on the sites of these EPs. Such packed snow cover and ice crust in the first place damaged mechanically the top of the tree, presumably in January or February, and then two months later ice crust and fluctuations of the temperature, in their turn, caused severe cold damage at the basal part of the stem. On some EPs (15 and 23) situated in mountain districts, damage by snow was either insignificant or did not occur at all. Even the manifestation of severe cold damage was rare (Chap. 4.2). However, damage by snow and damage by cold did not always coincide. BSG occurred even when no snow damage took place (EP 13). There is hardly any reason to expect any connection between these two kinds of damage. Each of them has a different time of occurrence and takes place in circumstances when the qualities of the snow have already changed. The question is taken up for discussion here only with the view of showing the role played by the snow cover when damage occurs.
74 4. Mortality rates in plants among provenances 4.1. Biological and statistical concepts on death in plants The concept of death and the setting in of death in individuals, plants and young trees, might seem a simple problem. A tree is dead when it does not show any sign of life. However, in field experiments difficulties often arise in this connection. This refers particularly to individuals damaged by cold. When annual check-up of the EPs was made, some trees were recorded as dead on the basis of external signs. Nevertheless, corrections had to be made already in the following year, when discarded trees developed adventitious shoots from the lower whorls of branches or from short shoots. Capacity to develop adventitious shoots is particularly characteristic for PRs originating from northern regions and from high altitudes. As a rule, new shoots which sprout from local, living centres in the main stem of a tree, whose remaining parts are dead, are very weak. Most often they perish in the ensuing years. On the other hand, new shoots, which develop from the uninjured basal part of the stem, which has remained intact, may be permanent, and compensate for the killed upper part of the plant; but they, in their turn, can be damaged by cold in the years to come. Permanent, adventitious shoots in individuals damaged by cold are considered to be symptomatic of the capacity of a particular tree to survive. Individuals capable of rejuvenation were not included in the death-rate records, although they might have been registered as dead immediately after the occurrence of severe cold damage. Still, if short-termed and insignificant shoots appeared, they were ignored and no corrections were made in the initial record of the death of the plant. In the case of BSG it was difficult, immediately after the occurrence of damage, to distinguish between unimpaired individuals and those injured by cold, and during the ensuing year to distinguish between living and dead individuals. In the spring of 1961 the majority of the injured trees did not show any external signs of damage. Such signs appeared only in the summer of the same year. Some of the trees died in the autumn, some in the spring of 1962, and some even later. But some of the plants lingered on until the autumn of 1964 and were neither dead nor alive. It is evident that production of cold damage and the death of the damaged individuals are two different phenomena. These two phenomena seldom occur simultaneously. This fact must be taken into consideration when statistical
 The frequency of dead individuals in single years can be caused by cold damage which has occurred in either the same year, in the preceding year, or two to four years earlier.")
75 data on death-rate in plants in single years is interpreted. (See the graphical representation of these data in Chap. 4.2.) The frequency of dead individuals in single years can be caused by cold damage which has occurred in either the same year, in the preceding year, or two to four years earlier. This is clearly shown in the case of cold damage which occurred in Much attention was devoted to consistent examination of individual plants. Field records were made during each growing season, sometimes even twice, except in 1960, when plantations were not examined during that season. The same applies to the EP 20 i and to the EPs 10 and 14 in some years. In 1960 the values lacking were compensated by minute distribution of dead trees into two groups (those killed in and those which died in ) according to assessment records of Luckily, frequencies of dead individuals in mere insignificant. It w.s possible by external signs to distinguish dead trees from the trees injured in the winter of 1961, which subsequently died in the spring of tlie same year. The majority of individuals injured in the winter of 1961 died after the spring assessment of Records obtained in field assessments were put into a system which enabled minute observation of each individual from year to year. Each replaced plant was registered in the same way as were original plants. However, in statistical records on death-rates only original plants were taken into account. This mas done with tlie view of eliminating many and various influences on death-rates in plants, which crop up owing to the uneven scale of replacement losses in different PRs in different years. The frequencies of dead individuals are calculatecl separately for each PR and for each year. These are average values obtained from four replic a t' ions and refer to tlie whole EP. Complete estimation of statistical data has not yet been made. The variation of death-rates within the population due to the variable resistance to cold in progeny of individual trees has not been calculated at all. Since PR experiments are at the same time progeny tests of individual trees, tlie data on plant mortality are of particular interest. The statistical evaluation of these biological qualities is postponed until later. However, it is of interest to note that in some populations progeny of individual trees reveal a different hardiness to cold. Death rates of different PRs are expressed graphically by time-age-mortality curves in diagrams. Two different modes of expressing death-rates have been used in this paper: 1. CRI rates in plants and 2. SYhl rates in plants. Both diagrams with their different modes of expressing death-rates complement each other. CM rates are calculated on the basis of the cumulative number of dead individuals, year after year, in four replications for each PR on each EP.

76 These figures are expressed in percentages of 260, that is, from the number of the plants in each PR at the time of lay-out, in four replications ( $80 = 260). On the other hand, frequencies of losses in plants in single years are calculated on the basis of the number of trees killed in a single year and expressed in percentages of the number of living trees for each PR in the EP during the previous year. CAI curves in the diagrams show the adaptation result of each individual PR on the experimental site, as well as differences among PRs or the traits they have in common. The curves clearly display quantitatively the result of the adaptation for survival for each EP at a definite age of development in successive calendar years. However, certain disadvantages are connected with the use of CSI curves. In the first place, each case of unforeseen chance losses in plants on EPs during the first years changes the position of the ChI curves in relation to a normal one, i.e., from the one which a certain PR would have had, had its survival depended only upon its endogenous sensibility to cold. Although a CilI curve, in its further development, gives sufficiently valid evidence of the hardiness of PR to cold, the position of a curve above the horizontal axis in the diagram, in the cases mentioned above, does not show the real ability of a PR to adapt itself. The following PRs and EPs illustrate what has been said above: EP 21, PR 102, Fig. 48 A; EP 25, PR 101, Fig. 51 A; EP 13, PR 10, Fig. 44 A. The graphical representation of losses in plants in single years by means of CAI curves does not show the change of the direction of these curves to full ad\~antage. These disadvantages are eliminated by the death-rate curves of the second type, that is, cnrves containing SYRI rates. The initial chance losses in plants do not influence the position of the PR curves in the years to follow. The position of the curves shows the relationship between the PRs and their susceptibility to cold in single years. But these curves do not show the result of adaptation of PRs in the same way as it is seen on CM diagrams. Death-rate values are consistently calculated individually from each PR replication on all EPs. However, only two representathe EPs (16, Fig. 46 and 21, Fig. 49) were chosen to illustrate the variation of death-rates in four replications. EP 16 stands out among the others by reason of its high variation of death-rates in replications. This variation is particularly noticeable in PRs susceptible to cold. Each minute divergence of ground surface level between replications increases the variation of death-rates. On the other hand, EP 21 has a moderate death-rate variation. It should be stressed that replication death-rate curves do not differ essentially. Deviation of death-rate curves in each replication from PR mean values is expressed graphically. Data on death-rates in plants among PRs on EPs are supplemented by tree height measurements. On EP 11 only arithmetical mean values of the heights
77 were obtained, but on EPs 9, 10, 12, 16, 20, 21 and 25 both mean values and standard error values for each PR were taken. In this connection the heights supply us with information on the height growth in different PRs. It is undeniable that the tree growth is closely connected with the occurrence of cold damage. EPs on which tree height measurements were made are located in different parts of northern Sweden (Figs. 7 and 8). On the basis of these data certain conjectures can be made regarding the size of the trees even on all other EPs. However, the statistical data on tree heights are by no means exhaustive, and they claim neither to supply a complete information on the variation of height growth in different PRs, nor to give a significative answer as to the fitness of PRs to the experimental sites Single experimental plantations A concise commentary on diagrams and a short account of the characteristics regarding site conditions for each of the 20 EPs are given below. Diagrams containing CM curves are designated by A, for instance: Fig. 21 A. Diagrams showing SYM rates are designated by B, retaining the same number for the figure, for instance: Fig. 21 B. The latter kind of diagrams are lacking for EPs 10 and 14 as no records were made during some single years. The PR curves in the diagrams are designated by the same figures as corresponding PRs in tables and on maps. Data on the origin of PRs, and on CAI rates in plants, as well as data on the tree height, are contained in the corresponding table for each EP. The transfer distance of PRs from their natural habitat to the EP site is shown in the tables. CM rates from 1960 to 1964, that is, death-rates comprising chiefly losses in plants caused by BSG of 1960/61, as well as CM rates from 1956 to 1964, are also included in the tables. Symbols in tables PR: No. -Number of PR, see Fig. 7. 'P -North latitude. A -East longitude from Greenwich. HS -Altitude above the sea level in m. Y -Length of growing season. Locality-Province, nearest populated place, Transfer of PR:q - distance in meridional direction from the natural habitat of the PR to the site of EP in km, in northerly direction (+), in southerly direction (-).
78 H, -Distance in vertical direction in m, upward (f), downward (-). Y -Shortening (-) or the lenghthening (+) of thegrowing season. R: Relative values of the CM rates of 1964 in different PRs (R of local PR = 100). 1 Living trees: N - Total number and % of the number of plants in the year % the experiment was laid out. n - Number of trees with crown intact and % of N number. (O/,) These trees were measured and the data obtained were { used for the estimation of E. n,-(~njured, bent, topless trees and % of N number. -(Ole, 1 h - Mean height in cm. Distribution of experimental plantations On the basis of the differences in death-rate values recorded after 1960/61 in EPs, it seemed appropriate to divide the EPs into four groups in order to elucidate the problem of the BSG. Weather conditions in 1960/61 were also taken into account when EPs were grouped as follows: I. EPs (9, 10 and 14) located outside the region of severe cold damage. 11. EPs within the region of severe cold damage. 1. EPs (11, 17 and 18) in the transition zone, where moderate cold damage occurred in l960/6l. 2. EPs (12, 13, 16, 20, 21, 22, 24, 25, 26, 29 and 27) where extensive cold damage occurred in l960/6l. 3. EPs in mountain districts (15, 19 and 23) where moderate cold damage occurred in 1960/61. Experimental plantations located outside the region of severe cold damage of (Region I) Experimental plantation 9. Fig. 36 A and B. Table 2 The site of the EP occupies a small area, formerly used for agricultural purposes. Here the surface of the country is rolling and broken, and the site is surrounded by woodland and swamps. The most unfavourable factor on the site is the vigorous ground vegetation. Losses in plants in the summer of 1954 were considerable, which resulted in high death-rate values in The position of CM curves is therefore very high already in the initial section. The position of the curves was not influenced by physiogenic factors during the first year and was influenced only very slightly in subsequent years.
79 Fig. 36 A. ChI of 7 PRs in EP 9 (see Table 2). SYM EP9 Fig. 36 B. SYhI of 7 PRs in EP 9 (see Table 2).
80
81 Fig. 37. A I and h 11. CM of Il+7 PRs in EP 10 field A and EP 10 field B (see Table 3).
82
83 Field I3 -- PR Transfer of PR CM 1963, Diff. (31 T,iving lrces ' I Hs Y Locality " 32' 17" 28' Uppsala, Alvkarleby 50" 10' 12" 07' Germany, Bayern, Selb 49" 45' 11" 33' Germany, 0berfr.-Bayern, Pegwilz 49" 22' 11" 38' Germany, Oberpfalz-Bayern, Pfaffcnhofen 49" 12' 12" 17' Germany, Bayern, Nittenau 47"38' 13" 00' Germany, Hochgeb.-Oberbayern, Berchtesgaden 51' 35' 04" 45' Holland, Breda, Mastboscll
84 21 CM EP , ,/ /' I -i_?_ A I I 40 I I I I I 4 23 I 0J (1957) ) (1960) 1961 (19'62) (19k3) t9ki Fig. 38 A. CM of seven PRs in EP 11 (see Table 4). As regards frequencies of losses in plants in single years, the following may be said. In 1959 losses in plants were caused by winter cold and spring frosts, and in 1963 by rodents. Only a few plants with BSG from 1961 were found on this EP. Such damage was also occasionally found in neighbouring natural reproduction areas. Experimental plantation 10. Fig. 37 A I (Field A) and A I1 (Field B). Table 3 This EP is located in the coastal region of the Gulf of Bothnia in flat country, and is surrounded by pine woods. During some of the initial years vigorous ground vegetation influenced the development of the EP. Heavy losses of plants occurred during the exceptionally dry summer of 1959, which was reflected in high death-rates in During each of the years following 1956, plant mortality was negligible among most of the Swedish PRs which, on thewhole, did not differ from the local PR. The weather conditions prevailing in 1960/61 did not influence plant mortality. BSG was recorded only in 15 trees on the whole EP. Winter cold and late frosts in 1958 caused losses in plants in German PRs susceptible to cold. In PRs 10, 42 and 90 during the years following 1959 the only losses were those caused by roe, Capreolus capreolns.
85 Table 4. Experimental plantation 14. Vasternorrland, Bramom. cp: 62' 12', A: 17' 42', H,: 5, Y: 150. No. I 0 I Hs y Locality PI3 Transler of PR ChI 1964 Diff. ChI Living Irccs " 57' 21" 11' VHsterbotten, Ryske 65" 08' 18" 53' Vasterbotten, Mal3, Striinrfors 62" 12' 17" 42' Vasternorrlancl, Bramiin, Sanrla 62" 03' 14" 19' Jamtland, Sveg, Malmbacken 59" 35' 07" 50' Norway, Viqjc, PrastgSrden 59" 17' 18" 55' Stockholm, Sanclhamn 57" 36' 14" 13' Jiinkiining. Eckersholtn
86 I 1951, \196GJ Fig. 39 A. CAI of 14 PRs in EP 11 (see Table 5). Experimental plantation 14. Fig. 38 A. Table 4 This EP is located on the island of Brain011 in the Gulf of Bothnia and is surrounded by pine woods. Losses in plants up to 1955 were caused by the attacks of Hylobies abietis and by the periods of drought in the spring of 1953 and The drought of 1955 was the only cause of the increase of ChI rates in 1956.,4 certain increase in curves was also noticeable in Of all the types of cold damage only the manifestation of BSG was recorded in This resulted in an insignificant change in the trend of the direction of the curyes. Death-rates in plants in connection with the damage of 1961 were inconsiderable. This EP lies outside th? region of severe cold damage (Chap. 2.1).
87 SYM EPll SYM EP I Fig. 39 B I and B 11. SYRl of 14 PRs in EP 11 (see Table 5). Plantations where moderate cold damage occurred in 1961 (Subregion 1I:l) Experimental plantation 11. Figs. 39 A, BI and B. Table 5 Mixed spruce and pine forest enclose the site, which is located on a flat plateau. Severe snowstorins raged here in the October of 1954 and deep snow covered the crowns of the trees on the EP in the winter of , without
88
89 Fig. 40 A. CAI of 14 PRs in EP 17 (see Table 6). causing any considerable damage. As regards losses in plants in single years the following may be said. In PRs 82 and 85 cold damage which occurred in the spring of 1953 resulted in moderate death-rates in plants, and some losses in plants were also due to the attacks of Hylobies abietis in the spring of Xo cold damage occurred during the severe winter of The high death-rate values in 1956 were the result of the protracted drought in the summer of Death-rate values clearly elucidate the variable sensibility
90 SYM EP17 Fig. 40 B I and B 11. SYRI of 14 PRs in EP 17 (see Table 6).
91 Table 6. Experimental plantation 17. Vasterbotten, Vindeln, Svartberget. p: 64' 14', A: 1 9 O 43', Hs: 200, Y: 128. No. P lcrn Transfer of PR Diff. CM living lrees 19G4 N ' X I 6S055' 23"15' Norway, Alta, Aronas 67" 51' 20" 27' Norrbotten, Kiruna, Kauppinen 66" 53' 23" 03' Norrbotten, I<orpilornbolo, Smeclberg 66" 18' 14" 10' Norway, Mo i Rana, Rhmo 65" 08' 18" 53' Vasterbottcn, Malg, Slriimfors 64" 12' 20" 48' Vasterhotlcn, Roberlsfors 64" 14' 19" 43' Vasterbotten, Vindeln, Svartberget 64" 34' 18" 15' Vasterbottcn, Lycliscle, Talltrask, Slorbergt 63" 02' 16" 39' Jamtland, Bispfors 62" 03' 14" 19' Jamlland, Sveg, Malmbaclien 61 27' 13" 28' Kopparbcrg, Bunkris 57" 36' 14" 13' Jonkiiping, Eckersholm 49" 45' 11" 33' Germany, 0berfr.-Bayern, Pegnitz 61" 28' 17" 08' Gavleborg, Lhgvind
92 of PRs to drought. The most susceptible to drought appeared to be southern PRs 85, 82 and 72, whereas the northern and upland PRs 10, 21 and 51 were more hardy. This proves once again the well-known fact that the resistance of PRs to drought and their resistance to cold are similar. PR 85 (Germany) and other sensitive PRs suffered from cold in the winter of 1958 and The acceleration in death-rates in 1963 was due to the BSG of No dieback of the plant tops was registered on this EP. However, on the whole the death-rate in plants after 1956 was negligible. The CM diagram shows how consistently the position of PR curves changed after 1956, that is, after the drought of 1955 and after the chance agents of the initial years ceased to influence the adaptation of PRs. PRs 21, 10, 40, 53 and 82 clearly illustrate this fact. Experimental plantation 17. Figs. 40 A, B I and B II. Table 6 The site of the EP is surrounded by pine forest. It is located in flat country, where spring and summer frosts occur frequently. Plant growth mas unfavourably influenced by heavy heaving of plants in spring. Of all EPs only this one has such site characteristics. Losses of plants due to their heaving were considerable in 1955 and 1957, but even during other years the deathrate was influenced in this manner. The cause of the high death-rate of 1956 was the summer drought of The winter cold and spring frost of 1958 and 1959 killed many plants, which resulted in high death-rates, particularly among sensitive PRs. BSG was manifested conspicuously after 1961 and was the cause of death in plants from 1961 to Here the grade of susceptibility to cold in different PRs stands out conspicuously. PR 103 makes an exception, since 82% of the plants perished already in However, the plants that survived showed a greater resistance to cold during the following years. A similar trend, which will be discussed later, was noticeable in other PRs on EPs. PR 86 (Germany) perished completely during the second and the third initial years. In the diagrams CM rate curves of PRs 42, 50 and 74 differ from the others. The plants of these PRs were grown in a nursery in the province of Stockholm and were more vigorous than the plants belonging to other PRs grown in a nursery in the province of Vasternorrland (Chap. 1.1). However, these vigorous plants showed greater hardiness to cold only during some initial years, but not later. The CAI curves changed their direction already in 1958, and particularly in It should be stressed that PRs with more vigorous plants showed this particular tendency also on other EPs, where plants were supplied from different nurseries.
93 Fig. 11 A. CAI of 7 PRs in EP 18 (see Table 7) SYM EP 18 Fig. 41 B. SYII of 7 PRs in EP 18 (see Table 7).
94
95 Experimental plantation 18. Fig. 41 A and B. Table 7 This EP is situated on a woodland plain in the coastal district of the Gulf of Bothnia. Frequencies of losses in plants in the summer of 1954 were great among PRs 103 and 102, which is seen from the death-rates of Losses were caused due the deterioration of the quality of plants during transportation from the nursery to the EP site, but possibly the inbreeding depression was the primary cause. Beginning with 1955 the influence of chance agents disappears and the trend of the CAI curves expresses the adaptation for survival of these PRs. In this connection PR 102 is similar to PRs 23 and 10, while PR 103 is similar to PR 42, which is clearly seen when comparing the SYM rates in these PRs. Death-rates in single years were manifested as follows: The cause of high values in death-rates in 1956 was the summer drought of 1955 and also, to a certain extent, the spring frosts of It was almost impossible to distinguish the cause of death in dead individuals. The winter cold and spring frost of 1958 and 1959 were the cause of increased death-rates during these years. Cold damage of 1960/61 resulted in comparatively high death-rate values in 1962 and The only type of damage in this case was BSG. The consequences of this damage ceased in It is of interest to note that spring frost injuries of 1963 occurred only seldom on this EP and frost did not cause diebacli of the trees cankered in Experimental plantations where extensive cold damage occurred in (Subregion II:2) Experimenfal plantation 22. Fig. 42 A and B. Table 8 The above EP is located in the coastal district of the Gulf of Bothnia on a gentle SE slope and is surrounded by spruce forest. The site of the EP is a frost locality. In 1955 death-rates in plants were the result of the autumn frost of 1954 and of the cold during the winter of (PRs 47 and 34). The drought of 1955 was of no consequence as regards losses, but on the other hand, the spring frosts of 1956 influenced the death-rate values of PRs 47 and 34 in The death-rate among sensitive PRs was due to spring frost and winter cold in 1958 and The winter cold of 1960/61 was the cause of high deathrates among several PRs, mostly among those susceptible to cold. Damage was manifested exclusively as BSG. In PRs 47 and 34 the severe spring frosts of 1963 killed those plants which
96 Fig CRI of 5 PHs in EP 22 (see Table 8). SYM EP22 Fig. 42 B. SYhI of 7 PRs in EP 22 (see Table 8).
97
98 Fig. 43 A. CJI of 7 PRs in EP 12 (see Table 9). were already damaged and, having been checked in their development, had remained in the ground air zone. The frequencies of frost injuries among other PRs were rather great. However, damage was limited to the dieback of the leaders and lateral branches and did not influence death-rates in plants. Plants in these PRs had grown away from the dangerous ground air zone.
99 SYM EP a- Fig. 43 B. SPXI of 5 PRs in EP 12 (see Table 9). Experimental plantafion 12. Fig. 43 A and B. Table 9 This EP is located on an upland plateau. To the west from the site of the EP rises a narrow ridge of a hill, which protects EP from westerly winds, but at the same time acts as a snow shelter and influences an uneven distribution of snow on the EP area. The undulating ground surface increases in its turn the variation in the depth of the snow cover. This EP is one of those which, after a successful start, was most promising. However, the situation changed radically after the winter of 1960/61. It should be noted that no chance agents influenced death-rates on this EP. On both diagrams death-rate curves show the same PR arrangement in 1954 as in 1963 and This arrangement shows differences in susceptibility
100 Table 9. Experimental plantation 12. Kopparberg, Bunkris. p: 61 27', A: 13O 28', H,: 575, Y: 125. PR Transfer of PR CM 1964 Diff. CM Living trees " 34' 18" 15' 510 Vaslerbotten, Lycksclc, Slorbcrget 62" 12' 17" 42' 5 Vas tern01 rland, Bramon, Sanna 62" 03' 14" 19' 385 Jamlland, Sveg, hlal~nbacltcn 61" 27' 13" 28' 550 Kopparberg, Bunkris 59" 35' 07" 50' 550 Norway, Vinje, PrastgBrclen 59"24' 18"12' 32 Stochhol~n, Bogesand, Sandvrclcn 57" 36' 14" 13' 225 Jonko~mg. Eckcrsholrn
101 401 % SYM EP13 Fig. 44 B. SyhI of 7 PRs in EP 13 (see Table 10).
102
103 of PRs to cold. SYM rates reveal a consistent repetition of PR arrangement during all years. As regards SYM rates it might be said that the death-rates of 1956 were caused by the drought of 1955 and by the cold winter in BSG was recorded in some plants. The cause of death-rates in 1958 and 1959 was the wirlter cold of 1958 and possibly the spring frost of However, principal losses in plants occurred after 1960/61, when all types of damage were manifested (Chap. 3.1). BSG dominated, and also decided the fate of the trees. Two of seven PRs, local PR 50 and PR 32, were only slightly damaged and had a similar CM rate. However, it would be too precipitous to conclude that the resistance to cold of these two PRs was identical. When comparing the two PRs, it should be mentioned that the tree growth in PR 32 was slower than in PR 50. On account of the small size of the trees and their thinner bark, PR 32 was more liable to BSG. On the other hand, PR 50 had greater chances to escape damage owing to the greater size of the trees. PRs 40, 42 and 56 suffered heavily, but there are no significative differences between them. In PRs 39 and 79 only a few individuals survived until the autumn of Actually the effect of cold damage ceased in 1964, which is reflected in death-rate curves. The reasons for the negative excess of deathrates in 1962 can be explained technically; dead individuals recorded in the autumn of 1961 were added to the number of individuals which had perished in the spring of 1961, thus increasing death-rate values in Experimental plantation 13. Fig. 44 A and B. Table 10 The above EP is situated on an upland plateau, not far from the timberline, on a vast deforested area, which was formed after repeated mood fires. It is protected against north-westerly and westerly winds by the hill known as Himerisen. The site of the plantation is surrounded by areas of heath and moorland, on which pine clusters grow here and there. Edaphic conditions are characterized by a raw humus, which covers the upper layer of the podsdised soil. Under such circumstances the growth of the trees was slow and only in exceptional cases did their height exceed 1 metre in Death-rates in plants in 1954 show the variable susceptibility of the PRs to cold. However, the PR arrangement was influenced by the attacks of Hylobies abietis and by the summer drought of The winter cold of 1954/55 had no effect on the EP. Positive excesses stand out clearly in SYM rate curves representing all PRs in 1956, 1958, and With insignificant exceptions, the PR arrangement remained unchanged during all these years. High frequencies of losses in plants during these years were caused by the same factors as on EP 12 (See EP 12). Death-rate in plants in 1956 was the result of the drought
104 1 I I 1 1 I WL IC~S (11k1) ( Fig. 45 A. ChI of 7 PRs in EP 16 (see Table 11). of 1955 and possibly also of the spring frost of Losses in plants in 1958 were caused by winter cold and the spring frost. It is of interest to note that effects of the cold damage of 1958 were manifested in high death-rates also in From 1961 to 1963 all PRs, and particularly those susceptible to cold, had definitely high death-rates. SYM rates during these years u7ere even higher than in 1954, that is, higher than during the first year after the EP had been
105 Fig. 45 B. SYhI of 7 PRs in EP 16 (see Table 11). laid out. The effects of cold damage of the 1960/61 winter are clearly seen. However, they ceased almost completely in Among all types of cold damage in 1961 only BSG was manifested. The position of the damage was exclusively at the butt of the tree. It should be mentioned that SYM rates show two positive excesses, in 1961 and in 1963, and one negative excess in This phenomenon can be explained by the severe spring frosts of 1963, which caused dieback of the plant top (Chap ) as well as the death of girdled and heavily cankered trees. When comparing the CM curves (Fig. 44 A), it may be said that PRs 10, 23 and 45 show a great similarity. The same applies to PRs 42,50 and 56; they do not reveal any significative differences, but the coastal PR 48 was badly damaged. Experimental plantation 16. Fig. 45 A and B and Fig. 46. Table 11 The EP is situated on the top of an uneven and undulating hill. The ground surface of the EP area is also slightly undulating. The site is exposed to north-westerly and easterly winds. Topography and small scattered spruce and pine stands which surround the EP promote uneven piling up of the
106
107 Fig.46. Variation of SYM rates in four replications of PRs 6, 23, 36, 34, 38, 42 and 10'7 (see Table 11) as well as mean SYM values of each PR in EP 16.
108 Fig. 46, see p. 108.
109 Fig. 47 A. ChI of 14 PRs in EP 20 (see Table 12). snow on the EP area. Insignificant depressions in the ground surface on the EP area, in their turn, contribute to the accumulation of cold air during radiation frosts. This encourages the possibility of the production of cold damage in PRs susceptible to cold. In comparison with other EPs, losses in trees on this EP were most conspicuous. In 1913 the site of the present EP occupied a clear-felled area, which was
110 I i\ :', SYM EP20 / ', Fig. ii B. SYXI of 14 PRs in EP 20 (See Table 12). successfully afforested in However, this plantation perished completely, probably after the severe ~vinter of In later years repeated afforestation attempts gave poor results. After the winter of 1960/61 the same thing happened to EP 16. Differences in CRI curres are clearly expressed. The curve of PR 42 differs from other curves up to 1958, because stronger plants from the nursery in the province of Stockholm had been used. Beginning with 1958 the position of all curres shows the differences between PRs as regards their susceptibility to

111 cold. After the cold damage of 1960/61 the change in direction of the curves is most conspicuous. In 1964 CM rate was 77 % in the local PR 107; 79 % in PR 38; 92 % in both PRs 36 and 42. Northern PRs 6 and 23 had suffered least and their CM rates were 30 % and 58 % respectively. The mean height of the trees in these two PRs was greater than in other PRs. SYM rates are as follows: In 1955 their values were made up of individuals whose mortality was caused by different agents, such as the uneven quality of plants in different PRs in the spring of 1954, the autumn frosts of 1954, BSG and dieback of the plant top in The high death-rates of 1956 were the result of the drought in the summer of 1955, of the die-out of plants caused by BSG in 1955 and of spring frost injuries in In 1958 the causes of death in plants were winter cold and spring frost. From 1961 to 1964 deathrate was caused by the severe cold damage of t960/61. All types of injuries were recorded on this EP. However, in trees which had reached the age of years, BSG proved to be the only cause of death (Figs. 4 and 26). In 1964 death-rate values diminished. In 1961 and 1963 they showed positive excess, and in 1962 negative excess. Technical causes partly account for this. In the spring of 1961, when killed individuals were recorded, the plants which had been registered as dead in the August and September check-up were also added to their values. The positive excess of the death-rates in 1963 might be explained by the accelerated dieback of girdled and cankered individuals, due to the severe spring frosts of This tendency was most conspicuous in northern PRs and was observed also on other EPs. On EP 16 the variation of the frequencies of losses among PRs in four replications (Fig. 46) is considerable, which is particularly true as regards PRs susceptible to cold. This might be explained by the different site conditions of the replications, as well as by the insignificant number of trees which had survived. The deviation in the death-rate of replications from the mean values of the PRs, however, is not of such a nature as to influence the conclusions arrived at in the PR experiment. Experimental plantation 20. Figs. 47 A, B I and B II. Table 12 The EP is situated on the top of Storberget hill, with undulating surface. The site of the EP is mainly exposed to westerly and south-easterly winds. Both its topography and small adjacent spruce stands induce uneven accumulation of snow. To the east of the EP lies a swampy valley, where cold air amasses during frost periods. The depth of snow cover in the winter of 1960/61 can be ascertained by the position of the girdle on the stems of the trees. The excessive piling up of the snow on the lee-side in one of the replication corners
112 Table 12. Experimental plantation 20. Vasterbotten, Lycksele, Storberget. p?: 64' 33', 1: 18O 15', Hs: 555, Y: 109. Transfer of PR CR Diff. CM Living irccs 1963 No. Locality 68" 11' 15" 35' Norway, Tranoy 66" 53' 23" 03' Norrbol Len, Korpilombolo, Sniedberg 67" 1-1' 20" 29' Norrhotten, G%llivarc, Linalombolc 66" 18' 14" 10' Norway, Mo i Rana, Rhmo 65O.50' 23"18' Norrbolten, Iinlix, Miirltrssk 65" 08' 18" 53' Viislerbollen, Malg, Striimfors 64"14' 1g043' Vastcrboltcn, Vindcln, Svarlberge 64" 31' 18" 15' Vastcrhotlcn, Lyckselc, Storl~crge 62" 03' 14" 19' Jarntlanil, Sveg, Maltn115cken 61" 53' 12" 44' Kopparberg, Idrc 60n16' 15"06' Kopparberg, Grangarde 66" 03' 17" 57' Norrbottcn, Arjcplog 64" IS' 15" 23' Jarntland, Ilaursjon 62" 10' 17'27' Vasternorrland. Galtslriirn
113 of the EP caused heavy losses in plants in the hardy northern PR 11. The coincidence of BSG with the piling up of the snow on the EP is most striking. At the outset the EP was a success, and in October 1954 only 3 % average losses in plants were recorded. S o chance losses in plants occurred and timemortality curves consistently show different resistance of PRs to cold. Up to 1957 PRs 42 and 55 greatly differed from the others, as strong transplants from the nursery in the province of Stockholm had been planted, whereas plants of other PR5 had been grown in the province of Tlasternorrland, in northern climatic conditions. However, already in 1957 the direction of the PR curves 42 and 55 changed and in the following years they occupied the position among the curves of the other PRs which corresponded to their susceptibility to cold. Cp to 1961 the ChI rates for all northern PRs, including local PR 32 as well as PRs 23 and 106, were negligible. But, from the very beginning, the position of the curves of the southern PRs 43 and 108 were different. The direction of all PR curves changed suddenly in 1961, in connection with the occurrence of severe cold damage, when trees on the EP were 10 years old. BSG was the principal type of injury responsible for the death of trees. However, other types of cold damage n ere also represented. Damage by snow in the upper part of the crbwns of the trees showed great frequencies. The position of the damage by snow above the ground level coincided with the maximal depth of the snow cover in the winter of 1960/61 (Chap ). Cp to 1961 SYlI rates in all northern PRs as well as in the local PR 32 (Fig. 47 B I) were insignificant. For all PRs without exception, the BSG of 1961 was the cause of positive excess \~hich reached its culmination in 1962 in the SYM rate curves. In 1964 SyM rates obtained almost the same values which the PRs had in However, BSG occurred in non-hardy PRs 43 and 108 (Fig. 47 B 11) already in 1955, causing high frequencies of losses in The summer drought of 1955 did not affect the EP in any way. The weather conditions in the winter of 1958 caused new injuries, resulting in accelerated death-rate values in 1958 and Already in June of 1961 killed trees in PRs susceptible to cold were recorded, due to the combined effect of BSG and dieback of the plant top. In October 1964 it was possible to ascertain that the dieback of trees caused by BSG had ceased. All PRs susceptible to cold had greatly suffered. CM rates in PR 55 were 96 $6, in PRs 42, 43 and 108 from 60 0/6 to 70 0/,, in PRs 28 and 106 from 30 % to 40 0/,, but in hardy PRs mortality rates were only from 10 % to 20 0/,. The healing of wounds and recovery of the damaged trees proceeded successfully, and on some of the cankered trees no external signs of damage could be noticed. Evidently the spring frosts of 1963 had no retarding effect on the recovery of injrtred trees.
114 Fig CAI of 7 PRs in EP 21 (see Table 13). 407% \ SYM EP21 Fig. 48 B. SYhI of 7 PRs in EP 21 (see Table 13).
115 Table 13. Experimental plantation 21. Vasterbotten, LHngsjoby, Ronnhagen. y: 65' 09', A: 16' 33', H,: 465, Y: 110. PH / Transfer of PK CM 1964 Diff. C1\/1 Living trccs 1963 No Q007' 18"35' Norway, MBlselv, Moen 66" 50' 23" 09' Norrbotten, I<orpilombolo 65" 08' 18" 53' Vasterbollen, MalB, Strlirnfors 64" 12' 20" 48' Vasterbotten, Hobertslors 63" 10' 1.1" 04' Jamtland, Vallbogsrden 65" 08' 16" 32' Viislerbotten, Lsngsjiiby, Riinnhagen 62" 10' 17" 27' Vasternorrland, Gallstriirn
116 Experimental plantation 21. Fig. 48 A and B and Fig. 49. Table 13 The site of the EP occupies a slight southerly slope on a broken upland plateau. Topography, neighbouring pine afforestations and spruce stands promote the piling up of the snow on the EP area. The EP mas a success from the very beginning, and later its development was most satisfactory. During the first yearslocalpr 102 made an exception, due to the fact that the transplants had been weak. Therefore the position of the CM curve of this PR (Fig. 48 A) does not reflect its hardiness. Actually, local PR 102 has more in common with northern PRs 10 and 23 than with the others. This is clearly seen in Fig. 48 B, when SYRI rates are compared. In 1955 frequencies of losses in plants were very high for the coastland PR 108 and rather high for the local PR 102, mentioned above. The cold damage of 1955 and the summer drought of the same year, as well as the spring frosts of 1956, caused losses in plants in In most cases it was almost impossible to distinguish between the three causes of mortality in plants. The cold of 1958 resulted in insignificant frequencies of losses in plants in all PRs. During the period 1961 to 1964 the BSG of 1961 was the only cause of losses in plants. SYR4 rates culminated in However, in some PRs there were two positive excesses in 1961 and Probably the severe spring frosts of 1963 intensified the diebacli of the trees girdled and heavily cankered in This would explain both the culmination of SYAI rates in 1963 and the second positive excess in On this EP, just as on all other EPs in mountain districts, BSG occurred close to the ground surface (Fig. 1). Fig. 49 shows the variation of losses in the PRs in four replications. The deviation of these values from PR mean ~alues is insignificant and it is also insignificant in PRs susceptible to cold. In this connection EP 21, with its moderate variation of CJI rates in PR replications, differs from EP 16 (Fig. 46). Experimenlal plantation 24. Fig and B. Table 14 The site of the EP occupies an elevated position on a large logged-off area, which is part of a vast, high plateau. The EP is exposed to winds coming from all directions. Only a small cluster of pines and spruce grows south-east of the EP. The development of the EP in the initial years was satisfactory and no chance factors caused any losses in plants. During the first year an insignificant deviation of C3I curves was noticed in PR 42 and in PK 101, which substitutes the local PR on this EP. The transplants of PR 42 came from the nursery in the province of Stockholm and were stronger than other specimens.
117 lo-% SYM EP A Fig. 49. Yariation of SYII rates in four replications of PRs 4, 10, 23, 26, 38, 102 and 108 (see Table 13) as well as mean ST11 values of each PH in EP 21.
118 The position of the ClI curve of the PR 101 differs from that of other hardy PRs on account of a weaker development of plants during initial years. The deviation in the position of the curves of these txo PRs disappeared as early as 1955 and 1957 respectively. Fig. 50 A and Table 14 show that in 1964 the CM rate in the northern PR 7, originating from the Kiruna district, was 12 %. PR 42 perished completely, and in PR 101 losses reached 37%. The ClI curves clearly show the different adaptation capacity of PRs. EP 24 had suffered heady and its CAI rates for 1964 resemble those of EP 16. The results of the experiment distinctly show the difficulties which arise in the districts close to the Arctic Circle when afforestation is carried out under site conditions similar to those prevailing on EP 24. On the afforestation areas surrounding the EP, great losses occurred in 1953 and earlier. After 1955 only a few trees remained alive. Time-mortality curves which express SylI rates (Fig. 50 B), however, conspicuously show the culmination cycles, which are repeated in wave-like movements in all PRs with a definite spacing on the scale. The first peak of SllI rates occurs in the first year of the EP and is expressed by the death-rates of The causes of death in plants in PRs 34, 38, and 42 are the early frosts in August of 1954, the BSG, and the dieback of the plant tops in The summer drought of 1935 and the spring frosts of 1956 did not affect the EP in the least. This explains the truncated shape of the curves after In 1958 and 1959 the second culmination in the SyhI rate curves took place. Unfortunately, it was not possible to devote more time to the analysis of cold damage at that time. It is impossible to ascertain definitely if losses in plants in 1959 were due to the cold damage of that year, or if they were the result of cold damage caused in the preceding year (1958). So BSG occurred at that time, but the girdling of the main stem in the upper part of the plants was manifested (Chap ). Internal injuries in plants, that is, frost rings in the inner part of the summer wood adjacent to the annual ring of 1957, were recorded. The third culmirlation in the SYAl rates refers to the period After 1960/61 all types of damage were manifested on the EP, although trees perished almost exclusively on account of BSG, which occurred close to the ground. On this EP high frequencies of damage by snow were also recorded. Injury occurred in the upper part of the crowns (Chap ). Frequencies of losses increased already in They rose and were particularly high in 1962 and There is every reason to assume that the spring frosts of 1963 influenced the dieback of girdled and heavily cankered trees. In April of 1962 sudden fluctuations of diurnal temperature due to strong solar radiation caused injuries in the parts of the trees above the snow level. In 1964 fre-
119 Fig. 50 A. CAI of 14 PRs in EP 21 (see Table 14). quencies of losses were low and the third cycle of years with high SYRI rates mas already completed. However, the healing of wounds and recovery of damaged trees did not proceed successfully, as was the case on EP 20. Northern PRs 7, 6, 10 and PR 101, which had suffered least, mere in good condition. The results obtained from this EP are convincing and furnish grounds for
120 Fig. 50 B. SThI of 14 PRs in EP 24 (see Table 14). the conclusions which might be applied ~vhen afforestation is carried out on areas with similar site conditions. Experimental plantation 25. Figs. 51 A, B I and B II. Table 15 The site of the EP is in flat country north of the Gulf of Bothnia and is surrounded by swampy areas and sparse pine stands. It is exposed to westerly
121
122
123 Fig. 51 A. CAI of 14 PRs in EP 23 (see Table 15). and south-westerly winds, and piling up of the snow is most common here. The EP area is also a frost locality. The development of the EP was not retarded by any chance factors, with the exception of PR 101, where the transplants were weak during the first years. That is why the position of the CRI curves of PR 101 differs from that of other hardy PRs (for instance, 10 and 19) which, as regards susceptibility
124 -%+ SYM EP x-x (1960) Fig. 51 B I and B 11. SYAI of 14 PRs in EP 25 (see Table 15)
125 Fig. 52 A. ChI of 7 PRs in EP 26 (see Table 16). to cold, might be compared with PR 101. The transplants of PR 74, 50 and 42 were supplied from the nursery in the province of Stockholm. They were strong, and therefore the mortality curves of these PRs up to 1956 and 1958 differed from the two other non-hardy PRs 103 and 36. EP 25 had suffered from cold and frost only to a moderate degree. In 1964 CM rates were 19 %-21% for the hardy PRs 4 and 11, as well as for the local PR 10 and PR 19. For PRs 3, 13, 23 and 101, as well as for PR 26,
126 SYM EP Fig. 52 B. SYM of 7 PRs in EP 26 (see Table 16). which had suffered only moderately, CRI rates were 32 %-48 %. CJI rates in long-distance transfer PRs 36, 50, 103,42 and 7-2 were 90 %-I00 %. In 1955 frequencies of losses in plants (Fig. 51 B I and B 11) were insignificant, with the exception of PRs 103 and 36. In 1956 death-rates in PRs susceptible to cold were the result of the winter cold of From 1957 to 1960 cold and frosts repeatedly damaged non-hardy PRs. In 1960/61 cold damage occurred in all PRs, particularly in those susceptible to cold. In nonhardy PRs death-rates culminated in 1962, but in hardy ones in 1962 or in This phenomenon was also recorded on other EPs, and might be explained by heavier damage in PRs susceptible to cold, and by lighter damage in hardy PRs (Chap ). However, the severe spring frosts of 1963, in their turn, contributed to the dieback of the trees cankered in SYM rates of 1964 show that the dieback of the trees had ceased. Nevertheless, the recovery of trees damaged in 1961 had not been completed in PR 101 was an exception; in the July frosts of 1964 the dwarfs, whose development had been retarded and which had remained in the ground zone, perished. The segregation of dwarfs in the progeny of some individual trees of this PR might have a genetic background.
127
128 Experimental plantation 26. Fig. 52 A and B. Table 16 and Experimental plantation 29. Fig. 53 A and B. Table 17 Both EPs are situated near each other on a large logged-off area on an upland plateau, near the timberline. Bare hill tops encompass the plateau. This deforested area is bordered on the east by a virgin pine forest. In the beginning of the 1950's a birch undergrowth was exterminated on this loggedoff area which was thus made completely bare. Trees, representing local PR 11, mere chosen from a stand growing in the vicinity of the EP on the edge of a forest. On both EPs the same PRs were tested. EP 29 lies on the edge of a forest, close to the stand representing PR 11. EP 26 is situated on a logged-off area 1 km to the west of EP 29 and its site is a characteristic frost hollow. The edaphic conditions on the logged-off area are variable. Although much care was devoted to the choice of the EP sites, two PR plots in one of the replications on EP 29 and two whole replications on EP 26 had to be excluded from estimations of experimental data in connection with the losses in plants caused by the summer drought of The position of CR'I curves representing different PRs is similar on both EPs. However, death-rates on EP 26, for all PRs, are considerably higher than those for EP 29. PR 9 differs slightly from the others by its response to the extreme weather conditions prevailing in 1956, 1958 and particularly in Local PR 11 had the least CR'I rate, ~vhich in 1964 was 64% on EP 26 and 40% on EP 29. Local PR 11 proved to be most resistant to cold and suffered least from the BSG of Even PR 4, originating from 69" latitude in the north of Norway, had a higher CM rate in 1964, namely, 73 % on EP 26 and 54% on EP 29. The higher degree or hardiness in the local PR is not surprising and theoretically it is well founded. Data found in Tables 16 and 17 on the transfer of PRs elucidate this most clearly. High SYM rates emerge in a wave-like manner. SYhl curves form three culniination cycles, one in 1956, the other in 1958 and the third from 1961 to The cause of the high SYM rates of 1956 was chiefly the summer drought of The second culmination in 1958 was due to winter cold and early spring frosts. It is of interest to note that in 1958 SYM rates on EP 26, which lies in a frost hollow, were much higher than those on EP 29, which is situated on a flat area on the edge of a forest. SYM rates in 1958 were higher than during the period Nevertheless, on both EPs total losses of trees caused by the BSG of 1961 were higher from 1961 to 1963 than losses in the single year The third culmination cycle had the highest values as regards the SYM rates on EP 29 in 1963, but on EP 26 they were highest in
129 Fig. 53 A. CM of 7 PRs in EP-29 (see Table 17). 40, % SYM EP 29 Fig. 53 B. SYM of 7 PRs in EP 29 (see Table 17).
130 m m o m c o ~ o r - * m o r - m m + T T + T? I

131 1961, 1962 and 1963 respectively, owing to the susceptibility of PRs to cold, and also to the degree of severity of the BSG. In 1961 snow damage manifested itself in the upper part of the crowns on both EPs, and in 1963 leaders were killed by frost during the spring frosts. Recovery of trees girdled in 1961 has not yet proceeded satisfactorily. The results obtained from the experiments on both EPs clearly show the difficulties which arise when afforestation is carried out in site conditions on large logged-off areas. The average afforestation results on areas in the neighbourhood of the EPs show even worse results. Experimental plantation 27. Fig. 54 A and B and Fig. 55. Table 18 The EP is situated at a distance of 8 km from the centre of the actual town of Kiruna, on an upland plateau. The site of the EP is surrounded by a pine forest and mountain birch undergrowth. The site is flat and is a characteristic frost locality. Mortality curves expressing SYM rates show definite peaks in 1956 and The cause of particularly high frequencies of losses in 1956 was the exceptional drought of 1955, as well as the spring frosts of The combined effect of both factors was such that it was in~possible to distinguish how important each of them had been separately. In the ensuing years, after 1956, frequencies of losses diminished gradually until This is a characteristic phenomenon in those cases when trees are severely damaged by cold. One is inclined to assume that cold had been a more formidable cause of damage than the excessive drought of In the spring frosts of 1963 the above EP suffered more than all others (Chap. 2.1). The influence of frost on trees was of a twofold character. Damage was caused both to healthy trees, which had not been injured by cold during the preceding years, and also to those which were partially girdled and cankered in In trees which had not been injured previously, cold damage manifested itself in the form of dead leading shoots and lateral branches, but at the same time vigorous, well-developed trees, which had reached a height of 1 metre to 1.5 metres, were killed by cold. Losses in plants were considerable in PR 8, which originated from a locality in the vicinity of the timberline near Kiruna, and also in PR 10 (Fig. 54 B). In the frequencies of dead trees were also included those girdled in 1961 and some individuals injured by rodents. However, the primary cause of losses in plants in 1963 was the effect of the spring frost of the same year, which also influenced frequencies of losses in In 1964 SYRl rates on EP 27 were relatively high in comparison with those on the other EPs, on which SYM rates had already diminished to a considerable extent and trees cankered in 1961 had recovered.
132 Fig. 54 A. C31 of 7 PRs in EP 27 (see Table 18). SYM EP x-x I Fig. 54 B. SYM of 7 PRs in EP 27 (see Table 18).
133 No. 91 a 11, Y Localily Table 18. Experhnental plantation 27. Norrbotten, Kiruna, Kauppinen. y: 67' SO', 2: 20' 27', H,: 360, Y: 100. Transfer of PR Diff. CM Living trees 1963 I h (%I % 1 (x) x x x ZX I BSG Rod. 69" 55' 23" 15' Norway, Alla, Aroniis 67" 50' 20" 27' Norrbolten, Iciruna, Kauppincn 67" 50' 20" 16' Norrbotlen, Icirnna, Noliulosvara 66" 50' 23" 09' Norrbotten, Korpilombolo 65" 50' 23" 18' Norrbotlcn, Kalix, hldrllrask 65"08' 1S053' Vasterbotten, Rlal5, Stron~lors 66" 03' 17" 57' Norrbotten, Arjeplog 0: original lrccs A: total number a,: damaged by spring Irost in 1963 (XI., frozen needles x: frozen leaders and lateral branches t: tolal = original -k rcplaeecl trees a: unimpaired a,: damaged by BSG in 1961 and by rodents in 1963 x : frozen tips,: frozen down to base
134 Fig. 55. Effect of severe spring frosts in 1963 on 7 PRs in EP 27 (see Table 18); unimpaired trees (a), damaged by frost (a,) and damaged by other agents (a,). Frequencies of the spring frost injuries of 1963 in different PRs are shown in Fig. 55 and Table 18. Assessment was carried out in September 1963, approximately four months after the occurrence of spring frosts. At the same time these data indicate the cause of losses in trees of different PRs in 1964 (Fig. 54 B). Owing to the spring frosts PR 8, which may be reckoned as one of the most hardy PRs, had suffered most of all. Some of the trees in this PR had already flushed and had formed shoots a few centiinetres in length. However, most of the trees had not yet flushed. The frozen leading shoots showed at what stage of flushing the trees had been when spring frosts occurred. PR 10 was the next in order as regards injuries caused by spring frosts, but PR 7, whose mother trees grow close to the EP, suffered least in the spring frosts of The variable response of PRs to spring frosts may be explained by the different timing of flushing. It is also of importance to note that there had been two spring frost periods, one in the end of May and the other in the middle of June. Cases, where trees from northern sources were poorly adapted to southern latitudes and had severely suffered from spring frosts, were reported by HEIKIXHEIBIO (1949) in Picea excelsa, by OZOL (1953; cf. PARKER, 1963, p. 158) in Juglans mandshurica and J. cinerea, as well as by KRIEBEL (1957) in Acer saccharum. Beginning with 1957 the CJI rates of local PR 7 were constantly the lowest, whereas the highest CAI rates were recorded in PR 8. It is true that the development of plants in PRs 8 and 101 during the initial years was weak,
135 and this explains the high frequencies of losses in both PRs in 1955 and Beginning with 1958 the Cn4 curves of PRs 8 and 7 ran parallel up to 1963, when PR 8 suffered considerably in the spring frosts. The CRI curves of other PRs occupy the position in the diagram which corresponds to their hardiness to cold. An exceptional place is occupied by PR 10, which suffered heavily in the spring frosts. Experimental plantations in mountain districts, where moderate cold damage occurred in (Subregion II:3) Three EPs located in the mountain districts have several common characteristics as regards the occurrence of BSG, although their localities are wide apart and their site conditions are not similar. In these EPs the deathrate in plants caused by BSG in 1960/61 was not high. The position of the girdle on the stems was near the ground surface (mostly at the butt of the trees) or even sometimes under the ground surface, in the upper layer of the soil (Chap ). The high frequencies of losses in plants were caused by the summer drought of 1954, by the exceptionally intense drought of 1955, and in 1958 and in 1959 by the winter cold and spring frost. In this paper it is impossible to penetrate deep enough into the problem of the occurrence of BSG in the mountain districts, where the above-mentioned three EPs are situated. The number of the EPs is not sufficient and the sites of all three EPs are sheltered against the wind, which is not the case with the EPs in all other groups. However, even in the mountain districts, where these EPs are situated, BSG manifested itself on several occasions in afforested areas with devastating force, causing considerable losses. It should be stressed that EP 13, belonging to group 11: 2, might serve as an example of an EP located in a deforested area in a mountain district, on which losses caused by BSG were most considerable. In mountain districts the position of BSG was conspicuously near the ground surface, whereas on EPs belonging to other distribution groups trees were girdled at different heights on the stem. One is inclined to assume that in the mountain districts girdles were not found on a higher level because no thawing periods occurred here in winter, and therefore no hard ice crust was formed in the upper layer of the snow. On the other hand, the delayed thawing of the snow in the spring of 1961, with sudden fluctuations in temperature, induced the formation of ice crust on the ground surface and the occurrence of BSG. This interpretation of the occurrence of BSG is supported by the fact that damage by snow in the upper part of the crowns (Chap ) was rare on these three EPs. This shows once again that either no ice crust in the upper
136 Fig. 56 A. CRI of 14 PRs in EP 15 (see Table 19). 1 \ SYM EP 15 SYM EP15 Fig. 56 B I and B 11. SYM of 14 PRs in EP 15 (see Table 19).
137
138 part of the snow cover was formed at all, or, if formed, then not in such a degree as to cause girdles or damage by snow. But if, in spite of all, BSG was manifested in high frequencies in certain limited areas, this should be explained by local climatic and site conditions, which must have favoured the production of damage. Experimental plantation 15. Figs. 56 A, B I and B II. Table 19 The EP is situated on a highland plateau, enclosed by bare mountain tops. Dense natural reproduction areas of pine and a pine forest surround the EP. The ChI rates on the EP were strikingly low, considering the altitude of the EP locality. This phenomenon can be explained solely by the favourable location of the site, by the propitious local climate, and by the favourable edaphic conditions. The position of the CiCI curves of the different PRs in the diagrams was chiefly determined by losses in plants, which occurred in the summers of 1954 and The southern PR 74 is, however, an exception, since its ChZ curve transverses the other PR curves in the diagram. Transplants of PRs 42, 50 and 74, just as was the case on EPs discussed previously, had been grown in the nursery of the Stockholm province and were more vigorous than those of other PRs. In southern PRs, after the winter of 1958, when snow abounded, the fungus canker manifested itself in insignificant frequencies (Chap ). After 1961 frequencies of losses caused by BSG were insignificant, although trees with different degrees of damage were found on the EP. The highest SYhI rate in PR 74 was recorded in 1964, which can be explained by the dieback of trees, caused by the severe spring frosts of These trees had been heavily girdled and cankered in However, in hardy PRs only the leading shoots were damaged by the spring frost of Experimental plantation 19. Fig. 57 A and B. Table 20 The EP is situated on a high plateau. The site of the EP is encon~passed by a mixed pine and spruce forest. The composition of the soil is loam, with variable characteristics. The development of the EP was unfavourably influenced by edaphic conditions, which are far from being uniform. In 1955 and 1956 there were significant frequencies of losses, due to the summer drought of 1954 and the exceptioilally dry summer of In the ensuing years frequencies of losses in all PRs were insignificant, with a slight acceleration after 1961, caused by BSG. Among the girdled trees there were several in which the damage had occurred immediately under the ground surface (Chap , Fig. 27). The increase in the frequencies of losses in
139 I (1960) Fig. 57 A. CM of 7 PRs in EP 19 (see Table 20). SYM EP 19 L ( Fig. 57 B. SYRI of 7 PRs in EP 19 (see Table 20).
140 Table 20. Experimental plantation 19. JHmtland, Harrsjon. cp: 64' 18', 1: 15' 23', H,: 360, Y: 120. No. PR Transfer of PR Diff. CN Living trees 1964 N % 69" 07' 18" 35' Norway, MBlselv, RIocn 66" 50' 23" 09' Norrbotten, Korpilomholo 6S008' 18" 53' Vaslcrbotten, Ma18, Stromfors 64" 12' 20" 48' Vasterbotten, Robertsfors 62" 03' 14" 19' Jamtland, Sveg, Malmbacken 61" 27' 13" 28' Kopparberg, Bunkris 64" 18' 15" 23' Jamtland, Harrsjon

141 1963 in PRs 42 and 10, and in 1964 in PR 26, might be explained by the effect of the severe spring frost of 1963 upon the heavily cankered trees. The significant frequencies of losses in PR 50 were caused by attacks of rodents in In 1964 the local PR 106 had the least CM rate of all PRs. However, PRs 26, 4 and 23 differed only slightly from the local PR. The hardy northern PR 10 differs significantly from the others. However, its high C M rate was due to the losses during the first two years after the layout of the EP. A pleasant surprise was offered by the coastal PR 26, which in spite of the long distance transfer proved to possess a higher degree of capacity to adaptation than PR 42. The manifestation of BSG in insignificant frequencies and the surprisingly good adaptation results of most of the PRs can be explained by the favourable local climate. Experimental plantation 23. Fig. 58 A and B. Table 21 Among all other EPs the above EP is the only one which is located above the timberline in the mountain birch region, characteristic for northern Scandinavia. The EP is situated on the top of a hill, with an undulating earth surface. Elevations of the earth surface encompassing it, together with the stands of mountain birch provide a sufficient shelter for the EP. The plants grew up under the overhead shelter of birch, and were thus protected against the extremes of air temperature. Water formed by the melting snow could flow down unimpeded from the EP area in north and south directions. Both local climate and edaphic conditions are favourable for the development of the plants. In order to protect the plants against rodents, hares and black grouse, Lyrurus tetrix, preventive chemical treatment was applied every autumn. The treatment mas effective during all the years, except in 1964, when injuries caused by rodents occurred mostly in the upper part of the stems. Considerable losses were recorded particularly in PRs 10 and 23. Great losses in plants occurred in 1955 and, even greater, in 1956, due to the summer drought of 1954 and that of In 1958 a slight increasein frequencies of losses was registered, caused by the winter cold of the same year. If compared with the frequency values of other EPs, e.g., with those of EP 26 and 29, losses in EP 23 were negligible. From losses in plants were caused by the BSG of 1961, which culminated in However, damage caused by BSG was insignificant. The sudden increase in the frequencies of losses in 1964 was due to damage by rodents. The spring frost of 1963 did not cause any illjuries on the EP.
142 Fig. 58 A. CM of 7 PRs in EP 23 (see Table 21). Fig. 58 B. SYbI of 7 PRs in EP 23 (see Table 21).
143
144 The CM curves show conspicuously the differences between the PRs. During the first year after the layout of the EP the death-rate in PRs 17 and 18, which most resemble the local PR, was disproportionately large on account of the weak transplants. PRs 4 and 13, which originate from the Atlantic coastal district in Sorway, showed very good adaptation results, better than PRs 10, 12 and 23, which originate from northern Sweden Cumulative mortality and mortality in single years The analysis made in Chap. 4.2 of the factors causing mortality among trees includes 20 EPs located N of latitude 60". On this wide area the southernmost EP 9 lies on latitude 60" 4', and EP 27 on latitude 67" 50' is situated farthest north. EP 14, whose altitude is 5 metres, comes nearest to the level of the Gulf of Bothnia, and EP 13 has the highest altitude, 765 metres (Fig. 7). The range of the latitude in the meridional direction is thus 864 km and the range of altitude in vertical direction 760 metres. The latitudinal and altitudinal range of the natural habitats of PRs tested on the EPs is even wider than that of the localities of the EPs under discussion. The range of latitude for PRs originating in Scandinavia is from 55" 51' (PR 82) to 69" 55' (PR 2), which makes 1,566 km in meridional direction. The altitudes of the growth places of the PRs vary from 5 metres (PRs 40 and 60) to 850 metres (PR 45). The wide variation of the external factors and also that of the hereditary qualities of different PRs reveal the complex nature of all EPs. The interrelation of these two variable components in the experiment obtains a most variable expression in connection with the different response of PRs to site conditions on the individual EPs. It is not only the general climate of the localities which is of great importance, but also the micro-climate of individual EPs. On account of this each EP thus becomes an independent experiment object. A short review on EPs is to be found in Chap The problem of mortality in trees, which characterizes the adaptation of PRs for survival, becomes more complex, due to the different agents causing the death of trees in single years. The factors which call forth the death of trees on different EPs in one and the same year can be most dissimilar. In field experiments the control of all the different factors causing the death of trees is incomplete in such cases where damage is the result of the combined effect of several external factors, e.g., of the summer drought or of winter, spring, and autumn colds, all of which occur in the same year. The treatment and reducing to a system of all the data obtained on all EPs during was carried out according to three guiding principles: (1) Only original plants mere included in the estimation of the data obtained;
145 (2) Mortality rates were expressed graphically in diagrams; (3) EPs were divided into groups, thus introducing a geographical interpretation into the analysis of factors causing mortality in trees. Only original plants which had been growing on the EPs since the layout of the experiments were included in the estimation. Thus it was possible to reduce greatly the uncontrolled variation of mortality connected with dissiinilar replacements in different PRs. Data on the mortality in plants for eacli PR on individual EPs, that is, for each PR block, were transformed into two types of relativemortality values. These values are plotted against the time scale on the horizontal axis in the diagrams. Two types of PR time-mortality curves, the CAI curves and SYRI curves, make up the two diagrams (A and B) for each EP. Such graphical representation of mortality data supplies the possibility of describing the mortality curves qualitatively and, at the same time, of stating the magnitude of values in the mortality variation. There are several reasons why the data of both diagrams should be compared simultaneously in order to draw conclusions regarding the cold hardiness of PRs (Chap. 4.1). Cumulative mortality When analysing the character of the CM curves, it was found advantageous to divide each of them into three sections. Each section of the curve thus corresponds to a certain period of years: (1) The initial section of the curve shows the initial CN rates and covers the period from the year of the layout of the EP up to 1956; (2) The middle section of the curve corresponds to the period from 1956 up to 1960; (3) The third section of the curve covers the period after the occurrence of BSG. Data on CAI rates are to be found in the table for eacli individual EP. When comparing EPs with different geographical locations, as well as different PRs on individual EPs, considerable differences can be established between the Chl curves. In this connection it is relevant to mention the distribution of EPs into groups (Chap. 4.2): I, II:1, II:2 and II:3. Although this grouping chiefly renders it possible to shorn the variable intensity of BSG from a geographical point of view, it can be advantageously applied to describe CM curves. The shape of the CM curves of the EPs located outside tlie region of the severe BSG of 1960/61 (group I) is of a simple character. The most conspicuous example in this respect is EP 14 (Fig. 38 A). The initial mortality rates which in the diagram correspond to the years 1954, 1955 and 1956 are rather high, but they are different for individual PRs. During these years tlie rise of the curves is moderately steep. The remaining part of the curves
146 runs almost parallel to the horizontal axis and the mortality rates in 1964 differ only insignificar~tly from those of In 1964, when trees were 14 years old, the EP was at that stage of development when natural mortality among trees, due to their mutual struggle for space and nutrition, had not yet begun. Between 1956 and 1964 no injuries occurred which might have been caused by extreme weather conditions or other external factors. In 1960/61 the occurrence of BSG was insignificant and of a sporadic nature. EPs in the transition zone, where moderate damage occurred in 1961 (group II:l), display a more intricate shape in the CRI curves. The values of the initial CM rates vary coilsistently as regards different PRs. With the exception of some special cases, hardy and non-hardy PRs display their characteristics already during the first two years after the layout of the experiments. From 1956 to 1964 the difference between CNI curves of PRs in EP group II:1 and those in EP group I sharply increased. The difference between the C3I rates in 1964 and those in 1956 varies in different PRs. The CRl rates in the section of the curves which correspond to the period are rather low. The cause of the mortality in plants here is chiefly, and on some EPs exclusively, BSG. EP 18 (Fig. 41 A) gives an example of EP group 1I:l. PRs 10 and 23 show negligible CM rates. The shape of the curves representing these EPs does not deviate from the shape of the curves representing EP group 1. PR 102, in spite of its high initial CRI rates, is similar to PRs 10 and 23 as regards cold hardiness. The shape of the curves representing PRs 42, 103 and 74 differs considerably from that of PRs belonging to EP group I. Owing to the fact that the survival of plants was influenced by heavy heaving in spring, EP 17 (Fig. 40 A) differs from EPs 11 and 18 in EP group 1I:l. The shape of the CM curves in the EP group 112 differs notably from that of the other EP groups. The initial CRI rates in several EPs and particularly among cold hardy PRs is low. In the second and especially in the third section of the CM curves the CiCI rates rise swiftly. The rise of the CRl curves is particularly remarkable after the BSG of Differences between the CM rates in 1964 and those in 1956 are very great for non-hardy PRs and considerable for the other PRs. Some of the northern and upland PRs with a high cold resistance make an exception, since their CM differences for this period of years are moderate. CM curves of EPs 12 (Fig. 43 A), 16 (Fig. 45 A), 20 (Fig. 47 A), 24 (Fig. 50 A) and 25 (Fig. 51 A) are the most representative for group II:2. The shape of the CRl curves for the EP group II:3 is characterized by high initial CRl rates and moderate Chf rates in the second and third section of the CM curves. However, the available data from these three EPs [EP 15 (Fig. 56 A); EP 19 (Fig. 57,4) and EP 23 (Fig. 58 A)] do not adequately elucidate
147 the mortality problem in mountain districts. It cannot be denied, however, that several traits exist which cause EP group II:3 to differ from EP group 11:2 (Chaps. 2.3 and 6.3). CM curves of PRs 42 and 74 in the EP 18 (Fig. 41 A) differ from the other PR curves. The same may be said of PRs 42, 50 and 74 in the EP 17 (Fig. 40 A). The initial CM rates of these PRs are negligible. There is a steep rise in the middle section of the curves in 1958 and 1959, which becomes still more conspicuous in the third section. This characteristic of the shape of the CM curves is also displayed in EP groups II:2 and II:3 of those PRs whose transplants were grown in the nursery in the province of Stockholm and were bigger in size than the transplants of other PRs. These cases show how sensitively the response of the PRs to the external factors, depending on the size of the transplants at the start of the experiment, is reflected in the CM curves. More vigorous transplants on such occasions warrant a reduced provenance CM in the initial section of the curves. However, in the last two sections of the curves the initial advantages of these PRs disappear, due to the cold damage of 1958 and CM curves for PRs with long-distance transfer from the south rose steeply after the BSG of 1961, and then approached their asymptote, i.e., 100% of CM rates. However, in 1962 in several cases the asymptotical CM rates assumed constant values and CllI curves ran parallel to the horizontal axis. CM curves show that of these PRs only a few trees survived, and most of them were heavily cankered. On a few occasions some individual trees survived unimpaired. The character of the micro-site of these trees gives no support to the assumption that some particularly favourable external factors had been decisive. The survival of a few individuals with a high resistance to cold must be looked upon as the result of natural selection. The genetical constitution of the whole population as well as the variation of the inherent traits in the progeny of individual trees have been decisive in this case. The CM curves of EP 12 (Fig. 43 A) PRs 59 and 74, EP 16 (Fig. 45 A) PRs 42 and 36, EP 20 (Fig. 47 A) PR 55 and EP 25 (Fig. 51 A) PRs 50 and 36 illustrate what has been said above. Mortality in single years SYM curves as a means of expressing mortality in plants provide the possibility of showing more precisely the importance of single years and also that of a cycle of years for each individual EP. On the other hand, when comparing SYM of several EPs, the geographical location of the latter and the role played by the general climatic conditions stand out in sharp relief. But SYM expresses also the individual site conditions of an EP. This
148 circumstance is of importance when an analysis of mortality of plants is being made. After the BSG of 1961 SYM values on EPs located on logged-off areas were very great (Chap. 4.2). Unfortunately, it is difficult to elucidate the relationship between SYM and the EP site conditions on account of lack of material as regards the micro-climate of each single EP. The SYM curves consistently show increased mortality values during certain years, although there are differences among EPs. However, SYM values vary considerably also as regards different PRs in each EP. As a rule the shape of a SYM curve has four distinct peaks which appear in connection with the increased SYM rates in certain years. The positive excess of SYM rates does not always express itself in one year; it often covers two or three years in succession. These four peaks, or rather four cycles of years, give a characteristic expression to SYM curves. EP 13 (Fig. 44 B) may serve as an illustration of the above statement. The position of the individual SYM curves in the PR arrangement, with the exception of PR 10 in 1954, does not vary from 1954 to The three SYM peaks correspond to the years 1954, 1956 and 1958, but the fourth peak corresponds to the three-year cycle from 1961 to SYM and CM curves have the same time scale on the horizontal axis. The first two peaks of the SYM curves in 1954 and 1956 correspond to the initial section of the CM curves. The peak of SYM curves in 1958 corresponds to the second section of the CM curves, and the SYhI peak during corresponds to the third CM section. The first peak of the SYM curves shows the losses in plants during the first year after the layout of the EP. For EPs 9, 10, 11, 12, 13 and 14 the first check-up of the mortality in plants was made in 1954 and for the other EPs in The SYM during the first year should be considered as being composed of mortality components caused by several factors. The most important of these factors are those which have to do with differences among PIls, such as variable quality of seeds, divergencies in the size and in the degree of vitality of the transplants in the nurseries and, lastly, the variable response of PRs to the site conditions in the EPs during the first year. The differences among PRs are of both a modificative and a hereditary character and it is difficult to draw a line of demarcation between them. The quality of the seeds of PRs originating from the subalpine zone, and particularly of those whose natural habitat lies just on the timberline, was low. However, the low germination capacity of the seeds of these PRs should be explained by the insufficient maturity of the seeds in bad climatic conditions, and is therefore a PR trait of modificative character (SIMAK and Gus-
149 TAFSSOS, 1954). On the other hand, mortality in plants in some of the subalpine PRs in the EPs was very high during the first year and also in the succeeding years, although the quality of the transplants used in the experiments was comparatively satisfactory. The following PRs may serve as an illustration of this: PR 8 (Fig. 54 A and B); PRs 12, 17 and 18 (Fig. 58 A and B) and PR 39 (Fig. 56 A and B). The causes of an increased mortality in plants of subalpine PRs during the first year may be of a different character, such as the small size of the transplants, their low vitality, an earlier start of the growth process and an increased sensibility during spring frosts, owing to early cambial activity. Inbreeding depression also may be one of the explanations of the debility of plants and of their increased mortality. In any case, these considerations may be applied to the progeny of some individual trees. An assumption could be made that in some isolated trees within some populations an imposed self-fertilization had occurred. In this connection PR 102, which was represented by pines growing dispersedly and closely encompassed by a virgin Xorway spruce forest, might be mentioned (cf. EPs 18 and 21, Figs. 41 and 48). Inbreeding depression might also have been one of the causes of increased mortality among the progeny of some individual trees in PR 101 (Fig. 51 A and B) and in PR 103 (Fig. 41 A and B). When agents causing variable mortality among PRs during the first year are enumerated, an important factor should be mentioned, namely, the two kinds of PR transfer. The first is the transfer of the seeds from the natural PR habitat and the growing up of the transplants in the nursery, and the second is the transfer of the transplants from the nursery to the EPs. If both are long-distance transfers an increased mortality in plants during the first year is by no means surprising, even as regards hardy provenances. PR 10 in the EP 13 (Fig, 44 A and B) may serve as an illustration. In EPs whose first peak of the SYhI curves appears in 1954 and corresponds to the first check-up in 1954, mortality in plants caused by external factors is of a relatively simple character. The principal cause of mortality in this case was the early summer drought of 1953, and on EP 9 and EP 10 the cause was vigorous ground vegetation, as well as a powerful attack of Hylobies beetle on plants in EP 14, in spite of preventive treatment applied on the EP. On the EPs whose first check-up was made in 1955, which also coincides with the first peak of the SYhI curves, the external factors were of another character. In this case the decisive role was played by cold damage which occurred in plants in the autumn of 1954 and by the winter cold of However, the manifestation of BSG during the check-up in June 1955 was not yet complete. Therefore the BSG of 1955 and the dieback of the plant tops which caused losses in plants manifested themselves on EPs only in
150 1956. The characteristics of the BSG, the swelling of the stem above the girdle and the rupturing and piling off of the bark, appeared only on some occasions. In the succeeding years the dead plants, which hardly showed any external signs of damage, were so frail that they broke at the BSG at the slightest touch. The section of the BSG with a variable height from 5 to 30 cm above the ground surface was infiltrated by resin. On such occasions no primary breaks or fractures of the stem were recorded. Only on some EPs does the first peak of the SYM curves, corresponding to the year 1955, manifest itself conspicuously. EP 24 (Fig. 50 B) where the cause of mortality was the autumn frost of 1954 and the winter cold of as well as EP 23 (Fig. 58 B), where mortality was caused by the summer drought of 1954, exemplify this statement. On the remaining EPs no peak of the SYM curves appears, or, if it does, then only in a small degree, since the second peak of the SYhl curves assumes a most striking expression in The second peak of the SYM curves appeared in 1956, and was the result of the exceptionally severe summer drought of 1955 which embraced the whole of southern and central Sweden, but was not experienced in several districts in northern Sweden. On EPs 11 (Fig. 39 B), 13 (Fig. 44 B), 19 (Fig. 57 B) and 23 (Fig. 58 B) the mortality in plants was caused exclusively by drought. On the other hand, on EP 27 (Fig. 54 B), as well as on EPs 26 (Fig. 52 B) and 29 (Fig. 53 B), mortality in plants was the result of the combined effect of drought and the early spring frost of In 1956 on some EPs, for instance, on EPs 12, 16, 20 and 24, some plants had perished owing to the BSG which had occurred in EPs 24 (Fig. 50 B) and 25 (Fig. 51 B) are examples of those EPs which were not influenced by the drought of 1955, and where the second peak of SYM curves is lacking. The third peak in the SlN curves appears most conspicuously in EPs 13 (Fig. 44 B), 16 (Fig. 45 B), 23 (Fig. 58 B) and particularly EPs 26 (Fig. 52 B) and 29 (Fig. 53 B) are examples of this. Mortality in plants on these EPs should be explained by cold damage which occurred in the winter and early spring of On several EPs the third SYM peak was reached during 1958 and 1959, for instance, on EPs 18 (Fig. 41 B), 20 (Fig. 47 BI and BII) and 22 (Fig. 42 B). EP 24 (Fig. 50 B) is an exception, since an increased SYM rate began to make itself noticeable already in Mortality in plants in 1959 was the delayed effect of cold damage of However, there is evidence that in 1959 cold damage occurred on several occasions and that mortality in plants in 1959 was independent of the cold of Unfortunately, it mas not possible, for technical reasons, to clarify these phenomena connected with cold damage. The dissection of the stem of some plants made in 1962 and 1963 revealed frost rings in PRs susceptible to cold

151 in the annual ring of 1958 and sometimes also in that of The position of the frost ring was at the very beginning of the annual ring, but frequently the injured part of the wood took up the whole spring wood in the annual ring. This indicates that the occurrence of cold damage took place in winter or in early spring (DAY, 1934; RHOADS, 1923; nnx, 1913). The fourth peak of the SYM curves comprises the cycle of years from 1961 to 1964 and is the graphical expression of the mortality process in trees girdled and heavily cankered in This cycle of years corresponds to the age period of trees from 10 to 14 years. It is the age when trees have already grown out of the dangerous ground air zone. In this paper attention is principally drawn to the unexpected extermination of PR stands of high quality. In 1961 on some EPs mortality values were still rather low, for instance, on EP 20 (Fig. 47 B I and B 11), and only in 1962 did they increase very rapidly. This should be connected with the peculiar character of the manifestation of BSG, although the degree of cold injury decided whether death would occur immediately after the cold damage had taken place, or in the years to come. In PRs susceptible to cold, mortality rates were high as early as 1961, but in hardy PRs the rise in the values was noticeable only from the beginning of During the cycle of years from 1961 to 1964 the SYXI rates culminated in 1962 and in For EPs 21 (Fig. 48 B), 24 (Fig. 50 B), 29 (Fig. 53 B) and 27 (Fig. 54 B) the culminations of mortality rates were clearly expressed in 1963, but for EP 13 (Fig. 44 B) the culminations of these rates were reached during 1961 and 1963, with a negative excess of mortality rates in The weather conditions prevailing after 1961 must have played a considerable role in the mortality process of the injured trees. The winter cold of 1962, and particularly the spring frosts of 1963, injured the sensitive tissues in the callus overgrowth, hindered the healing of wounds in the partially girdled trees, and killed severely cankered trees (Chap. 2.1 and 5.1). The culmination of SYM rates in 1963 should be explained as the result of the severe spring frosts of 1963, which caused an increased mortality in trees cankered as early as in EP 27 (Fig. 55) offers examples of new injuries in healthy trees and mortality in trees caused by the late spring frosts of In 1963 frost injury of a similar kind, only in a slighter degree, was recorded also on other EPs in the frost region (Chap. 2.1). During these spring frosts even hardy PRs originating from northern habitats mere also injured. In 1964 mortality in trees expressed by the fourth cycle of SYRI curves may be considered as being completed. On most EPs the mortality rate of different PRs assumed those values which they had in 1960, i.e., before the occurrence of the BSG of On some EPs, however, mortality rates were

152 still rather high; for instance, on EPs 27 (Fig. 54 B), 13 (Fig. 44 B) and 24 (Fig. 50 B). During most of the cankered trees perished. The recovery of trees with a slighter degree of BSG still proceeded. It is well known that the callus overgrowth of the edge of the wound is a very delicate process. "Once frost has started a canker, several seasons more or less free from frost are required before it can heal again" (DAY, 1945, p. 30) Cumulative mortality rates in relation to the transfer of the provenances The PR time-mortality curves, both the CM curves and the SYM curves, show a distinctly balanced arrangement, i.e., a definite PR scale in the EP diagrams. Deviations in some of the sections of the PR curves have already been mentioned, but they should be regarded as exceptions. In PRs originating from the northern habitats mortality rates are low, but in PRs whose natural growth places are located to the south of the EP site mortality rates, in most cases, reach very high values. The Cbf rates should be regarded as the result of two factors. These values are dependent on the inherent resistance of the PRs to cold and on EP site conditions. In this connection the transfer of the PRs is of paramount interest, and the relationship between the CM rates and the transfer of the PRs has both a theoretical and a practical importance for silviculture. The gradient of Chi rates in relation to the transfer of PRs is the clue as to how the transfer of the PRs should be applied in afforestation. When the analysis of the relationship between CPII rates and the transfer of PRs was being made, it was possible to state that the gradient of the Chl rates was not the same for all the twenty EPs, and that the differences were connected with the geographical location of the EPs. In order to show the importance of the geographical aspect EPs were arranged in groups. It proved to be advantageous to retain the principle of grouping the EPs applied in Chap. 4.2, which shows the differences in the manifestation of the severe BSG of 1961 from a geographical point of view. Thus it is obvious that the more severe the climatic conditions on the sites of the EPs, the more strikingly do the differences among the PRs express themselves (Chap. 4.2) and the greater the gradient of CM rates in relation to the transfer of PRs. The relation of CM rates to the transfer of PRs is shown on the diagrams for four EP groups; group I, comprising three EPs (Fig. 59); group II:1, comprising three EPs (Fig. 60); group II:2, comprising eleven EPs (Fig. 61); and group II:3, comprising three EPs (Fig. 62). In the last group (II:3) the data on the Cb'I rates are most heterogeneous. EP group II:2 is the principal group and it has been made use of in this paper in order to elucidate the relationship between the CM rates and the
153 Fig. 59. Parallel regressions of X, on X, in EPs 9, Soh, 10B and 14 within region I (Tables 22 and 23). S, =CRI rates 1964 in single PRs. XI =differences in the length of growing season (+Diff. Y and -Diff. Y) in connec- Lion with the transfer of PRs from their natural habitats to EP sites. Black dots =single PRs in single EPs, e. g., =PR 23 in EP (14 C3I =4.62 and +Diff. Y =32). Circles on regression lines =mean values (X,X,) in single EPs. Regression line in EP 9 (----) makes an cxception o ~~ing to the fact that mortality in plants was chiefly depending on vigorous ground vegetation on EP site. transfer of the PRs. The eleven EPs are located in the interior of northern Sweden and represent districts where afforestation difficulties are not unusual. In any case, the eleven EPs cover a large subregion which is of considerable importance to silviculture. Professor L. TIREN (1945, 1948, 1949) paid particular attention to the problems of afforestation connected with this region, and made valuable suggestions as regards the choice of the location of the
154 / + Dlf Fig. GO. Parallel regressions of X, on X, in EPs 11, 17 and 18 ~~ithin subregion 1I:l (Tables 22 and 23). Variables X, and X, as well as designations used in the diagram, see Fig. 59. EPs when guiding principles for the experimental series were being laid down in The differences in the duration of the growing season (+Y and -Y) have been used as a means of expressing the transfer of PRs from their natural habitat to the EP site. The +Y and -Y values make the scale of the horizontal axis of the diagrams. The length of the growing season (Y) is expressed by the number of days with normal mean temperature 2 6 C per year. Y values have been computed according to LANGLET'S formula (LANGLET,
155 Fig. 61 A. Parallel regressions of X, on XI in EPs 12, 13, 16, 20, 21, 22, 24, 25, 26, 27 and 29 within subregion I1:2 (Tables 22 and 23). Variables S, and X, as well as designations used in the diagram, see Fig. 59. Regression line in EP 27 (----) makes an exception owing to the severe spring frost of 1963 hen northern and cold-hardy PRs suffered. 1936, p. 344). The Y, +Y and -Y values, as well as the corresponding CM rates of 1964, are to be found in the tables for each single EP (Chap. 4.2). Figs. 59, 60, 61 and 62 show that CM rates vary considerably. Similar PR transfer values often correspond to most variable Ch4 rates. Variations in the general climate and in the local climatic conditions on EP sites are the cause of a broad variation range of the PR response to external factors. Even the
156 Fig. 61 I3. Individual regressions of X, on XI in EPs 12, 13, 16, 20, 21, 22, 24, 25, 26, 27 and 29 within subregion II:2 (Tables 22 and 23). Variables X, and X, as well as circles on regression lines, see Fig. 59. Cf. Fig. 60 A. Regression line in E P 27 (----) makes and exception owing to the severe spriug frost of 1963 when northcrn and cold-hardy PRs suffered. variation of the CAI rates in the local PRs is most striking, and can be most frequently explained by different site conditions on individual EPs. A great variation exists among the CPII rates of local PRs in EP group II:2, as seen from Fig. 61:19% (EP 20), 21 % (EP 25), 24% (EP 27), 34% (EP 21), 36 % (EP 12), 37 % (EP 24), 40 % (EP 29), 64% (EP 26) and 77 % (EP 16). These CM rates show that the local PR does not always possess the necessary
157 Fig. 62. Parallel regressions of X, on X, in EPs 15, 19 and 23 within subregion II:3 (Tables 22 and 23). Variables X, and X, as well as designations used in the diagram, see Fig. 59. Regression lines of EP 19 and EP 23 (----) make exceptions, owing Lo mortality in plants caused by rodents in degree of adaptation. This circumstance has been referred to earlier (WIBECK, 1933; GUSTAFSSOX, 1962; EICHE, 1962). On EP 16 the value of the local PR for afforestation aims is insignificant, whereas PRs 23 and 6 (Fig. 45 A and B; Table 11) originating from the north, show the best adaptation to EP site conditions. In EP group II:2 the CM rates of the PRs transferred from the south to the north are so high that the transfer of these PRs with the view of afforestation is hardly worth consideration. However, on the EP sites with unfavourable climatic conditions the transfer of PRs from northern
158 Table 22. Regressions of X, on XI. (Calculated on the basis of data in Tables 2-21, Chap. 4.2) EP group I I R 14 Total regression Parallel regressions I :: 11: 1 11 Total regression Parallel regrmsions Regression equation Coefficient in regressions ai n parallel egressions 11: 3 I5 1 ;: Total regression Parallel regressions X, = Xl X, = X1 X, = GXl X, = l.4933X1 A', = l.5lj6X1 X, = X1 X, = Xl X, = Xl X, = O.9287X1 X, = X1 X, = X1 X, = Xl X2 = cti X1 Variables: X, = CAI rates 1964 in single PRs X, = differences in the length of ~rov-ing season (+ Diff. T and- Diff. Y) districts has proved to be efficient not only as regards plant mortality, but also as regards the tree height of these PRs, which is seen from the corresponding EP tables. This phenomenon has been the subject of earlier comment (WIBECK, 1933; GUSTAFSSOX, 1962; EICHE, 1962; STEFANSSOY, 1965). However, at present it is not possible on the basis of the available data to regard the faster growth of the PRs transferred from the north as being a general rule. The gradient of the Chl rates in relation to the transfer of PRs clearly differentiates the four EP groups. This is seen mos tdistinctly when EP group I
159 Table 23. Analysis of variance in regressions. Regressions of X, on XI. (Calculated on the basis of data in Tables 2-21, Chap. 4.2) 1 Sum of I D.F. I )lean I Source of Variation group Squares Square I Fig : 1 Fig : 2 Fig : Fig. A. Individual regressions (single EPs) B. Parallel regressions C. Total regression D. B-A E. C-B F. C-A A. Individual regressions (single EPs) B. Parallel regressions C. Total regression D. B-A E. C-B F. C-A A. Individual regressions (single EPs) B. Parallel regressions C. Total regression D. B-A E. C-B F. C-A A. Individual regressions (single EPs) B. Parallel regressions C. Total regression D. B-A E. C-B F. C-A *** Statistically significant at tlle 0.1 per cent level Variables: X, = ChI rates 1964 in single PRs X, = differences in the length of growing season (f Diff. Y and - Diff. Y) is compared with group II:2. The differences between the diagrams (Figs. 59, 60, 61 and 62) are expressed by means of regression curves. A statistical analysis of the relation of the Chl rates to the transfer of PRs supplements the graphical representation of the data (Tables 22-25). Most attention has been devoted to group II:2 (Fig. 61), since it is the most important of the four groups. The gradient of CAI rates in EP group I (Fig. 59) is quite insignificant and the transfer of PRs from tlle south can be applied successfully. EP 10 (Fig. 37, Table 3) is an example of how successful the long-distance transfer of PRs can be. In EP group 1I:l (Fig. 60) the gradient of the CM rates is expressed more clearly; however, a moderate transfer of PRs in this EP group is still possible. On the other hand, in EP group II:2 (Fig. 61) all southern PRs suffered great losses in plants, and even local PRs did not always prove to be
160 1 EP group - EP I Total regression Parallel regressions Table 24. Regressions of X, on Xl and X,. (Calculated on the basis of data in Tables 9-18, Chap. 4.2) Regression equation Coefficient in regressions I Variables: X, = CAI rates 1964 in single PRs Xl = differences in the length of groning season (+ Diff. Y and - Diff. T) x, = 161 EP group Table 25. Analysis of variance in regressions. Regressions of X, on XI and X3, (Calculated on the basis of data in Tables 9-18, Chap. I 4.2) I Sum of Source of Variation D,F, 'lean Squares Square 11: 2 *** Statistically Variables: X, = A. Individual regressions (single EPs) B. Parallel regressions C. Total regression D. B--4 E. C--R F. C-h Individ~ml regressions of X1 on X, - Individual egressions of ST(, on S, and S, Linear Regression (X, on S,) Curved Regression (X, on Xl and X,) / ( / Difference X, = X, = significanl at the 0.1 per cent level CAI rates 1964 in single PRs differences in the length of growing season (+ Diff. Y and -Diff. Y) (XI)" GI sufficiently hardy. Thus, the transfer of northern PRs becomes an urgent, pressing problem. In localities with severe climatic and unfavourable edaphic conditions the transfer of northern PRs seems to be the only satisfactory solution with the view of meeting the requirements of afforestation. The gradient of the CAI rates in EP group II:3 (Fig. 62) is moderate. Some of the PRs transferred from the south (Fig. 56, EP 15, PR 50) show very good ad-
161 aptation to the site conditions on the EP. Unfortunately, the data on the CAI rates in this EP group are not sufficient. As seen from the analysis on the mortality of plants, the north of Sweden cannot be regarded as that region to which equal requirements as regards the transfer of PR are necessary. Besides, when choosing PRs with the view of afforestation particular attention should be paid to both the extreme local climatic conditions and also to the unfavourable edaphic conditions (cf. LANGLET, 1957).
162 5. Cause of damage to plants Among the mrious agents causing damage to plants, cold is the primary factor. Damage by cold, in its turn, actuates damaging agents of a secondary character. The severe cold damage of 1960/61 is an example of the complex effects caused by cold. Of all the different types of cold damage in trees, the most severe proved to be BSG. I-Iigh mortality rates in trees during the periocl furnish us with evidence regarding the scope of the damage. The occurrence of BSG is connected with extreme climatic conditioils prevailing in the late winter and early spring of 1961 (Chap. 2). The mutual relationship between BSG and other types of cold damage and their modifications has already been dealt with in Chap. 3. In the present chapter attention is principally devoted to BSG, and an analysis of the agents causing damage is made. As regards the other types of cold damage it is not too difficult to find an explanation of their origin if cold is accepted in principle as the primary damaging agent. In order to avoid misunderstanding, it should be stressed that cold is not the only primary cause of damage and mortality in plants in northern Sweden. That which is very dangerous to plants is a fungus disease, snow blight, Phacidium infesfans. The disastrous effects of this disease on afforestation areas are well known (BJORKMAX, 1948) and its negative role has been proved by previous PR experiments (SCHOTTE, 1923; LASGLET, 1936). Phacidium infesfans is often considered to be the chief cause of mortality in plants, and views have been expressed that if it were possible to avert the infection of plants by Phacidium infestans, the transfer of PRs in northern direction with the view of afforestation could be carried out efficiently, thus obtaining a higher growth rate in trees (LANGLET, 1957). Southern PRs are most susceptible to damage by Phacidium infesfans, whereas northern PRs show a remarkable degree of resistance to this disease. The varying susceptibility of different PRs to infection by Phacidium infesfans was re-examined in field experiments by the common efforts of the Department of Forest Genetics and by the Department of Forest Botany. An experimental series was laid out in Plants were infected according to a definite plan, beginning with The same PRs and transplants from the same nurseries and of the same age were used in the experiment as those in the PR experimental series (Chap. 1). These experiments, where plants were infected with Phacidiun~ infesfans, confirmed the previous findings,
163 namely, that southern PRs and PRs originating from low altitudes are more susceptible to this disease than northern and upland PRs (BJORKMAN, 1963). On EPs the infection of plants by Phacidium infestans was eliminated by consistent annual spraying of plants in late autumn shortly before the fall of snow, until trees reached a height where the disease no longer could jeopardise them. From 1962 spraying was interrupted on some EPs, and in the following years on others. Protection of plants against Phacidium infestans was carried out on 18 EPs, located in the region north of the river Dalalven, where plants are exposed to danger as regards this disease. It often proved to be necessary to spray the plants two or three times during the same autumn, in those cases where snow had melted, or where continuous rain had washed off fungicides applied by spraying. This consistent protection of plants gave satisfactory results, and it was possible to ascertain that on EPs treated in this way mortality in plants was not caused by Phacidium infestans, since this fungus had been completely eliminated by spraying. Protection of plants against attacks by Hylobies beetles was also consistently carried out during the first few years after the layout of the experiments by spraying those parts of plants which were exposed to danger. In order to protect EPs against the damage by elk (Alces alces alces) and reindeer (Rangifer tarandus) special fences were erected. Among twenty EPs only six did not require any protection by fencing. Much work has been devoted to provide necessary protection of EPs against all the damaging agents mentioned above, and it is gratifiyng to state that these protective measures proved to be satisfactory. Even if on individual EPs some plants were dainaged (Chap. 4.2), such damage was not frequent and cannot exercise any influence on the conclusions regarding the role of climatic factors and their being the primary cause of mortality in plants. The PR time-mortality curves on the diagrams of the EPs are a convincing proof of the fact that the principal cause of mortality in plants is cold (Chap. 4.2 and 4.3). The CAI and SYRl rates in these PR curves have been obtained by transforming the data on the death of individual plants, recorded on the EPs. However, taking into consideration different views regarding the origin of BSG and also regarding the other types of cold damage, it is necessary to give a description of the external conditions under which damage by cold occurs. The further analysis of the problem is made by considering two aspects of the diseases in plants, caused by cold effect. This approach to the problem has a historical background, but by no means lacks current interest. What is of importance in this connection is the relative roles played by the climatic conditions on the one hand, and the infection by fungi on the other. Physical factors and pathogens can be described as the concrete definition of the pro-

164 Fig. 63. Cambium killed in 1961, on a restricted area at the base of the stem with adjacent sector of injured xylem infiltrated by resin, in EP 12, PR 56. Owing to the callus overgrowth the wound was healed ~ ~ithin two years. Photographed in the spring of blem. These two terms have been used by STEVENS and YOUNG (19271, DAY (1928, 1945) and BOYCE (1961) and they correspond to concrete conceptions Physical factors Destruction and dieback of cambium, phloem and cortex The size of the BSG portion on the stems of the damaged trees varies considerably. Its diameter varies from approximately 0.6 cm to 6 cm. The height of the BSG portion sometimes hardly reaches 1 cm, but the portion may be 50 cm high or even higher. The location of BSG above soil level also varies considerably. In most cases BSG is situated on the stem in the 30 cm zone above the ground surface. However, on several occasions BSG occurred immediately below the surface of the ground and sometimes exactly at the ground surface level. Only in a few cases had girdles occurred higher than 50 cm above the ground surface. However, in these cases more or less clearly expressed signs of BSG were also recorded at a lower level on the same stem. In any case, these phenomena definitely differ from another type of cold damage, namely, the girdling of the main stem in its upper part (Chap ). The injury in the BSG portion normally centres in the cambial region. The death of cambium represents the severest degree of this type of

165 damage. The girdling is complete when killed cambium encircles the stem. In most cases the stem is only partly girdled. The dead portion of the cambium sometimes appears only on a restricted area in the shape of small patches (Fig. 63) and, thanks to the callus overgrowth, the wound is healed within a few ensuing years. However, as a rule the affected area usually encircles a smaller or larger part around the stem. If no other types of cold injuries occur in such partly girdled trees, if the crown of the tree is unimpaired and the vigour of the tree in the following summer is sufficient to produce new photosynthetic products, callus overgrowth is formed on the edge of the injured area and frost canker begins to develop. In those cases where a vigorous callus overgrowth is formed, a swelling appears on the stem above the girdle (Figs. 1, 2, 26). Three samples of partly girdled trees with varying characteristics will be discussed here. Figs represent the longitudinal and transverse sections of the BSG portions in trees. From the transverse sections which were taken from the injured parts of the tree at a distance of 2.5 cm apart, only the most representative were chosen, whereas efforts were made to include the whole portion of the BSG. In Fig. 64 the histological analysis shows an example of BSG where the injury affected more than a half of the area around the stem. The BSG was 25 cm high and was situated on the tree immediately above the soil level. The crown of the tree was unimpaired and the injury had influenced the growth rate of the tree only inconsiderably. The structure of the stem in the BSG portion is seen in the transverse sections. Only a half of the xylem which had been formed before the occurrence of the damage of 1961 was left unimpaired. The further formation of the wood in the damaged portion was excentric and actually took place outside the circumference of the stem of In the interior of the stem a sharp dividing line was formed by resin between the injured and unimpaired wood (Fig. 64 c). Owing to the resin infiltration the wood was well protected against dehydration and also partly against infections by fungus diseases. There is every reason to assume that such a healing of the wound favours the recovery of the tree. The vigour of the tree did not deteriorate during the first three years after the occurrence of the damage. However, the callus overgrowth was injured by the winter cold of 1962, the edge of the canker was cut back at some points and resin infiltration occurred in the newly-injured area. This illustrates the well-known fact that the edges of the canker are particularly susceptible to cold and that they are liable to be killed (DAY, 1928, 1931; DAY and PEACE, 1946). Fig. 65 shows a partly girdled tree where cambium was killed in the BSG portion on two large areas, on the opposite sides of the stem. In connection with the intense dieback of the canker for three years in succession, the shape

166 Fig. 64. Partly girdled and cankered h e in 1961 in EP 12, PR 56. a, top and BSG portion; b. longitudinal section and BSG portion; c-f, transverse sections; c, at the centre of the frost canlter, d, 5 cm above the centre of the frost canker; e, at the upper edge of the frost canker; f, above the upper edge of the frost canker. Cf. description in Chap Photographecl in October 1963.
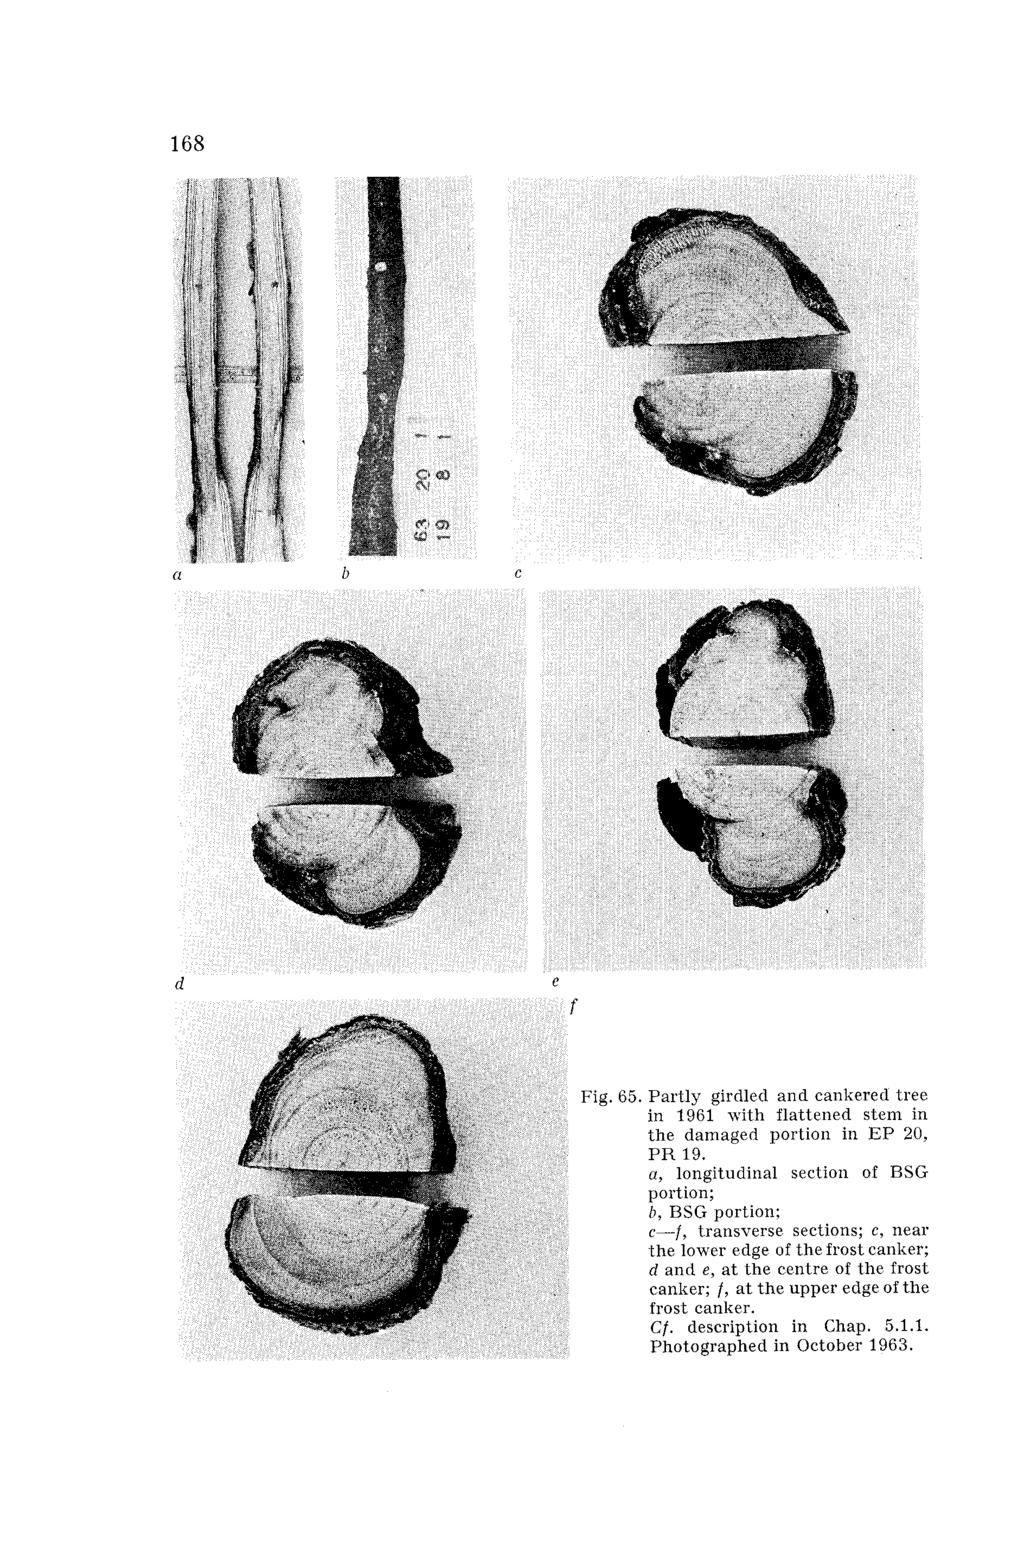
167

168 Fig. 66. Tree partly girdled and heavily cankered in 1961 (EP 12, PR 50); died in the autumn of a, longitudinal section and BSG portion; h-e, transverse sections; b and c, at the centre of the frost canker; d and e, at the upper edge of the frost canker, showing sectors of xylem with resin infiltration which occurred after the cold darnage of Photographed in October 1963.

169 of the stem became flattened in the damaged portion. This particular case of BSG was most conspicuous, and it was easy to discern it both among damaged and also unimpaired trees. It is hardly to be expected that trees suffering from such kind of BSG could survive. However, on EPs laid out by SCHOTTE and WIBECK during a few trees damaged in this way had survived as late as A still more severe case of BSG is shown in Fig. 66. Killed cambium took up approximately two-thirds of the circumference of the stem. However, boundaries between sectors with injured and unimpaired xylem in the BSG portion were not clearly defined. The edge of the canker had been cut back after the winter cold of 1962 and the tree lingered on up to the autumn of This BSG case is representative for a great many trees girdled in However, in most cases the damage was of a more complicated nature. Fig. 26 shows a case of BSG where only a narrow string of cambium was unimpaired and the annual ring of 1961 was very thin at this particular place. The tree died in the early spring of The examples shown in Fig. 1 are analogous to this case. The cases of BSG shown in Fig. 2 are characteristic for the girdle located on the stem approximately cm above soil level, with a few small branches covered with living foliage below the girdle. At the base of the tree very thin annual rings had been formed in 1961 and 1962, but annual rings formed above the girdle in 1961 and 1962 were broad, whereas the annual ring of 1963 was narrow. These trees survived for a further three years after the occurrence of BSG. There are several reasons why BSG is often inconspicuous and difficult to discover, and why no swelling appears above the girdle in the damaged trees. The principal reason is defoliation of the crown. Defoliation, in its turn, can be induced by other types of cold damage. Fig. 4 is an example of how even severe cases of BSG often pass unnoticed. The portion of the BSG on the stem is often not clearly seen in partly girdled trees, even when girdling occurs at several levels above the ground surface, and damage is situated on different sides of the tree. In such cases the damaged area is not clearly defined and does not differ from the unimpaired part of the stem. The healing of the wounds proceeds slowly or does not take place at all, the pan formation of the canker is inconspicuous. Naturally, the varying characteristics of BSG are greatly dependent on the degree and extent of the injury. The damage in partly girdled trees is most conspicuously expressed in the centre of the frost canker. At this level of the BSG portions in transverse sections (Figs. 26, 64 c, 65 c and 66 c) the dead area is larger than in the transverse section up and down from the centre of the canker. Between the xylem and the outer bark all living tissues, cambium, phloem and inner bark are killed. Sometimes even the outer bark is sloughed off on the BSG portion
170 (Chap ) and xylem is exposed. In the corresponding xylem sector, inwards from the dead area around the stem, all live elements in cambial rays and resin ducts are killed. Thus the damage embraces not only the periphery, but also reaches the centre of the stem in radial direction. The resin infiltration in the damaged parts of the stem can be most complicated. In most cases it colours the xylem sector brown in radial direction as far as the centre of the stem (Fig. 63). Resin infiltration in xylem takes place most vigorously in the vicinity of the edge of the wound (Fig. 64 c). The colouring of resin infiltration in the periphery of the dead xyleni may sometimes vary quite considerably (Fig. 66 c). There is every reason to believe that the death of the cambium around the stem at different points did not always occur simultaneously, but that it proceeded successively. The demarcation line between the dead and the live areas of the BSG in the vertical direction up and down from the centre of the canker is expressed just in the same way as was the case in the transverse sections. It is clearly seen in the longitudinal and transverse sections in Figs The only difference here is the vigorous callus overgrowth and often a swelling in the upper part of BSG above the girdle, which never occurs in the lower part of BSG. The nature and the extent of BSG are sufficiently revealed in the examples discussed above as regards partly girdled trees. No essential differences exist as regards the nature of the damage between completely girdled and partly girdled trees. Only a narrow cambium strip left unimpaired in the case of BSG shown in Fig. 26 marks it off from complete girdling. However, in the cases of BSG discussed above there is not sufficient evidence to show in what succession the death of cambium, phloem and even of periderm had occurred. Indirect evidence of phloem injuries caused by the cold of 1962 is seen in transverse sections in Fig. 66. Resin infiltration had occurred in a limited xylem sector in radial direction of the cambial rays, and had reached the centre of the stem. Thus the annual ring of 1961 formed the outer limit of the xylem sector. The formation of the annual ring of 1962 had proceeded without impediment, and no resin infiltration had occurred. It might be assumed that the phloem had been injured by the cold of 1962, and that in the adjacent BSG area the supply of nutrition to the cambial rays in the xylem sector had been interrupted (BRAUN, 1963, p. loo), causing the death of the living elements in this xylem sector, while leaving the cambium unimpaired (CHANDLER, 1913). A mosaic consisting of thin rents, slightly marked by resin flow in the dead outer bark (Chap , Fig. 29 a), also indicates that the phloem had been injured in the corresponding area of the stem. Resin flow originates in the
171 schizogenous resin ducts, which are located in the phloem. Such rents in the bark are considered to be typical symptoms of phloem killed by cold (DAY, 1931, p. 52). The anatomical examination of the injured parts was not made immediately after the occurrence of the damage in Later, in 1962 and 1963, the rupture of the phloem could be discerned, but among other uninjured tissues injury did not appear in well-defined outlines, as the rhytidom strings had penetrated into some portions of the injured phloem. On the strength of field observations on the EPs, and on the basis of laboratory analyses, it can be concluded that in the affected areas of the BSG portions injured by the cold of 1961 all living tissues had, in the majority of cases, been killed. However, on some occasions on the restricted areas of the BSG portions only phloem (and also the periderm) had been injured. The annual ring of 1960 in the BSG portions appeared to be normal and uninjured. This annual ring differed from the others only by slight lignification in the summer wood, which was less apparent. In northern PRs the differences between the annual rings are not very conspicuous, whereas in PRs having natural habitats located to the south of the EP these differences are striking. The slight lignification of the summer wood in the annual ring of 1960 was caused by unfavourable weather conditions prevailing during the grow-ing season of that year (DIETRICHSOS, 1961, 1964). The annual ring of 1961 was formed after the occurrence of the severe cold damage, which took place in winter and early spring. This annual ring did not appear in trees where cambium had been killed. The formation of callus overgrowth at the edge of the wounds, and the development of frost canker, are typical for areas affected by cold. In the earliest stages of the 1961 annual ring parenchymatous tissues were sometimes found at the edge of, and near, the canker. "Frost tissues" of this kind, which touched the annual ring of 1960, indicate that cambium had been injured before new wood was formed (MIX, 1916; RHOADS, 1923; HARRIS, 1934; DAY, 1928, 1931; DAY and PEACE, 1934). On the other hand, there are no indications of the formation of abnormal tissue in the zone of the spring wood of 1961 in either the unimpaired parts of the stem or in the BSG portions. No ruptures were found in the tracheid walls in the xylem sectors of the BSG portions infiltrated with resin. On the other hand, such ruptures were revealed in the tangential walls of tracheary elements in cambial rays and in leaf and branch traces. Ruptures manifested themselves in radial sections. Anatomical examination was made of some BSG portions selected for that purpose. There is every reason to assume that injury of this nature is rather frequent. In severe cases of BSG, rents filled with resin are seen in xylem in radial sections. They stretch themselves in the longitudinal direction of the stem

172 Fig. 67. Naturally regenerated tree in the surround of EP 26; partly girdled in The edge of the frost canker died back slowly during , but was cut back after the winter cold of 1961 and severe spring frost of The tree died in the autumn of Photographed in October a, lo~~gitudinal section and BSG portion; b, longitudinal section at the centre of the frost canker; c and d, transverse sections; c, at the centre of the frost canker; ~ hite arrow point to the edge of the frost canker in the springs of 1955, 1961 and 1963; d, above the centre of the frost canker.
173 and coincide with the vertical resin ducts (Fig. 67). The BSG in Fig. 67 is at the same time an example of heavy frost canker. BSG occurred in and the canker died back eight years in succession. In 1961 BSG re-occurred at the same place as in , and during three years in succession the edge of the canker was cut back at an accelerated speed. The tree died in the autumn of When summarizing the data obtained in the analysis of BSG as regards its character, extent and various characteristics of damage, it can be concluded that injury chiefly centres in the living tissues around the stem. Those cases where the dead cambium encircles the stem represent the severest degree of the damage. The death of the parenchymatous cells in cambial rays, and the death of the epithelial cells in resin ducts in the wood of the stem, should be regarded as the direct effect of cold, or as the result of the death of cambium or phloem in the area adjacent to the BSG portion Factors causing the damage The environmental conditions causing BSG are characterized by alternate periods of cold and thaw, and by the fluctuations of diurnal temperature during late winter and early spring (Chap. 2.3). The origin of other types of cold damage has been investigated experimentally by artificially inducing injury into plants (Chaps and 3.1.2). As regards the origin of BSG, such experimental data are lacking. The data on weather conditions prevailing in winter and spring, which influence the magnitude of the rise and fall of temperature on the surface of the snow cover and in the adjacent air layer, and which play an important role in the occurrence of BSG, are also incomplete. l\7hen considering the role played by those physical factors which have a share in the origin of BSG, attention should principally be directed to: (1) The heat balance on the micro-site surrounding that part of the stem where BSG occurs; (2) The thermal conductivity in the upper layer of snow cover and in the ice crust; (3) The changes in pressure exercised upon the stem of the tree by the ice crust in connection with the melting of the sno\v and ice, as well as by the swift freezing of the thaw water, both of which are caused by extreme fluctuations in temperature (Chap. 2.1). In addition to these three physical factors, some other physical processes which take place in the stem in connection with its freezing should be mentioned. These processes are responsible for the origin of some other types of cold damage, and in most cases they are present when BSG occurs. Owing to the unequal contraction of the bark and wood during the freeze, and also to the unequal expansion in the subsequent thawing, the pressure in the

174 stem changes and plays an important role in the origin of cold injury (DAY, 1931; WAGENER, 1949). The pressure which develops in connection with the formation of ice layer in the region of inner bark is considered to be one of the causes of injury to cambium and the formation of abnormal wood (HARTIG, 1895). Several biophysical and biochemical processes in the living tissues and cells, which are associated with cold injury or cold resistance, should also be mentioned in this connection. The diurnal fluctuation of temperature in late winter and early spring is the result of insolational heating by day and radiational cooling by night. The fresh snow reflects most of the solar radiation. Its reflexive capacity (the albedo) is 81 %, according to ANGSTROM (1925). The temperature of the air above the snow cover varies very little by day, but at night the fall of the surface temperature of the snow and of the air above it attains very large ~alues (BRUNT, 1945). The values of the thermal conductivity and heat capacity of the snow, of which about nine-tenths is air, are very low (Ibid.). The snow cover protects the parts of the tree covered by it against the fluctuations in temperature and against cold. In connection with tham in late minter, and owing to the melting of the snow in spring, the albedo values undergo certain changes. Each thaw is connected with distinct fall of albedo. According to KALITIN'S data (1929, cit. GALACHOV, 1959, p. 91), during the first phase of the spring the albedo values diminish from 82 % to 60 %, and when the snow has melted they sink to 20 %. The absorption of insolational energy calls forth increased melting of the snow and of the ice crust. Simultaneously the stem of the tree is warmed up, and the frozen tissues thaw and are saturated with water. During the night the water, formed by the melting of the snow, and the thawed tissues in the stem, swiftly freeze again. Such changes in temperature occur repeatedly during winters with extreme climatic conditions (Chap. 2.2). The micro-site around the stem of the tree is formed by the ice crust, which melts during the day and freezes during the night. The fall in temperature is exceedingly sharp even in the tissues of the stem as, according to M~x~nlov (1913, 1952, p. 97), the thermal conductivity of ice is from one-third to four times greater than that of water. The portion of the stem where BSG occurs is exposed to frequent changes of temperature and alternate thawing and freezing of the water surrounding the stem. During the freeze the stem of the tree is also subject to pressure from outside, which occurs when water freezes and thus expands. The present author has no available data as to the strength of the pressure exercised by the ice crust upon the stem under the weather conditions described in Chap That such pressure exists and is very powerful was proved by an experiment performed outside the laboratory by freezing slightly melted snow.

175 The significance of the pressure of ice and ice crust has been elucidated by TUMANOV (1940, 1951, p. 46) in experiments with winter cereals. Ice crust formed on ground surface exercises a violent pressure upon plants. In experiments, made by injecting water centrifugally into plants, it was proved that such plants developed increased susceptibility to ice pressure only during severe cold, but could withstand such pressure during slight cold without being injured. Plants saturated with water froze and died at considerably higher temperatures than plants used in control experiments. According to TCMANOV and K~~s~vc~v(l959) cold resistant woody plants (birch and spruce) can withstand sudden fluctuations of temperature in winter owing to their capacity to dehydrate, which takes place because of water flow from the hardened protoplasts and formation of ice in the intercellular spaces. TUMANOV and KRASAVCEV (1962) also made a study of the influence of the thawing rate on the survival of hardened woody plants. The cause of death after rapid thawing is the almost instantaneous absorption of large amounts of thawed ice water from intercellular spaces by the dehydrated protoplasts. In Germany, as early as 1883, HARTIG described cases of BSG (Einschnurung) found in nurseries, in seedlings and transplants of Norway spruce and European silver fir two to four years old. Damage took up a portion of the stem between 2 and 4 mm wide, and was situated at the ground surface level. HARTIG explains that the damage was due to the late frosts in May, when the division of cambium cells in the plant was in progress. Frost occurred after rain, when the soil was saturated with water. The death of carnbium is explained by HARTIG as the result of the pressure exercised by the upper layer of the frozen soil and ice crust upon cambial tissues. Inthose places in the nurseries where the earth surface was covered by a thin layer of moss, plants were protected against the pressure of ice crust. M7hen HARTIG presents his hypothesis he points, however, to the lack of experimental evidence, and to the fact that such kinds of damage had not been met with in afforestations. Later HARTIG'S collaborators diverted the explanation of the causes of this damage by centralizing attention upon fungus diseases. BSG (Trockengurtel) in maple and ash seedlings growing in nurseries was observed by AUMANX (1883) in 1879 and 1883 in Germany. AUAIASN considers severe March and April frosts, which occurred immediately after a spell of warm weather in late winter, to be responsible for the occurrence of the damage. AUMASN also mentions the weather conditions which prevailed during the previous autumn, which were most unfavourable for the hardening of plants. The injury was located 2-4 cm above soil level, and comprised a portion of the stem between 1 and 2 cm wide. The damaged area on the stem coincided with the surface of the frozen snow cover. AUMANS assumed
176 that the sudden fluctuations of the diurnal temperature, which affected the contact area of the plant adjacent to the snow cover, had been the cause of the damage. The fundamental investigations of BSG carried out by DAY (1928, 1931) and by DAY and PEACE (1934,1937, 1945) deal with several species of conifers. Douglas fir, Sitka spruce and other conifers suffered severely in England at the end of April and the beginning of Nay, 1927, owing to frost killing the cambium and thus causing cankers. The most serious loss was caused by canker girdling the lower part of the stem, thus entirely ruining the tree (DAY, 1928, p. 29). The cause of BSG was the low temperature of the air lying immediately above the ground flora, in which grass dominates (Ibid., p. 30). On those occasions the cold affected the actively-dividing cambium, which is sensitive to low temperatures. When analysing frost canker in European larch, DAY (1931) proved that injury to cambium can occur during all seasons of the year when cambium changes from a cold-hardy to a coldsensitive condition. During the particularly severe May frosts of 1935 in England excessively low temperatures occurred among the tips of the herbage, and in small trees the cambium was killed at that level and not above it (DAY and PEACE, 1945, p. 30). Damage of this kind was specially noticed in Scots pine (Ibid., p. 30). Summarizing the effect on Scots pine of the May frost in 1935, DAY and PEACE (1945, p. 51, Table XVII), however, consider injuries as being insignificant (see Introduction). On the basis of data collected by DAY and PEACE regarding BSG in Scots pine, it might be inferred that, although Scots pine is liable to be girdled, the damage did not manifest itself on a large scale in spite of the severe May frosts of 1935 and in spite of cambial susceptibility to cold during this season of the year. The origin of BSG in northern Sweden differs from the origin of BSG in Germany and Britain, described above. In Sweden BSG occurs in late winter and early spring when cambial activity has not yet begun. However, at this time of the year the cambial tissues are no longer under winter resting conditions and are no longer cold-resistant. BSG does not occur every year and no cases of BSG have been observed even during severe May and June frosts. BSG occurs in years with extreme climatic conditions (Chap 2.3) such as those which prevailed in northern Sweden in 1960/61. From the varying characteristics of BSG, the inference can be drawn that damage had occurred repeatedly during a period of three to four months, from January to early May. The level of the damage above the ground surface is connected with the changes in the depth of the snow cover. On most occasions damage occurred in April, when the ground surface was covered by solid ice crust. The extreme diurnal fluctuations of temperature when snow
177 melts and freezes quickly should be considered as the factor which constitutes the environment in which BSG occurs. The relative roles of different factors in the production of damage could hardly have been equally significant at different levels of the snow cover above the ground surface, and also during the lengthy period comprising late winter and early spring. Many more analyses and experiments dealing with the induction of the damage must be made before a complete solution of the problem can be reached Pathogens Extensive systematic work has been carried out in connection mith the elimination of the infection by fungi on trees in experimental PR series, and much attention has been devoted to this subject. This refers chiefly to Phacidirrm infestans which has already been mentioned. Lophodermium pinastri is another fungus disease which should be mentioned, although it is by no means so dangerous to plants as Phacidium infestans. In earlier experiments (LASGLET, 1936; HEII~INHEIMO, 1949) different PRs showed most various degrees of resistance to Lophodermium pinastri disease. In nurseries it was possible to eliminate this disease completely by spraying the plants, and on EPs the fungus disease appeared only sporadically and no harm was done. Infection by Melampsora pinitorqua was also averted in nurseries by spraying the plants, and on EPs 9 and 10 all aspens (Populus tremula) growing in the neighbourhood mere exterminated, thus avoiding attacks by Melampsora pinitorqua on trees in EPs. A few individual trees on EPs 10 and 11 became victims of Fomes annosus diseases and died. Other fungus diseases registered on EPs were of a sporadic nature. M'hen summarizing the effect of fungus diseases on trees in EPs, it should be definitely stressed that they played a minor role among those factors which decided the survival or mortality of plants in the whole PR experimental series. These fungus diseases as the cause of mortality in plants were of a very slight importance and did not influence the mortality rates at all. Differences of opinion as regards fungus diseases arose in connection with damage in plants caused by cold. It is well known that parts of trees injured by cold are, as a rule, infected by fungi. These fungi are capable of lixing as saprophytes and are usually facultative parasites, but become dangerous only when their host has been injured or reduced in vigour (DAY, 1928, p. 28; 1945, p. 5). Although, in most cases, cold is the primary cause of the injury, misinterpretations often arise, and attacks by fungi are considered to be of primary importance. This particularly refers to girdled and cankered trees, where the injured part often remains unnoticed, and those fungi which colo-

178 nize dead bark may not infrequently be blamed for the trouble (DAY, 1928, p. 28). Attempts to attribute origin of BSG to pathological causes are not at all new. HARTIG (18831, examining the BSG portion in the injured plants, found there only saprophytic fungi. TUBEUF (1888, cit. 1914, p. 26) discovered a new fungus species, Pestalozsia Hartigii, and determined that it was responsible for the damage caused. In spite of repeated inoculation of living tissues with this fungus, experiments did not give conclusive evidence. Attention was also directed to other analogous phenomena and to other causes of injury (XCXCH, 1913, 1914). The inoculation of the living tissues of the plant with fungus diseases was repeated by other scientists in the years to follow, and this problem is of interest even today. The question as to what role some parasitic and facultative parasitic fungi play in causing death to pine plants and young trees in Scandinavia has become a pressing problem during the last years. Already more than 50 years ago LAGERBERG (1912) described damage in dying pines in northern Sweden and assumed that the cause of death was a fungus disease, Crumenula abietina, i.e., Scleroderris lagerbergii. Another fungus disease which was then found on injured pines mas Dasyscypha fuscosanguinea. In this connection it is not out of place to mention that the manifestation of fungus diseases was preceded by severe climatic conditions prevailing in the winter of 1910/11 (Chap. 2.1; H. E. HARIBEKG, 1912) BJORI~IAN described losses caused by Crumenula abietina, i.e., Scleroderris lagerbergii in nurseries. KOHH (1964) wrote on the extent of the damage caused by this fungus in the nurseries, and on the measures applied in the struggle against it, as well as on how frequently it is encountered in afforested areas in northern Sweden. KOHH points to the distribution of this disease and its connection with damage caused by cold in and in , and also with damage caused by snow pressure in ROLL-HANSEN (1964, p. 169) considered Scleroderris lagerbergii to be the cause of the girdling of the stem, basing his conclusions upon his findings of pycnidia or apothecia of the fungus on the dead bark, or upon the results obtained by him when isolating the fungus from the dead bark, as well as on his inoculation experiments. Evidently ROLL-HANSEX considers Scleroderris Zagerbergii fungus to be the primary cause of the damage. Howe\ er, on pages 161, 169, 170 of ROLL-HAIYSEN'S paper one can read that "it is reasonable to assume that the girdling had been caused by the fungus entering through frost necroses or small wounds". In this respect one can only agree with the views expressed above, namely, that the girdling mas primarily caused by cold and that only then had fungus attacked the cold injured areas. When the importance of facultative parasitic fungi is being discussed, it is
179 hardly possible to avoid mentioning the fundamental works of DAY (1928, 1931, 1945, 1958 and 1961) and of DAY and PEACE (1934, 1937), and the conclusions they had arrived at when investigating several conifer species. When analysing the dying back of Corsican pine, DAY (1945, 1961) also describes the role played by Brunchorsfia destruens, i.e., Crumenula abieiina or S. lagerbergii among other fungi. In the text and reference book "Forest Pathology" written by BOYCE (1937, 1961) an analysis of this problem is made, and the conclusions arrived at refer to conditions in the U.S.A. In the works of the authors mentioned above the origin of the BSG and the formation of the canker are examined at a greater length than ever before. The question as to whether Scleroderris lagerbergii acts as a virulent parasite, or only affects parts of the tree injured by cold, can be solved only in an experimental way. However, the injuries which were obtained by ROLL- HANSEN (1964) by infecting plants with this fungus, differ from cold injuries both as regards their external and internal signs (Chaps. 3 and 5.1). The fact that fungus mycelium was found in the wounds and cankered trees does not supply sufficient evidence for the assumption that fungus has been the primary cause of the damage. If it were possible to prove by inoculation experiments that this fungus can manifest,itself as an injury of varying characteristics, whose symptoms and signs are identical with those in cold injuries, and if it were possible to establish as true that this fungus can cause damage during single years, and varying mortality in plants of different PRs, as shown on EP diagrams (Chap. 4.2), then there would be no reason to doubt the virulence of Scleroderris lagerbergii. No such evidence is available at present. Cold damage and mortality in plants in northern Sweden form an urgent and pressing problem, and it is important that, when trying to find ways of solying this complex problem, attention should not be diverted from cold as the primary cause of damage, to secondary and accessory factors. Injuries caused by Scleroderris lagerbergii and by attacks of Pissodes beetles may be fatal to many trees injured by cold, but it is essential to decide which of the factors causing mortality in plants is of a primary character.
180 6. Cold damage, healing of wounds and mortalityconnected phenomena in a chain of biological processes in plants The occurrence of cold damage and the anatomical and physiological changes which take place in plants owing to the effect of cold are by no means independent phenomena isolated from the complex of metabolic processes in the organism of a plant. Both the life cycle and the annual cycle in the ontogeny make an organic sequence of physiological processes. The changes within these physiological processes are related to seasonal changes of environmental conditions, and are thus dependent upon the geographical location and local site conditions. Normally a plant or a tree is adapted to the variations of environmental conditions. The response of a tree to the manifold and varying environmental conditions is genetically controlled. Cold resistance and resistance to unfavourable minter conditions depend on the genetic constitution of a plant, i.e., of a young tree. Inherited traits and external factors interact in several ways and the relative roles of the genotype and environment as regards cold resistance in trees belonging to different PRs are of a most complicated nature. In the present chapter attempts are made to explain the extent of cold damage and mortality in plants based on the data obtained from EPs, and to show the connection between these phenomena and the factors which contributed to their origin. The cold damage of 1960/61, owing to its specific importance in the whole PR experimental series, inevitably assumes a central position among other injuries caused by cold which occurred during The specific laboratory problems connected with cold and winter hardiness in woody plants were not the object of study in PR experimental series. The expanding literature of recent years, and the conclusions arrived at when solving these problems, provided the necessary background for the interpretation of the data obtained in PR experimental series. As regards the role of the genetic factors in the varying cold resistance among different PRs, it has been possible to penetrate this question only within the frame of the PR experimental data Cold and winter hardiness According to modern biology, cold and winter hardiness are complex properties which woody plants develop in autumn and in early winter, after
181 having completed their growth period. Hardening in plants comprises several intricate physiological and biochemical processes, which follow each other in a definite succession. According to TUMANOV (1940, 1951) and Tuhr~sov and KRASAVCEV (1962) complete winter hardiness can be reached only when the plants have definitely accomplished their apical and lateral growth and have then gone through two definite hardening phases. Thus hardening takes place successively, depending on the gradual increase in the degree of severity of the temperature fluctuations in autumn. The degree of winter hardiness which the plant develops can vary from year to year, depending on the climatic conditions, but it can also vary considerably in different parts of the plant, due to prevailing nutritive conditions, water supply and metabolism. Hardening processes proceed also during winter, but longer thaw periods cause dehardening. The gradual passing of the plants from a state susceptible to cold to a coldhardy state is connected with changes in the biochemical and biophysical properties of the living cells, and also with the accumulation of reserve food, which exercises protective effect on the living cells. The affinity between cold resistance and the content of proteins, amino acids, lipids and sugars, and their related compounds, has been confirmed by the results of the in\-estigations of many scientists. Several theories have been launched which try to solve the problem of the causes of cold resistance (References: LEVITT, 1956, 1958; PARKER, 1963; GENKEL, 1965). A new interpretation of this question was put forward by LCVITT (1962) and his collaborators (Lm~rr, SULLIVAN, JOHANSSON, PETTIT, 1961; LEVITT, SULLIVAN, JOHAIVSSON, 1962; KOHN, ~YAISE, LEVITT, 1963) by advancing a "sulfhydryl-disulfide hypothesis of frost injury and resistance in plants", which attributes a decisive role to the content of sulphydryl in the proteins of protoplasm. LANGLET (1936, 1959, 1962), in his "Studies on the physiologicalvariability of Scots pine in relation to climate", supplies significant evidence on this problem, and shows that in autumn the dry matter content in the needles of pine seedlings serves as a criterion for this variability. Dry matter content values of different PRs characterize both climatic conditions of their natural growth places and also the degree of cold resistance of these PRs. Dry matter content values are correlated nith sugar contents, osmotic pressure in the cells, and with certain other properties in PRs connected with geographical variability of Scots pine. According to LANGLET (1936, p. 238) the hardening processes are of a complex nature, and all regularly expressed changes in the organic compounds, as well as in the reserve food, at the end of the growing season and at the onset of dormancy should be regarded as being more or less connected with these hardening processes. The climatic factors which induce cold hardiness are primarily low tem-
 induced almost unlimited cold resistance in woody buds (-233\" C) by hardening them at low temperatures.")
182 peratures and short photoperiods. SAKAI (1938, 1960) obtained artificially induced hardiness by gradually hardening woody plants down to -30". These plants then survived in temperatures as low as -196". TUNANO~ and KRA- SAVCEV (1959, 1962) induced almost unlimited cold resistance in woody buds (-233" C) by hardening them at low temperatures. PARKER (1960, 1962) found in freezing experiments with plants and foliage that the winter resistance of several conifers can range all the way from a few degrees below freezing point to below -189" C. Hardwood twigs withstood even -196" C. However, PARKER stresses that the rates of cooling and warming are most important in such work and should not be changed. ~IOSKOV (1930, 1932, 1935), in his experiments with woody plants in Leningrad, obtained not only earlier cessation of growth and an earlier onset of dormancy, but also greater cold resistance, by shortening by a few hours daily the photoperiod during the summer. When the daily photoperiod was prolonged, contrary results were obtained. BOGDANOV (1931) experimented in Leningrad mith various woody plants (including Scots pine seedlings originating from Boriom in the Caucasus and from Poznan in Poland) and succeeded in eliminating autumn frost injuries and winter cold damage by shortening the photoperiod, beginning with the month of July. TUMANOV (1951, p. 28) found that by shortening the photoperiod of the long summer day conditions in northern regions, it was possible to harden experimentally not only woody plants, but also herbaceous plants. Tuaf~sov stresses that shortening the day-length is effective only when it is carried out already during the summer, when the temperature of the air is sufficiently high. ROBACK (1957) experimented with several conifer species in Norway (latitude 60" 15'X) by shortening the natural photoperiod beginning with the 1st of July. The shortened fourteen-hour photoperiod caused a pronounced acceleration of terminal bud formation, which began several weeks earlier than usual. However, the effect of short-day treatment as regards winter hardiness and survival of plants in different species did not always give satisfactory results. The connection between the photoperiod and dormant condition in plants has attracted the attention of many scientists (KLEES, 1914, 1917), GARXER and ALLARD (1920, 1923), and is still the object of study in recent works (References: VEGIS, 1965 a, b). An analysis of the role of the photoperiod in the geographical variability of Scots pine in Sweden mas made by LANGLET (1943). His conclusions were chiefly based upon data obtained from 600 Swedish PRs concerning dry matter content in the needles of seedlings in the autumn. The correlation between the dry matter content values on the one hand, and the latitude and the length of growing season for the native habitats of these PRs on the other.
183 had a high statistical significance (LASGLET, 1936, p. 357). The presence and participation of some third factor in this correlation was therefore hardly conceivable. While trying to establish the relative roles of the two factors (the latitude and the length of growth period) on the physiological state of the pine seedlings, LAXGLET came to the conclusion that three-fifths of the total variation of the dry matter content values mere connected with the latitude, and two-fifths with the length of the growing season. According to LASGLET, the length of the growing season (the number of days per annum with a mean temperature 26" C) depends upon the latitude and the altitude of the native habitats of PRs, and it is thus possible to estimate the value of the length of the growing season (LANGLET, 1936, p. 344). The role of latitude is much more intricate. The duration of the daily light and dark periods is a function of latitude. However, the effect of the photoperiod on the pl~ysiological processes is connected with the temperature, and the relationship between the dry matter content and the length of daylight and temperature also point to this (LAXGLET, 1959, 1962). In the PR experimental series, in connection with the transfer of the PRs from their native habitats to the EP sites, in both meridional and vertical directions, the climatic conditions were different from those to which these PRs had been adapted. The range of the new climatic conditions affects different PRs in different ways. These changes influence not only the growth activity but also the cessation of growth, the hardening processes and the onset of dormancy, as well as the rest period. When the respective roles of temperature and photoperiod are estimated, one is inclined to think that the combined effect of these two factors is decisive in this case. After subjecting plants to different daily light periods, many research workers have proved that temperature plays a very important role. Temperature during the diurnal dark period is considered to be of the utmost importance, and often to be a decisive factor in the growth response of plants to the photoperiod (References: VEGIS, 1964, p. 205). In most experiments the role of the photoperiod is defined more exactly. Long-day conditions favour the continuation of growth, and prevent, or at least delay, the cessation of growth and the onset of dormancy. Short-day conditions cause the cessation of growth and formation of terminal buds, but not the onset of dormancy (VEGIS, 1964, pp. 199, 208). In its turn, the cessation of growth is an indispensable physiological state in plants in whose absence no hardening processes can begin. Woody plants which have not completed growth cannot develop cold resistance (TUMANOV, 1940; TUMANOV and KRASAVCEV, 1962). When discussing the origin of cold damage in Scots pine in the late winter and early spring of 1961, and the varying degree of cold and winter resistance among PRs, the question arises as to what state of dormancy the plants were
. During this physiological state the response of the plants to external influences is insignificant, and normal growth cannot be induced.")
184 in at that time. It is well known that during the "middle phase" of the rest period in the winter woody plants are in a state of "true dormancy" (YEGIS, 1964) or "deep dormancy" (SERGEJEV, 1961, cit. 1964). During this physiological state the response of the plants to external influences is insignificant, and normal growth cannot be induced. After the cessation of gromth in the autumn, transition to true dormancy occurs gradually, and is connected with hardening processes in plants, which comprise the so-called "predormancy state" (VEGIS), or "concealed growth state" (SERGEJEV). The investigations of SERGEJEV and his collaborators (1964, 1965) showed that in the central regions of the Soviet Union most forest trees have completed their deep dormancy state in Sovember and December, and a few species only as late as January. When trees enter the next state, "imposed dormancy" or "postdormancy state" (YEGIS, 1964), the response of plants to unfavourable weather conditions changes. Non-resistant plants and trees become susceptible to cold and unfavourable weather conditions. Owing to considerable fluctuations of diurnal temperature, and also to the periods of thaw and insolation of the stem and different parts of the crown, trees are affected by cold. M7inter hardy species, as well as hardy strains, are resistant to weather factors, because the hardening processes had already been completed before the onset of dormancy. It is of interest to mention that in the experiments of DAY and PEACE (1934, 1937) on the artificial production of cold injury, Scots pine pro~ed to be surprisingly susceptible to winter cold, and quick freezing combined with quick thawing was always the most damaging. WINKLER (1913) found that trees and shrubs which had rapidly frozen in minter were severely damaged, and that alternate thaw and freeze periods were most unfavourable. These injuries occur when plants are in the state of "imposed dormancy", during which they are most susceptible to external factors. The varying cold and winter hardiness of different PRs on the EP sites should be regarded as dependent chiefly on the cessation of gromth in these PRs, and also upon the hardening processes which follow when growth in plants is completed. No hardening processes can take place before the completion of gromth and, since trees have not yet become resistant to cold, they can be damaged by cold in autumn, late winter or early spring. Those PRs whose natural growth places are situated south of the EP site, or at a lower altitude, are most subject to the influence of the extreme unfavourable weather conditions which occur during certain years. During years with normal climatic conditions these PRs complete their growth and develop a higher or lower degree of cold resistance. In the years with extreme, unfavourable weather conditions, a sudden cold wave can affect the plants earlier, when the growth processes have not yet been completed, thus inter-

185 fering with, and eliminating, the hardening processes. On the other hand, in northern PRs the cessation of growth occurs much earlier, and trees become cold-hardy even in the years with extremely unfavourable weather conditions. In this connection it might he mentioned that the EP site not only tests the degree of cold resistance in different PRs, but also induces some changes in the response of plants to temperature and photoperiod, owing to the transfer of PRs from their natural habitats. It might also be mentioned that under the same EP site conditions, the rate of decrease in cold resistance in southern PRs is greater than the rate of the increase of cold resistance in northern PRs Injury, recovery and mortality Of all the data on cold damage in the experimental PR series given in the preceding chapters, the clearest picture mas supplied by that part which deals with the period The severe cold damage of 1961 started a whole series of phenomena which occurred during the following years. Cold injury occurred in late winter and early spring, and was caused by extreme weather conditions (Chaps. 2.3 and 5.1). The amount and extent of damage as well as mortality rates in plants varied among PRs (Chaps. 1.2). This variation should be connected with the different degrees of hardening in plants. The unfavourable weather conditions which prevailed in the summer and autumn of 1960 had considerably influenced resistance to cold and mortality among PRs (Chap. 6.1). Thus the occurrence of damage in 1961 links the development of EPs during the five year period into an organic sequence. It should be stressed that in 1964 the recovery of plants damaged in 1961 had not yet been completed. Cold damage covered a large region in the north of Sweden, and the occurrence of cold damage in connection with the general weather conditions of 1960/61 is conspicuous (Chap. 2.2). The variation within the local climatic conditions, in its turn, caused great differences among EPs as regards the degree of severity of cold damage and mortality rates (Figs , Chap. 4.4). In the analysis of the problem of cold damage it is of great importance to note that cold injury affected a large region, and that it was not merely of local character. This makes possible the use of the data obtained from 17 EPs located in the cold damage region (Region 11, Fig. 8). For the sake of comparison, data from three EPs (Region I), located outside the cold damage region, were used. Thus it was possible to obtain a sufficient amount of experimental data for statistical calculations. In 1961 all above-ground parts of the trees suffered from injuries caused by cold. However, most of the injuries with varying patterns had occurred to old wood (Chap. 3), and among all types of injury to old wood, the most
. Girdling of the main stem in the upper part of the tree (Chap. 3.1.1.7), which is connected with the diebacli of the top of the tree, can also have a most serious effect, and the more severe the damage, the nearer to the base of the tree does the damage extend.")
186 serious proved to be the girdling of the main stem. BSG (which damages the tree at its base) is the most dangerous type of injury, and usually results in the death of the whole tree (Chaps and 5.1). Girdling of the main stem in the upper part of the tree (Chap ), which is connected with the diebacli of the top of the tree, can also have a most serious effect, and the more severe the damage, the nearer to the base of the tree does the damage extend. In 1958, and probably also in 1959, only severe dieback of the plant top was registered, while in 1961 BSG predominated. These two types of damage have several common characteristics, but they also differ in many other respects. As regards the origin of BSG, three principal considerations should be borne in mind: the type of damage, external conditions under which damage occurs and the mechanism of the damage. BSG has been known as one of the types of cold damage for quite a long time (HARTIG, 1883; AUMANN, 1883; DAY, 1928). However, external conditions in the north of Sweden differ from those under which BSG occurred in Germany and Britain. In Britain, BSG occurred in spring when cambium cells were dividing, or when cambial activity was awakened, but the growth processes had not yet begun (DAY, 1928, 1931; DAY and PEACE, 1946). In the north of Sweden, BSG occurs in late m-inter and early spring, when plants are in the phase of "imposed dormancy", and are liable to be influenced by external factors. In Britain, BSG is connected with spring frosts. As a characteristic example may be mentioned the severe Rlay frosts of The location of the BSG on the stem coincided with the lowest minimum temperature during the frost periods and particularly with the level of the tips of the herbage, the so-called "grassminimum". The cambium may be killed at that level but not above it. Consequently, BSG is the result of the direct effect of low temperatures, and the occurrence of BSG coincides with temperature minima during a frost period or on a certain day. On the other hand, the occurrence of BSG in the north of Sweden should be attributed to combined effect of cold and other weather factors during winter. The fluctuations of temperature, together with low temperatures, are associated with alternate melting of the snow cover and its compression, as well as with the freezing of melted snow water and the formation of an ice crust. Such extreme weather conditions can, with some intervals, continue from three to four months, from January to the middle of May. The damage originates in the portion of the tree at or below the snow surface, in the snow crust, or in the ice crust layer. Often the upper edge of the BSG is clear-cut (Fig. 4) and constitutes the most severe part of the damage round the stem. However, there is great diversity in the breadth of the girdle and the dimensions of the damaged area of the BSG portion. Although on many occasions purely mechanical action of the ice can be
. Consequently, BSG does not differ basically from other types of dainage by cold, when living tissues are injured.")
187 observed on the BSG portion in the shape of ruptures and compressions, the most essential part of the damage is the killing of cambium, phloem, cortex or the destruction of live cells in the xylem elements (Chap ). Consequently, BSG does not differ basically from other types of dainage by cold, when living tissues are injured. However, the mechanism of the origin of BSG differs from that of other types of cold damage, since not only the effect of cold, but also other external factors, co-operate in causing it (Chaps. 3.2 and 5.1.2). Still, even in the case of BSG, low temperatures and temperature fluctuations play a decisive role. A striking evidence of this is furnished by partly girdled trees, with BSG near the ground surface. In most cases damage occurs on the SIT7 side, but it can also spread over a wider circumference from the E to \JT sides. Sometimes BSG merges with narrow, vertical lesions in the bark, occurring in connection with strong solar radiation in spring, when the ground is covered by ice crust. The basal part of the tree is most exposed to the effect of external factors and is more severely damaged than the other, above-ground parts of the tree. It is difficult to decide whetherthe basal part is also the most susceptible to cold. However, it has been proved by freezing experiments (KRAE~OI, OICNINA, IPEKD~IJAN, 1954) that the buttswelling is that part in oak seedlings which is most susceptible to cold. In other experiments on damage by cold, indirect evidence has been obtained which shows that the basal part of the tree is the part most susceptible to cold. BSG is not only the severest type of cold damage, but also the most intricate. It often happens that external signs are so slight that BSG remains unnoticed, not only during the first summer after the occurrence of the dainage, but also during the following summer. The damaged portion of the tree then becomes colonized by Pissodes weevils and by fungi. The foliage of the dying tree is a suitable ground for fungus diseases, and when interpreting the primary cause of the damage in trees suffering from BSG it is possible to arrive at hasty conclusions and misconceptions. If the tree does not suffer from injuries other than BSG, its crown and lateral shoots develop a certain amount of growth in the same summer. Completely girdled trees died outright in the spring or autumn of the year following the damage, namely, In 1962, when the dying trees suffering from BSG were analysed, conspicuous black spots could be observed in different parts of their root system, which spots were found neither in healthy trees, nor in the damaged trees during the first summer after the occurrence of damage. This damage in the root system was considered to be the result of deficiency in nutritive substances owing to the strangulation of the stem, rather than the direct consequence of cold effect. This phenomenon was tested experimentally in March 1963 in the neighbourhood of Stockholm by mechanical ringbarking and by filing off the outer annual rings in the basal part of the tree. The exposed portion was

188 carefully protected against dehydration. The test was carried out on trees of the same age as those in PR experimental series and comprised 36 plants, which were subjected to mechanical injury of nine different degrees. In the summer of 1963 the development of terminal and lateral shoots and their length were analogous to that which was observed in the summer of 1961 in trees suffering from BSG on EPs in PR experimental series. In the summer of 1964 the development of black spots in the root system of the trees mechanically injured was also analogous to that observed in the summer of 1962 in trees suffering from BSG. On the basis of the data obtained it can be concluded that the transport of water and minerals from the root system upwards to the crown is more or less obstructed in trees suffering from BSG. However, even more important is the circumstance that the translocation of photosynthetic products in the phloem from the crown of the tree downwards does not reach the root system, which results in the dying off of the root system owing to the lack of nutrition. Recovering of partly girdled and cankered trees thus becomes an intricate problem. "The canker is particularly liable to damage, and if fairly severe frosts occur for several years running, it may spread rather than heal and eventually girdle the branch or the stem on which it is situated" (DAY and PEACE, 1946, p. 30). Figs and particularly Fig. 67, clearly illustrate what has been said above. However, the survival of the BSG trees is not decided only by the BSG portion of the tree. It should be taken into consideration that the girdling of the tree considerably influences its metabolism. Nost probably the supply of water and mineral elements in partly girdled trees is only partially delayed and influences the metabolical processes only slightly, since the movement of water in a tree can proceed in different directions (KOZLOWSKI, 1961, 1963) and simply pass the damaged patches in the xylern. On the other hand, impediments in growth processes decrease the resistance of the tree to cold and pathogens. Partly girdled trees thus become more susceptible to cold, and their recovery is dependent on weather conditions during several years after the occurrence of the damage. In the PR experimental series, in connection with winter cold of 1962 and the May and June frosts of 1963, the recovery of trees damaged in 1961 had proceeded only in a few EPs, namely, on those where weather and edaphic conditions were favourable and contributed to the rapid healing of wounds. The great majority of partly girdled trees died from 1961 to 1964, and the rate of mortality among PRs was very variable (Chaps. 4.2 and 4.3). Only those trees on which the damaged area on the BSG portion was small had any chance of survival. Snow cover does not directly influence the occurrence of girdling of the main stem in the upper part of the tree, as is the case with BSG. This type of damage most often occurs in early spring when the ground is bare, immediate-
189 ly after the snow has melted, or during May and June frosts, as happened in Damage of this type can also occur in minter and early spring when the ground is covered by snow, as in Early autumn frosts, contrary to expectations, caused only slight damage on EPs. The only losses worth mentioning occurred during the August frosts of 1954 in PRs whose native habitats are situated south of EP sites. Girdling of the main stem occurs because of diurnal fluctuations of temperature in the ground air zone. These radiation frosts are particularly dangerous during the periods of cold waves when serious damage occurs on frost localities, as illustrated by mortality curves on EP 27 in 1963 and on EPs 26 and 29 in 1958 ancl IYhen damage is slight, compensatory adventitious shoots are developed to replace the killed leaders. But mhen damage is serious the recovery of damaged trees proceeds slo\vly, growth development is considerably delayed, the stem is deformed (WIBECK, 1928; LANGLET, 1937) and the shape of the tree is permanently changed Environment and genetic background Great diversity as regards cold damage and mortality in plants is exhibited among PRs in the PR experimental series in the EPs. The variation of mortality rates and the diverse adaptation of PRs have already been discussed from different aspects in this paper. Mortality among PRs onindividualeps was dealt with in Chap When summarizing the data obtained from individual EPs, the occurrence of cold damage and the manifestation of mortality covering a period from 1954 to 1964 were discussed in Chap The geographical aspect of cold damage was presented in Chap. 4.4, where all 20 EPs were divided into four groups, ancl mortality rates in relation to the transfer of PRs from their native habitats to the EP sites were shown in diagrams (Figs ). The problem of mortality and survival of plants is thus composed of two fundamental parts. The diversity of inherent physiological characteristics among PRs makes one part of this problem and forms its genetic background. The various climatic conditions in different parts of the north of Sweden, the changeable neather conditions during , and extreme weather conditions in single years make the second part of the mortality problem. It should be stressed that diverse mortality among PRs is an essential characteristic of their adaptability to different EP sites. Adaptive physiological properties of PRs are tested here by such decisive components of external environment as varying temperature and extreme fluctuations of temperature connected with other weather elements during winter and early spring. The testing of the PRs is carried out here in a wide range of environmental conditions.

190 Conspicuous differences between PRs in regard to their hereditary characteristics and geographical variability in Scots pine are revealed and proved by experimental evidence in the works of a great many scientists and in silvicultural practice, beginning with the nineteenth century. LANGLET, in a review '<Two Hundred Years of Genecology" (1964, in Swedish), as well as in a yet unpublished, extended review on the same subject, presents a detailed representation of the pioneer and basic views and progress made as regards investigations into the hereditary variation in plants in relation to their environment. \Then interpreting the data obtained frorn the experimental PR series, it is necessary to point to contemporary, basic premises in regard to the differentiation of adaptive physiological properties among PRs and to the geographical variability in Scots pine. The most general characters of organisms are adaptations. Many of the physiological and biochemical processes carried out by animals, plants and micro-organisms are clearly adaptive, and adaptation is thlls a general feature of the relationships between organisms and their environment (GRANT, 1963, pp. 116 f.). Adaptation to different ecological conditions is of particular importance in plants. The life activity of plants during their development depends on varying ecological factors. The adaptation of plants to heterogeneous ecological conditions is connected with the evolutionary origin of adaptive characters, and is the result of natural selection, acting upon hereditary variation. which exists both within an individual population occupying a small area, and in large regions occupied by different populations. In the present investigation two different aspects of the adaptation of Scots pine are met nith. Adaptation of different PRs to the climatic conditions of their natural liabitats nithin a wide distribution range and differentiation of inherent properties among PRs is one aspect, and adaptation and experimental control of adaptive properties in the progeny of these PRs in particular climatic conditions on EP sites during , is the other. Of all the facts on hereditary variation in Scots pine proved by experimental evidence, two fundamental conclusions should be considered as being of utmost importance: (1) individual PRs, represented by adaptively important characters, are physiological correlates of the decisive external factors affecting these PRs in their native habitats, and (2) the geographical variation of the inherent characters of PRs is revealed in a pattern of continuous variability. These conclusions were arrived at in Sweden mainly owing to investigations carried out by \ l T ( ); ~ ~ ~ SCHOT~C ~ (1923); ~ EYEROTH ( , 1928) and LANGLET (1929, 1934, 1936). The continuous variability in Scots pine (corresponding to clinal pattern of variation, HUXLEY, 1939) versus discontinuous variability 1s as worked out by LA~GLET. In his later
191 works LANGLET has further elaborated and elucidated the concept of the continuous nature of ecological variability (LANGLET, 1959, 1962, 1963). It is well known that climate plays a decisive role in the adaptation and survival of the plants, although the edaphic conditions, in their turn, may exert a local influence. For characterization of the climatic conditions on the EP sites, as well as on the PR natural habitats, the length of the growing season (Y), expressed by the number of days with average temperature + 6 C, has been used. These figures are computed values (LAFGLET, 1936, p. 344). and their consistent application in all cases in the whole PR experimental series unites all the data obtained in the experiment into a uniform system. In Tables 2-21 the values expressing the length of the growing season characterize each of those PRs which constitute a single EP. Experimental data on diverse CR4 of 1964 among PRs, and the corresponding values which characterize the climatic conditions of the natural habitats for these PRs, show the interrelation of these two series of values in the tables. The shortening (-Y) or the lengthening (+Y) of the growing season in connection with the transfer of the PRs from their native habitats to the EP site makes the mutual relationship between the two series of values still more conspicuous. Besides, the diverse adaptabiiity of the PRs on the EP sites is compared with that of the local PR, expressing the CM of 1964 in relative values (R of local PR = 100). The graphical representation of the data on CM and SYhl obtained from single EPs (Figs ) covers the period from (1953) 1954 to 1964,when plants reached the age of 14 years. The first 14 years of the ontogeny under varying weather conditions are decisive for the adaptation of PRs on a particular site of a single EP. A single EP is thus a basic experimental unit. Each of these EPs consistently and conspicuously shows that PRs transferred from the north reveal a higher degree of resistance to unfavourable climatic conditions and a better adaptation for survival. On the other hand, PRs transferred from the south often show a bad adaptation, and their silvicultural value is low. When summarizing the data on CM obtained from single EPs, the shortening (-Y) and lengthening (+Y) of the growing season in connection with the transfer of PRs to the EP sites has been used as the common denominator. These +Y and -Y values constitute the independent variable in the diagrams (Figs ) and CM rates make the dependent variable. The arrangement of EPs into four groups is based chiefly upon the ascension of CM curves of different PRs in single EP diagrams (Figs ). Each of the four EP groups (Fig. 8 and Chap. 4.4) represents a particular spatial variation (MATERN, 1960, Chap. 4). The relation of CAI rates of 1964 to the transfer of PRs is revealed by linear regression, and expressed both graphically and
192 by regression equations (Figs ancl Table 22). The gradients of the CM rates of the four EP groups differ from each other, w11ich is clearly expressed by the slope of the regression lines and by the coefficients in regressions. Within each of the four EP groups the relation of CRI rates to the transfer of PRs is expressed by regressions nhich are statistically lligl~ly significant (Table 23). The linear regression expressing the relation of CAI rates to the transfer of PRs requires a further analysis. In Chaps. 4.2 and 4.3 it was pointed out that when the C3I curves of some southern PRs transferred to the north approached their asymptote (100 Oj, CRI rate), the C3I rates assumed constant values and CRI curves ran parallel to the horizontal axis. Theoretically, in extreme cases, one might have expected higher C3I rates also in long-distance PRs transferred from the north to the south, hut in the experimental PR series such cases were not observed. EP group 11: 2, containing 11 single EPs, was used for curve fitting (Tables 24 and 25). However, the analysis of variance in regressions sliows that in this sampling of the data the linear regression better expresses the relation between both variables than any curved regression. The arrangement of statistical data into four groups, each of which represents a particular spatial variation is inevitably connected with the concept of "boundaries" of these sampling units. The idea of "boundaries" may, however, lead to the misconception that there exist regions having distinct outlines. Such a conception, in its turn, contradicts the facts, since spatial variation in climatic conditions takes place gradually, and the adaptive differences among PRs are expressed in the pattern of continuous variability. Regions I and I1 (Fig. 8) represent the largest units in the grouping. The boundary between these regions mas dram n according to the shape of the CRI curves of the PRs in the EP diagrams. The occurrence of the severe cold damage of in northern Sweden is inarlied hy this boundary, although cold damage also occurred sporadically farther south. This boundary coincides to some extent with that used in forestry practice, which distinguishes northern and southern Sneden as regards the functions ancl tables for computing the cubic volume of standing trees ( N~SL~D, , 1947, Fig. 3). The boundary between region I and region I1 also corresponds approximately with the southern border of the "taxonomic unit" of Pinrrs siluestris lapponica (XEGER, 1913; and SYLY~N, 1916). LAXGLLT (1959, Figs. 1-3; 1962, Figs ), when exanlining the morphology of Scots pine in northern and central Sweden, came to the conclusion that no sharp contrasts exist betmeen Scots pine in these two parts of the country, and that the characteristics analysed are expressed in gradual changes. Of the nine characteristics
193 subjected to analysis, five were found to be modifiable, expressing variation caused by environment, but four of them were considered to be mainly hereditary. According to LANGLET (1959, p. 433) more rapid changes in these characteristics take place in the transition zone, which might be represented by a boundary drawn approximately from Sundsvall in the province of Vasternorrland in a SW direction towards the northern part of the province of Varmland. When comparing the above boundary, described by LANGLET, with that dividing regions I and 11 in the present paper, one can state that almost no differences exist between them, although the conclusions arrived at are based upon different data. The data from only three of the twelve EPs located in region I have been used in the present paper. Mortality in plants in the remaining EPs corresponds to the pattern expressed in the diagrams by the data obtained from EPs 9, 10, 14. A slow decrease in mortality towards the south is noticeable in connection with changes in the climate, which is shown in Figs. 7 and 8. However, the exceptionally dry summer of 1955, various edaphic conditions, as well as ground vegetation, were often the principal cause of mortality in plants. In region 11, on the other hand, the effect of cold was the decisive factor as regards the adaptation of PRs to particular sites of EPs. The 17 EPs located in this region have been divided into three groups, each group having a particular spatial variation. For technical reasons these territorial units have been named "subregions", with the reservation that the boundaries between the subregions are even more vague than between the two regions. The gradient of the CM rates in subregion 11: 1 (Fig. 60) differs conspicuously from that in region I (Fig. 59) and subregion 11: 2 (Fig. 61 A and B). Subregion 11: 1 is a transition zone from region I to subregion 11: 2. The gradient of CAI rates in subregion 11: 3 (Fig. 62) differs considerably from that of subregion 11: 2. Subregion 11: 3 occupies the western and northern parts of the province of Jamtland, where, owing to the influence of the Atlantic Ocean, the climate is milder than in subregion 11: 2, which lies to the east. The boundary between the subregions has been drawn only approximately, according to the data obtained from EPs. Reference should be made once again to the maps of environmentally caused variation of five modifiable characteristics (LASGLET, 1959, Fig. 2). The boundary of subregions mainly coincides with the transition zones where rapid changes in the five modifiable characteristics are shown in LASGLET'S maps. Subregion 11: 2 is that part of northern Sweden to which is directed principal attention regarding the PR experimental series. It is the largest spatial unit discussed in this paper, and is represented by eleven EPs. In this
194 subregion, in the large, logged-off areas, difficulties in afforestation arise most frequently a; a result of cold damage which causes mortality in plants. CRI rates of 1964 of local PRs in the eleven EPs have a wide range of variation, and a local PR is rather often very badly adapted to the particular site of the EP (Chap. 4.4, Fig. 61 A and B). The relation of PRs to the EP site conditions is expressed by parallel regressions which have a definite arrangement in the diagram (Fig. 61 A). The position of the regression line of a single EP in this arrangement depends on the micro-climate and other specific site conditions. For instance, EP 16, whose site conditions are extremely unfavourable, occupies the highest position in the arrangement of parallel regressions, but EP 21, with a more favourable site condition, occupies the lowest. The influence of extreme climatic conditions causing cold damage is felt more acutely on large, logged-off areas and on sites with peculiar topography (Chap. 2.3), and near the timberline the impact of this influence increases. The two cardinal patterns of the cold damage, the BSG and the dieback of the top of the plants, are injuries characteristic of deforested areas, and of areas with peculiar site conditions. The two types of cold damage mentioned above rarely or never occur in naturally regenerated plants which are protected by the canopy of forest stands. The fitness of the adaptive characteristics of the local PR in the endogenous environmental conditions, under the protection of forest stands, is quite satisfactory, but local PRs adapt themselves badly to the exogenous environmental conditions prevailing on bare, deforested areas. The CM rates of PRs transferred from the north are, as a rule, lower than those of local PRs. Northern PRs are also better adapted to the EP sites. PRs transferred from their natural habitats located on higher elevations than those of the EP sites exhibit the same tendency as northern PRs, with the exception of some PRs whose native habitats are situated at the timberline (Chap. 4.3). The gradient of Chi rates in relation to the transfer of PRs for single EPs is expressed by coefficients in regressions (Table 22) and by graphs (Fig. 61 B). The choice of a PR with maximum fitness is best determined by reference to the character of the site. Thus the long-distance transfer PR 6 showed the best adaptation on the most unfavourable site of EP 16 (Table 11). However, there are cases when the local PR shows the best fitness, for instance, EP 12 (Table 9). The data obtained from the EP series show convincingly that by transferring PRs from the north it is possible in the great majority of cases to avoid mortality in plants in afforestation areas, which is one of the most serious problems in silvicultural practice in the north of Sweden. Certain exceptions, however, have to be taken into consideration. Frost pockets and frost hollows, as well as flat heath areas near the timberline, are sites where

195 afforestation results are not solely dependent on the choice of cold-hardy PRs (EP 27; Table 18, Fig. 61 R). It seems that reproduction on such exceptional, unfavourable sites can be ensured chiefly by the protection afforded 11y a forest stand. The fitness of PRs to particular sites is primarily characterized 1)y the mortality and survival of plants. The survival is the first step in adaptation. In the climatic conditions prevailing in the north of Sweden, survival becomes the principal problem. The next phase in the adaptation of PRs, which is no less important than survival, is growth and development. The tree growth is partly dependent upon the impact of climatic conditions causing cold damage and, to some extent, it is also connected with the cold damage itself. However, many other factors influence the tree growth, and it is not suggested that the data for the mean height of trees which were obtained from eight EPs give an exhaustive solution to the problem of differences in tree growth among PRs. Injuries in trees caused by cold alnays interfere nith growth processes. Unlike external dan~age patterns (Chap. 31, the concealed patterns inhibiting the tree growth in most cases remain unnoticed. The recovery of the trees damaged by cold, as well as their physiology and growth, is of a most intricate nature (TUMAYOV, 1940). In this connection it is worth mentioning that the discolouration of needles ~bser\~ecl in the summer of 1961 in PRs transferred from the south was most conspicuous. This phenomenon should be connected with the distortion of the protoplast in needles, which occurred during the winter and spring of Subtle differences in the colour of the needles, in comparison with the normal green colour, were often observed. This mas connected neither with the cold injuries mentioned in Chap. 3, nor nith the seasonal changes in the pigmentation of needles in northern PRs. In connection with the intensive solar radiation and the fluctuations of temperature in the late winter of 1962, these subtle nuances mere intensified. The cold injuries mentioned above, as well as others, inhibited in various degrees the growth processes and influenced the variation in tree growth among PRs. Irrespective of cold damage, the variation in tree gron th among PRs in unimpaired trees comprises several problems of which only a fen can be touched upon here. The response of the genotype of the PRs to the various site conditions of EPs, which is connected with the transfer of PRs, is revealed in different phenotypical expressions. The ontogenic adaptation is expressed by a wide range of variation in regard to tree gron th. Some characteristic examples of this are to be found in Tables 2, 3, 5, 9, 11, 12, 13 and 15. The lengthening (+I;) or shortening (-\-) of the growing season in connection with the transfer of PRs is a criterion by nhich the variation of the tree growth among PRs should be judged. One can assume that dry ~natter con-
196 tent in needles (LANGLC~, 1936, 1959) can form the basis of this judgment just as nell, or even better. PRs transferred from natural habitats nhere the length of the groning season is greater than that on the EP sites (-Y) generally attain a greater tree height than local PRs. PRs 26 and 23 on EP 21 (Table 13) are characteristic examples of this. Long-distance transfer PRq 74 and 30 on EP 15 (Table 19), as well as PRs 50 and 26 on EP 19 (Table 20), might supply e\en more outstanding examples, if the necessary data on tree height mere at hand. 011 EP 11 (Table 3) the long-distance transfer PR 53, in this respect, sho\~s a tendency to be the best among the other PRs. On the other hand, in PR -12 on EPs 16 ancl 20 (Tables 11 and 12), there is a better tree height, but at the same time an increased CAI rate. On many other EPs (subregion 11: 2) PRs transferred from S to N, or from lower Lo higher altitudes, as nell as local PRs, show a low tree height and hlgh CM rates. The correlation betxeen tree gro\\th and cold darnage in thew cases 1s evident. One might assume that micro-climatic conditions on EPs influence the \ ariation of the tree gron th among PRs. The sites of EPs 11, 15, 19 and 21 are small clear-felled areas, whereaq the sites of several other EPs are located on large logged-off areas. On EPs 20 (Table 12) ancl 23 (Table 15) PR 19 has the greatest tree height and a comparatively insignificant ClI rate. PR 19 nas transferred to EP 20 from N to '3, and to EP 25 from S to X. In most cases, hone\er, those PKs which were transferred from N to S show a better adaptation to EP sites in regard to tree gron th, nhereas the length of the growing season in these PRs, as a rule, l~ecoines somenhat shorter (-Y). On the other hand, in PRs transferred from X to S, in cases where groning season on EP sites is longer (,Y), their tree growth is lower than that of the corresponding local PR, for instance, PR 32 on EP 12 (Table 9). It is hardly possible to soh e the problem of the variation of the tree growth among PRs, in connection with the transfer of the latter, by basing conclusions on available data for the mean height of the trees. Seither has this been the intention of the author. The prmcipal attention in the present work has been directed to the analysis of cold damage and mortality in plants. These phenomena have been approached from different angles and dealt \\it11 as thoroughly as circumstances have permitted, presenting new evidence and suggesting new views of the problem.
197 Summary Cold damage, mortality and survival of plants in Scots pine in expeximental provenance series laid out during have been dealt with in this paper. The experimental series comprises thirty plantations distributed over different parts of Sweden and covers an area of 36 ha. The data of only 20 expeiimental plantations located north of latitude 60" N, representing Norrland, i.e., the northern part of Sweden, have been used. During the period severe cold damage manifested itself in this part of Sweden not only on experimental plantations, but also on afforestation areas of high quality with trees up to twenty years old. In some districts afforested areas were strongly reduced and sometimes laid bare. The factors causing this high mortality rate among trees were difficult to determine. U'ith the view of arriving at the cause of death among Scots pine, the principal attention has therefore been devoted to the analysis of cold damage referred to in this paper as basal stem girdle of and its connection with extreme climate. Howevei, other and more common types of damage by cold and injuries caused by climatic factors have also been taken into account. Planting stock of the experimental provenance series was raised in two nurseries (in the province of Stockholm, v: 59" 25', H,: 20 and in the province of Vasternorrland, p: 63" 30', H,: 200) from the seeds of 100 provenances originating from natural habitats (Fig. 7). From this provenance material 90 populations are represented by the progeny of individual trees. The total number of individuai trees tested in the experiment is 2,200. Seed was sown in 1951 and in the whole experimental series trees were of the same age. The areas of experimental plantations were prepared and carefully scarified. Planting was carried out in open pits by using seedlings (2 + 0) and transplants (2 + 1 arid 2 + 2). Provenance experiments were conducted in four randomised blocks with restrictions similar to YUODEX square design. The number of provenances tested in each experimental plantation was 7 and respectively. The seven provenances were made up as follows: one local and two standard provenances together with two plus two provenances whose natural habitats lie to the north or to the south of the experimental site respectively. One of the provenances in each of the latter cases originates from a higher and the other from a lower altitude than the altitude of the experimental site.
198 The transfer of the provenances was, as a rule, restricted to 150 km in meridional direction and to 100 m in vertical scale. On experimental plantations with provenances the first seven were made up as above mentioned and the remaining seven proyenances were taken from habitats more remote in ielation to the experimental site than those of the first seven. Uniform tending of plants on experimental plantations was carried out. Fencing of the plantations with the view of protecting them against the attacks of reindeer, elk and roe appeared to be necessary on many experimental sites. Extensive work was carried out in connection with the elimination of the infection by fungus Phacidium infestans (during ) and also in connection with averting attacks by Hylobies beetles (during ), by rodents and other biotic factois. These measures proved to be satisfactory in providing necessary protection against different damaging agents and chance occurience of injuries. Thus the climatic factors remained the primary and almost the sole cause of damage and mortality in plants, and the analysis of the import of these factors on provenance experimental series refers to the period Reservation should, however, be made here as regards the secondary phenomena, e.g., the activity of facultative parasitic fungi and the attacks of insects which, as a rule, affect plants and trees damaged by cold. Check-up and assessment of experimental plantations were carried out every year. Mortality and changes in plants were examined as minutely and carefully as the scope of the experiment permitted. Thus each plant functioned as a permanent experiment object. The treatment and reducing into a system of all the data obtained from all experimental plantations during was carried out according to three guiding principles: (1) Only original plants were included in the estimation of the data obtained; (2) Mortality rates were expressed graphically in diagrams; (3) Experimental plantations were divided into groups (regions and subregions) introducing thus a geographical interpretation into the analysis of factors causing mortality in trees. The circumstance that only original plants were used in the estimation greatly reduced the uncontrolled variation of plant mortality. Data on the mortality in plants for each provenance on an individual experimental plantation were transformed into relative mortality values of two types-cumulative mortality rates (CAI) and mortality rates in single years (SYM). These two types of mortality rates constitute provenance time-age-mortality curves in diagrams A and B (Figs ) for each experimental plantation. These curves show the adaptation of different provenances to the individual site conditions of experimental plantations
199 during , and each experimental plantation makes an independent unit in the experimental series. The provenance mortality curves show a distinctly balanced arrangement, i.e., a definite provenance scale i11 the experimental plantation diagrams. In provenances oiiginating from northern habitats mortality rates are low, but In provenances vhose gronth places are located to the south of the experimental site mortality rates in most cases reach 1-ery high values. (Each experiinental plantation is supplemented with a table containing necessary explanations.) According to their shape the cumulative mortality curves may be divided into three sections, covering a certain period of years: (1) from the year of the layout up to 1956; (2) from 1956 up to 1960; (3) from 1960 up to The curves expressing moltality rates in single years show increased mortality values during certain years. As a rule, the shape of these curves has four distinct peaks (e.g. Fig B). Each of them corresponds either to a certain year, or, in some cases, to two or three years in succession. In the latter case plant mortality during the second or the third year expiessed by the same peak mas the delayed effect of that cold which caused the death of plants in the first year. The first two peaks of the curves refer to 1953 and 1956 and correspond to tlle first section of the cumulative mortality curves; tlle third refers to 1958 and corresponds to the second section; while the fourth peak co\ crs tlle penod from 1961 to 1963 and corresponds to the thircl section of the curnulati\ e mortality curves. In the first section the cumulative inortality curves of the provenances whose transplants were grom-n in the nursery in the province of Stockholm differ fro~n those of the provenances gronn in the nursery of Vasternorrland (e.g. provenance 42 and 7-2 in Fig. 41 A). The response of the forme1 provenances to climatic extremes is shown in the curt es by the reduced mortality rates, for which stronger and bigger transplants were responsible. However, the deviation exists only in the first section of the curves. In the two last sections, after the cold of 1958 and 1961, the initial advantages of the provenances disappear. Rates in the cumulative mortality curles for some long-distance provenances transferred from the south assume constant values in the third section, when the curves approach their assymptote (100 0/, rates) and run parallel to the horizontal axis. The survival of a few individuals with a high resistance to cold should be looked upon as a result of natural selection (e.g. provenances 59 and 74 in Fig. 43 A). In this section provenances with moderate-distance transfer reveal an analogous tendency in the direction of the curves, but their rate of survival is higher than in long-distance provenances..4daptation of different provenances to the experimental site conditions
200 as sho\vn by pro\ enance mortality curves in diagrams is largely determined by the general climate and also by local climatic conditions prevailing on these sites. The climatic factors can often be clissiniilar on different experimental plantations during the same year. The death of the tree is often the result of the combined effect of several factors. Of \ arious climatic factors \v11ich caused increased mortality in certain years the following should be mentioned: May frost and summer drought of 1953; early surnmer drought and August frost of 1954; severe ninter and early spring cold of 1955; exceptionally severe summer drought of 1955; winter and early spring cold of 1936, 1958 and 1959; severe ninter ancl early spring cold of 1961; May and June frosts of 1963 ancl slight July frosts of The most seriou? and decisive of these \\.ere late winter ancl earlj spring damage together nith Xay and June frost injuries. Only slight damage was caused by autunnl frost in August The most extensive part of the analysis on damage patterns in plants covers the period , when severe wiilter and early spring injuries of 1961, and later the process of the reco\ ery of affected trees, were examined. This analysis refers to the third section of cumulative mortality curves and to the fourth peak in the single year mortality curves. The most conspicuous types of cold damage are the basal stem girdle and the dieback of the top, nhich affect the two cardinal above-ground parts of the tree most susceptible to cold. In the majority of cases basal stein girdle was situated on the stem in the 30 cin zone above the ground surface. On some occasions it had occulred below and sometimes exactly at the ground surface, and only in a few cases higher than 50 cin above the ground. The injury in the basal stein girdle portion normally centres in the cambial region. The girdling is complete when killed cambium encircles the stem. In most cases the stem is only partly girdled and, oning to the callus overgrowth at the edge of the iiljured area, frost canker begins to develop. Nost of the cankered trees perished during , but the recovery of the trees with a slighter degree of basal stem girdle proceeded. Various kinds of basal stem girdle are shonn in Figs. 1-4, and Basal sten1 girdle occurs only when extreme weather conditions prevail. The cause of this type of damage is the effect of low temperatures on living cells. When basal stem girdle occurs, the environmental conditions are characterized by alternate periods of cold and thaw and by fluctuations of diurnal temperatures during late winter ancl early spring. The level of the damage above the ground surface is connected nith the changes in the snow cover. Frequently damage occurred in April when the ground surface was covered by solid ice crust. Sometimes basal stem girdle merges mith narrow,
201 ~erticalesions in the bark (winter sunscald) occurring in connection with strong insolation in spring when the ground is covered by ice crust. After the winter of basal stem girdle was registered on experimental plantations, but in 1960/61 this type of damage to ten-year-old trees appeared again on a large scale with a devastating force. The distribution of the basal stem girdle of covers region I1 (Fig. 8) and is connected with general weather conditions during the winter and early spring of On the other hand, there is not sufficient evidence that changing weather conditions during the summer and autumn of 1960 in different parts of the region had influenced the hardening of plants and the occurrence of damage in various ways. However, climatic conditions during late winter of 1962, and hlay and June frosts of 1963, were responsible for the way in which the recovery of trees cankered in 1961 proceeded in different parts of the region. Dieback of the top of the plant is a common type of cold damage which occurs in different seasons of the year (Figs. 5, 6 and 34). Frequently the damage is limited to the top of the tree, but during severe cold waves the plants themselves are killed. Diverse cumulative mortality rates of 1964 express the hereditary adaptation of provenances to expeiimental sites during the first 14 years of ontogeny under varying weather conditions. V7hen summarizing the data on cumulative mortality obtained from single experimental plantations, the shortening (-Y) and the lengthening (f Y) of the growing season in connection with the transfer of provenances to the experimental sites has been used as the common denominator. In this work experimental plantations are divided into four groups, each of which represents a particular spatial variation (region I and subregions 11: 1, 11: 2 and 11: 3, Fig. 8). The relation of cumulative mortality rates to the transfer of provenances is revealed by linear regressions, which are statistically highly significant within each of the four experimental plantation groups (Table 23). Subregion 11: 2 is that part of northern Sweden to which piincipal attention is diiected. Difficulties in afforestation in the large, logged-off areas arise here most frequently as a result of cold damage, which causes mortality in plants. Survival of plants thus becomes the fundamental problem in this subregion. By transferring provenances from the north it is possible, in the great majority of cases, to avoid mortality in plants in afforestation areas.
202 Acknowledgments I owe a great debt of gratitude to Professor Ake Gustafsson, Head of the Department of Forest Genetics, The Royal College of Forestry, for the possibility afforded to me to work at the present investigation, which was carried out within the frame of my official duties, and for all the generous support and valuable suggestions received. X grant from NORRLANDSFOSDEN has financed work in connection with the assessment of the experimental data. I wish to express my great indebtedness to Profess01 Erik Hagberg, Director of The Royal College of Forestry, Stockholm, for his consent to the use of this grant in connection with putting into effect the present work, and for his personal encouragement and inspiration. The late Professor Lars Tiren, nho was Head of the Department of Reforestation, gave, in 1948, the impulse to and suggested leading principles for the start of the experimental series. For this I am very grateful. I wish to express my deep gratitude to Professor Olof Langlet, Department of Forest Genetics, for teamwork as regards design and layout of provenance experiments and for his useful ad\lice. I also wish to thank Professor Bertil Rlatkrn, Head of the Department of Forest Biometry, for his invaluable help and advice regarding analysis of 1 ariance carried out at his Department. Professor Erik Stefansson, Forestry Chief at the Swedish Cellulose Co., Ltd., formerly Head of the Department of Reforestation, The Royal College of Forestry, gave me useful assistance during , when planting stock was raised in the nursery of the Sundmo Research Station, Swedish Forest Tree Breeding Association. Heartfelt thanks are directed to Professor Edvard Wibeck for his encouragement in connection with my preliminary publication on the subject in I also wish to express my gratitude to Docent Rlilan Simak, Department of Forest Genetics, and to Mr. Georg Grahn, agronomist, who, in , laid out some of the experimental plantations. Sincere thanks are due to Rlr. Helge Moden, MA., Officer of the Swedish ~Ieteorological and Hydrological Institute, and to Mr. Fricis Valuks, assistant meteorologist, who helped me to obtain data on weather conditions. hly sincere thanks are also due to: Mr. Eduards Silnieks, Forest officer,
203 and Mr. Xllan Transtrorner for their assistance in carrying out calculatmiis and arranging the experimental data; Miss Greta Nilsson, Department of Forest Biometry, for carrying out the analysis of variance; Mrs. Sil~ia Jogi, Department of Forest Genetics, for the careful development of the photographs; Mrs. Anneliese Seuschel and Miss Gerda Carlsson for the draftlng of the giaphs. RIy collaborators and co-workers have heen unsparing in their help 111th the routine work of the investigation and I take the opportunity of expressing my grateful appreciation of their assistance and patience. 3Iy wife, Alelisandra Eiche, lecturer at the Institute of Sla~lc languages, Stocliliolm University, has translalec1 this publication into English. Last, but not least, I ~ 1~11 to express my deep gratitude to Mr. James A. JWlian~s for his valuable aid in connection with the reading of the ilzanuscript and the proofs.
204 REFERENCES X.ALTOSES, V. T., 1948: Boden uncl ST'alcl. - Berlin, Hamburg-. ABBE, L. B. and CRAFTS, A. S., 1939: Phloem of white pine and other coniferous species. -- Bot. Gaz., 100: XGER, B. H., 1964: Studier over klimatet i Norrland, Dalarna och Varmland. (Studies of the climate in north and central Sweden.) - Stud. For. Suec., 19: Ac~.r.rzlc.;, H., 1958: Waldbaulich-oliologische Fragen an der JT'aldgrenze. - Cbl. Ges. Forstw., 75: : Lufttemperatur und Luftfeuchtiglteit. -.\Iitl. Forstl. 1-ershnst. Mariabrunn, 59: ANDERSSOS, G., 1905: Om talltorlian i ofre Sverige varen i\iedcl. Statens Sltogsforshnst. 2: AXDERSSOS, G., 19-14: Gas change and frost hardening studics in winter cereals. - Lnnd. AUXAXS, 1883: Frost-Beschadig-UII~. - ForsLl. Beil. Z. Ver. nassauischer Land-Forstwirthe, 29: 75-5G. B.~KER, \T. C., 1954: h contribution to the concept ol ~vound repair in woody stems. - Can. J. Bot., 32: BATES, C. G., 1930: The frost hardiness of geographic strains of Sorway pinc. - J. For., 28: BELYEA: H. C. and JI;~CALOSEY, H..J., 1926: \Ycather injury Lo terminal buds of Scotch pine and other conifers. - J. For., 21: BJORKII.\S, E., 19-L8: Studier over snoskytlesvampens (Phacidirlm infestans Karst.) hiologi saint metoder for sn8sliyttes be1;ampande. (Studies on the biology of the Phacidim-blight (Phacidium infestal~s Karst.) and its prevention.) - 3Iedd. Statens Skogsforsk~llnsl., 35: : Sorrlanclsl; talllirafta (Dasyscypha f~zscoscmguinea) i sadder och planteringar i lidjtlliigen. - Skogen, 41: : Sy svampsjukdorn i sltogstradsplantsliolor. - Sltogen, 46: : Resistance to snow blight (Phncidir~m infestans Karst.) in different provenances of Pinus siluestris I,. - Stud. For. Suec., 5: BLOCH, R., 19-11: Wound healing in higher plants. - Bot. Rev., 7: : IYound healing in higher plants Bot. Rev., 18: BOEKKER, R. H., 191-i: Damage to reproduction 11y snow. - Soc. Am. Foresters Proc., 9: Bo~uasor~: (Boco~sov), P. L., 1931: Ueber Photoperiodismus bci den Holzarten. Yorlaufige liitteilung (In Russian; German s~iinmary). - Trudj- i issled. po lesn. lroz. i lvsn. promyil., 10: BOYCE, J. S., 1961: Forest pathology. - Sev Tork, Toronto, London. BR.\cs, H. J., 1963: Die Organisation des Stammes yon Baumen und Straachern. - Stuttgart. BHUST, D., 194.5: Some factors in micro-climatology. - (2. J. R. met. Soc., 51: 307/:108: BCCI;LASIJ, D. C., REUXOXD, D. R, and PO\IERLE.IU, R., 1957: Definitions of te~ms in forest and shade Lree diseases. - Can. J. Bot., 35: BL'RSTKOM, H.. C; and ODHSOL-F, C., 1961: Vegetative anatomy of plants. - Stocltholm. C.ALLII~AX, R. Z., 1962: Geographic variabilily in gro~vtl~ of forest trccs. - Tree growth, pp CI{.ASDLER, \T. H., 1913: 1:reezinp of plant tissues by lo\\- tempcrature. - 3Iissouri Xgric. Exp. Sta. Rcs. Bnll., 8: : Some peculiar forms of winter injury in Xew Yorli state during the winter of Proc. Am. Soc. Hort. Sci., 12: CHILDS, T. XY., 1961: Delayed liilling of young-growth Douglas-fir by sudden cold. - J. For., 59:
205 D~UBEYMIRE, R : Injury to planls from rapid11 dropping temperature in TYashingto~~ and northern Idaho. - J. For., 55: D~Y, Mr. R., 1928: Damage by late frost on Douglas fir, Sitlia spruce and other conifels. - Forestry, 2: (With a note on the occurrence of Pdgoyenes bldenfafus, Herhst.. on frosted Douglas fir, bv R.?T. CHRYSTAL). 1928: Frost as a cause of disease in trees. - Q. J. For., 22: : The relationship bet~veen frost damage and larch canker. - Forestry, 5: : The relation between disease and tlie constitutio~i and environment of the tree. - J. R. Agric. Soc. England, 95: : Local climate and tlie growth of trees with special reference Lo frost. -- (2. J. R. met. Soc., 65: : A discussion of causes of dying-back of Corsican pine, ~ith special reference to frost injury. - Forestry, 9: : Variation in susceptibility of European larch of differing seed origin in Scotlmid to injury by experimental freezing. - Scot. For. 12: : Crown die-back and debility in Corsican pine (P. nigrci uur. calabricn) in Britain. - Forestrv, ". 34: DAY, Tl'. R. and PEACE, T. R., 1934: The experimental production and the diagnosis of frost injury on forcst trees. - Oxf. For. llem., 16: : The influence of certain accessory factors on frost injury to forest trees. - Forestry, 11: : Spring frosts. With special reference to the frosts of May For. Comm., Bull., 18: DAY, Tl'. R. and BARRET, D. I<., 1962: Injury by experimental freezing to various provenances of black pine (Pinus nigra Arnold). - Scot. For., 17: DENGLER, A,, 1910: Junifrostschaden an der Kiefer. - Z. Forst- u. Jagdw., 42: : Junifrostschaden an der Kiefer. - Z. Forst- u. Jagdw., 64: 97-99, DEXTER, S. T., 1933: Effect of several environmental factors on the hardening of plants. - Plant Pliysiol., 8: DIETRICHSON, J., 1961: Breeding for frost resistance. - Silvae Genet., 10: :. Provenie~lsproblemet belyst ved studier av velrstrytrne og lilima. (The provenance problem illustrated by studies of growth-rythm and climate.) - ~ledd. norske Skogsforsoksv., 19: 71: DORAILING, I., 1963: Anatomical and histological examinatio~is of the union of scion and stock in grafts of Scots pine (Pinus siluestris L.) and Sorway spruce (Picea abies (L.) Karst.). - Stud. For. Suec., 13: DUEFIELD, J. \V., 1956: Damage to xestern Tl'ashington forests from November 1955 cold wave. - U.S. Dep. Xgr., For. Serv., Pac. Xorthwest For. Range Exp. Sta., Circ EBELING, F., 1957: Den nuvarande norrlandslinjen inom svenskt skogsbruk - tillfallig moderilttning eller valgrundad nydaning? (The new Sorrland line of policy in Swedish forestry: A passing fashion or a well-founded reorganization?) - I<. Skogs- o. LnntbrAliad. Tidskr., 4: : Sltogarna och deras vard i ovre Norrland fran ocli med 1930-talet. - Sveriges skogar under 100 &r. I(.Domanstyrelsen, pp Stockholm : Vindens betydelse fijr skogens avverlining och foryngring sarsliilt i de nonlandska hojdlagena. - Norrlands SkogsvForb. Ticlsltr., pp EHRENBERG, C. EICLUXDH, 1963: Genetic variation in progeny tests of Scots pine (Pinus siluestris L.). - Stud. For. Suec., 10: EICIIE, Y., 1955: Spontaneous chlorophyll mutations in Scots pine (Pinns siluesfris L.). - Medd. Statens SkogsforsknInst., 45: 13: : Xya aspekter pl plantavghg och bristande vinterhardigliel i norrlanclsl~a Lalllrulturer. - Skogen, 49: , 432. ENEROTH, O., : Studier over rislien vid anvandning av tallfro av frammandc proveniens. (4 study on the risks of using in a particular district pine-seed from other sources.) - hledd. Statens SkogsforsAnst., 23: : Ytterligare bidrag till fr5gan om tallfroets provenieiis. (Tl'eilere Beilrage zur Frage der Provenienz des Kiefernsamens.) - Svenska SliogsvForen. Tidsltr., 26: : Till frggan om sambandet mellan en orts varmelrlin~at och hardigheten 110s dess tallvegetation. - Norrlands SkogsvForb. Tidskr., pp and
206 FILEWICZ, \V. and MODLIBOVSKA, I., 1955: The hardiness of the south-western part of the tree as the major factor in the survival during test winters. - XIV Int. Hort. Congr., Rep. I: FRIES, R. E., 1918: Stroclda iakttagelser over Bergianska tradg8rdens gymnospermer. - Xcta Horti Bergiani, 6: : Ialrttagelser angaende inverkan av vintern pa lignoserna i Bergianska tradgarden. - Acta Horti Bergiani, 13: FRIEDEL, H., 1961: Schneedeckenandauer nnd Vegetationsverteilung im Gelande. -- Mitt. Forstl. Vershnst. Nariabrunn, 59: GALAKHOV (GALACHOV), K. S., 1959: Studies on the structure of the climat.ic seasons of the year (In Russian). - Akad. Nauk S.S.S.R., 1\Ioscow, pp GENKEL (HENREL), P. A. and OKNIXA, E. Z., 1964: Dormancy and cold resistance in fruit trees (In Russian). - Alrad. Saul; S.S.S.R., 3Zoscow, pp GRAST, V., 1963: Te origin of adaptation. - New York. Gus~x~ssor, A., 1962: Genetik och vastforadling i skogsbrulrets tjanst. (Genetics and plant breeding as applied to Swedish forestry.) - Svenslta SkogsvForen. Tidskr., 60: H.~BERG, A,, 1907: Die Eigenschaften der Schneedeclre in den lapplandischen Gebirgen. - Naturwissenschaftliche Untersuchungen cles Sarekgebirges in Schwedish-Lappland, I: 3: 1: HAXBERG, H. E., 1912: Om skare och flen i Lappland. - I<. Svenslra Vetenskapsakad. Arsbok 1912, Uppsala, pp HARRIES, H. A,, 1934: Frost ring formation in some winter-injured deciduous trees and shrubs. - Am. J. Bot., 21: HARTIG, R., 1883: Eine neue Art der Frostbeschadigung in Fichten- und Tannensaat und Pflanzbeeten. - Allgem. Forst-Jagct-Zeitung, 59: : Lehrbuch der Anatonlie und Physiologie cler Pflanzcn. - Berlin : Doppelringe als Folge von Spatfrost. - Forstl. Satur~viss. Z., 4: : Lehrbuch der Pflanzenlrranlrheiten. - Berlin. HART-EY, R. B., 1918: Hardening process in plants and developments from frost injury. - J. Agric. Res., 15: : Length of exposure to low temperature as a factor in the hardening process in tree seedlings. - J. For., 28: HEDLUXD, T., 1912: On1 frosthardigheten 110s vara ltalljordsvaxter. - Svenslr bol. Tidskr., 56: : Till frilgan om vaxternas frosthardighet. - Bot. Notiser, 65: HEIKIXHEIMO, O., 1949: Results of experiments on the geographical races of spruce and pine. - Comm. Inst. for. Fenn., 37: 2: HEMENWAY, A. F., 1926: Late frost injury to some trees in Central Kentuclry. - Am. J. Bot., 13: HEPTISG, G. H., 1960: Climate change and forest diseases. - Proc. Fifth IVorld For. Congr., 2: HOFFXIAXN, D., 1895: Frostschaden bei Kiefern. - Z. Forst- u. Jagdw., 2: HOFKER, H., 1919: Uber den Einfluss der \Vinterwitterung auf die Gellolze rnit besonderer Beriiclrsichtigung des strengen Frostes im Winter 1916/17. -Mitt. dtsch. dendrol. Ges., 25: HOLXERZ, C. G. and ORTESBL~D, TH., 1886: On1 Norrbottens skogar (Sur les forets de la Norrbothnic). - Bihang till Domanstyrekens underdaniga berattelse rorande sliogsvasendet Br 1885, Stockholm, pp HOLYGREX, A,, 1963: Ytterligare bidrag till belysande av expositionens betydelse for tallkulturernas utveclrling pi stora hyggen B hog niva i Norrland. - Norrlands Slrogsv- Forb. Tidslrr., pp JACOBS, 31. R., 1915: The grolvth stresses of woody sterns. - Commonw. For. Bur., Canberra, Bull., 28: 1-67, I~ALELA, A,, 1937: Zur Synthese der experimentellen Untersuchungen iiber Klimarassen der Holzarten. - Comm. Inst. for. Fenn., 26: I~IHLMAS, A. O., 1890: Pflanzenbiologische Stuclien aus Russisch Lappland. Ein Beitrag zur Kenntnis der regionalen Gliederung an der polaren \T'aldgrenzc. - Acta Soc. pro Fauna et Flora Fennica, Helsingfors, 6: 3.
207 lioaa, E., 1964: Om tallens gren- och granens topptorlia och dess beltiirnpning. - Sliogen, 51: Iioz~ows~a, T. T., 1961: The move~r~ent of TI-ater in trees. - For. Sci., 7: : XTater metabolism in plants. - Sew Tork. I<R.AEVOJ (~(RAYETOI), S. J., OI~SIXA, E. Z. alld IPERD~IJAN, v. If., 1951: Effect of lox crilical temperatures on oak seedlings (In Russian). - Dokl. hliad. Nauli S.S.S.R., 95: KRIS.I~CEV (KRASAVZEV), 0. X., 1961: Hardening of arboreal plants to extremely low temperatures (In Russian; English summary). - Izvest. hltad. Naul;, Ser. Biol., 26: KRIEBEL, H. B., 1956: Some Analytical Teclmiques for Tree Race Studies. - Proc. Soc. Am. Foresters, Memphis, pp : Patterns of genetic variation in sugar maple. - Ohio Xgric. Exp. Sta., Rcs. Bull., 791: 1-56, LAGERBERG, T., 1912: Studier ofver den norrlandslia tallens sjnlidornar, sarsliilt rned hansyn till dess fbryngring. (Studien iiber die Kranltheiten cler norrlaudischen Iiiefer rnit besonderer Rucltsicht auf ihre X'erjiingung.) - hiedd. Statens Skogsforsoksanst., 9: (XXI-XXIV) : En abnorm barrfiillning hos tallen. (Eine Schiitte-epidemie der schwedischen Kiefer.) - BIedd. Statens SltogsforsolisA~~st., 10: (X~II-XXII) : Granens topptorka. - AIedd. Statcns SltogsfdrsAnst., LAXGLET, O., 1929: Die Entwiclilung der Provenienzfrage in Schweden. - Terh. int. Iiongr. forstl. Vershnsl., Stocliholm 1929, pp : Om variationen 110s tallen (P~III~S siluestris L.) och dess samband med Iilirnater. (Uber die Variation der Iiiefer (Pinus siluestris L.) und dercn Zusa~nmenhang mit dem Klima.) - Svenslia SliogsvForen. Tidslir., 32: : Till frigan om sambandet inellan temyeratur och vaxtgranser. (uber den ~usammenhan~~ zwischen Ternperatur und ~~rbreitungsgrenzen' von Pflanzen.) - kledd. Statens Sliogsfiirshnst. 28: 3: : Studier over tallens fysiologislta variabilitet ocll dess samband med Iiliinatet. Ett bidrag till kannedomen om tallens eltotyper. (Studien uher die physiologischc Variabilitat der Iiiefer untl deren Zusammenhang mit dern Iilima. Bcitrage zur Iiennt~lis der Oliotypcn van Pirz~ls siluestris I,.) - hledd. Statens Sliogsfiirsrl~~si., 29: : Study of the physiological variability of pine and its relation to the climate. - U.S. For. Serv.: Trans. 293: : Ett exemoel DB samband ~nellan hardighet - och stamform. - Norrlands Sliogsv- - Forb. Tidslir., i: : Proveniensforsoli med olilia tradslag, 0versilit och diskussion av hittills erl15llna resultat. (Provenienzversuchc mil verschiedenen Holzarten.) - Sveuslta Sltogsv- Foren. Tidslrr., J-11: : 0111 ntvecltlingcn av granar ur fro efter sjalvhefrulitning och efter fri viadpollinering. (cber die Ent~~icklung von teils nach liiinstlicher Selbstbesliiubung, teils nach freier I\-indbestauhung entstandenen Fichten) - 3Iedd. Statens Sltogslorshnst., 32: I: : Photoperioclisinus und Provenienz bei cler gemeinen Iiiefer (Pinus siluesiris I..). - 3Iedd. Statens SkogsforsX~lsi., 33: : Om mojligheten att sliogsodla rned gram och tallfro av ortsframmandc proveniens. Svenslta SkogsvForen. Tidskr., 1: 68-78, 1952: ProveniensfrAgan. Statens sliogsforsliningsi~lstitut AIecld. Statens Sltogsforshnst., 42: : 1-idgade granser for fiirflyttning av tallprovenienser till sltogsocllillgsplatser i norra Sverige. - Sliogen, 44: : X cline or not a cline - a question of Scots pine. - Silvae Genet., 8: 1: : Sorrlandstallens praliliska och systernatiska avgriinsning. - Svenslia Sltogsv- Forcn. Tidslir., 3: : Ecological variability and Laxonorny of forest trees. - Tree Groxth, pp : Patterns and terms of intra-specific ecological variability. - Satme? 200: : TvAhundra Br gencliologi. - Svensk bol. Tidsltr., 58:
208 LARCHER, K., 1963: Zur Frage des Zusammenhanges zwischcn Austrocltnungsresistenz und Frostharte bei Iinmergriinen. - Protoplasma, 57B: LEVITT, J., 1956: The hardiness of plants. - Kew York : The moinent of frost injury. - Protoplasma, 48: : Frost, drought and heat resistance. - Protoplasnlatologia \-111. Physiologic des Protoplasmas, 6: : A sulfhydryl-disulficle hypothesis of frost injury and resistance in plants. - J. Theor. Biol., 3: LEVITT, J., SCLLIVAS, CH. Y. and Jo~~sssos, N. 0., 1962: Sulfhydryls - a new factor in frost resistance Relation of SH to protein, glutathione oxidizing activity. - Plant. Physiol., 37: LEVITT, I., SULLIVAN, CH. Y., JOHANSSON, N. 0. and PETTIT, R. P., 1961: Sulfhydryls - a new factor in frost resistance. I. Changes in SH content during frost hardening. - Plant Physiol., 36: LIDFORSS, B., 1907: Die wintergriine Flora. Eine biologische Untersuchuag. - Lunds Univ. Arsslir. K. S., 2: 2: 13: LINES, R. and MITCHELL, A. F., 1964: Results of some older Scots pine provenance experiments. - Rep. For. Research, pp LUTZ, H. J., 1936: Scars resulting from glaze on woody stems. - J. For., 34: MATHESON, T., 1961: Frost damage - late spring 1961, and forest tree clearing office. - Q. J. For., 55: NATERN, B., 1960: Spatial Variation. Stochastic models and their application to some problems in forest surveys and other sampling investigations. - RIedd. Statens Skogsforsknlnst., 19: lia~~ssos-1\i.s~x, L., 1922: Snotrycltsltador l ungtall (Degits de neige chez des jeunes pins sylvestres). - 3Iedd. Statens SkogsforsAnst., 19: ~IEYER, B. S., 1928: Seasonal variations in the physical and chemical properties of the leaves of the pitch pine, xith especial reference to cold resistance. - Am. J. Bot.. 15: NETZGER, K., 1908: Uber das I<onstruktionsprinzip des sekundaren Holzliorpers. - Naturn%s. 2. Forst-Landw., 6: JIix, A. J., 1916: The formation of parenchyma wood follo~~ing winter injury to the cambium. - Phytopathology, 6: MORK, E., 1916: Vedanatomi. - Oslo : Om sambnndet mellom temperatur, toppskuddtilveltst og lrringens velist og forvedning hos gran (Picea nbies (L.) Karst.). (On the relationship between temperature, leading shoot increment and the grovth and lignification of the annual ring in Korway spruce (Piceu ubies (L.) Karst.) - RIecld. norske Sltogsforsoltsv., 16: JIOSHKOV (~IoSKOV), B. S., 1935: Photoperiodism and frost resistance of perennial plants (In Russian; English summary). - Trudy po prikl. botan., genet. i. seleli., 3: 5: , ;\I~'scH, D., 1913: Hitzeschaden an TValdpflanzen. - Naturwiss. Z. Forst-Landw., 11: : Kochmals Hitzeschaden an Waldpflanzen. - Naturwiss. Z. Forst-Landw., 12: : Frostgefahrdung wintergriiner Geholze. - Mitt. cltsch. dendrol. Ges., 11: XEGER, F. TV., 1913: Die nordische oder Lapplandliiefcr (Pinus silvestris L. our. lapponica Fr.). - Tharandter forstl. Jb., 64: : Rauch~irltung, Spatfrost und Frostirocltnis und ihre Diagnostik. - Tharandter forstl. Jb., 66: Norrlands sltogsv8rdsforbunds exliursion till Lappland (Norrbotten) den juni Norrlands SliogsvForb. Tidskr., 1961, pp NXSLUSD, ll., : Funlttioner och tabeller for ltubering av st3ende trad. Tall, gran och bjork i norra Sverige (Funktionen und Tabellen zur Kubierung stellender Banme. Kiefer, Fichte und Birlte in Nordschweden). - Jledd. Statens SltogsfiirsAnst., 32: : Funktioner och tabeller fdr kubering av stlende trad. Tall; gran och bjork i sodra Sverige saint i hela landet. (Functions and tables for computing the cubic volume of standing trees. Pine, spruce and birch in Southern Sweden, and in the whole of Sweden.) - XIedd. Statens SkogsforsAnst. 36: 3: 1-81.
209 ODIX, H., 1964: Skogsmeteorologiska undersoltningar i hojdlagen. (Investigations of forest meteorology in upland terrain.) - K. Skogs- LantbrAkad. Tidskr., 103: PARKER, J., 1957: Seasonal changes in some chemical and physical properties of living cells of Pinus ponderosa and their relation to freezing resistance. - Protoplasma, 48: : Seasonal changes in white pine leaves: X comparison of cold resistance and free-sugar fluctuation. - Bot. Gaz., 121: : Survival of woody plants at extremely low temperatures. - Nature, 187: : Cold resistance in woody plants. - Bot. Rev., 29: PISEK, A, 1950: Frostharte und Zusammensetzung des Zellsaftes bei Rhododendron ferrugineum, Pinus cembra und Picea ercelsa. - Protoplasma, 39: : An den Grenzen des Pflanzenlebens in Hochgebirge. - Jb des Vereins zum Schutze der Alpenpflanzeri und -Tiere, V, 28: PORIERLEAU, R., 1944: Observations sur quelques maladies non parasitaires cles arbrcs dans le Quebec. - Can. J. Res., 22-C: RADXOVA (RYADXOV.I), I. hi. and ERERIIN (YEREMIX), G. V., 1964: Winter hardiness of fruit trees in southern U.S.S.R. (In Russian). - hzoscow, pp Reports of the First Conference on Winter Hardiness in Plants, December 23, 1960, in Latvian S.S.R., 1962: Winter and cold hardiness (In Latvian, Russian summary). - Latvijas P.S.R. Zin. Akad., Riga, pp Reports of the Second Ural Conference on Ecology and Physiology of TYoody Plants (In Russian), Ural Filial Akad. Nauk S.S.S.R., Ufa, pp Resolution of Conference on Physiology of Plant Hardiness, Adopted hiarch 7, 1959 (In Russian), Fiziol. Rast., 6: RHOADS, A., 1923: The formation and pathological anatomy of frost rings in conifers injured by late frosts. - U.S. Dep. Agric., Dep. Bull., 1131: ROBAK, H., 1951: Noen iakttakelser ti1 belysning av forholdet mellom klimatiske sltader og soppangrep pi nlletraer. (Some observations contributing to the study of the connections between climatal damages and fungus attacks on conifers.) - Medd. Vestland. Forstl. Forsokssta., 8: 2: : Sambandet niellom daglengden og avslutningen av den Brlige vekstperioden 110s en del niletreslag av interesse for virt skogsbrult. (On the connection between dajlength and termination of the annual growth period in seedlings of some conifers of interest to Sorwegian forestry.) - XIedd. L'estland. Forstl. Forsnltssta., 10: ROLL-HANSEN, F., 1964: Scleroderris lagerbergii Gremmen (Crumenulu nbietina Lagerb.) and girdling of Pinus silvestris (L.). (Scleroderris lagerbergii Gremmen (Crumenula abietina L,agerb.) og barkringning av furu.) - Medd. norslce Skogsforsoksv., 19: RUDEN, T., 1957: Arvelige dvergformer av furu (Pinus siloestris L.) fra SlijBk, Crudbrandsdal. (Abnormal types of Scots pine (Pinus siluestris L.) from Sl<j&li, Gudbrandsdal.) - hiedd. norske Sltogsforsoksv., 14: SAKAI, A,, 1956: The effect of temperature on the maintenance of the frosthardiness. - Low Temp. Sci., Ser. B., 14: : The effect of temperature on the hardening of plants. -Low Temp. Sci, 14: : Survival of plant tissue at superlow temperatures. - LOT Temp. Sci., 14: : Survival of plant tissue at superlow temperature. - Low Temp. Sci., 16: : The frost hardening process of woody plant Relation of low temperature to frost-hardening. - Low Temp. Sci., 17: : The frost hardening process in woody plants. V. The relationship between devclopmental stage and frost hardening. - Low Temp. Sci., 17: : Survival of the twigs of woody plants at --196' C. - Nature, 185: : Survival of woody plants at extremely low temperatures. - Nature, 187: : Studies on the frost-hardiness of woody plants. I. Tl~ causal relation belween sugar content and frost-hardiness. - Low Temp. Sci., Ser. B., 11: SALISBLRY, E. J., 1939: Ecological aspects of meteorology. - Q. J. R. met. Soc., 65: s. Sa~vas, R., 1950: Investigations into the natural regeneration of selectively cut private forests in northern Finland. - Comm. Inst. for. Fenn., 38: SAX, K., 1954: The control of tree growth by phloem blocks. - J. Arnold Arboretum, 35:
210 SESEFIELD, G. and \YARDROP, A. B., 1962: The nature of reaction wood. - hust. J. Bot., 10: 2: SCKLIID-VOGT, H. et al., (1965): Forstsamengewinnung und Pflanzenanzucht fur clas Hochgebirge. - 3Iunchen, Basel, Wien. SCHLIUTZ, \T., SULLIV.AS, CH. Y. and LEVITT, J., 1961: Sulfhydryls - a new factor in frost resistance. 11. Relation betxeen sulfhydryls & relative resistance of fifteen wheat varielies. - Plant. Physiol., 36: SCHNELLE, F. et al., 1963: Frostschutz iin Pflanzenbau. R. 1. Die ~neteorologischen uncl biologischen Grundlagen clcr Frostschadensverhutung: B. 2. Die Praxis der Frostschadensverhutung. - 3Iiinchen, Basel, Wen. SCHOTTE, G., 1923: Tallfroets proveniens - Norrlands vilitigaste skogsodlingsfr?+ga. (La provenance des semences du pin sylvestre - une question trks importante pour la regeneration des forits en Norrland.) - RIedd. Statens SliogsforsAnst., 20: SCHTERDTFEGER, F., 1957: Die \Talclkrailliheiten. - Hamburg, Berlin. SERGEEV, L. I., 1964: AIorphological and physiological investigations into winter hardiness in woody plants (In Russian). - Physiology of winter hardiness in ~oody plants. Xliad. Nauli S.S.S.R., RIoscow, pp Ssarm, 31. and GUSTAFSSOS,,%., 1954: Frobeskaffenheten hos inodertrad och ympar av tall. (Seed properties in mother trees ancl grafls of Scots pine.) - AIedd. Statcns SliogsforsknInst., 44:2: SISSOTT, E. TY., 1952: Reaction wood and the regulation of tree form. - Am. J. Bot., 39: 1: SOMLIER~ILLE, I\'., 1916: Abnormal wood in conifers. - Q. J. For., 10: ShIHI: *%rsboli 11: 2, ;\Ieteorologiska iakltagelser i Sverige. SMHI: Xrsbok I, MBnadsoversiltt over vaderleli och vattentillging. SOKIUGK, P., 1921: Ha~ldbucll der Pflanzenliranliheitcn. I. Ncht-parasitare Krankheiten. - Berlin. SPIULDISG, P. and B~arros, A. IT., 1946: Decay folloxing glaze storm damage in xoodlands of central Sew Yorli. - J. For., 44: STAULIACHER, 1924: Die Frostschaden in Forstbetrieb, dcren Ursachen und Beliampfung. - Forstmiss., Cbl ST EBB IS^, G. L., 1950: Variation ancl evolution in plants. - London. STEF.\PSSOS, E., 1964: Forsoli ~ned tallprovenienser i ilordsveilslia hojdlagen. - Foren. Sl;ogstradsforadl., Lkrsbol; 1964, pp STETEXS, F. I,. and YOUNG, P. A, 1925: On the use of the terms saprophyte and parasite. - Phytopatl~ology, 17: STOSE, E. I,. J., 1952: An unusual type of frost injury in pine. - J. For., 50: 560. SYLV~S, ht., 1917: Den nordsvenslia tallen (Die nordschvedischer Kiefer). - RIedd. Statens SltogsforsAnst., 13-14: (I-XII) : Om rbra frammande barrtrads vinterharciighet. (Uber die Winterfestigkeit fremcler Nadelhiiuine in Schweden.) - hledd. Statens SliogsforsAnst., 21: : LLng- och liortclagstyper av cle svenslia sliogstraden. - Svensli PappTidn., 43: ; ; ~IICHO~IIRO\~ (TICHO~IIROV), B. A,, 1963: Contributions to the biology of arctic plants (In Russian). - Akad. Nauk. S.S.S.R., 3Ioscow, pp TIREN, L., 1945: Erfarenheter av naturlig foryngring i Norrland. - Svenska Sltogsv- Forcn. Ticlslir., 2: : NBgra synpunkter pb Sorrlands sliogsodlingsproblem. - Srenslia SkogsvFGren. Tidskr., 3: : Om den naturliga foryngringen p& obranda hyggen i norrlandsli gransltog. (On natural regeneration in unburnt cutting areas in Norrland spruce forests.) - 3Iedcl. Statens Sliogsforsknlnst., 38: 9: TRASQUILLISI, TV. and TURSER, H., 1061: Untersuchungen iiber clic Pflanzentemperalure11 in der subalpi~len Stufe mit bcsonderer Beriiclisichtung der htadeltcrnperaturen der Zirbe. - Mitt. Forst. '\'ersanst. 3Iariabrunn, 59: TUBEUF, C., YON, 1914: Hitzetot und Eiilscl1niiru1lgslirankheiteI1 der Pflanzen. - Natur- ~~iss. Z. Forst-Landw., 12: Tcxasor, I. I., 1940: The phb-siological basis of winter hardiness in culli~ated plants (In Russian). - Leningrad, pp : Basic achie~ements of Sol-iet science in the studies of cold hardiness in plants (In Russian). - Aliad. Nauk S.S.S.R., 3Ioscow, pp
211 Tu>r.*~ov, I. I., 1955: Vegetating and winter resistant stages in plants (In Russian). - Fiziol. Rast., 2: : Frost resistivity of fruit trees (In Russian; English summary). - Izvest. Xkad. Nauk S.S.S.R., Ser. Biol., 28: Tu>~o-ov, I. I. and I<R.&SAVCEV (KRASAVZEV), 0. A,, 1955: Cold resistance of woodyplants (In Russian). Fiziol. Rast., 2: : Hardening of northern woody plants by negative temperature treatment (In Russian; English summary). - Fiziol. Rast., 6: : Effect of thawing rate on survival of vitrified cells and hardened plants (In Russian; English summary). - Fiziol. Rast., 9: : A study of the mechanism of dying of rapidly thawing plants (In Russian; English sumnrarg). - Fiziol. Rast., 9: and HVALIN (KH~ALIN), x. N., 1959: Promotion of resistance of birch and black currant to - 253" C by cold hardening (In Russian). - Dolil. Akad. Xauk S.S.S.R., 127: WAGENER, W. \V., 1949: Top dying of conifers from sudden cold. - J. For. 45: ~TAISEL, Y., KOHN, H. and LEVITT, J., 1962: Sulfhydryls - a new factor in frost resistance. I\'. Relation of GSH - oxidizing activity to flower induction & hardiness. - PlanL. Physiol., 37: TASILJE~, I. hf., 1956: 1Vintering of plants (In Russian). - Xkad. Sauk S.S.S.R., AIosco~t', pp TEGIS, A, 1964: Dormancy in higher plants. - Ann. Rev. Plant. Physiol., 15: : Ruhezustande bei hoheren Pflanzen, Induktion, \'erlauf und Reendigung: i'bersicht, Terminologie, allgemeine Probleme. - Encycl. Plant Physiol., 15: 2: Die Becleutung von physikalisclren und chenrischen Aussenfaktoren bei der Induktion und Beendigung von Ruhezustanden bei Organen und Geweben hiiherer Pflanzen. - Encycl. Plant Physiol., 15: 2: ~VHETZEL, H. H : The terminoloev -" of phytophatology. - " - -" -- Proc. Int. Conar. Plant. Sci., 1926, 11: \TIBECK, E., 1912: Tall och wan av s~dli~ Irarlio~nst i Sverige. (uber das TerhalLen der Kiefer und Fichten von ausl5ndischem; besonders deutsche~n Saatgutin Schweden.) - hiedd. Statens Skogsforshnst., 9: (~III-xx). 1913: Om sjalvsficld och skogsodling i ovre Korrland. (Uber naturliche und liiinstliclre Verjiingung in den \T'aldern Sordschwedcns.) - 31edd. Statens SkogsforsoksAnst.: 10: (xi-xvi). 1919: Om tall- oclr granfrii frh Sorrland. - Skogen, 6: : Om tallens lilimatformer och tradslagets fbrl18llande till vertilialforflytt~~i~~g. Skogen, 15: : Till skogens rasfraga p& loliala kallorter. - Norrlands SliogsvFhren. Tidslir., DD A. ~YISI~LER, A, 1913: cber den Einfluss der Aussenbcdingungen auf die I<altcresistenz ausdauernder Gewachse. - Jb. wiss. Bot., 52: Zos, R. G., 1903: Effects of frost upon forest vegetation. - For. Q., 11: :~ER~IAS,?L, 1927: Studien uber den Kaltetod und Iialteresistenz der Pflanzen nebst Untersuchungen iiber die Ivinterfestigkeit des \\Ieizens. - Lund, pp ~GSTROM, A., 1925: The albedo of various surfaces of ground. - Geogr. Annlr., 7: ORTENBLAD, TH., 1903: Talltorka. - Skogsvannen, pp : Frostskador 5 tallen. - Sliogsvannen, pp : Af kold dodade tallsliott. - Skogsvannen, pp ,

212 Sammanfattning Foreliggande arbete behandlar koldskador och plantdod resp. overlevnadsfiirnibga 110s tallplantor i en provenieilsforsoksserie utlagd Denna serie omfattar 30 planteringsytor fordelade over storre delen av Sverige nled en sainmanlagd areal av 36 ha. Har har endast material frin 20 forsolisytor Iiommit till anvandning, namligen frbn de ytor, som ar belagna norr om 60' N. I denna del av Sverige har under perioden intraffat betydande Iiiildskador, vilka observerats icke blott pi forsolisytorna utan aven i andra planteringar och pi trad intill en Blder av 20 Br. Inom vissa omriden var planteringarna nzycket skadade och i nigra fall har de t. o. m. helt gbtt ut. Orsaken till koldskadorna och till den stora avgingen har tillskrivits olika faktorer. Detta arbete har i friimsta ruminet avsett undersokning av den typ av koldskador, son1 har betecknats sisom sbasal stem girdle!) eller ~strangulerings (sstrangulation sickness!), atrocken Giirtela, neinschniirunga) och dess samband med extrema klimatforhbllanden under vissa ir. Xven forekomsten av andra slag av koldskador och skador fororsakade av andra lilimatfaktorer har emellertid beaktats. Det i proveniensforsoksserien anvanda plantmaterialet har erh5llits ur fro frin 100 naturliga bestand av olika proveniens. Av dessa provenienser representeras 90 av avliomma frin individuella triid. Det totala antalet skordade och unclersokta modertrad ar Froet utsbddes 1951 i tvi plantsltolor: vid Riiskar (Stockholms Ian) och i Sundmo (Vasternorrlands lan). Forsoksytorna markbereddes omsorgsfullt och iordningstalldes for plantering 5ret innan denna agde rum. Planteringen skedde i oppen grop. Plantmaterialet 1-ar vid planteringen 210, 211 eller 212. Yarje forsoksyta omfattar en eller tvi avdelningar rned vardera fyra slump - nlassigt fordelade block enligt YOUDEN'S rnodifierade kvadratmetod. Varje aclelning omfattar 7 provenienser: lokalproveniens (motsrarande) och 2 standardprovenienser jamte 2 provenienser av nordligare och 2 av sydligare harkomst an forsoksytan. Samtidigt skulle inom de sistnamnda proveniensparen den ena proveniensen representera ett hogre, den andra ett lagre ornride an planteringsorten. Forflyttningen var principiellt begransad till 150 km i nordlig riktning, 200 km i sydlig riktning saint 100 n~ uppbt eller nedit. I de fall forsoksytorna omfattar 2 avdelningar, har inom den ena avdelningen anvants pro\-eniens som forflyttats over Iiingre avstind resp. hojdsliillnader. En enhetlig behandling av samtliga plantor pi forsoksytorna har efterstriivats. I flertalet fall visade det sig nodvandigt att hagna ytorna mot ren, ridjur och Blg. DB forsoliet avsig undersdkning av kliniatfaktorer, var det nddvandigt att eliminera infektion av snoskytte, vilket skedde genom besprutning Bren Vidare har itgarder vidtagits for att skydda plantorna mot angrepp av snytbaggar ( ) och gnagare samt att motverlia andra biotiska faktorer. Yidtagna itgarder visade sig effektiva mot fijrekommande skadegorare samt reducerade uppkomsten av slumpsltador. Sisom primiira och praktiskt

213 taget enda aterstbende orsaker till sliador och aigbng i forsoket h~arstod siledes sisom avsett endast de lilimatiska falitorerna. Dessa faktorers inverlian har sblunda kunnat studeras under perioden , liksom deras foljduerkningar. En reservation gors for sekundara faktorer sisoin angrepp av fakultativa parasitsvampar och inselitsangrepp pb redan koldsliadade triicl. Revision av forsoksytor och granskning av plantor har utforts ~arje Br. Yarje planta har behandlats sbsoin ett pernlanent forsoksobjekt. Data frill Aren har bearbetats enligt foljande: 1. Endast ursprungligen utsatta plantor har bealitats; 2. Plantavghgen har Btergivits i diagram; 3. Forsoksytorna har samnianforts inoin regioner och subregioiier ined hiinsyn till den geografiska forekornsten av de falitorer, som orsakat koldsliador och plantdod. Det forhbllandet att data endast frbn ursprungligen utsatta plantor medtagits vid bearbetningen har i hog grad minsliat den variation i plantavgbng, soin kan hanforas till okanda orsalier. Data over plantavgbngen inom de enskilda provenienserna pb varje forsolisyta sammanstallas har i tvb typer av diagram, 5tergilande A. den samlade plantavgangen CRI (~)cuniulative mortalityo); B. den irliga plantavg5ngen SYM ())single year mortality))). Dessa tva typer av diagram Bterfinns for de olilia ytorna i figs Kurvorna illustrerar de olika proveniensernas anpassning till forsoksytornas loliala forhillanden under tiden De olika provenienserna intar i diagraminen en viss ordningsfoljd, i det att provenienser frbn trakter norr om ytorna ~isarelativt l5g avgbng, medan sadana frbn traliter soder om ytorna visar en ofta rnycket hog dodlighet. Forflyttningen i hojdled lian iiven p51-erlia plantavgingen. 1Cur.i-orna as- typ A kan indelas i tre sektioner, omfattande foljancle tider: I. fr5n plantering till 1956; ; Kurx-orna av typ B visar en med olika ar varierande plantavgbng. I regel kan man iirsliilja fyra olika maxima, vilka motsvaras av endera ett bestaint Br eller av tv5 eller tre pb varandra foljande Br. I det senare fallet fijreligger en fordrojd verkan axfalitorer, sorn orsaliade sliadan under det forsta Bret. De bbda forsta ~naxiina B B-liurvorna inotsvara den forsta sektionen av A-kurvorna. B-kurl-ornas 3:e inaximmn hanfor sig till 195s och dess 4:e inaxiinuin till , eller till A-liurvornas 2:a resp. 3:e sektioner (jfr fig. 44 B). Inom forsta selitionen av A-liurvorna miirks det fiirhillandet, att plantor uppdragna i trakten av Stocliholnl reagerat p5 ett annat siitt ail plantor uppdragna vid Sundmo. De forstniimnda (jfr fig. 41 A provenienserna -22 och 54) visar till en borjan relativt ringa plantavgbng sanimanhangande nled plantornas goda utvecliling och storre storlek. I liurvornas senare sektioner iir demla sliillnad eliminerad. Inom den 3:e selitionen niirmar sig liurvorna for en del av de s3-dligare provenienserna sina asyniptotiska viirden, dvs. en total avging. Det falitum, att n5gra fb individer har liunnat overleva bor tillskrix-as den naturliga spridningen av liiildresistensen olika individer emellan (t. ex. provenienserna 59 och 54 i fig. 43 A). En del provenienser, som endast forflyttats norrut over ni5ttliga distanser \ isar sannna kurvtyp, ehuru antalet overlevande i dessa fall ar storre. Olika proveniensers anpassning till liliniatforh5llandena pi J tornn ar 1 hog
Useful Propagation Terms. Propagation The application of specific biological principles and concepts in the multiplication of plants.
 Useful Propagation Terms Propagation The application of specific biological principles and concepts in the multiplication of plants. Adventitious Typically describes new organs such as roots that develop
Biology and Ecology of Forest Health. Climate Change and Tree Health
 Biology and Ecology of Forest Health Climate Change and Tree Health Assume classic UKCIP scenario: ca 3 o C warming in 50-80 yrs; warmer winters/summers; increased winter rain and summer drought; perturbations
World Geography Chapter 3
 World Geography Chapter 3 Section 1 A. Introduction a. Weather b. Climate c. Both weather and climate are influenced by i. direct sunlight. ii. iii. iv. the features of the earth s surface. B. The Greenhouse
JRC MARS Bulletin global outlook 2017 Crop monitoring European neighbourhood
 MARS Bulletin global outlook 2015-06 7r JRC MARS Bulletin global outlook 2017 Crop monitoring European neighbourhood Russia April 2017 Positive start to the season after winter dormancy The sowing campaign
PHYSIOLOGY AND MAINTENANCE Vol. V - Phenology of Trees and Other Plants in the Boreal Zone Under Climatic Warming - Heikki Hänninen
 PHENOLOGY OF TREES AND OTHER PLANTS IN THE BOREAL ZONE UNDER CLIMATIC WARMING Heikki Hänninen Department of Ecology and Systematics, University of Helsinki, Finland Keywords: Bud burst, boreal zone, climatic
CAMBIUM, meristem, heartwood, and lenticel are
 Examining the Structures of a Tree CAMBIUM, meristem, heartwood, and lenticel are some terms that may be new to you. These terms are used to describe various tree structures. Not surprisingly, many terms
VARIATION IN THE SIZE OF RAY PITS OF CONIFERS.*
 VARIATION IN THE SIZE OF RAY PITS OF CONIFERS.* FOREST B. H. BROWN. Since Haeckel proposed the word Ecology in 88, there has been an ever growing interest in the influence which environmental factors may
National Meteorological Library and Archive
 National Meteorological Library and Archive Fact sheet No. 4 Climate of the United Kingdom Causes of the weather in the United Kingdom The United Kingdom lies in the latitude of predominately westerly
Cold-Hardiness Testing of Conifer Seedlings1
 Cold-Hardiness Testing of Conifer Seedlings1 Karen E. Burr, Stephen J. Wallner, and Richard W. Tinus 2 Abstract.--This paper briefly describes the results of preliminary experiments designed to test four
Chapter outline. Reference 12/13/2016
 Chapter 2. observation CC EST 5103 Climate Change Science Rezaul Karim Environmental Science & Technology Jessore University of science & Technology Chapter outline Temperature in the instrumental record
Climate Change. Unit 3
 Climate Change Unit 3 Aims Is global warming a recent short term phenomenon or should it be seen as part of long term climate change? What evidence is there of long-, medium-, and short- term climate change?
Frost Survival of Plants
 A. Sakai W. Larcher - l-o o Frost Survival of Plants Responses and Adaptation to Freezing Stress With 200 Figures Springer-Verlag Berlin Heidelberg New York London Paris Tokyo 1. Low Temperature and Frost
Chapter 3 Section 3 World Climate Regions In-Depth Resources: Unit 1
 Guided Reading A. Determining Cause and Effect Use the organizer below to show the two most important causes of climate. 1. 2. Climate B. Making Comparisons Use the chart below to compare the different
Climate and Adaptations at the Fullerton Arboretum
 Climate and Adaptations at the Fullerton Arboretum Summary of Activity: Investigate different implementations of key plant traits in plants from different climate settings. Assess plant traits in terms
Climate change: Rain melting Greenland ice sheet 'even in winter'
 Climate change: Rain melting Greenland ice sheet 'even in winter' By David Shukman Science editor 8 hours ago JOSEPH COOK After it rains the surface darkens, which speeds up melting Rain is becoming more
Analysis of meteorological measurements made over three rainy seasons in Sinazongwe District, Zambia.
 Analysis of meteorological measurements made over three rainy seasons in Sinazongwe District, Zambia. 1 Hiromitsu Kanno, 2 Hiroyuki Shimono, 3 Takeshi Sakurai, and 4 Taro Yamauchi 1 National Agricultural
Biomes Section 2. Chapter 6: Biomes Section 2: Forest Biomes DAY ONE
 Chapter 6: Biomes Section 2: Forest Biomes DAY ONE Of all the biomes in the world, forest biomes are the most widespread and the most diverse. The large trees of forests need a lot of water, so forests
What is a TREE? Woody plant (stems, branches, roots) Long lived (typically 100 s of yrs. sometimes 10
 Long lived (typically 100 s of yrs. sometimes 10") What is a TREE? Woody plant (stems, branches, roots) Long lived (typically 100 s of yrs. sometimes 10 s or 1000 s) Single main axis (stem, trunk, bole) Typically 20-30 tall at maturity (note variability)
What is a TREE? Woody plant (stems, branches, roots) Long lived (typically 100 s of yrs. sometimes 10 s or 1000 s) Single main axis (stem, trunk, bole) Typically 20-30 tall at maturity (note variability)
WHAT CAN MAPS TELL US ABOUT THE GEOGRAPHY OF ANCIENT GREECE? MAP TYPE 1: CLIMATE MAPS
 WHAT CAN MAPS TELL US ABOUT THE GEOGRAPHY OF ANCIENT GREECE? MAP TYPE 1: CLIMATE MAPS MAP TYPE 2: PHYSICAL AND/OR TOPOGRAPHICAL MAPS MAP TYPE 3: POLITICAL MAPS TYPE 4: RESOURCE & TRADE MAPS Descriptions
WHEN CAN YOU SEED FALLOW GROUND IN THE FALL? AN HISTORICAL PERSPECTIVE ON FALL RAIN
 WHEN CAN YOU SEED FALLOW GROUND IN THE FALL? AN HISTORICAL PERSPECTIVE ON FALL RAIN Steve Petrie and Karl Rhinhart Abstract Seeding at the optimum time is one key to producing the greatest yield of any
DOWNLOAD PDF SCENERY OF SWITZERLAND, AND THE CAUSES TO WHICH IT IS DUE.
 Chapter 1 : The Scenery of Switzerland (Sir John Lubbock - ) (ID) ebay The scenery of Switzerland and the causes to which it is due / Related Titles Series: Collection of British authors ; vol. These diseases
JRC MARS Bulletin Crop monitoring in Europe January 2016 Weakly hardened winter cereals
 Online version Issued: 25January 2016 r JRC MARS Bulletin Vol. 24 No 1 JRC MARS Bulletin Crop monitoring in Europe January 2016 Weakly hardened winter cereals A first cold spell is likely to have caused
Plant Water Stress Frequency and Periodicity in Western North Dakota
 Plant Water Stress Frequency and Periodicity in Western North Dakota Llewellyn L. Manske PhD, Sheri Schneider, John A. Urban, and Jeffery J. Kubik Report DREC 10-1077 Range Research Program Staff North
The Meteorological Observatory from Neumayer Gert König-Langlo, Bernd Loose Alfred-Wegener-Institut, Bremerhaven, Germany
 The Meteorological Observatory from Neumayer Gert König-Langlo, Bernd Loose Alfred-Wegener-Institut, Bremerhaven, Germany History of Neumayer In March 1981, the Georg von Neumayer Station (70 37 S, 8 22
remain on the trees all year long) Example: Beaverlodge, Alberta, Canada
 Example: Beaverlodge, Alberta, Canada") Coniferous Forest Temperature: -40 C to 20 C, average summer temperature is 10 C Precipitation: 300 to 900 millimeters of rain per year Vegetation: Coniferous-evergreen trees (trees that produce cones
Coniferous Forest Temperature: -40 C to 20 C, average summer temperature is 10 C Precipitation: 300 to 900 millimeters of rain per year Vegetation: Coniferous-evergreen trees (trees that produce cones
TREES. Functions, structure, physiology
 TREES Functions, structure, physiology Trees in Agroecosystems - 1 Microclimate effects lower soil temperature alter soil moisture reduce temperature fluctuations Maintain or increase soil fertility biological
Chapter 1 Section 2. Land, Water, and Climate
 Chapter 1 Section 2 Land, Water, and Climate Vocabulary 1. Landforms- natural features of the Earth s land surface 2. Elevation- height above sea level 3. Relief- changes in height 4. Core- most inner
bark the tough outer covering of the stems and roots of trees, shrubs, and other woody plants (IG)
") FOSS Trees and Weather Module Glossary NGSS Edition 2018 adopt to take on something as if it is yours (IG) air a mixture of gases that we breathe (IG) bark the tough outer covering of the stems and roots
FOSS Trees and Weather Module Glossary NGSS Edition 2018 adopt to take on something as if it is yours (IG) air a mixture of gases that we breathe (IG) bark the tough outer covering of the stems and roots
Temperature and light as ecological factors for plants
 PLB/EVE 117 Plant Ecology Fall 2005 1 Temperature and light as ecological factors for plants I. Temperature as an environmental factor A. The influence of temperature as an environmental factor is pervasive
The Global Scope of Climate. The Global Scope of Climate. Keys to Climate. Chapter 8
 The Global Scope of Climate Chapter 8 The Global Scope of Climate In its most general sense, climate is the average weather of a region, but except where conditions change very little during the course
Prediction of Snow Water Equivalent in the Snake River Basin
 Hobbs et al. Seasonal Forecasting 1 Jon Hobbs Steve Guimond Nate Snook Meteorology 455 Seasonal Forecasting Prediction of Snow Water Equivalent in the Snake River Basin Abstract Mountainous regions of
Climate Dataset: Aitik Closure Project. November 28 th & 29 th, 2018
 1 Climate Dataset: Aitik Closure Project November 28 th & 29 th, 2018 Climate Dataset: Aitik Closure Project 2 Early in the Closure Project, consensus was reached to assemble a long-term daily climate
Exemplar for Internal Achievement Standard. Mathematics and Statistics Level 3
 Exemplar for internal assessment resource Mathematics and Statistics for Achievement Standard 91580 Exemplar for Internal Achievement Standard Mathematics and Statistics Level 3 This exemplar supports
As in 2008, greater than normal rainfall occurred in 2009, resulting in optimum
 2009 Weather at the Arboretum Bob Famiglietti As in 2008, greater than normal rainfall occurred in 2009, resulting in optimum soil moisture conditions at the Arboretum. Excellent growth rates were recorded
THE DEGENERATION OF CARDON POPULATIONS IN BAJA CALIFORNIA SUR, MEXICO
 THE DEGENERATION OF CARDON POPULATIONS IN BAJA CALIFORNIA SUR, MEXICO GINA HOLGUIN, ROY BOWERS, AND YOAV BASHAN Reprinted from CACTUS AND SUCCULENT JOURNAL Vol. 65, No. 2, March-April, 1993 Made in United
6. What has been the most effective erosive agent in the climate system? a. Water b. Ice c. Wind
 Multiple Choice. 1. Heinrich Events a. Show increased abundance of warm-water species of planktic foraminifera b. Show greater intensity since the last deglaciation c. Show increased accumulation of ice-rafted
The importance of long-term Arctic weather station data for setting the research stage for climate change studies
 The importance of long-term Arctic weather station data for setting the research stage for climate change studies Taneil Uttal NOAA/Earth Systems Research Laboratory Boulder, Colorado Things to get out
The weather in Iceland 2012
 The Icelandic Meteorological Office Climate summary 2012 published 9.1.2013 The weather in Iceland 2012 Climate summary Sunset in Reykjavík 24th April 2012 at 21:42. View towards west from the balcony
Impacts of Changes in Extreme Weather and Climate on Wild Plants and Animals. Camille Parmesan Integrative Biology University of Texas at Austin
 Impacts of Changes in Extreme Weather and Climate on Wild Plants and Animals Camille Parmesan Integrative Biology University of Texas at Austin Species Level: Climate extremes determine species distributions
Chapter 8. Biogeographic Processes. Upon completion of this chapter the student will be able to:
 Chapter 8 Biogeographic Processes Chapter Objectives Upon completion of this chapter the student will be able to: 1. Define the terms ecosystem, habitat, ecological niche, and community. 2. Outline how
2012 will likely be remembered for the significant cold injury damage that occurred to fruit during the spring season. Our scheduled first speaker
 2012 will likely be remembered for the significant cold injury damage that occurred to fruit during the spring season. Our scheduled first speaker this afternoon was unable to attend today. Unable to secure
Acoustic Emission Technique for the Detection of Abnormal Cavitation in Pine Trees Infected with Pine Wilt Disease
 Acoustic Emission Technique for the Detection of Abnormal Cavitation in Pine Trees Infected with Pine Wilt Disease Keiko Kuroda (Kansai Research Center, Forestry and Forest Products Research Institute,
Seasonal & Diurnal Temp Variations. Earth-Sun Distance. Eccentricity 2/2/2010. ATS351 Lecture 3
 Seasonal & Diurnal Temp Variations ATS351 Lecture 3 Earth-Sun Distance Change in distance has only a minimal effect on seasonal temperature. Note that during the N. hemisphere winter, we are CLOSER to
Worksheet: The Climate in Numbers and Graphs
 Worksheet: The Climate in Numbers and Graphs Purpose of this activity You will determine the climatic conditions of a city using a graphical tool called a climate chart. It represents the long-term climatic
Meteorology. Chapter 15 Worksheet 1
 Chapter 15 Worksheet 1 Meteorology Name: Circle the letter that corresponds to the correct answer 1) The Tropic of Cancer and the Arctic Circle are examples of locations determined by: a) measuring systems.
2015: A YEAR IN REVIEW F.S. ANSLOW
 2015: A YEAR IN REVIEW F.S. ANSLOW 1 INTRODUCTION Recently, three of the major centres for global climate monitoring determined with high confidence that 2015 was the warmest year on record, globally.
2011 National Seasonal Assessment Workshop for the Eastern, Southern, & Southwest Geographic Areas
 2011 National Seasonal Assessment Workshop for the Eastern, Southern, & Southwest Geographic Areas On January 11-13, 2011, wildland fire, weather, and climate met virtually for the ninth annual National
The continent of Antarctica Resource N1
 The continent of Antarctica Resource N1 Prepared by Gillian Bunting Mapping and Geographic Information Centre, British Antarctic Survey February 1999 Equal area projection map of the world Resource N2
Meteorological and climatic conditions of dynamics of the Anmangynda icing size
 148 Cold and Mountain Region Hydrological Systems Under Climate Change: Towards Improved Projections Proceedings of H2, IAHS-IAPSO-IASPEI Assembly, Gothenburg, Sweden, July 213 (IAHS Publ. 36, 213). Meteorological
TUNDRA. Column 1 biome name Column 2 biome description Column 3 examples of plant adaptations
 Biome Cards (pp. 1 of 7) Cut out each biome card and divide each card into three sections. Place all sections in a plastic storage bag. Have one bag for every two students. Column 1 biome name Column 2
Seasonal and Spatial Patterns of Rainfall Trends on the Canadian Prairie
 Seasonal and Spatial Patterns of Rainfall Trends on the Canadian Prairie H.W. Cutforth 1, O.O. Akinremi 2 and S.M. McGinn 3 1 SPARC, Box 1030, Swift Current, SK S9H 3X2 2 Department of Soil Science, University
JRC MARS Bulletin Crop monitoring in Europe January 2019
 Online version Issued: 21 January 2019 r JRC MARS Bulletin Vol. 27 No 1 JRC MARS Bulletin Crop monitoring in Europe January 2019 Continued mild winter Improved hardening of winter cereals in central and
National Meteorological Library and Archive
 National Meteorological Library and Archive Fact sheet No. 4 Climate of the United Kingdom Causes of the weather in the United Kingdom The United Kingdom lies in the latitude of predominately westerly
Weather Conditions during the 1992 Growing Season
 Weather Conditions during the 1992 Growing Season Item Type text; Article Authors Brown, P.; Russell, B. Publisher College of Agriculture, University of Arizona (Tucson, AZ) Journal Cotton: A College of
Introduction. Populus trichocarpa TORR. and GRAY. By M. G. R. CANNELL and S. C. WILLETT
 Shoot Growth Phenology, Dry Matter Distribution and Root: Shoot Ratios of Provenances of Populus trichocarpa, Picea sitchensis and Pinus contorta growing in Scotland By M. G. R. CANNELL and S. C. WILLETT
To Understand How Trees Decline and Die, We Must: What is Stress? Tree Physiology. Understand stress and how it affects trees. Why Do Trees Die?
 To Understand How Trees Decline and Die, We Must: Why Do Trees Die? Rex Bastian, Ph.D. The Davey Tree Expert Co./The Care of Trees Wheeling, IL Understand stress and how it affects trees» To do this, we
What is Climate? Understanding and predicting climatic changes are the basic goals of climatology.
 What is Climate? Understanding and predicting climatic changes are the basic goals of climatology. Climatology is the study of Earth s climate and the factors that affect past, present, and future climatic
Observed changes in climate and their effects
 1 1.1 Observations of climate change Since the TAR, progress in understanding how climate is changing in space and time has been gained through improvements and extensions of numerous datasets and data
POTENTIAL EVAPOTRANSPIRATION AND DRYNESS / DROUGHT PHENOMENA IN COVURLUI FIELD AND BRATEŞ FLOODPLAIN
 PRESENT ENVIRONMENT AND SUSTAINABLE DEVELOPMENT, VOL. 5, no.2, 2011 POTENTIAL EVAPOTRANSPIRATION AND DRYNESS / DROUGHT PHENOMENA IN COVURLUI FIELD AND BRATEŞ FLOODPLAIN Gigliola Elena Ureche (Dobrin) 1
Chapter Introduction. Earth. Change. Chapter Wrap-Up
 Chapter Introduction Lesson 1 Lesson 2 Lesson 3 Climates of Earth Chapter Wrap-Up Climate Cycles Recent Climate Change What is climate and how does it impact life on Earth? What do you think? Before you
ESS 431 Principles of Glaciology ESS 505 The Cryosphere
 MID-TERM November 9, 2015 ESS 431 Principles of Glaciology ESS 505 The Cryosphere Instructions: Please answer the following 5 questions. [The actual 5 questions will be selected from these 12 questions
Name of research institute or organization: Federal Office of Meteorology and Climatology MeteoSwiss
 Name of research institute or organization: Federal Office of Meteorology and Climatology MeteoSwiss Title of project: The weather in 2016 Report by: Stephan Bader, Climate Division MeteoSwiss English
1 What Is Climate? TAKE A LOOK 2. Explain Why do areas near the equator tend to have high temperatures?
 CHAPTER 17 1 What Is Climate? SECTION Climate BEFORE YOU READ After you read this section, you should be able to answer these questions: What is climate? What factors affect climate? How do climates differ
GLOBAL CLIMATES FOCUS
 which you will learn more about in Chapter 6. Refer to the climate map and chart on pages 28-29 as you read the rest of this chapter. FOCUS GLOBAL CLIMATES What are the major influences on climate? Where
A WEB-BASED MODEL FOR ESTIMATING WINTER SURVIVAL IN CEREALS
 A WEB-BASED MODEL FOR ESTIMATING WINTER SURVIVAL IN CEREALS D. B. Fowler 1 and K. Greer 2 1 Crop Development Centre, University of Saskatchewan, Saskatoon, SK S7N 5A8 2 Western Ag Innovations, Saskatoon,
THE CANADIAN CENTRE FOR CLIMATE MODELLING AND ANALYSIS
 THE CANADIAN CENTRE FOR CLIMATE MODELLING AND ANALYSIS As Canada s climate changes, and weather patterns shift, Canadian climate models provide guidance in an uncertain future. CANADA S CLIMATE IS CHANGING
2011 Year in Review TORNADOES
 2011 Year in Review The year 2011 had weather events that will be remembered for a long time. Two significant tornado outbreaks in April, widespread damage and power outages from Hurricane Irene in August
The elevations on the interior plateau generally vary between 300 and 650 meters with
 11 2. HYDROLOGICAL SETTING 2.1 Physical Features and Relief Labrador is bounded in the east by the Labrador Sea (Atlantic Ocean), in the west by the watershed divide, and in the south, for the most part,
but 2012 was dry Most farmers pulled in a crop
 After a winter that wasn t, conditions late in the year pointed to a return to normal snow and cold conditions Most farmers pulled in a crop but 2012 was dry b y M i k e Wr o b l e w s k i, w e a t h e
Define Ecology. study of the interactions that take place among organisms and their environment
 Ecology Define Ecology Define Ecology study of the interactions that take place among organisms and their environment Describe each of the following terms: Biosphere Biotic Abiotic Describe each of the
Globes, Maps, and Atlases. Plus, A Whole Bunch of Other Way Cool Geographic Information!!!
 Globes, Maps, and Atlases Plus, A Whole Bunch of Other Way Cool Geographic Information!!! Globes Are the Most Accurate Portrayal of the Earth The earth is about 24,900 miles in circumference, and about
Climate Change Adaptation
 Climate Change Adaptation Adriána Hudecz, Technical University of Denmark ROADEX Final Seminar Inverness, 22 May 2012 Climate Change Adaptation Outline: 1. Background/global climate change 2. Climate change
ATMOSPHERIC ENERGY and GLOBAL TEMPERATURES. Physical Geography (Geog. 300) Prof. Hugh Howard American River College
 Prof. Hugh Howard American River College") ATMOSPHERIC ENERGY and GLOBAL TEMPERATURES Physical Geography (Geog. 300) Prof. Hugh Howard American River College RADIATION FROM the SUN SOLAR RADIATION Primarily shortwave (UV-SIR) Insolation Incoming
ATMOSPHERIC ENERGY and GLOBAL TEMPERATURES Physical Geography (Geog. 300) Prof. Hugh Howard American River College RADIATION FROM the SUN SOLAR RADIATION Primarily shortwave (UV-SIR) Insolation Incoming
How does the physical environment influence communities and ecosystems? Hoodoos in Cappadocia, Turkey
 Biomes of the World How does the physical environment influence communities and ecosystems? Hoodoos in Cappadocia, Turkey ecosystems are shaped by: abiotic factors climate/weather space Rainfall Soil air
Extremes of Weather and the Latest Climate Change Science. Prof. Richard Allan, Department of Meteorology University of Reading
 Extremes of Weather and the Latest Climate Change Science Prof. Richard Allan, Department of Meteorology University of Reading Extreme weather climate change Recent extreme weather focusses debate on climate
What is the IPCC? Intergovernmental Panel on Climate Change
 IPCC WG1 FAQ What is the IPCC? Intergovernmental Panel on Climate Change The IPCC is a scientific intergovernmental body set up by the World Meteorological Organization (WMO) and by the United Nations
CLIMATE. UNIT TWO March 2019
 CLIMATE UNIT TWO March 2019 OUTCOME 9.2.1Demonstrate an understanding of the basic features of Canada s landscape and climate. identify and locate major climatic regions of Canada explain the characteristics
1 What Is Climate? TAKE A LOOK 2. Explain Why do areas near the equator tend to have high temperatures?
 CHAPTER 17 1 What Is Climate? SECTION Climate BEFORE YOU READ After you read this section, you should be able to answer these questions: What is climate? What factors affect climate? How do climates differ
Unit D: Controlling Pests and Diseases in the Orchard. Lesson 5: Identify and Control Diseases in the Orchard
 Unit D: Controlling Pests and Diseases in the Orchard Lesson 5: Identify and Control Diseases in the Orchard 1 Terms Abiotic disease Bacteria Biotic diseases Cultural disease control Disease avoidance
It is never so good as expected and never so bad as feared.
 2018 General: The weather conditions in the Baltics and Scandinavia have not been perfect - not enough rain and high temperatures after drilling. As Scandinavia and Baltics was the area where there was
WSU and UI Master Gardeners March 1, 2016 Philip Shinn
 WSU and UI Master Gardeners March 1, 2016 Philip Shinn What is a Woody Plant? Tree Biology CODIT Planting & Pruning Tree Triage C 9 H 10 O 2 Strengthens cell walls in Xylem Sequesters carbon 30% of
A SURVEY OF HYDROCLIMATE, FLOODING, AND RUNOFF IN THE RED RIVER BASIN PRIOR TO 1870
 A SURVEY OF HYDROCLIMATE, FLOODING, AND RUNOFF IN THE RED RIVER BASIN PRIOR TO 1870 W. F. RANNIE (UNIVERSITY OF WINNIPEG) Prepared for the Geological Survey of Canada September, 1998 TABLE OF CONTENTS
How does the greenhouse effect maintain the biosphere s temperature range? What are Earth s three main climate zones?
 Section 4 1 The Role of Climate (pages 87 89) Key Concepts How does the greenhouse effect maintain the biosphere s temperature range? What are Earth s three main climate zones? What Is Climate? (page 87)
Satellites, Weather and Climate Module 40: Agriculture & forestry in a changing climate
 Satellites, Weather and Climate Module 40: Agriculture & forestry in a changing climate http://www.youtube.com/watch?v=ksnblyhrru8 http://1.bp.blogspot.com/-lemica8b_h4/ufln63qlxdi/aaaaaaaacym/xc3htckubeg/s1600/animated.gif
MODELLING FROST RISK IN APPLE TREE, IRAN. Mohammad Rahimi
 WMO Regional Seminar on strategic Capacity Development of National Meteorological and Hydrological Services in RA II (Opportunity and Challenges in 21th century) Tashkent, Uzbekistan, 3-4 December 2008
Lecture 19. A Sieve Plate with large Sieve Pores. Secondary Phloem. Secondary phloem (cont d)
") Lecture 19 Secondary phloem (cont d) Secondary Phloem in Tilia americana (American Basswood) Secondary Phloem of Tilia Stained with Toluidine Blue & viewed with Crossed Polarizers. Secondary Phloem A Sieve
Lecture 19 Secondary phloem (cont d) Secondary Phloem in Tilia americana (American Basswood) Secondary Phloem of Tilia Stained with Toluidine Blue & viewed with Crossed Polarizers. Secondary Phloem A Sieve
JRC MARS Bulletin Crop monitoring in Europe. December 2017 Hardening of winter cereals is delayed
 MARS Bulletin Vol. 25 No 12 18 December 2017 1 JRC MARS Bulletin Vol. 25 No 12 Period covered: 1 November-12 December Issued: 18 December 2017 JRC MARS Bulletin Crop monitoring in Europe December 2017
THE INVESTIGATION OF SNOWMELT PATTERNS IN AN ARCTIC UPLAND USING SAR IMAGERY
 THE INVESTIGATION OF SNOWMELT PATTERNS IN AN ARCTIC UPLAND USING SAR IMAGERY Johansson, M., Brown, I.A. and Lundén, B. Department of Physical Geography, Stockholm University, S-106 91 Stockholm, Sweden
Free. Daily Reading Practice Review Common Core in a Few Minutes Each Day. This is a great way to review Common Core Skills. Literacy and Math Ideas
 Free Literacy and Math Ideas This is a great way to review Common Core Skills Daily Reading Practice Review Common Core in a Few Minutes Each Day Visit Literacy and Math Ideas for Additional Weeks of Daily
The Northern Hemisphere Sea ice Trends: Regional Features and the Late 1990s Change. Renguang Wu
 The Northern Hemisphere Sea ice Trends: Regional Features and the Late 1990s Change Renguang Wu Institute of Atmospheric Physics, Chinese Academy of Sciences, Beijing World Conference on Climate Change
Summary and Conclusions
 241 Chapter 10 Summary and Conclusions Kerala is situated in the southern tip of India between 8 15 N and 12 50 N latitude and 74 50 E and 77 30 E longitude. It is popularly known as Gods own country.
Tree Architecture and Growth
 Tree Architecture and Growth Conceptually, a tree is a tower supporting many small solar collectors. The objective is to get lots of solar collectors (leaves) in the air with the least cost in photosynthate
PERENNATION IN CUSCUTA REFLEXA ROXB.
 [474] PERENNATION IN CUSCUTA REFLEXA ROXB. BY L. NARAYANA RAO Central College, University of Mysore, Bangalore (With I figure in the text) INTRODUCTION uscuta is a common parasite in several parts of India.
CLIMATE READY BOSTON. Climate Projections Consensus ADAPTED FROM THE BOSTON RESEARCH ADVISORY GROUP REPORT MAY 2016
 CLIMATE READY BOSTON Sasaki Steering Committee Meeting, March 28 nd, 2016 Climate Projections Consensus ADAPTED FROM THE BOSTON RESEARCH ADVISORY GROUP REPORT MAY 2016 WHAT S IN STORE FOR BOSTON S CLIMATE?
ISSUED BY KENDRIYA VIDYALAYA - DOWNLOADED FROM
 CHAPTER -11 WATER IN THE ATMOSPHERE This chapter deals with Humidity, types of humidity, relative humidity, absolute humidity, specific humidity, dew point, condensation, saturated air, types of precipitation
It is one of the most serious oak diseases in the United States, killing thousands of trees each year.
 1 Oak Wilt is the disease caused by the pathogenic non-native fungus Ceratocystis fagacearum that affects oaks. Oaks in the red oak group (those with sharply pointed tips- like pin oak and red oak) are
OBSERVATIONS OF PERMAFROST-LANDSCAPE DYNAMICS RELATED TO ANTHROPOGENIC DISTURBANCES, YUKECHI STUDY SITE, CENTRAL YAKUTIA
 OBSERVATIONS OF PERMAFROST-LANDSCAPE DYNAMICS RELATED TO ANTHROPOGENIC DISTURBANCES, YUKECHI STUDY SITE, CENTRAL YAKUTIA A.N. Fedorov, P.Ya. Konstantinov, I.S. Vassiliev, N.P. Bosikov, Ya.I. Torgovkin,
November 2018 Weather Summary West Central Research and Outreach Center Morris, MN
 November 2018 Weather Summary Lower than normal temperatures occurred for the second month. The mean temperature for November was 22.7 F, which is 7.2 F below the average of 29.9 F (1886-2017). This November
Operational MRCC Tools Useful and Usable by the National Weather Service
 Operational MRCC Tools Useful and Usable by the National Weather Service Vegetation Impact Program (VIP): Frost / Freeze Project Beth Hall Accumulated Winter Season Severity Index (AWSSI) Steve Hilberg
Use of Ultrasonic Wind sensors in Norway
 Use of Ultrasonic Wind sensors in Norway Hildegunn D. Nygaard and Mareile Wolff Norwegian Meteorological Institute, Observation Department P.O. Box 43 Blindern, NO 0313 OSLO, Norway Phone: +47 22 96 30