REGULATION OF AUXIN RECEPTOR GENE FAMILY BY HORMONAL AND ABIOTIC STRESS THESIS
|
|
|
- Mark Hutchinson
- 6 years ago
- Views:
Transcription
1 REGULATION OF AUXIN RECEPTOR GENE FAMILY BY HORMONAL AND ABIOTIC STRESS THESIS Presented to the Graduate Council of Texas State University-San Marcos in Partial Fulfillment of the Requirements for the Degree Master of SCIENCE by Thilanka Jayaweera, B.S. San Marcos, Texas December 2011
2 REGULATION OF AUXIN RECEPTOR GENE FAMILY BY HORMONAL AND ABIOTIC STRESS Committee Members Approved: Nihal Dharmasiri, Chair Dana García Sunethra Dharmasiri Dhiraj Vattem Approved: J. Michael Willoughby Dean of the Graduate College
3 COPYRIGHT By Thilanka Jayaweera 2011
4 FAIR USE AND AUTHOR S PERMISSION STATEMENT Fair Use This work is protected by the Copyright Laws of the United States (Public Law , section 107). Consistent with fair use as defined in the Copyright Laws, brief quotations from this material are allowed with proper acknowledgment. Use of this material for financial gain without the author s express written permission is not allowed. Duplication Permission As the copyright holder of this work I, Thilanka Jayaweera, authorize duplication of this work, in whole or in part, for educational or scholarly purposes only.
5 ACKNOWLEDGEMENTS My very special thanks go to my supervisor Dr. Nihal Dharmasiri for the valuable advice and guidance given throughout the project. I am also very grateful to Dr. Dana García, Dr. Sunethra Dharmasiri and Dr. Dhiraj Vattem for their support and advice as my committee members. I am thankful to Dr. Joseph Koke and Dr. Dana García for the use of the imaging facility and particularly to Dr. Koke for assistance with confocal imaging. I am grateful to Dr. Sunethra Dharmasiri for the assistance given for confocal imaging and also for the help and advice given throughout the research project. I highly appreciate Praveen Kumar s assistance with statistical analysis of the data. I gratefully thank my lab members Yuting Hou, Nirmala Karunarathna, Sherry Albers and Amarah Ulgani who have helped me immensely during this project. This work was supported by a Research Enhancement Program (REP) award to Drs. Nihal Dharmasiri and Sunethra Dharmasiri by Texas State University-San Marcos, the National Science Foundation s CAREER grant (IOS ) to Dr. Nihal Dharmasiri and DBI to Drs. Joseph R. Koke and Dana García. This manuscript was submitted on 05/11/2011. v
6 TABLE OF CONTENTS Page ACKNOWLEDGEMENTS... v LIST OF TABLES... vii LIST OF FIGURES... viii ABSTRACT... xii CHAPTER I. INTRODUCTION... 1 II.MATERIALS AND METHODS III.RESULTS IV.DISCUSSION REFERENCES vi
7 LIST OF TABLES Table Page 1. Summary of the expression patterns of auxin receptor genes in response to salinity stress Summary of the expression patterns of auxin receptor genes in response to osmotic stress Summary of the expression patterns of auxin receptor genes in response to ABA Summary of the expression patterns of auxin receptor genes in response to GA vii
8 LIST OF FIGURES Figure Page 1. Schematic diagram of possible pathways to regulate the abundance of TIR1/AFBs TIR1::GUS expression is modulated in response to salinity stress TIR1::TIR1-GUS expression in response to salinity stress TIR1::GUS expression in response to osmotic stress TIR1::TIR1-GUS expression in response to mannitol Expression of TIR1::GUS in response to ABA Expression of TIR1::TIR1-GUS in response to ABA Expression of TIR1::GUS in response to GA Expression of TIR1::TIR1-GUS in response to GA Expression of AFB1::GUS in response to salinity express Expression of AFB1::AFB1-GUS in response to salinity stress AFB1::GUS expression in response to osmotic stress AFB1::AFB1-GUS expression in response to osmotic stress Expression of AFB1::GUS in response to ABA Expression of AFB1::AFB-GUS in response to ABA Expression of AFB1::GUS in response to GA Expression of AFB1::AFB1-GUS in response to GA viii
9 4.1. AFB2::GUS expression in response to salinity stress AFB2::AFB2-GUS expression in response to salinity stress AFB2::GUS expression in response to osmotic stress AFB2::AFB2-GUS expression in response to osmotic stress Expression of AFB2::GUS in response to ABA Expression of AFB2::AFB2-GUS in response to ABA Expression of AFB2::GUS in response to GA Expression of AFB2::AFB2-GUS in response to GA AFB3::GUS expression in response to salinity stress AFB3::AFB3-GUS expression in response to salinity stress AFB3::GUS expression in response to osmotic stress AFB3::AFB3-GUS expression in response to osmotic stress Expression of AFB3::GUS in response to ABA Expression of AFB3::AFB3-GUS in response to ABA Expression of AFB3::GUS in response to GA Expression of AFB3::AFB3-GUS in response to GA RT-PCR analysis of F-box receptor genes in response to salinity stress RT-PCR analysis of F-box receptor genes in response to osmotic stress RT-PCR analysis of F-box receptor genes in response to ABA RT-PCR analysis of auxin receptor F-box genes in response to GA Expression of mir393a::gfp in response to salinity stress Expression of mir393a::gfp in response to osmotic stress Expression of mir393a::gfp in response to ABA ix
10 7.4. Expression of mir393a::gfp in response to GA Expression of mir393b::gfp in response to salinity stress Expression of mir393b::gfp in response to osmotic stress Expression of mir393b::gfp in response to ABA Expression of mir393b::gfp in response to GA Mutants of auxin receptor family grown on ATS (control) media (a) Mutants of auxin receptor family grown on ATS media containing 160 mm NaCl (b) Percentage of seedlings with green cotyledons consequent to salinity stress (a) Mutants of auxin receptor family grown on ATS media containing 370 mm mannitol (b) Percentage of seedlings with green cotyledons in response to osmotic stress (a) Mutants of auxin receptor family grown on ATS media containing 0.5 µm ABA (b) Percentage of seedlings with green cotyledons in response to ABA (a) Mutants of auxin receptor family grown on ATS media containing 70 µm GA (b) Percentage of seedlings with green cotyledons in response to GA Recovery of tir1-1 phenotype in response to salinity, osmotic stress, ABA and GA by over-expression of TIR Recovery of afb1-1 phenotype in response to ABA, GA, salinity and osmotic stress by over-expression of AFB Putative cis-regulatory elements found in auxin receptor family genes ABA fails to induce TIR1 mabre ::GUS expression A schematic diagram to illustrate possible regulation of TIR1/AFBs in x
11 response to salinity, osmotic stress, ABA and GA xi
12 ABSTRACT REGULATION OF AUXIN RECEPTOR GENE FAMILY BY HORMONAL AND ABIOTIC STRESS by Thilanka Jayaweera, B.S. Texas State University-San Marcos December 2011 SUPERVISING PROFESSOR: NIHAL DHARMASIRI The plant hormone auxin controls growth and development by regulating the expression of many auxin responsive genes. TIR1/AFBs, a family of F-Box proteins act as receptors for auxin. In response to auxin, a group of transcriptional repressor proteins known as Aux/IAAs are degraded through the ubiquitin-proteasome pathway involving SCF TIR1/AFBs. According to recent studies, adaptive response to abiotic and biotic stresses is partly achieved through auxin signaling. It is also known that plant responses to salinity and osmotic stresses are partly controlled through abscisic acid (ABA) signaling, and ABA synthesis is enhanced in response to stress. Auxin signaling is also modulated xii
13 by ABA. Therefore, I sought to determine the effect of salinity and osmotic stress on the expression of auxin receptor F-Box genes. Furthermore, I examined the effect of ABA on auxin receptor gene expression. Finally, since gibberellic acid (GA) antagonizes ABA, I tested GA effects on auxin receptor genes. Our data indicate that TIR1 expression is upregulated in response to mild salinity, osmotic stresses, ABA and GA. Even though TIR1/AFBs are known to have similar functions, each of them is regulated differently by above conditions. The complex regulation of TIR1/AFBs may modulate the auxin response, and thereby adapt the plant to the changing environment. Molecular and physiological data support the hypothesis that modulation of auxin response through the regulation of auxin receptor genes leads to changes in physiological responses that ultimately may help the plant to adjust to adverse environments. Better understanding of molecular mechanisms involved in plant auxin response during environmental stress will enable scientists to develop superior crop plants that can thrive under adverse conditions. Further, understanding plant hormone crosstalk will fill the gaps in plant hormone signaling network. xiii
14 CHAPTER I INTRODUCTION Plant growth and development is regulated by hormones and environmental factors. Arguably the major growth hormone, auxin was discovered many decades ago. Since then many other hormones such as abscisic acid (ABA), brassinosteroid, cytokinin, ethylene, gibberellins (GA), jasmonic acid, salicylic acid, and very recently strigolactone have been discovered (Chapman et al., 2009). Indole-3-acetic acid (IAA), the major natural auxin, controls many aspects of growth and development such as embryogenesis, apical dominance, flower development, lateral root initiation, phototropism, and gravitropism (Prasad et al., 1993, Marchant et al., 1999, Casimiro at el., 2001, Cheng & Zhao., 2007). Auxin stimulates the transcription of primary auxin responsive genes that fall in to three classes, Aux/IAA, GH3 and SAUR (small auxin up RNA). The Aux/IAA proteins act as transcriptional repressors by binding to transcription factors called auxin response factors (ARF). There are 29 Aux/IAA genes and 23 ARFs in the Arabidopsis genome (Chapman et al., 2009). The transport inhibitor response 1 (TIR1) and Aux/IAA proteins act as co-receptors for auxin (Tan et al., 2007). TIR1 is an F-box protein that 1
15 2 belongs to a family of F-box proteins known as auxin signaling F-box proteins (AFBs). Three other F-Box proteins (AFB1, 2 and 3) in this family have also been found to function as co-receptors for auxins (Dharmasiri et al., 2005a). These F-box family proteins contain leucine rich repeats (LRR) that are involved in interacting with auxin and Aux/IAA proteins (Dharmasiri et al., 2005b). It has been shown that the bottom of a single top surface pocket in the TIR1-LRR domain binds with auxin. Aux/IAA proteins are docked to the upper part of the surface pocket immediately above the auxin binding site and completely cover the auxin molecule. Auxin acts as a molecular glue to attach Aux/IAA to the TIR1/AFBs (Tan et al., 2007). TIR1/AFB F-box proteins are part of a protein complex called E3 ubiquitin ligases that contain three other proteins called Skp1, Cullin1 and Rbx1, and are thus known as SCF complex. After binding to SCF TIR1/AFB complex in the presence of auxin, Aux/IAA undergoes ubiquitination and subsequent degradation via 26S proteasome pathway (Gray et al., 2001). Release of repression due to Aux/IAA degradation leads to the activation of gene transcription by ARFs (Dharmasiri et al., 2004). There are about 700 genes that possibly encode F-box proteins in the Arabidopsis genome. Phylogenetic analysis reveals that they can be divided into 5 families and 20 sub-families, suggesting their vast diversity. Auxin receptor genes belong to the C3 subfamily. All of these F-box proteins contain a conserved F-box domain with 60 amino acids that interacts with Skp1 of the SCF complex (Gagne et al., 2002). TIR1, AFB1, AFB2 and AFB3 genes express in overlapping regions of Arabidopsis seedlings and act in a redundant manner (Dharmasiri et al., 2005b, Parry et al., 2009). The stepwise introduction of the four mutant F-box auxin receptor genes causes progressive decrease in
16 3 Arabidopsis auxin response with increasingly severe defects in development (Dharmasiri et al., 2005b). Due to sequence similarity, expression pattern and activity, TIR1 and AFB1 are considered paralogs. AFB2 and AFB3 are closely related to each other but distantly related to TIR1 and AFB1 (Dharmasiri et al., 2005b). However, according to Parry et al., (2009) TIR1 makes the major contribution to auxin signaling in roots, followed by AFB2. The contribution of AFB1 and AFB3 is evident only in higher order mutants, suggesting their minor contribution to the auxin response. Neither AFB1 nor AFB2 rescue the tir1-1 auxin resistant phenotype, suggesting the distinct nature of these proteins in spite of their similarity (Parry et al., 2009). Expression levels of auxin receptor F-box genes are known to be regulated by micrornas (Sunkar et al., 2004, Navarro et al., 2006, Vidal et al., 2009, Ammour et al., 2011). MicroRNAs (mirnas) are a class of small, non-coding, single stranded RNA molecules approximately nucleotides in length. They are well characterized for the down-regulation of gene expression either by degradation of mrnas or repressing translation (reviewed by Lin et al., 2009). mir393 has been identified as a stress inducible mirna that targets F-box auxin receptor genes. It is derived from either mir393a or mir393b genes. mir393 is induced by cold, dehydration, salinity, ABA (Sunkar et al., 2004) and microbes (Navarro et al., 2006). Bacterially derived flagellin 22 induces expression of mir393 from the mir393a gene. mir393 modulates expression of all the known auxin receptor genes, except for AFB1 (Navarro et al., 2006). According to Vidal et al., (2009) nitrate induces mir393 in roots, effecting down-regulation of AFB3 without affecting the other auxin receptors. Interestingly, a recent study by Ammour et al., (2011) showed that in developing leaves expression of all four auxin receptor genes is
17 4 down-regulated by mir393 derived mainly from mir393b. Additionally, there is evidence for the generation of small interfering RNAs (sirnas) mainly from the transcripts of AFB2 and AFB3 with the aid of mir393. These sirnas are proposed to regulate auxin receptor F-box genes as well as downstream auxin responsive genes (Ammour et al., 2011). Therefore, the regulation of the expression of F-box auxin receptor genes by mir393 involves a complex mechanism in which the origin of mir393 and the auxin receptor transcripts it targets are regulated by environmental cues. Plants have an enormous plasticity for adaptation to environmental challenges. In this process plant hormone ABA plays a major role in adapting the plants to such environments (Rohde et al., 2000). Drought, high salinity, low temperature and pathogen attacks increase the level of ABA synthesis, leading to changes in gene expression and subsequent physiological changes in plants (Dallaire et al., 1993). ABA is involved not only in stress responses but also in regulating leaf size, inter-node length, seed dormancy, bud dormancy, embryo and seed development, and reproduction (Rock et al., 2000). The recent discovery of RCAR/PYR1/PYL as ABA receptors has given more insight into ABA signaling pathways in plants (Hao et al., 2010). The promoter regions of ABA responsive genes contain conserved cis-regulatory sequences (c/tacgtggc) called ABA responsive elements (ABREs). The ABA specific transcription factors known as ABA responsive element binding factors (ABFs) or ABA responsive element binding proteins (AREBs) bind to ABREs and regulate ABA dependent gene transcription. ACGT residues of ABREs act as the core motif for the binding of ABFs (Hattory et al., 2002). ABFs (or AREBs) are a sub-family of bzip transcription factors (Raghavendra et al., 2010). The major transcription factors in this sub-family such as
18 5 ABF1, ABF2, ABF4 and ABI5 are phosphorylated prior to activating transcription (Fujii et al., 2009). SnRKs (Sucrose non-fermenting related kinases) and OST1 (Open stomata 1) are kinases that are responsible for phosphorylating these ABFs (Sirichandra et al., 2010). In the absence of ABA, these kinases are dephosphorylated by type 2C protein phosphatases (PP2Cs), blocking transcription. Binding of ABA to RCAR/PYR1/PYL deactivates PP2Cs, thereby enhancing the phosphorylation of transcription factors (ABFs) and the transcription of ABA responsive genes (Raghavendra et al., 2010). Additionally, there are other kinases such as calcium dependent protein kinases (CDPKs) that are capable of phosphorylating ABA specific transcription factors (Zhu et al., 2007). In addition to ABFs, other transcription factors such as MYC and MYB are also involved in ABA induced gene transcription (Abe et al., 2003). Gibberellin (GA) is another phytohormone that controls many aspects of plant development including seed germination, leaf expansion, stem elongation, flowering, and seed development (Gubler et al., 2004). The synthesis of active form of GAs that are tetracyclic diterpenoids such as GA 1, GA 4 and GA 5 from geranylgeranyl diphosphate has been studied in depth (Ogava et al., 2003). GA receptor gibberellin insensitive dwarf 1 (GID1), a soluble protein localized to both cytoplasm and nucleus, perceives the GA signal (Sun., 2010). A group of proteins called DELLA proteins act as transcriptional repressors of GA responsive genes. There are five DELLA proteins in Arabidopsis known as GAI, RGA, RGL1, RGL2, and RGL3 (Olszewski et al., 2002). Interaction between GID1 and DELLA proteins is enhanced by the binding of GA to GID1, resulting in rapid degradation of DELLAs via the ubiquitin proteasome pathway (Sasaki et al., 2003). A specific ubiquitin E3 ligase complex (SCF SLY1/GID2 ) is required to recruit
19 6 DELLA proteins for polyubiquitination and subsequent degradation by the 26S proteasome (reviewed by Sun, 2010). Transcription of GA responsive genes is also regulated by binding of transcription factors to regulatory elements. The Myb family of transcription factors is known to interact with GA response complex (Gubler et al., 1992). In this case, the core GARE (gibberellic acid responsive element) sequence TAACAAA acts along with other elements such as pyrimidine box (C/TCTTTT), TATCCAC box and CAACTC box to form a GA response complex (Rogers et al., 1992) to regulate GA dependent transcription. A number of physiological studies have indicated that significant crosstalk exists among plant hormones such as auxin, ABA, GA, cytokinin and ethylene (Gazzarrini et al., 2003). It is known that auxin and GA can affect each other s biosynthesis in a positive manner (Ogawa et al., 2003). Polar auxin transport is important for DELLA mediated GA responses (Kanyuka et al., 2003). GA and ABA show antagonistic effects on seed germination (Piskurewicz et al., 2008). GA enhances the proteasome-mediated destruction of a key DELLA factor that represses germination, thereby promoting the seed germination. Conversely, ABA blocks germination by inducing a transcription factor that represses germination (Ogawa et al., 2003). Further, negative regulation of auxin response factor 10 (ARF10) by mir160 plays a critical role in seed germination and post-embryonic development through auxin-aba crosstalk (Liu et al., 2007). Interestingly, many GA-regulated genes contain both GA- and ABA-responsive promoter elements, suggesting fine tuning of the transcription of these genes by both hormones (Busk et al., 1998). ABA modulates auxin response under different environmental conditions. Especially, it affects auxin biosynthesis and transport. For example, in
20 7 response to salinity stress ABA level is enhanced altering the expression of auxin transporter genes (Yu et al., 2010). Additionally, ABA induces expression of mir393 (Sunker et al., 2004) which targets auxin receptor family transcripts for degradation. Environmental cues such as salinity and osmotic stress affect plant hormone signaling pathways including auxin and ABA signaling. Salt and osmotic stresses are a major concern in agriculture. These environmental stresses cause serious damages to crop plants, thereby causing staggering economic loses (Zhu et al., 2001). These stress conditions affect many processes in plants such as ion and osmotic homeostasis, cell division and expansion, and regulation of detoxification mechanisms (Zhu., 2002). Therefore, many signaling pathways are activated during stress in order to overcome these challenges. Accumulation of ABA in response to osmotic stress as a result of both enhancement of ABA synthesis and inhibition of ABA degradation has been demonstrated (Koornneef et al., 1998). There are ABA dependent and ABA independent pathways involved in osmotic stress tolerance (Shinozaki et al., 1997). During ABA dependent osmotic stress response, transcription factors such as ABFs/AREBs, MYCs and MYBs bind to cis-regulatory elements of target genes and induce transcription (Huang et al., 2011). Genes that are induced by osmotic stress, but independent of ABA signaling, contain cis-regulatory elements called dehydration responsive elements (DRE) (Shinozaki et al., 1994). A family of proteins called DRE binding (DREB) proteins interacts with DREs and regulates transcription of osmotic stress induced genes (Nakashima et al., 1999). The salt overly sensitive (SOS) pathway is a prominent signaling pathway involved in ion homeostasis during salinity stress. Salinity stress also induces ABA
21 8 synthesis and ABA signaling in plants independent of osmotic effects (Wang et al., 2001, Guo et al., 2011). Normal auxin distribution in the root is affected by salinity stress, resulting in altered lateral root development (Sun et al., 2008). The auxin signaling cascade is also affected by salinity. Different F-box receptor genes are regulated differently under salinity stress, suggesting that auxin signaling is modulated in response to salinity stress (Iglesias et al., 2010). According to Wang et al., (2009) salinity alters auxin distribution in roots and thereby abolishes lateral root initiation, and promotes lateral root elongation. Therefore, it is likely that the outcome of adapted response to salinity and osmotic stress is a combined effect of auxin, ABA as well as other signaling pathways. Although the modulation of auxin signaling by different environmental cues and other plant hormones has been known for some time, the underlying molecular mechanisms have not been elucidated. One way of regulating a signaling cascade is changing the abundance of proteins involved. Hence, hypothesizing that changes in the abundance of auxin receptor family proteins consequent to regulating transcription, translation or protein stability may affect downstream signaling pathways, I focused on the regulation of the auxin receptor F-box gene family in response to salinity stress, osmotic stress, abscisic acid and gibberellic acid. To understand gene expression, transcriptional as well as translational gene constructs fused to the reporter gene β- glucuronidase (GUS) were used. In order to confirm the reporter gene expression data, RT-PCR and physiological assays were carried out. To check the mir393 expression, transcriptional gene constructs fused to reporter gene green fluorescent protein (GFP) were used. Bioinformatics data suggested the presence of putative cis-regulatory


22 9 elements associated with stress and hormonal responses in auxin receptor genes. The function of one such putative cis-regulatory element, ABRE in auxin signaling was studied by site directed mutagenesis. Figure 1. Schematic diagram of possible pathways to regulate the abundance of TIR1/AFBs. Expression of auxin receptor F-box genes may be directly regulated by environmental factors such as salinity and osmotic stress as well as ABA and GA. The above conditions may also modulate mir393 expression, in turn regulating auxin receptor gene expression. The abundance of TIR1/AFBs may ultimately affect plant growth and development through auxin signaling pathway.
23 CHAPTER II MATERIALS AND METHODS Plant varieties and growth conditions Arabidopsis thaliana (L.) Heynh. Var. Columbia (Col-0) and Wassilewskija seeds obtained from the Arabidopsis Biological Resource Center, Ohio State University, were used as wild type in all experiments performed. TIR1::GUS, TIR1::TIR1-GUS, AFB1::GUS, AFB1::AFB1-GUS, AFB2::GUS, AFB2::AFB2-GUS, AFB3::GUS, AFB3::AFB3-GUS reporter lines, tir1-1, tir1-9, afb1-1, afb2-1, afb3-1, afb2-1/afb3-1, afb1-1/afb3-1, tir1-1/afb1-1, tir1-1/afb2-5, tir1-1/afb5-6, afb1-3/afb2-5, tir1-1/afb2-5/afb3-4, afb1-1/afb2-1/afb3-1, and quadruple mutant lines, as well as GVG::TIR1-Myc and 35S::AFB1-Myc over expression lines were provided by Dr. Mark Estelle. mir393a::gfp and mir393b::gfp seeds were provided by Dr. Lionel Navarro. Seeds were surface sterilized with 40% bleach with 0.1% TritonX-100 and thoroughly rinsed with sterile distilled water. Seeds were plated on either Arabidopsis thaliana medium with 1% sucrose (ATS), ph 5.6 (Lincoln et al., 1990), or where specified on 0.5X Murashige and Skoog medium (MS; Murashige and Skoog, 1962; Sigma) with 1% sucrose, ph 5.6. The plates were incubated at 4 o C for 24 hours and then transferred to a growth chamber at 22 o C with continuous illumination (Dharmasiri et al., 2003). All experiments on sterile medium were performed in the same growth chamber. 10
24 11 Treatments for reporter gene expression To test the effect of NaCl and mannitol on expression of auxin receptor family genes, seedlings carrying transcriptional and translational GUS reporter constructs were used. Seedlings were grown as mentioned above for four days. They were transferred to ATS liquid media containing mm NaCl or mannitol, µm ABA or µm GA. Seedlings were incubated for 18 hrs following treatment under continuous light and gentle agitation. All the treatments were carried out in 24 well microtiter plates. Histochemical staining Histochemical staining of seedlings for GUS assays was carried out according to Jefferson et al. (1987). Briefly, treated seedlings were washed with distilled water and fixed using GUS fixer (0.3 M mannitol, 10 mm 4-morpholineethanesulfonic acid (MES), 0.3% formaldehyde) for 40 minutes with gentle shaking. They were washed three times, five minutes each with 100 mm phosphate buffer (ph 7.0). Fixed seedlings were incubated with GUS staining buffer (0.1 M 5-bromo-4-chloro-3-indoxyl-beta-Dglucuronide cyclohexylammonium, 100 mm phosphate buffer, ph 7.0, 10 mm EDTA, 0.1% Triton X-100, 1 mm potassium ferricyanide, 1 mm potassium ferrocyanide) until color developed after vacuum infiltration. Quantitative β-glucuronidase assay For quantitative β-glucuronidase assays seedlings were frozen in liquid nitrogen immediately after treatments. All the tissues were homogenized in GUS extraction buffer (100 mm phosphate buffer, ph 7.0, EDTA, 0.1% sodium lauryl sarcosine, 10 µm β- mercaptoethanol). Supernatant was collected after centrifugation at 10,000 X g for 10
25 12 minutes. Amount of total protein was quantified using Bradford assay (Bradford, 1976). Equal amounts (60-70 µg) of total protein from each treatment were incubated up to 1 hour in the assay buffer containing 4-methylumbelliferyl-β-D-glucuronide hydrate (4- MUG) in the extraction buffer. The reaction was stopped by adding 0.2 M sodium carbonate. Fluorescence was measured at a wavelength of 460 nm using a luminometer (Turner, Sunnyvale, CA, Model number ). All the experiments were carried out in triplicate. Germination assays Seeds were surface sterilized as described above and plated on ATS media containing NaCl, mannitol, ABA or GA. Plates were vernalized at 4 o C for 48 hours and transferred in to a growth chamber at 22 o C with continuous illumination. Seedlings were grown for 6 to 7 days. Number of total seedlings and the seedlings having green cotyledons were counted, and percentage of green cotyledons was calculated. All the experiments were repeated at least three times. RNA isolation and RT PCR Arabidopsis thaliana (L.) Heynh. Var. Columbia (Col-0) wild type seedlings were grown for 4 days in ATS media and then treated with NaCl, mannitol, ABA and GA for 18 hours as mentioned above. Seedlings were then frozen in liquid nitrogen and stored at -80 o C until further use. For RNA extraction, frozen tissues were ground in liquid nitrogen to a fine powder. Total RNA was extracted using TriReagent (Sigma, St.Louis, MO) according to the manufacturer s instructions. RNase-free DNase was used to remove any
26 13 contaminating DNA from the extract. cdna was synthesized using total RNA and Superscript reverse transcriptase (Invitrogen, Carlsbad, CA) following the manufacturer s instructions. The amount of RNA in each preparation was standardized by the PCR amplification of ubiquitin cdna and quantification of band intensity using ImageJ software. cdna solutions that contained the same amount of RNA were used for the PCR amplification of auxin receptor genes. Identification of regulatory sequences The promoter sequences of auxin receptor gene family were analyzed using the following bioinformatics software, ATHAMAP (Institute of Genetics at the Technical University of Braunschweig, Germany), ATHENA (Washington State University, Washington), PROMOTER (Center for the Analysis of Genome Evolution and Function, University of Toronto, Canada), AGRIS (Arabidopsis Gene Regulatory Information Server, Ohio State University, Ohio). Putative abscisic acid response elements (ABRE) and GA-responsive elements (GARE) were identified depending on the threshold e-value and the consensus sequence. Analysis of ABRE in TIR1 promoter The putative ABRE sequence is located 141 bp up-stream of the putative transcription starting point of the TIR1 gene (Bülow et al., 2010). In order to generate TIR1 mabre ::GUS recombinant construct containing mutated ABRE sequence, a 2 kb fragment from the promoter region of TIR1 was amplified using TIR1p Sal1 F 5 CACCGTCGACGAGTA CGAAACCCGAGACTAGG 3 and TIR1p EcoR1 R 5
27 14 AAAGAATTCCCTCGAGATC TCGATGATCG 3 primers. Amplified product was cloned into pentr vector (Invitrogen, Carlsbad, CA) according to the manufacturer s instructions. The G nucleotide in the 5th position of the putative ABRE sequence was changed into C using site directed mutagenesis kit (Clontech, Mountain View, CA) following the manufacturer s instructions. The following primers were used for the mutagenesis, TIR1 m F 5 GCTTATAAGACACGTCTCATCATCAGAATCG 3 and TIR1 m R 5 CGATTCTGATGATGAGACGTGTCTTATAAGC 3. Accuracy of wild type and mutated sequences were verified by sequencing, and sequences were cloned into destination vector phgwf-s7 using LR clonase reaction kit (Invitrogen, Carlsbad, CA) according to the manufacturer s instructions. These constructs were transformed into wild type Arabidopsis plants by using Agrobacterium-mediated transformation (Oono et al., 1998; Augustus et al., 2003). The T1 seeds were screened on hygromycin-containing medium, and hygromycin resistant seedlings were transferred to soil. T3 seeds that are homozygous for the transgene were selected for further experiments. Analysis of GARE in TIR1 promoter Two putative GAREs are present 449 bp (GARE1) and 734 bp (GARE2) upstream of transcription start site of TIR1 gene (Bülow et al., 2010). Putative GARE1 and GARE2 in wild type promoter were mutated as described above using following primers, TIR1 P GARE1 F 5 GCTT CTTTTTTTATTGTTTTTTTACCGTCAGATC 3, TIR1 P GARE1 R 5 GATCTGACGGTAAAAAAACAATAAAAAAAGAAGC 3, TIR1 P GARE2 F 5 CGAAAACACTGATTCTTTTTATGTTAATTCATC 3, TIR1 P GARE2 R 5 GATGAATTAACATAAAAAGAATCAGTGTTTTCG 3. Constructs were then
28 15 cloned into phgwf-s7 destination vector as described above. All the constructs were sequenced to confirm the presence of mutations. Wild type (Col-0) plants were transformed with these constructs as described above. Image Acquisition For confocal microscopy, images of roots carrying mir393a::gfp and mir393b::gfp were acquired using an Olympus FV1000 confocal microscope and analyzed using Olympus Fluoview software (Olympus, Melville, NY). Gain and dynamic range settings were calibrated on control GFP expressing roots and then kept unchanged for recording of images of the roots with various treatments. For light microscopy, images of GUS stained seedlings were photographed using Nikon SMZ1500 stereo microscope (Nikon, Melville, NY). Data analysis For statistical comparison of quantitative β-glucuronidase assay data, single factor ANOVA was done using R software (version , The R Foundation for Statistical Computing, ISBN
29 CHAPTER III RESULTS TIR1 expression is regulated by salinity stress To study the effect of salinity stress on the expression of TIR1 gene, transgenic Arabidopsis lines carrying either transcriptional (TIR1::GUS) or translational (TIR1::TIR1-GUS) gene constructs were treated with various concentrations of NaCl ranging from 0 to 300 mm. Salinity induces GUS reporter gene expression (Figure 2.1 a,b,c), suggesting that TIR1 transcription is induced by salinity. However TIR1::GUS expression in roots and shoots shows some differences. At very high NaCl concentration (300 mm) the expression of TIR1::GUS is down-regulated in roots, but the same concentration up-regulates its expression in shoots. The expression of TIR1::TIR1-GUS was generally less compared to the TIR1::GUS expression. TIR1::TIR1-GUS is also induced by NaCl up to 200 mm concentration and down-regulated thereafter (Figure 2.2 a,b). Unlike the transcriptional construct, TIR1::TIR1-GUS is down-regulated in the shoot at the highest NaCl concentration tested (300 mm). 16
 Roots of four day old TIR1::GUS transgenic seedlings were treated with various concentrations of NaCl.")

30 17 Figure 2.1. TIR1::GUS expression is modulated in response to salinity stress. (a) Roots of four day old TIR1::GUS transgenic seedlings were treated with various concentrations of NaCl. Seedlings were fixed after the NaCl treatment and stained for GUS activity. (b) Quantitative analysis of GUS activity. Whole seedlings were used for measuring GUS activity using MUG assay. Each point indicates the mean value of 3 replicates. Error bars indicate standard deviation of the mean. Stars indicate that the means differ significantly from the control (p < 0.05 * ; p< 0.01 ** ; p< *** ). (c) TIR1::GUS expression of shoots of four day old seedlings treated with indicated concentrations of NaCl.
31 18 Figure 2.2. TIR1::TIR1-GUS expression in response to salinity stress. (a) The expression of TIR1::TIR1-GUS in four day old transgenic seedlings treated with NaCl and stained for GUS activity. (b) Quantitative analysis of TIR1::TIR1-GUS expression of shoots and roots in response to salinity stress. Roots and shoots of four day old transgenic seedlings carrying TIR1::TIR1-GUS were collected separately after NaCl treatments and the quantitative GUS assay was performed as described in methods. Each data point indicates the mean value of 3 replicates. Error bars indicate standard deviation from the mean. Stars indicate that the means differ significantly from the respective control (p < 0.05 * ; p< 0.01 ** ; p< *** ). TIR1 expression is regulated by osmotic stress As NaCl causes both salinity and osmotic stresses, similar experiments were carried out using mannitol which mainly causes osmotic stress. With respect to TIR1::GUS, mannitol did not have a significant effect on its expression (Figure 2.3.a,b). However, TIR1::TIR1-GUS expression was induced (Figure 2.4. a,b) with increasing
 Four day old transgenic seedlings were treated with various concentrations of mannitol and stained for GUS activity.")
32 19 concentrations of mannitol. Nevertheless, compared to mannitol, NaCl induced TIR1::TIR1-GUS expression to a higher level suggesting that the induction by NaCl is mainly due to salinity stress. Figure 2.3. TIR1::GUS expression in response to osmotic stress. (a) Four day old transgenic seedlings were treated with various concentrations of mannitol and stained for GUS activity. (b) Quantitative analysis of GUS activity. Whole seedling extracts were used in quantitative analysis using MUG assay. Each data point indicates the mean value of 3 replicates. Error bars indicate standard deviation from the mean. There is no significant difference between control and the treatments.
33 20 Figure 2.4. TIR1::TIR1-GUS expression in response to mannitol. (a) Four day old transgenic seedlings were treated with various concentrations of mannitol and stained for GUS activity. (b) Quantitative analysis of TIR1::TIR1-GUS expression of shoots and roots in response to mannitol. Roots and shoots of four day old transgenic seedlings carrying TIR1::TIR1-GUS were collected separately after mannitol treatments and quantitative GUS assay was performed. Each data point indicates the mean value of 3 replicates. Error bars indicate standard deviation from the mean. Stars indicate that the means differ significantly from the respective control (p < 0.05 * ; p< 0.01 ** ; p< *** ). ABA modulates the expression of TIR1 ABA is induced by salinity and osmotic stresses (Koornneef et al., 1998). Therefore, to study the effects of ABA on TIR1 expression similar experiments were carried out as described above. TIR1::GUS expression is significantly induced by ABA at low concentrations, but it is down-regulated at high concentrations (Figure 2.5.a,b). A
34 21 similar induction pattern can be seen in roots expressing TIR1::TIR1-GUS. However in shoots, TIR1::TIR1-GUS expression is down-regulated by exogenous ABA treatment (Figure 2.6.a,b). Figure 2.5. Expression of TIR1::GUS in response to ABA. (a) Four day old TIR1::GUS transgenic seedlings were treated with various concentrations of ABA and then stained for GUS activity. (b) Quantitative analysis of GUS activity. Whole seedlings were used to extract total protein for quantitative GUS assay. Each data point indicates the mean value of 3 replicates. Error bars indicate standard deviation from the mean. Stars indicate that the means differ significantly from the control (p < 0.05 * ; p< 0.01 ** ; p< *** ).
35 22 Figure 2.6. Expression of TIR1::TIR1-GUS in response to ABA. (a) Four day old TIR1::TIR1-GUS transgenic seedlings treated with various concentrations of ABA were stained for GUS activity. (b) Expression of TIR1::TIR1-GUS in shoots and roots in response to exogenous ABA treatments. Roots and shoots of four day old transgenic seedlings carrying TIR1::TIR1-GUS were collected separately after ABA treatments and used to perform the quantitative GUS assay. Each data point indicates the mean value of 3 replicates. Error bars indicate standard deviation from the mean. Stars indicate that the means differ significantly from the respective control (p < 0.05 * ; p< 0.01 ** ; p< *** ). Expression of TIR1 is regulated by GA Previous studies show that genes that are regulated by ABA can also be regulated by GA (Busk et al., 1998). As TIR1 expression is regulated by ABA, similar experiments were carried out to test whether the expression of TIR1 is controlled by GA. According to both TIR1::GUS (Figure 2.7a,b) and TIR1::TIR1-GUS expression data, (Figure 2.8a,b)
36 23 GA induces GUS expression in these transgenic lines, indicating that expression of TIR1 is also modulated by GA. Figure 2.7. Expression of TIR1::GUS in response to GA. (a) Four day old TIR1::GUS transgenic seedlings were treated with various concentrations of GA and stained for GUS activity. (b) Quantitative analysis of GUS activity. Whole seedlings were used to extract total protein for quantitative GUS assay. Each data point indicates the mean value of 3 replicates. Error bars indicate standard deviation from the mean. Stars indicate that the means differ significantly from the control (p < 0.05 * ; p< 0.01 ** ; p< *** ).
37 24 Figure 2.8. Expression of TIR1::TIR1-GUS in response to GA. (a) Four day old TIR1::TIR1-GUS transgenic seedlings were treated with GA and stained for GUS activity. (b) Expression of TIR1::TIR1-GUS in shoots and roots in response to GA. Roots and shoots of four-day old transgenic seedlings carrying TIR1::TIR1-GUS were collected separately after GA treatments and quantitative GUS assay was performed. Each data point indicates the mean value of 3 replicates. Error bars indicate standard deviation from the mean. Stars indicate that the means differ significantly from the respective control (p < 0.05 * ; p< 0.01 ** ; p< *** ). AFB1 expression is modulated by salinity stress AFB1, a gene closely related to TIR1, follows a similar expression pattern as TIR1 in response to salinity stress, although the maximal expression is seen at a lower NaCl concentration (Figure 3.1.a,b and Figure 3.2.a,b). However, unlike in TIR1, AFB1::AFB1-GUS expression is down-regulated in roots but up-regulated in shoots at low concentrations of salt (Figure 3.2.c), suggesting the complexity of its regulation.
38 25 Figure 3.1. Expression of AFB1::GUS in response to salinity express. (a) Four day old AFB1::GUS transgenic seedlings were treated with NaCl and stained for GUS activity. (b) Quantitative analysis of GUS activity. Whole seedlings were used to extract total protein for quantitative GUS assay. Each data point indicates the mean value of 3 replicates. Error bars indicate standard deviation from the mean. Stars indicate that the means differ significantly from the control (p< 0.05 * ; p< 0.01 ** ; p< *** ).
 Four day old AFB1::AFB1-GUS transgenic seedlings were treated with various concentrations of NaCl and stained for GUS activity. (b) Quantitative analysis of GUS activity.")
39 26 Figure 3.2.Expression of AFB1::AFB1-GUS in response to salinity stress. (a) Four day old AFB1::AFB1-GUS transgenic seedlings were treated with various concentrations of NaCl and stained for GUS activity. (b) Quantitative analysis of GUS activity. Whole seedlings were used to extract total protein for quantitative GUS assay. Each data point indicates the mean value of 3 replicates. Error bars indicate standard deviation from the mean. Stars indicate that the means differ significantly from the respective control (p< 0.05 * ; p< 0.01 ** ; p< *** ). (c) Shoots of four day old transgenic seedlings treated with various concentrations of NaCl showing the expression of AFB1::AFB1-GUS.
40 27 AFB1 expression is modulated by osmotic stress Low concentrations of mannitol up-regulate the expression of AFB1::GUS and AFB1::AFB1-GUS, but down-regulate expression at higher concentrations (300 mm) (Figure 3.3.a,b and Figure 3.4.a,b). Roots and shoots show a similar expression pattern in both AFB1::GUS and AFB1::AFB1-GUS in response to osmotic stress. Figure 3.3. AFB1::GUS expression in response to osmotic stress. (a) Four day old transgenic seedlings were treated with various concentrations of mannitol and stained for GUS activity. (b) Quantitative analysis of GUS activity. Whole seedling extracts were used in quantitative analysis. Each data point indicates the mean value of 3 replicates. Error bars indicate standard deviation from the mean. Stars indicate that the means differ significantly from the control (p< 0.05 * ; p< 0.01 ** ; p< *** ).
41 28 Figure 3.4. AFB1::AFB1-GUS expression in response to osmotic stress. (a) Four day old transgenic seedlings were treated with various concentrations of mannitol and stained for GUS activity. (b) Quantitative analysis of GUS activity. Whole seedling extracts were used in quantitative analysis. Each data point indicates the mean value of 3 replicates. Error bars indicate standard deviation from the mean. Stars indicate that the means differ significantly from the control (p< 0.05 * ; p< 0.01 ** ; p< *** ). AFB1 expression is regulated by ABA In contrast to the regulation of AFB1 by NaCl and mannitol, it is down-regulated by ABA in a concentration dependent manner. The reduced expression is evident in both AFB1::GUS and AFB1::AFB1-GUS reporter constructs (Figure 3.5.a,b and 3.6.a,b).
42 29 Figure 3.5. Expression of AFB1::GUS in response to ABA. (a) Four day old AFB1::GUS transgenic seedlings were treated with various concentrations of ABA and then stained for GUS activity. (b) Quantitative analysis of GUS activity. Whole seedlings were used to extract total protein for quantitative GUS assay. Each data point indicates the mean value of 3 replicates. Error bars indicate standard deviation from the mean. Stars indicate that the means differ significantly from the control (p< 0.05 * ; p< 0.01 ** ; p< *** ).
43 30 Figure 3.6. Expression of AFB1::AFB-GUS in response to ABA. (a) Four day old AFB1::AFB1-GUS transgenic seedlings were treated with various concentrations of ABA and then stained for GUS activity. (b) Quantitative analysis of GUS activity. Whole seedlings were used to extract total protein for quantitative GUS assay. Each data point indicates the mean value of 3 replicates. Error bars indicate standard deviation from the mean. Stars indicate that the means differ significantly from the control (p< 0.05 * ; p< 0.01 ** ; p< *** ). AFB1 expression is regulated by GA The expression of both AFB1::GUS and AFB1::AFB1- GUS is up-regulated by GA up to 100 µm concentration. At very high concentrations (200 µm), GA downregulates GUS expression suggesting the involvement of GA in the regulation of AFB1 gene. (Figure 3.7.a,b and Figure 3.8.a,b).
44 31 Figure 3.7. Expression of AFB1::GUS in response to GA. (a) Four day old AFB1::GUS transgenic seedlings were treated with various concentrations of GA and stained for GUS activity. (b) Quantitative analysis of GUS activity. Whole seedlings were used to extract total protein for quantitative GUS assay. Each data point indicates the mean value of 3 replicates. Error bars indicate standard deviation from the mean. Stars indicate that the means differ significantly from the control (p< 0.05 * ; p< 0.01 ** ; p< *** ).
45 32 Figure 3.8. Expression of AFB1::AFB1-GUS in response to GA. (a) Four day old AFB1::AFB1-GUS transgenic seedlings were treated with various concentrations of GA and stained for GUS activity. (b) Quantitative analysis of GUS activity. Whole seedlings were used to extract total protein for quantitative GUS assay. Each data point indicates the mean value of 3 replicates. Error bars indicate standard deviation from the mean. Stars indicate that the means differ significantly from the control (p < 0.05 * ; p< 0.01 ** ; p< *** ). Salinity modulates the expression of AFB2 Unlike TIR1 and AFB1, AFB2 is not induced by salinity stress even at low concentrations as shown by reporter gene constructs. AFB2::GUS expression (Figure 4.1.a,b) is dramatically down-regulated with increasing NaCl concentration. AFB2::AFB2-GUS expression is very low. However, it is also down-regulated by NaCl (Figure 4.2.a,b). The expression patterns in both shoots and roots are similar in all
46 33 treatments (shoot data not shown). Figure 4.1. AFB2::GUS expression in response to salinity stress. (a) Four day old AFB2::GUS transgenic seedlings were treated with various concentrations of NaCl. Seedlings were fixed after the NaCl treatment and stained for GUS activity. (b) Quantitative analysis of GUS activity. Whole seedlings were used to extract total protein for quantitative GUS assay. Each point indicates the mean value of 3 replicates. Error bars indicate standard deviation from the mean. Stars indicate that the means differ significantly from the control (p < 0.05 * ; p< 0.01 ** ; p< *** ).
47 34 Figure 4.2. AFB2::AFB2-GUS expression in response to salinity stress. (a) Four day old AFB2::AFB2-GUS transgenic seedlings treated with various concentrations of NaCl. Seedlings were fixed after the NaCl treatment and stained for GUS activity. (b) Quantitative analysis of GUS activity. Whole seedlings were used to extract total protein for quantitative GUS assay. Each point indicates the mean value of 3 replicates. Error bars indicate standard deviation from the mean. Stars indicate that the means differ significantly from the control (p < 0.05 * ; p< 0.01 ** ; p< *** ). AFB2 expression is regulated by osmotic stress Similar to salinity stress, osmotic stress also down-regulates AFB2 expression according to both AFB2::GUS (Figure 4.3.a,b) and AFB2::AFB2-GUS expression (Figure 4.4.a,b) under different mannitol treatments.
 Quantitative analysis of GUS activity. Whole seedling extracts were used in quantitative GUS analysis. Each data point indicates the mean value of 3 replicates.")
48 35 Figure 4.3. AFB2::GUS expression in response to osmotic stress. (a) Four day old transgenic seedlings were treated with various concentrations of mannitol and stained for GUS activity. (b) Quantitative analysis of GUS activity. Whole seedling extracts were used in quantitative GUS analysis. Each data point indicates the mean value of 3 replicates. Error bars indicate standard deviation from the mean. Stars indicate that the means differ significantly from the control (p < 0.05 * ; p< 0.01 ** ; p< *** ).
49 36 Figure 4.4. AFB2::AFB2-GUS expression in response to osmotic stress. (a) Four day old transgenic seedlings were treated with various concentrations of mannitol and stained for GUS activity. (b) Quantitative analysis of GUS activity. Whole seedling extracts were used in quantitative analysis. Each data point indicates the mean value of 3 replicates. Error bars indicate standard deviation from the mean. Stars indicate that the means differ significantly from the control (p < 0.05 * ; p< 0.01 ** ; p< *** ). AFB2 expression is regulated by ABA Similar to salinity and osmotic stress ABA also down-regulates AFB2 expression in both AFB2::GUS and AFB2::AFB2-GUS transgenic lines (Figure 4.5.a,b and Figure 4.6.a,b) indicating that AFB2 expression is generally down-regulated by stress treatments.
50 37 Figure 4.5. Expression of AFB2::GUS in response to ABA. (a) Four day old AFB2::GUS transgenic seedlings were treated with various concentrations of ABA and then stained for GUS activity. (b) Quantitative analysis of GUS activity. Whole seedlings were used to extract total protein for a quantitative GUS assay. Each data point indicates the mean value of 3 replicates. Error bars indicate standard deviation from the mean. Stars indicate that the means differ significantly from the control (p < 0.05 * ; p< 0.01 ** ; p< *** ).
51 38 Figure 4.6. Expression of AFB2::AFB2-GUS in response to ABA. (a) Four day old AFB2::AFB2-GUS transgenic seedlings were treated with various concentrations of ABA and then stained for GUS activity. (b) Quantitative analysis of GUS activity. Whole seedlings were used to extract total protein for quantitative GUS assay. Each data point indicates the mean value of 3 replicates. Error bars indicate standard deviation from the mean. Stars indicate that the means differ significantly from the control (p < 0.05 * ; p< 0.01 ** ; p< *** ). GA up-regulates the expression of AFB2 Compared to other treatments, GA up-regulates the expression of AFB2::GUS and AFB2::AFB2-GUS as indicated by both histological and quantitative assays (Figure 4.7.a,b and Figure 4.8.a,b). However, at very high concentration of GA, expression of both reporter genes is down-regulated.
52 39 Figure 4.7. Expression of AFB2::GUS in response to GA. (a) Four day old AFB2::GUS transgenic seedlings were treated with various concentrations of GA and stained for GUS activity. (b) Quantitative analysis of GUS activity. Whole seedlings were used to extract total protein for quantitative GUS assay. Each data point indicates the mean value of 3 replicates. Error bars indicate standard deviation from the mean. Stars indicate that the means differ significantly from the respective control (p< 0.05 * ; p< 0.01 ** ; p< *** ).
53 40 Figure 4.8. Expression of AFB2::AFB2-GUS in response to GA. (a) Four day old AFB2::AFB2-GUS transgenic seedlings were treated with various concentrations of GA and stained for GUS activity. (b) Quantitative analysis of GUS activity. Whole seedlings were used to extract total protein for quantitative GUS assay. Each data point indicates the mean value of 3 replicates. Error bars indicate standard deviation from the mean. Stars indicate that the means differ significantly from the control (p< 0.05 * ; p< 0.01 ** ; p< *** ). AFB3 expression is modulated by salinity stress Comparable with expression of AFB2, expression of both AFB3::GUS and AFB3::AFB3-GUS is also significantly down-regulated by salinity stress (Figure 5.1.a,b and Figure 5.2.a,b). A similar trend of down-regulation could be seen in both roots and shoots (shoot data are not shown).
54 41 Figure 5.1. AFB3::GUS expression in response to salinity stress. (a) Four day old AFB3::GUS transgenic seedlings were treated with various concentrations of NaCl. Seedlings were fixed after the NaCl treatment and stained for GUS activity. (b) Quantitative analysis of GUS activity. Whole seedlings were used to extract total protein for quantitative GUS assay. Each point indicates the mean value of 3 replicates. Error bars indicate standard deviation from the mean. Stars indicate that the means differ significantly from the control (p< 0.05 * ; p< 0.01 ** ; p< *** ).
55 42 Figure 5.2. AFB3::AFB3-GUS expression in response to salinity stress. (a) Four day old AFB3::AFB3-GUS transgenic seedlings were treated with various concentrations of NaCl. Seedlings were fixed after the NaCl treatment and stained for GUS activity. (b) Quantitative analysis of GUS activity. Whole seedlings were used to extract total protein for quantitative GUS assay. Each point indicates the mean value of 3 replicates. Error bars indicate standard deviation from the mean. Stars indicate that the means differ significantly from the control (p< 0.05 * ; p< 0.01 ** ; p< *** ). Osmotic stress regulates the expression of AFB3 Osmotic stress down-regulates AFB3::GUS expression (Figure 5.3.a,b). However, the expression of AFB3::AFB3-GUS is up-regulated at low concentrations of mannitol and then down-regulated at very high concentrations. This dual response again suggests the presence of additional cis-regulatory elements necessary for osmotic stress responses within the gene.
56 43 Figure 5.3. AFB3::GUS expression in response to osmotic stress. (a) Four day old transgenic seedlings were treated with various concentrations of mannitol and stained for GUS activity. (b) Quantitative analysis of GUS activity. Whole seedlings were used to extract total protein for quantitative GUS assay. Each data point indicates the mean value of 3 replicates. Error bars indicate standard deviation from the mean. Stars indicate that the means differ significantly from the control (p< 0.05 * ; p< 0.01 ** ; p< *** ).
57 44 Figure 5.4. AFB3::AFB3-GUS expression in response to osmotic stress. (a) Four day old transgenic seedlings were treated with various concentrations of mannitol and stained for GUS activity. (b) Quantitative analysis of GUS activity. Whole seedling extracts were used in quantitative analysis. Each data point indicates the mean value of 3 replicates. Error bars indicate standard deviation from the mean. Stars indicate that the means differ significantly from the control (p < 0.05 * ; p< 0.01 ** ; p< *** ). ABA up-regulates the expression of AFB3 The expression of AFB3 fused reporter genes is up-regulated by ABA at low concentrations and down-regulated at high concentrations. This pattern of response is evident in both transcriptional (Figure 5.5.a,b) and translational (Figure 5.6.a,b) reporter constructs.
58 45 Figure 5.5. Expression of AFB3::GUS in response to ABA. (a) Four day old AFB3::GUS transgenic seedlings were treated with various concentrations of ABA and then stained for GUS activity. (b) Quantitative analysis of GUS activity. Whole seedlings were used to extract total protein for quantitative GUS assay. Each data point indicates the mean value of 3 replicates. Error bars indicate standard deviation from the mean. Stars indicate that the means differ significantly from the control (p< 0.05 * ; p< 0.01 ** ; p< *** ).
59 46 Figure 5.6. Expression of AFB3::AFB3-GUS in response to ABA. (a) Four day old AFB3::AFB3-GUS transgenic seedlings were treated with various concentrations of ABA and then stained for GUS activity. (b) Quantitative analysis of GUS activity. Whole seedlings were used to extract total protein for quantitative GUS assay. Each data point indicates the mean value of 3 replicates. Error bars indicate standard deviation from the mean. Stars indicate that the means differ significantly from the control (p< 0.05 * ; p< 0.01 ** ; p< *** ). GA up-regulates the expression of AFB3 Following the similar pattern as TIR1, AFB1 and AFB2 fused reporter genes, the expression of AFB3::GUS and AFB3::AFB3-GUS is also up-regulated by low concentrations and down-regulated by high concentrations of GA (Figure 5.7.a,b and Figure 5.8.a,b).
60 47 Figure 5.7. Expression of AFB3::GUS in response to GA. (a) Four day old AFB3::GUS transgenic seedlings were treated with various concentrations of GA and stained for GUS activity. (b) Quantitative analysis of GUS activity. Whole seedlings were used to extract total protein for quantitative GUS assay. Each data point indicates the mean value of 3 replicates. Error bars indicate standard deviation from the mean. Stars indicate that the means differ significantly from the control (p < 0.05 * ; p< 0.01 ** ; p< *** ).
61 48 Figure 5.8. Expression of AFB3::AFB3-GUS in response to GA. (a) Four day old AFB3::AFB3-GUS transgenic seedlings were treated with various concentrations of GA and stained for GUS activity. (b) Quantitative analysis of GUS activity. Whole seedlings were used to extract total protein for quantitative GUS assay. Each data point indicates the mean value of 3 replicates. Error bars indicate standard deviation from the mean. Stars indicate that the means differ significantly from the control (p < 0.05 * ; p< 0.01 ** ; p< *** ). RT-PCR analysis of auxin receptor genes RT-PCR results indicate while TIR1 is slightly up-regulated in response to salinity and osmotic stresses, all other AFBs are down-regulated (Figure 6.1 and 6.2). In response to ABA, while TIR1 and AFB3 are up-regulated, AFB1 and AFB2 are down-regulated (Figure 6.3). GA treatment up-regulates all the receptor genes at low concentrations but down-regulates at high concentrations.

62 49 Figure 6.1. RT-PCR analysis of F-box receptor genes in response to salinity stress. Four day old wild type (Col-0) seedlings were treated with NaCl for 18 hrs in liquid ATS medium. Samples were frozen in liquid nitrogen and RNA was isolated. cdna was synthesized and PCR reactions were carried out using specific internal primers for each auxin receptor gene. Ubiquitin 11 was used as the internal control. Number of amplification cycles used is indicated following the name of the gene.

63 50 Figure 6.2. RT-PCR analysis of F-box receptor genes in response to osmotic stress. Four day old wild type (Col-0) seedlings were treated with mannitol for 18 hrs in liquid ATS medium. Samples were frozen in liquid nitrogen and RNA was isolated. cdna was synthesized and PCR reactions were carried out using specific internal primers for each auxin receptor gene. Ubiquitin 11 was used as the internal control. Number of amplification cycles is indicated following the name of the gene.
 seedlings were treated with ABA for 18 hrs in liquid ATS medium.")

64 51 Figure 6.3. RT-PCR analysis of F-box receptor genes in response to ABA. Four day old wild type (Col-0) seedlings were treated with ABA for 18 hrs in liquid ATS medium. Samples were frozen in liquid nitrogen and RNA was isolated. cdna was synthesized, and PCR reactions were carried out using specific internal primers for each auxin receptor gene. Ubiquitin 11 was used as the internal control. Number of amplification cycles is indicated following the name of the gene.
 seedlings were treated with GA for 18 hrs in liquid ATS medium. Samples were frozen in liquid nitrogen and RNA was isolated.")

65 Figure 6.4. RT-PCR analysis of auxin receptor F-box genes in response to GA. Four day old wild type (Col-0) seedlings were treated with GA for 18 hrs in liquid ATS medium. Samples were frozen in liquid nitrogen and RNA was isolated. cdna was synthesized and PCR reactions were carried out using specific internal primers for each auxin receptor gene. Ubiquitin 11 was used as the internal control. Number of amplification cycles is indicated following the name of the gene. Table 1. Summary of the expression patterns of auxin receptor genes in response to salinity stress Salinity stress (NaCl) Experiment TIR1 AFB1 AFB2 AFB3 Concentration(mM) Concentration(mM) Concentration(mM) Concentration(mM) Transcriptional reporter gene expression Translational reporter gene expression RT PCR
66 Table 1 continued. + indicates the relative expression level. Expression levels among different genes are not comparable. Table 2. Summary of the expression patterns of auxin receptor genes in response to osmotic stress Osmotic stress (Mannitol) Experiment TIR1 AFB1 AFB2 AFB3 Concentration(mM) Concentration(mM) Concentration(mM) Concentration(mM) Transcriptional reporter gene expression Translational reporter gene expression RT PCR + indicates the relative expression level. Expression levels among different genes are not comparable. Table 3. Summary of the expression patterns of auxin receptor genes in response to ABA ABA Experiment TIR1 AFB1 AFB2 AFB3 Concentration(µM) Concentration(µM) Concentration(µM) Concentration(µM) Transcriptional reporter gene expression Translational reporter gene expression RT PCR
67 Table 3 continued. + indicates the relative expression level. Expression levels among different genes are not comparable. Table 4. Summary of the expression patterns of auxin receptor genes in response to GA GA Experiment TIR1 AFB1 AFB2 AFB3 Concentration(µM) Concentration(µM) Concentration(µM) Concentration(µM) Transcriptional reporter gene expression Translational reporter gene expression RT PCR + indicates the relative expression level. Expression levels among different genes are not comparable. Analysis of mir393 expression The mir393 is a negative regulator of auxin receptor F-box genes. Therefore, the expression of mir393a and mir393b were examined in response to salinity, osmotic stress, ABA and GA using mir393a::gfp and mir393b::gfp transgenic seedlings that have been described previously (Navarro et al., 2006).
.")
68 55 Expression of mir393a is regulated by salinity, osmotic stress, ABA and GA The expression of mir393a::gfp is mainly confined to the peripheral cells of the root. The expression level of mir393a::gfp is very low, but clearly the expression can be detected in transgenic seedlings compared to wild type Col-0 (data not shown). The expression of mir393a::gfp is considerably induced by salinity stress (Figure 7.1). However, unlike salinity, osmotic stress down-regulates the expression of mir393a::gfp (Figure 7.2). While ABA up-regulates mir393a::gfp expression at low concentrations, it down-regulates the expression at higher concentrations (Figure 7.3). mir393a::gfp follows the same expression pattern in response to GA, except it reaches its maximum at a higher concentration of GA than that of ABA (Figure 7.4). These results suggest that the expression of mir393a is regulated by salinity, osmotic stress, ABA and GA. Figure 7.1. Expression of mir393a::gfp in response to salinity stress. Four day old transgenic seedlings carrying mir393a::gfp gene construct were treated with NaCl for 18 hrs. Expression of mir393a::gfp in roots was detected using Olympus FV1000 confocal microscopy. Images represent a single 0.5 µm thick optical section taken in the


69 56 middle plane of the root using 20x water immersion lens with a numerical aperture of 1.2, enabling the vascular tissues were imaged. Figure 7.2. Expression of mir393a::gfp in response to osmotic stress. Four day old transgenic seedlings carrying mir393a::gfp gene construct were treated with mannitol for 18 hrs. Expression of mir393a::gfp in roots was detected using Olympus FV1000 confocal microscopy. Images were acquired as described in the legend to figure 7.1. Figure 7.3. Expression of mir393a::gfp in response to ABA. Four day old transgenic seedlings carrying mir393a::gfp gene construct were treated with ABA for 18 hrs. Expression of mir393a::gfp in roots was detected using Olympus FV1000 confocal microscopy. Images were acquired as described in the legend to figure 7.1.


70 57 Figure 7.4. Expression of mir393a::gfp in response to GA. Four day old transgenic seedlings carrying mir393a::gfp gene construct were treated with GA for 18 hrs. Expression of mir393a::gfp in roots was detected using Olympus FV1000 confocal microscopy. Images were acquired as described in the legend to figure 7.1. Expression of mir393b is modulated by salinity, osmotic stress, ABA and GA Unlike mir393a::gfp, mir393b::gfp expression is mainly seen in the central vascular region of the root and shows dramatic increase in its expression in response to all the treatments. Level of mir393b::gfp is greatly induced by salinity stress (Figure 8.1). Also the expression domain expands to periphery of the root in response to high salinity. Mannitol also induces the expression of mir393b::gfp, but the expression is mainly restricted to the vascular region (Figure 8.2). Treatment with ABA and GA also induces the expression of mir393b::gfp in a similar manner to NaCl treatment (Figure 8.3 and 8.4); however at very high concentrations of ABA the expression is downregulated.


71 58 Figure 8.1. Expression of mir393b::gfp in response to salinity stress. Four day old transgenic seedlings carrying mir393b::gfp gene construct were treated with NaCl for 18 hrs. Expression of mir393b::gfp in roots was detected using Olympus FV1000 confocal microscope. Images were acquired as described in the legend to figure 7.1. Figure 8.2. Expression of mir393b::gfp in response to osmotic stress. Four day old transgenic seedlings carrying mir393b::gfp gene construct were treated with mannitol for 18 hrs. Expression of mir393b::gfp in roots was detected using Olympus FV1000 confocal microscope. Images were acquired as described in the legend to figure 7.1.


72 59 Figure 8.3. Expression of mir393b::gfp in response to ABA. Four day old transgenic seedlings carrying mir393b::gfp gene construct were treated with ABA for 18 hrs. Expression of mir393b::gfp in roots was detected using Olympus FV1000 confocal microscope. Images were acquired as described in the legend to figure 7.1. Figure 8.4. Expression of mir393b::gfp in response to GA. Four day old transgenic seedlings carrying mir393b::gfp gene construct were treated with GA for 18 hrs. Expression of mir393b::gfp in roots was detected using Olympus FV1000 confocal microscope. Images were acquired as described in the legend to figure 7.1.
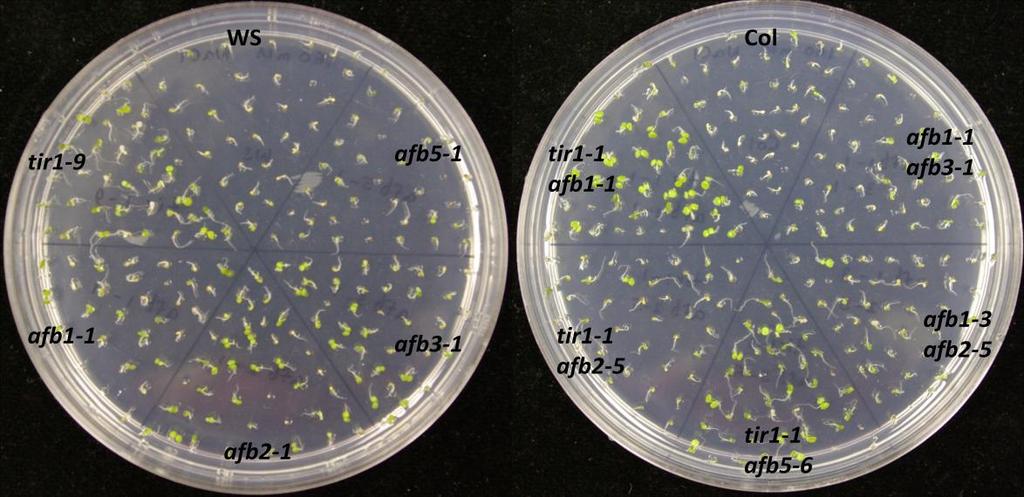
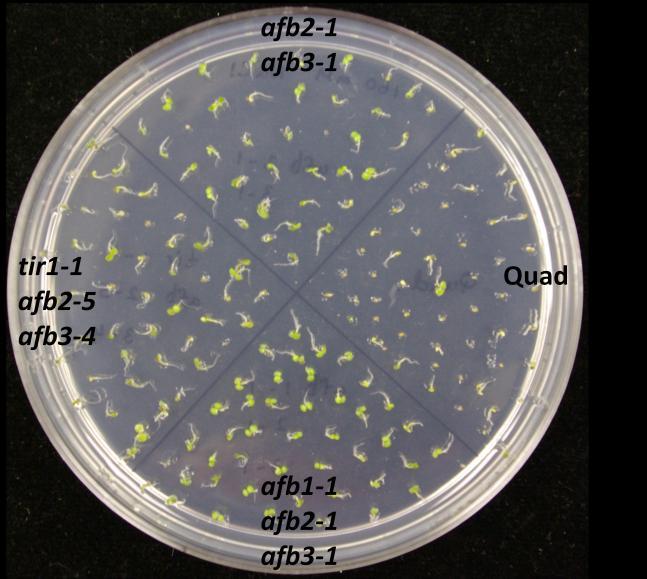
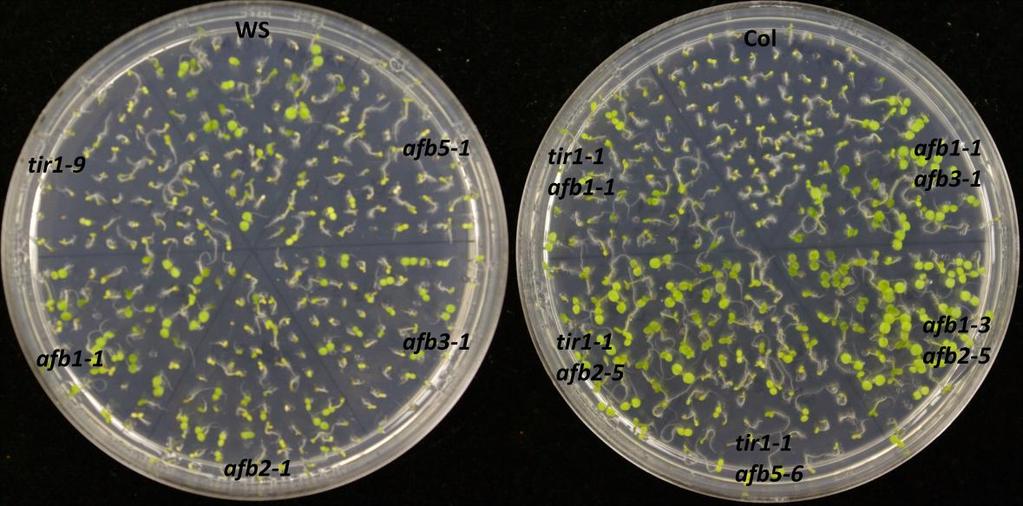
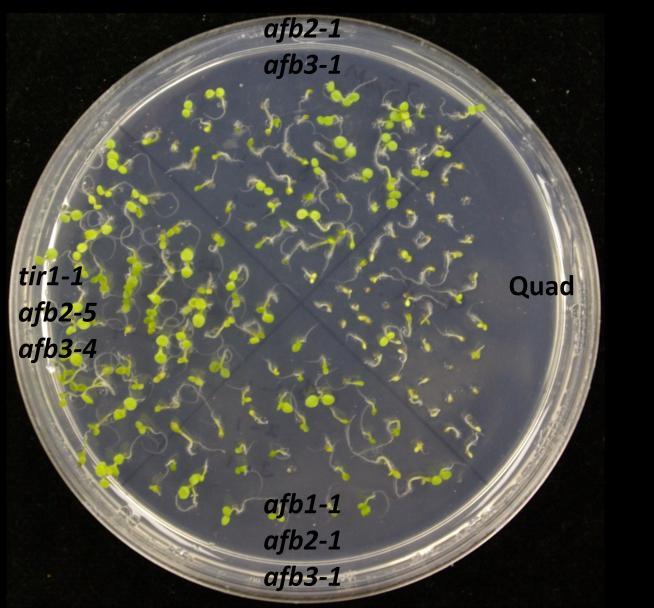
73 60 Germination assays To confirm the effects of salinity, osmotic stress, ABA and GA on plant development, wild type of two different ecotypes (Col-0 and Ws) and auxin receptor mutant seedlings were tested on control and treatment media. In this experiment, the ability to produce green cotyledons when grown under different conditions was considered as evidence of the resistance of the seedling. Therefore, percentage green cotyledons were calculated for comparison. Mutants used in this experiment were from two different ecotypes: tir1-9, afb1-1, afb2-1, afb3-1 and afb5-1 belong to Ws while tir1-1, afb2-5, afb1-3, afb3-4 belong to Col-0. Auxin receptor mutants are resistant to salinity stress When wild type (Col-0 or Ws), single, double, triple or quadruple auxin receptor mutants are grown on ATS, all of them produce green cotyledons, even though quadruple mutant shows slower growth than others (Figure 9.1). However, on the ATS medium containing 160 mm NaCl, mutants show various levels of resistance while wild type seedlings are sensitive to NaCl (Figure 9.1 and 9.2). tir1-9, afb1-1, afb2-1 and afb3-1 show resistance to salinity stress when compared with Ws wild type (Figure 9.2). Among them tir1-9 shows the highest resistance, afb2-1 and afb3-1 have moderate resistance, afb1-1 has the least resistance, while distantly related afb5-1 does not show resistance at all. The afb2-1/afb3-1 double mutant is more resistant to salinity compared to either of the single mutants. Similarly, the afb1-1/afb2-1/afb3-1 triple mutant shows the highest resistance compared to all other mutants. However, the afb1-1/afb3-1 double mutant shows less resistance to salinity than respective single mutants. While some double


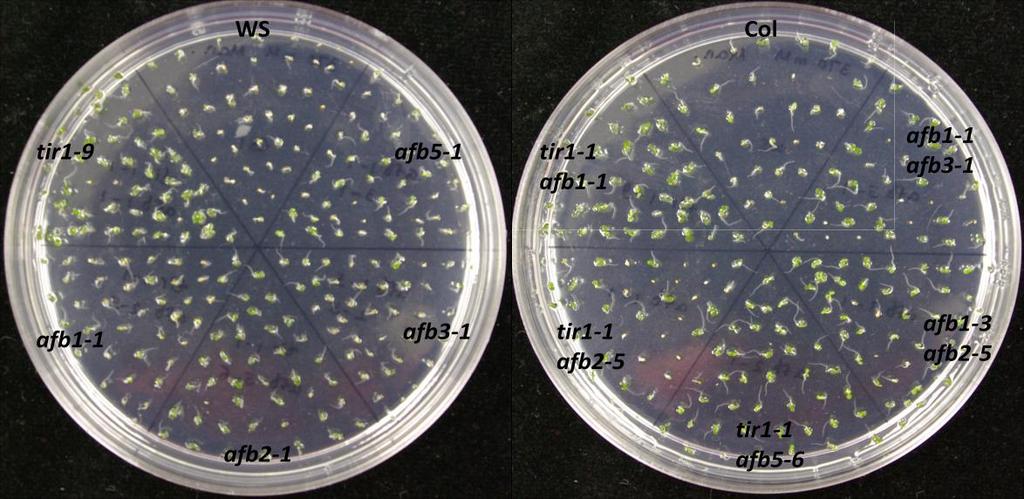
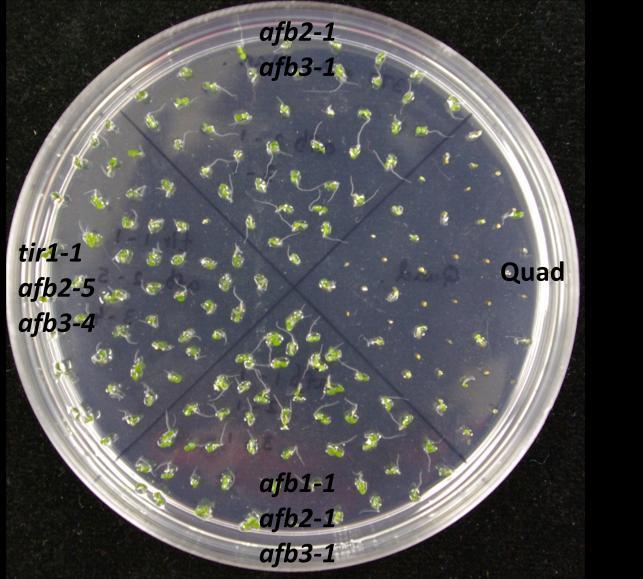
74 61 mutants show various levels of resistance, their effects cannot be properly evaluated as two mutants are from two genetic backgrounds. However, in general, successive addition of auxin receptor mutants enhances the salinity resistance even though the quadruple mutant is sensitive to salinity (Figure 9.1 and 9.2). Figure 9.1. Mutants of auxin receptor family grown on ATS (control) media. Seeds were sterilized with 40% bleach and plated them on ATS media. Stratified seeds for two days at 4 C were grown at 21 C for 7 days under continuous illumination.
75 (a) 62
76 63 (b) Figure 9.2. (a) Mutants of auxin receptor family grown on ATS media containing 160 mm NaCl. Seeds were sterilized with 40% bleach and then plated on ATS media containing NaCl. Stratified seeds for two days at 4 C were grown at 21 C for 7 days under continuous illumination. (b) Percentage of seedlings with green cotyledons consequent to salinity stress. Seedlings producing green cotyledons were counted after 7 days of growth and calculated as a percentage for each mutant. tir1, afb2 and afb3 are resistant to osmotic stress In the presence of high concentration of mannitol, the Ws ecoptype show moderate resistance compared to Col-0 ecotype. The mutants tir1-9, afb2-1 and afb3-1 show higher level of resistance to osmotic stress compared to their wild type (Ws) while afb1-1 does not show any resistance. The afb2-1/ afb3-1 double mutant and afb1-1/afb2-1/afb3-1 triple mutant have the highest resistance to mannitol. Distantly related afb5-1 also shows resistance to osmotic stress (Figure 9.3 a and b).
77 (a) 64
78 Percent green cotyledons 65 (b) Percent green cotyledons -Mannitol Figure 9.3. (a) Mutants of auxin receptor family grown on ATS media containing 370 mm mannitol. Seeds were sterilized with 40% bleach and then plated on ATS media containing mannitol. Stratified seeds for two days at 4 C were grown at 21 C for 7 days under continuous illumination. (b) Percentage of seedlings with green cotyledons in response to osmotic stress. Seedlings producing green cotyledons were counted after 7 days of growth and calculated as a percentage for each mutant. Auxin receptor mutants are resistant to ABA While the wild type Ws ecotype is sensitive to exogenous ABA, wild type of Col- 0 ecotype shows considerable resistance (Figure 8.4 a and b). All the receptor family mutants in Ws ecotype are resistant to ABA, and afb2-1 shows the highest resistance. tir1-9 and afb3-1 have moderate resistance levels while afb1-1 and afb5-1 show low resistance. afb1-1/afb3-1 and afb2-1/ afb3-1 double mutants also show high resistance to ABA. However, afb1-1/ afb2-1/ afb3-1 triple mutant shows the least resistance to ABA


79 66 compared to all above mutants. Interestingly, higher order mutants in Col-0 ecotype show sensitivity to ABA compared to its wild type while higher order mutants in Ws ecotype are more resistant to ABA compared to its wild type (Figure 8.4 b). (a)
80 Percent green cotyledons 67 (b) Percent green cotyledons -ABA Figure 9.4. (a) Mutants of auxin receptor family grown on ATS media containing 0.5 µm ABA. Seeds were sterilized with 40% bleach and then plated on ATS media containing ABA. Stratified seeds for two days at 4 C were grown at 21 C for 7 days under continuous illumination. (b) Percentage of seedlings with green cotyledons in response to ABA. Seedlings producing green cotyledons were counted after 7 days of growth and calculated as a percentage for each mutant. afb1 is resistant to GA while other auxin receptor mutants are sensitive Ws shows comparatively higher resistance than Col-0 to exogenous GA (Figure 9.5a,b). tir1-9, afb2-1 and afb5-1 are relatively sensitive to GA compared to respective Ws wild type. Only afb1-1 shows higher resistance to 70 µm GA. However, higher order mutants afb1-1/ afb3-1, afb2-1/ afb3-1 double mutants and afb1-1/ afb2-1/ afb3-1 triple mutant show very high resistance to GA.
81 (a) 68
82 Percent green cotyledons 69 (b) Figure 9.5. (a) Mutants of auxin receptor family grown on ATS media containing 70 µm GA. Seeds were sterilized with 40% bleach and then plated on ATS media containing GA. Stratified seeds for two days at 4 C were grown at 21 C for 7 days under continuous illumination. (b) Percentage seedlings with green cotyledons in response to GA. Seedlings producing green cotyledons were counted after 7 days of growth and calculated as a percentage for each mutant. Over-expression of TIR1 complements tir1-1 phenotypes in response to salinity, osmotic stress, ABA and GA As tir1-1shows defective phenotype in response to salinity, osmotic stress, ABA and GA, a line that is over-expressing TIR1 in tir1-1 background (TIR1-Myc / TIR1 OX) was also tested under these stress conditions. Unlike the tir1-9 in Ws background (Figure 9.2-4), tir1-1 in Col-0 background shows hypersensitivity to NaCl, mannitol, ABA and


83 70 GA (Figure 10.1). Over-expression of TIR1 in tir1-1 background completely recovers the sensitivity in response to above conditions. (a) (b) (c) (d)
 Normal growth of wild type (Col-0), tir1-1, TIR1-OX (TIR1-Myc) lines on ATS (control) medium. (b) Complementation of tir1-1 by TIR1-OX in response to salinity stress.")
84 Percent green cotyledons 71 (e) (f) NaCl Mannitol ABA GA 0 Col tir1-1 TIR1-OX Figure Recovery of tir1-1 phenotype in response to salinity, osmotic stress, ABA and GA by over-expression of TIR1. (a) Normal growth of wild type (Col-0), tir1-1, TIR1-OX (TIR1-Myc) lines on ATS (control) medium. (b) Complementation of tir1-1 by TIR1-OX in response to salinity stress. Seedlings were grown on ATS mm NaCl.
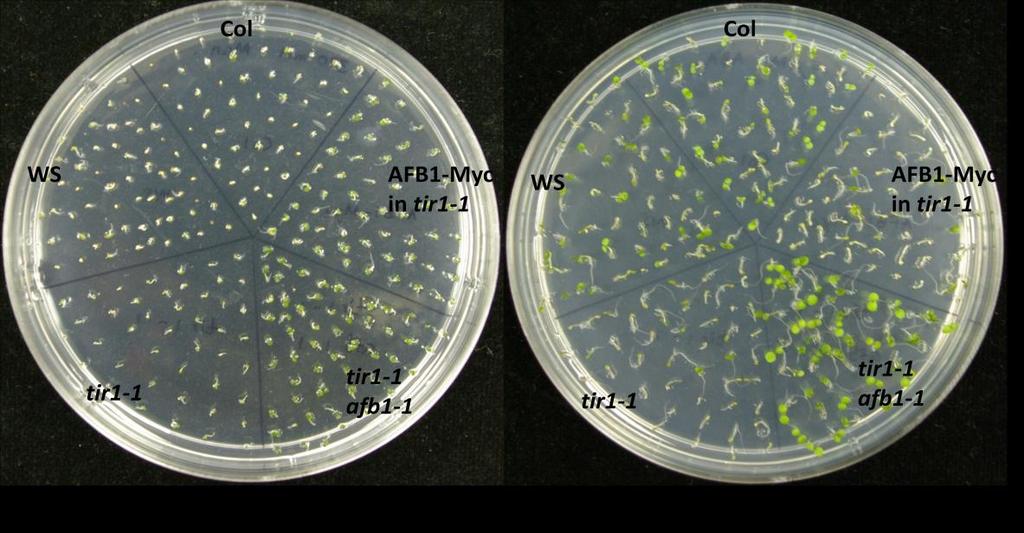
85 72 (c) Complementation of tir1-1 by TIR1-OX in response to osmotic stress. Seedlings were grown on ATS mm mannitol. (d) Complementation of tir1-1 by TIR1-OX in response to high concentration of ABA. Seedlings were grown on ATS um ABA. (e) Complementation of tir1-1 by TIR1-OX in response to high concentration of GA. Seedlings were grown on ATS + 50uM GA. (f) Percentage of seedlings with green cotyledons produced in response to NaCl, mannitol, ABA and GA. Seeds were sterilized with 40% bleach and plated on treatment media. Stratified seeds maintained for two days at 4 C were then grown at 21 C for 7 days under continuous illumination. Seedlings with green cotyledons were counted after 7 days of growth, and percentage was calculated. AFB1 rescues tir1-1 phenotype in response to salinity, osmotic stress, ABA and GA As the afb1-1 acts differently compare to the other mutants, its ability to recover tir1-1 was tested using a line that over-expresses AFB1 in tir1-1 background (AFB1- Myc/AFB1 OX). In response to NaCl and mannitol, it not only recovers tir1-1 sensitivity, but also confers resistance (Figure 10.2). AFB1 over expression also recovers ABA and GA sensitivity of tir1-1 (Figure 10.2).
 (c)")
86 73 (a) (b) (c) (d)
 Normal growth of wild type (Col-0), afb1-1, AFB1-OX in ATS (control) media. (b) Complementation of tir1-1 by AFB1-OX in response to salinity stress. Seedlings were grown on ATS + 160 mm NaCl.")
87 Percent green cotyledons 74 (e) (f) NaCl Mannitol ABA GA 0 Col tir1-1 AFB1-Myc Figure Recovery of afb1-1 phenotype in response to ABA, GA, salinity and osmotic stress by over-expression of AFB1. (a) Normal growth of wild type (Col-0), afb1-1, AFB1-OX in ATS (control) media. (b) Complementation of tir1-1 by AFB1-OX in response to salinity stress. Seedlings were grown on ATS mm NaCl. (c) Complementation of tir1-1 by AFB1-OX in response to osmotic stress. Seedlings were
88 75 grown on ATS+ 370 mm mannitol. (d) Complementation of tir1-1 by AFB1-OX in response to high concentration of ABA. Seedlings were grown on ATS µm ABA. (e) Complementation of tir1-1 by AFB1-OX in response to high concentration of GA. Seedlings were grown on ATS + 50 µm GA. (f) Percentage seedlings with green cotyledons produced in response to NaCl, mannitol, ABA and GA. Seeds were sterilized with 40% bleach and plated them on treatment media. Stratified seeds for two days at 4 C were grown at 21 C for 7 days under continuous illumination. Seedlings with green cotyledons were counted after 7 days of growth and percentage was calculated. Auxin receptor genes contain putative cis regulatory elements responsive to osmotic stress, ABA and GA Analyses of promoter sequences of four auxin receptor genes have revealed the presence of putative cis-regulatory elements common to stress and hormonal responses. An ABRE-like sequence is located 141 bp upstream of transcription starting point (TSP) of TIR1. Promoter of AFB1 also contains ABRE like sequence 993 bp upstream of TSP. However, its e-value is higher than that of the ABRE present in TIR1. Interestingly, all the auxin receptor genes contain AtMYC2 BS RD22 sequences. AFB1 has four such sequences while others contain one. All the AFBs contain AtMYB2 BS RD22 sequences. Only TIR1 contains DRE core sequence 262 bp upstream of TSP. All auxin receptor genes except AFB3 contain Gibberellic acid responsive elements (GARE) in duplicate.
 of TIR1, AFB1, AFB2 and AFB3 genes were analyzed using ATHENA, ATHAMAP, PROMOTER and AGRIS web based bioinformatics tools.")
.")
89 76 Figure 11. Putative cis-regulatory elements found in auxin receptor family genes. The promoter regions (1000 bp upstream of ATG) of TIR1, AFB1, AFB2 and AFB3 genes were analyzed using ATHENA, ATHAMAP, PROMOTER and AGRIS web based bioinformatics tools. Putative regulatory elements were identified depending on the threshold e-value and the consensus sequence. TIR1 promoter contains a bona fide ABRE Putative ABRE like sequence in TIR1 promoter was altered by changing ACGTGTC into ACGTCTC (Hattory et al., 2002). A promoter containing the altered ABRE sequence was cloned in front of the GUS coding sequence to generate the TIR1 mabre ::GUS construct and transformed into Arabidopsis wild type Col-0. Homozygous plants carrying TIR1 mabre ::GUS were used for further experiments. Several lines of TIR1 mabre ::GUS having different levels of expressions were treated with ABA


90 77 and compared with TIR1::GUS expression pattern. Interestingly, ABA does not induce the mutated TIR1 mabre ::GUS expression. This observation suggests that putative ABRE sequence found in TIR1 promoter is a true ABRE and it regulates the TIR1 expression in response to ABA. Figure 12. ABA fails to induce TIR1 mabre ::GUS expression. Roots of four day old seedlings carrying TIR1::GUS or TIR1 mabre ::GUS were stained for GUS activity. Three independent lines of TIR1 mabre ::GUS having different levels of expression were used in the experiment.
91 CHAPTER IV DISCUSSION As the major plant hormone, auxin regulates many aspects of plant growth and development. Recent studies indicate that the auxin response pathway interacts with other plant hormone signaling pathways in multiple ways (Depuydt et al., 2011). Therefore, the final outcome of growth responses is due to the crosstalk between several plant hormones. As plants are normally exposed to stress conditions such as salinity and osmotic stress, plant hormone signaling pathways should be fine-tuned to cope with changing environmental conditions. Previous studies have shown that ABA and GA signaling are involved in regulating auxin signaling and vice versa (Bjorklund et al., 2007, Sun et al., 2005). Reduced polar auxin transport affects GA biosynthesis as well as GA-induced degradation of DELLA proteins. Thus, auxin affects both GA biosynthesis and GA signaling (Fu et al., 2003). ABA alters the expression of auxin transporter genes in response to salinity stress (Yu et al., 2010). Auxin related mutants such as ibr5-1 show defects in ABA signaling as well, suggesting an interaction between the two hormone signaling pathways (Strader et al., 2008). Salinity and osmotic stresses also have direct effects on auxin signaling. According to Iglesias et al. (2010), auxin receptors TIR1 and 78
92 79 AFB2 are involved in adapting the plant to salinity and oxidative stresses. However, the underlying molecular mechanism is not yet known. According to the current model, auxin interacts with its co-receptors TIR1/AFBs and transcriptional repressor Aux/IAAs, mediating ubiquitination and subsequent degradation of Aux/IAAs. Removal of Aux/IAAs through degradation modulates the transcription of auxin responsive genes. Therefore, it is arguable that if the abundance of auxin receptor proteins is altered, downstream auxin signaling will also be changed. In this work the expression of auxin receptor family genes was studied in response to salinity, osmotic stress, ABA and GA, using transcriptional and translational reporter gene constructs as major molecular tools. β-glucuronidase (GUS) enzyme was one of the reporter genes used. This enzyme converts its substrates X-Gluc (5-bromo-4- chloro-3-indoxyl-beta-d-glucuronide) into a blue colored product or MUG (4- methylumbelliferyl-β-d-galactopyranoside) into a fluorescent product. X-Gluc was used in histochemical staining, and MUG was used in quantitative GUS assay. In order to study the mrna level prior to post transcriptional modifications, transcriptional reporter constructs were used where promoters of TIR1, AFB1, AFB2 and AFB3 were fused to GUS reporter gene. Translational reporter constructs used are a fusion of promoter and coding region of the gene of interest to GUS reporter gene. Translational constructs of above genes were used to study the protein levels in response to salinity, osmotic stress, ABA and GA. Another reporter gene used was green fluorescent protein (GFP), the coding sequence for which was fused to promoters of mir393a and mir393b. These reporters were used to study the expression pattern of mir393 in response to above
93 80 conditions, as it is known to be a negative regulator of auxin receptor genes (Sunkar et al., 2004). TIR1 expression is regulated by salinity, osmotic stress, ABA and GA TIR1 transcription is induced by NaCl in both shoots and roots. However, at high concentrations of NaCl, TIR1 expression is down-regulated in roots but up-regulated in shoots, suggesting differential regulation of its expression within the plant. However, according to the results of TIR1::TIR1-GUS translational construct, in both shoots and roots TIR1 expression is up-regulated by low salinity while down-regulated by high salinity. This observation suggests that TIR1 transcripts are subjected to tight regulation prior to translation. Nevertheless, translation and stability of the protein may also be affected by high salinity conditions. According to RT-PCR analysis which indicates the endogenous transcript level, TIR1 is up-regulated comparable with reporter gene expression data at low concentrations; however, the down-regulation seen in reporter gene expression at the highest concentration (300 mm) of NaCl is not evident from RT- PCR data. Therefore, it is possible that translation or the stability of TIR1 protein is affected at high salt conditions. Since NaCl causes both salinity stress and osmotic stress, seedlings were treated with mannitol to check whether the above effect was from osmotic stress. Osmotic stress does not induce TIR1::GUS expression, but it does induce TIR1::TIR1-GUS expression. This observation suggests that cis-regulatory elements required for osmotic stress induction may be present within the gene. Alternatively, TIR1-GUS protein may be stabilized by osmotic stress. However, the induction was much less compared to that of
94 81 NaCl, suggesting that salinity, but not osmotic stress, mainly contributes to the induction of TIR1 transcription. Similar to salinity, high osmotic stress also results in downregulation of TIR1 expression. The expression in shoots and roots follows the same pattern in response to osmotic stress. RT-PCR data show a slight increase in TIR1 transcription, paralleling reporter expression data. Since salinity and osmotic stress induce TIR1 expression, and since abscisic acid level and its signaling are also enhanced by above stresses (reviewed by Zhu et al., 2002), TIR1 expression was examined in the presence of ABA. Similar to salinity and osmotic stresses, ABA up-regulates TIR1 expression in roots. However, it does not up-regulate TIR1 expression in the shoot, but rather down-regulates it at higher concentrations. Despite the down-regulation of TIR1 in the shoot at high concentrations of ABA evident from reporter gene constructs, the RT-PCR data indicate that TIR1 is up-regulated in response to ABA. These data again suggests the complexity of the regulation of TIR1 expression within the plant. As gibberellic acid signaling also interacts with auxin signaling and it acts as an antagonist to ABA in several biological processes (reviewed by Hartweck., 2008), the ability of GA to regulate TIR1 expression was studied. Interestingly, GA also induces TIR1 expression. This induction is evident in both reporter gene expression and RT-PCR analysis. AFB1 expression is regulated by hormone and stress factors. According to reporter gene expression data, AFB1 follows the same expression pattern as TIR1 in response to NaCl and mannitol, Both are up-regulated by low
95 82 concentrations and down-regulated by high concentrations. Peak expression of AFB1 was observed at 100 mm concentration while for TIR1, peak expression was at 200 mm concentration of NaCl and mannitol. In contrast to reporter gene expression data, RT- PCR indicates that AFB1 is down-regulated even at low concentrations of NaCl and mannitol. It is possible that the difference between the RT-PCR results and the reporter construct results can be attributed to the fact that only 2000 bps upstream of the AFB1 gene start site is included as the promoter in the reporter gene. Therefore, additional cisregulatory elements needed for fine tuning transcription may not be within the promoter region used in the construct. The difference may also be due to post transcriptional modifications of AFB1 that do not affect the AFB1::AFB1-GUS transgenic construct, modifications such as mir393 mediated gene regulation. Interestingly, ABA downregulates AFB1 expression based on results with the reporter constructs. This finding was corroborated by RT-PCR results, which clearly show the down-regulation of AFB1 in response to ABA. In contrast to ABA, gibberellic acid dramatically induces AFB1 expression as shown in reporter gene expression and RT-PCR results. However, the down-regulation of AFB1 at high concentrations of GA was not evident in RT-PCR results. The expression pattern in response to all the treatments was similar in both shoots and roots. AFB2 expression is down-regulated by salinity, osmotic stress and ABA Salinity, osmotic stress and ABA down-regulate AFB2 at all concentrations tested according to reporter gene expression as well as RT PCR results. Even though AFB2 is down-regulated by above treatments, GA induces its expression at low concentrations
96 83 and down-regulates it at high concentrations, following a similar pattern as observed with TIR1 and AFB1 reporter constructs. These expression patterns are evident in both reporter gene expression as well as RT-PCR data. AFB3 follows the similar expression pattern as AFB2 except in response to ABA Similar to AFB2, AFB3 is also down-regulated by salinity and osmotic stress as shown in reporter gene expression and RT-PCR data. However unlike AFB2, the expression of AFB3 is up-regulated by low concentrations of ABA but down-regulated by high concentrations of ABA as evident from AFB3::GUS and AFB3::AFB3-GUS expression. This differential regulation is also evident in RT-PCR analysis. In response to GA, AFB3 is up-regulated at low concentrations and down-regulated at high concentrations as observed with the other genes. Considering the expression patterns of all four genes, TIR1 behaves differently from AFBs in response to salinity and osmotic stress. However, TIR1 and AFB3 show a similar expression pattern in response to ABA. AFB1 and AFB2 show a similar expression pattern with each other, which is different from that of TIR1 and AFB3 expression. Gibberellic acid regulates the expression of all four genes in a similar fashion. Despite being in the same family, each auxin receptor gene contributes differently to auxin signaling in response to different environmental cues. Low phosphate availability induces TIR1 expression, but not other AFBs expression (Torres et al., 2008). Also AFB3, but not other receptor genes, is involved in changing the root system architecture in response to nitrate (Vidal et al., 2009). Therefore, the observed results in
97 84 this study along with previous studies further confirm the complexity of the regulation of auxin receptor genes by different environmental factors. mir393 expression is enhanced by salinity, ABA and GA One known post-transcriptional mechanism that regulates gene expression is RNA silencing. Sequence specific mrna degradation occurs during RNA silencing mediated by 20 to 24 nucleotide RNAs known as micrornas (mirnas) and short interfering RNAs (sirnas). According to previous studies, TIR1/AFBs are negatively regulated by mir393 and sirnas. In addition, the origin of mir393 varies depending on the factor that triggers it such as microbes, nitrates or developmental stage (Navarro et al., 2006, Vidal et al., 2010, Ammour et al., 2011). Therefore, the expression of mir393a and mir393b was studied using transcriptional GFP fusion constructs. In wild type seedlings, expression of mir393a::gfp is considerably lower than that of mir393b::gfp (Figure 6.1 and 7.1). Additionally, the expression of mir393a::gfp is confined to periphery of the root while the expression of mir393b::gfp is mainly seen in the central vascular region of the root. Salinity induces the expression of both mir393a::gfp and mir393b::gfp, and the induction is very prominent with mir393b::gfp (Figure 6.1 and 7.1). Moreover, mir393b::gfp expression that is normally confined to the central vascular region in untreated seedlings can be seen in the periphery of the root when treated with NaCl. Conversely, mannitol treatment downregulates mir393a::gfp expression, but induces mir393b::gfp expression. ABA and GA show similar effects on the expression of both mir393a::gfp and mir393b::gfp. These hormones up-regulate the expression of these genes at low concentrations but
98 85 down-regulate the expression at higher concentrations (Figures 7.3, 7.4, 8.3 & 8.4). These results suggest the possible involvement of mir393a and mir393b in regulation of auxin receptor genes in response to NaCl, osmotic stress, ABA and GA. It is important to notice that mir393 silencing of auxin receptor genes is a tightly regulated process. According to Navarro et al. (2006), mir393a derived mir393 cleaves TIR1, AFB2 and AFB3 transcripts but not AFB1 transcripts in response to bacterial flagellin22. However, only AFB3 but not TIR1, AFB1 or AFB2 transcripts are cleaved by mir393 in response to nitrate (Vidal et al., 2010). All four mrnas (TIR1, AFB1, AFB2 and AFB3) are cleaved by mir393 derived predominantly from mir393b in developing leaves (Ammour et al., 2011). In rice there are two members of the mir393 family named mir393 and mir393b. But only mir393 not mir393b is regulated by salinity and alkaline stress (Gao et al., 2010). Therefore, according to the results it is evident that TIR1 transcripts may not be subjected to mir393 cleavage in response to salinity, osmotic stress and ABA. Also the AFB3 transcripts are not likely to be degraded by mir393 in response to ABA; however, mir393 may degrade AFB3 transcripts in response to salinity and osmotic stress. It is also possible that the down-regulation of AFB1 and AFB2 in response to salinity, osmotic stress and ABA is due to the cleavage of their transcripts by mir393. Interestingly, even though mir393a and mir393b are induced by gibberellic acid, it also induces all the auxin receptor genes. This induction may serve to maintain adequate level of transcripts of auxin receptor genes, or alternatively, mir393 may have a different function in response to GA. Depending on the level of induction in expression, mir393 may be mainly derived from mir393b with respect to salinity, osmotic stress and ABA.
99 86 However, this possibility needs to be further investigated. The newly identified sirnas derived from AFB2 and AFB3 (Ammour et al., 2011) are additional components that have to be considered as regulating the level of auxin receptor transcripts in response to salinity, osmotic stress, ABA and GA, as AFB2 and AFB3 expression is regulated by above conditions. Auxin receptor mutants show different levels of resistance to salinity, osmotic stress, ABA and GA In order to support the histochemical and molecular genetic data, a phenotypic study was carried out using auxin receptor mutants. The seeds were grown on media containing concentrations of NaCl, mannitol, ABA or GA at which more than 50% of wild type seeds were arrested after germination. The percentage of seedlings with green cotyledons was calculated as an indicator of response to the above treatments. Single, double, triple and quadruple mutants were used in this study. However, as mutants were not available in the same ecotype, mutants generated in two different ecotypes (Ws and Col-0) were used. Although it is difficult to draw definitive conclusions since the two ecotypes behave differently in response to same stress conditions, some important observations can be used to explain the involvement of TIR1/AFBs in stress response. All four receptor mutants are resistant to NaCl and mannitol, suggesting their common function in responding to the above stresses. Even though all are resistant, they confer different levels of resistance. The disrepant resistance indicates the differential contribution of each receptor in auxin signaling in response to salinity. It is also possible that the severity of the mutant, depending on the site of the mutation in each receptor
100 87 gene, confers different levels of resistance to above conditions. TIR1 makes the major contribution followed by AFB2, AFB3 and AFB1, respectively. The double mutant afb2/afb3 and triple mutant afb1/afb2/afb3 show very high resistance, suggesting their synergistic effect. However, the afb1/afb3 double mutant shows a low level of resistance probably due to the stronger effects of TIR1 and AFB2, which make the greatest contribution to the auxin signaling (Parry et al., 2009). As TIR1 expression is induced by above conditions it may modulate transcription of genes via SCF TIR1 required for salinity and osmotic stress responses. Therefore, the misregulation of target gene expression by auxin receptor mutants may result in their resistance to salinity and osmotic stress. The distantly related receptor homolog mutant afb5-1 also shows moderate resistance to osmotic stress but not to salinity stress. Interestingly tir1-9 in Ws ecotype shows resistance to NaCl and mannitol while tir1-1 in Col-0 ecotype shows sensitivity to the same conditions. Therefore, it is likely that there are other genetic factors causing above differences that have to be further investigated. It is also important to notice that tir1-9 is a knockout mutant but tir1-1 has a point mutation. Therefore the absence of TIR1 in tir1-9 and presence of defective TIR1 in tir1-1 may also be a reason for the above observation. The single mutant afb2-1 shows the highest resistance to ABA followed by tir1-9, afb3-1, afb1-1 and afb5-1, respectively. Therefore, AFB2 may have the most important role in auxin-aba crosstalk. Similar to their resistance to salinity and osmotic stress, double mutants are also resistant to ABA. However, the afb1-1/afb2-1/afb3-1 triple mutant does not show a synergistic effect; rather it exhibits an epistatic effect (Figure 8.4 b) by afb1-1 over afb2-1 and afb3-1 because, afb1-1/afb2-1/afb3-1 triple mutant does not
101 88 exceed the level of resistance of afb1-1. Interestingly, in contrast to ABA resistance, all the auxin receptors except afb1 show completely opposite response to gibberellic acid. While tir1-9, afb2-1, afb3-1 and afb5-1 are sensitive to GA, afb1-1 shows resistance. Therefore, AFB1 might function as a negative regulator of auxin signaling, opposite to other receptor genes in auxin-gibberellic acid crosstalk. The afb1-1/afb3-1 double mutant and afb1-1/afb2-1/afb3-1 triple mutant also show resistance, suggesting the strong effect of afb1-1 over the others. Surprisingly, the afb2-1/afb3-1 double mutant shows resistance to GA, which cannot be explained without further investigations. If a phenotype shown by a mutant is its own direct effect, over expression of the wild type gene in mutant background should generally recover the phenotype. Therefore, the sensitive phenotype shown by tir1-1 in Col-0 ecotype in response to salinity, osmotic stress, ABA and GA was complemented with TIR1 over-expression in tir1-1 background. Interestingly, TIR1 over-expression recovered the sensitive phenotype of tir1-1 in response to salinity, osmotic stress and GA, and partially recovered the sensitivity to ABA (Figure 9.1). These results provide strong evidence that TIR1 is directly involved in modulating auxin signaling in response to salinity, osmotic stress, ABA and GA. A transgenic line over-expressing AFB1 in tir1-1[col-0] was used to understand the AFB1 function in stress responses as it showed some differences compared to other auxin receptor proteins. Previous work has shown that although both TIR1 and AFB1 interact with auxin, neither AFB1 nor AFB2 complement the auxin resistant root phenotype of tir1-1 (Parry et al., 2009). According to the germination assay, tir1-1 and wild type Col- 0 were sensitive to both NaCl and mannitol, and over-expression of AFB1 resulted in resistance to these stresses. However, results show that tir1-1 phenotype in response to
102 89 ABA and GA can be complemented by over-expression of AFB1 in a tir1-1 background, suggesting that both TIR1 and AFB1 may have redundant function in response to these hormones. The TIR1 promoter contains a bona fide ABA responsive element (ABRE) The interaction of ABRE with transcriptional factors ABFs/AREBs induces the ABA responsive genes (Raghavendra et al., 2010). Therefore, the majority of ABA induced genes contain the consensus ABRE sequence ACGTGG/TC. The core motif ACGT is the binding site for ABFs (Choi et al., 1999). In a study to determine ABRE sequence requirements for ABA induction, it was found that the change in G, T or C following ACGT core motif abolishes the induction by ABA (Hattori et al., 2002). The TIR1 promoter contains a putative ABRE, 141 bp upstream of the putative start codon. TIR1 expression is induced by ABA as discussed above. In order to determine the validity of the putative ABRE in TIR1 promoter, ACGTGTC was changed to ACGTCTC to generate TIR1 mabre ::GUS (mutated) construct. As expected, ABA does not induce TIR1 mabre ::GUS expression (Figure 12), suggesting that this is a bona fide ABRE sequence. Therefore, the induction of TIR1 in response to ABA may be mediated through the binding of ABFs to ABRE. Bioinformatics analysis of F-box auxin receptor promoters In an effort to analyze the auxin receptor promoters using ATHENA, ATHAMAP, PROMOTER web base applications and AGRIS data base, several cisregulatory elements related to salinity, osmotic stress, ABA and GA were identified.
103 90 Among them, ABRE like, At MYC2 BS RD22, At MYB2 BS RD22, GARE and drought response element were the most prominent regulatory sequences found. The ABRE like cis-regulatory element present in TIR1 promoter was confirmed as a bona fide ABRE as discussed above. AFB1 also contains an ABRE like sequence. However, it has a higher e- value compared to the ABRE in TIR1 promoter suggesting a lower possibility of being a genuine ABRE. The other two receptor genes AFB2 and AFB3 do not contain recognizable ABREs in their promoters. A drought response element, which is a target site for DREB (dehydration responsive element binding) factors (Agarwal et al., 2006), is located in TIR1 promoter. MYC2 and MYB2 are two transcription factors that bind to ABA inducible gene RD22. It is also known that some of the other ABA inducible genes contain MYC2 and MYB2 binding sequences similar to those found in RD22 (Abe et al., 2003), which are called At MYC2 BS RD22 and At MYB2 BS RD22. Interestingly, all the F-box auxin receptor genes contain MYC2 BS RD22 elements. MYB2 BS RD22 is also present in all genes except TIR1. Gibberellic acid responsive elements are responsible for the induction of many GA responsive genes. All the auxin receptor genes are induced by GA. The presence of GAREs in all the receptor genes suggests the involvement of GA in their induction. Nevertheless, validity of these putative cisregulatory elements has to be experimentally determined. However, the induction of TIR1 in response to osmotic stress and ABA can be explained by the presence of ABA response element and drought response element in its promoter. Also the AFB3 induction by ABA might be mediated through MYC2 BS RD22, MYB2 BS RD22 or both. Nevertheless, down-regulation of AFB1 and AFB2 in response to ABA despite the presence of relevant cis-regulatory elements has to be addressed.


104 91 Figure 13. A schematic diagram to illustrate possible regulation of TIR1/AFBs in response to salinity, osmotic stress, ABA and GA. + indicates the up-regulation and - indicates the down-regulation. Salinity and osmotic stress enhance ABA signaling. GA and ABA act antagonistically. Salinity and osmotic stress up-regulate TIR1 but down-regulate AFBs. ABA up-regulates TIR1 and AFB3 but down-regulate AFB1 and AFB2. Up-regulation of TIR1 by ABA may occur through ABRE. GA up-regulates all four receptor genes. Salinity, osmotic stress, ABA and GA up-regulate mir393. mir393 may down-regulate AFBs but not TIR1 in response to salinity and osmotic stress. It may down-regulate AFB1 and AFB2 but not TIR1 and AFB3 in response to ABA. mir393 may not down-regulate auxin receptor gene expression in response to GA.
23-. Shoot and root development depend on ratio of IAA/CK
 Balance of Hormones regulate growth and development Environmental factors regulate hormone levels light- e.g. phototropism gravity- e.g. gravitropism temperature Mode of action of each hormone 1. Signal
Figure 1. Identification of UGT74E2 as an IBA glycosyltransferase. (A) Relative conversion rates of different plant hormones to their glucosylated
 Relative conversion rates of different plant hormones to their glucosylated") Figure 1. Identification of UGT74E2 as an IBA glycosyltransferase. (A) Relative conversion rates of different plant hormones to their glucosylated form by recombinant UGT74E2. The naturally occurring auxin
Figure 1. Identification of UGT74E2 as an IBA glycosyltransferase. (A) Relative conversion rates of different plant hormones to their glucosylated form by recombinant UGT74E2. The naturally occurring auxin
Characterisation of abiotic stress inducible plant promoters and bacterial genes for osmotolerance using transgenic approach
 Characterisation of abiotic stress inducible plant promoters and bacterial genes for osmotolerance using transgenic approach ABSTRACT SUBMITTED TO JAMIA MILLIA ISLAMIA NEW DELHI IN PARTIAL FULFILMENT OF
Major Plant Hormones 1.Auxins 2.Cytokinins 3.Gibberelins 4.Ethylene 5.Abscisic acid
 Plant Hormones Lecture 9: Control Systems in Plants What is a Plant Hormone? Compound produced by one part of an organism that is translocated to other parts where it triggers a response in target cells
10/4/2017. Chapter 39
 Chapter 39 1 Reception 1 Reception 2 Transduction CYTOPLASM CYTOPLASM Cell wall Plasma membrane Phytochrome activated by light Cell wall Plasma membrane Phytochrome activated by light cgmp Second messenger
Plant Growth and Development
 Plant Growth and Development Concept 26.1 Plants Develop in Response to the Environment Factors involved in regulating plant growth and development: 1. Environmental cues (e.g., day length) 2. Receptors
CONTROL OF PLANT GROWTH AND DEVELOPMENT BI-2232 RIZKITA R E
 CONTROL OF PLANT GROWTH AND DEVELOPMENT BI-2232 RIZKITA R E The development of a plant the series of progressive changes that take place throughout its life is regulated in complex ways. Factors take part
Ph.D. thesis. Study of proline accumulation and transcriptional regulation of genes involved in this process in Arabidopsis thaliana
 Ph.D. thesis Study of proline accumulation and transcriptional regulation of genes involved in this process in Arabidopsis thaliana Written by: Edit Ábrahám Temesváriné Supervisors: Dr. László Szabados
BIO1PS 2012 Plant Science Lecture 4 Hormones Pt. I
 BIO1PS 2012 Plant Science Lecture 4 Hormones Pt. I Dr. Michael Emmerling Department of Botany Room 410 m.emmerling@latrobe.edu.au Hormones and Ghost gum Eucalyptus papuana Coordination ~3 Lectures Leaves
CHARACTERIZATION OF AFB5 IN ARABIDOPSIS AUXIN SIGNALING by. Lauren Minter, B.S.
 CHARACTERIZATION OF AFB5 IN ARABIDOPSIS AUXIN SIGNALING by Lauren Minter, B.S. A thesis submitted to the Graduate Council of Texas State University in partial fulfillment of the requirements for the degree
GENETIC ANALYSES OF ROOT SYSTEM DEVELOPMENT IN THE TOMATO CROP MODEL
 GENETIC ANALYSES OF ROOT SYSTEM DEVELOPMENT IN THE TOMATO CROP MODEL Kelsey Hoth 1 Dr. Maria Ivanchenko 2 Bioresourse Research 1, Department of Botany and Plant Physiology 2, Oregon State University, Corvallis,
Chapter 1 Introduction
 Chapter 1 Introduction 1. INTRODUCTION Plants being sessile are exposed to environmental stresses mainly abiotic, caused by non-living effects of environment (temperature extremes, drought, and salinity)
Plant Development. Chapter 31 Part 1
 Plant Development Chapter 31 Part 1 Impacts, Issues Foolish Seedlings, Gorgeous Grapes Gibberellin and other plant hormones control the growth and development of plants environmental cues influence hormone
Reproduction, Seeds and Propagation
 Reproduction, Seeds and Propagation Diploid (2n) somatic cell Two diploid (2n) somatic cells Telophase Anaphase Metaphase Prophase I One pair of homologous chromosomes (homologues) II Homologues condense
Cytokinin. Fig Cytokinin needed for growth of shoot apical meristem. F Cytokinin stimulates chloroplast development in the dark
 Cytokinin Abundant in young, dividing cells Shoot apical meristem Root apical meristem Synthesized in root tip, developing embryos, young leaves, fruits Transported passively via xylem into shoots from
EXPRESSION OF THE FIS2 PROMOTER IN ARABIDOPSIS THALIANA
 EXPRESSION OF THE FIS2 PROMOTER IN ARABIDOPSIS THALIANA Item Type text; Electronic Thesis Authors Bergstrand, Lauren Janel Publisher The University of Arizona. Rights Copyright is held by the author. Digital
Leucine-rich repeat receptor-like kinases (LRR-RLKs), HAESA, ERECTA-family
, HAESA, ERECTA-family") Leucine-rich repeat receptor-like kinases (LRR-RLKs), HAESA, ERECTA-family GENES & DEVELOPMENT (2000) 14: 108 117 INTRODUCTION Flower Diagram INTRODUCTION Abscission In plant, the process by which a plant
Leucine-rich repeat receptor-like kinases (LRR-RLKs), HAESA, ERECTA-family GENES & DEVELOPMENT (2000) 14: 108 117 INTRODUCTION Flower Diagram INTRODUCTION Abscission In plant, the process by which a plant
CONTROL SYSTEMS IN PLANTS
 AP BIOLOGY PLANTS FORM & FUNCTION ACTIVITY #5 NAME DATE HOUR CONTROL SYSTEMS IN PLANTS HORMONES MECHANISM FOR HORMONE ACTION Plant Form and Function Activity #5 page 1 CONTROL OF CELL ELONGATION Plant
Questions for Biology IIB (SS 2006) Wilhelm Gruissem
 Wilhelm Gruissem") Questions for Biology IIB (SS 2006) Plant biology Wilhelm Gruissem The questions for my part of Biology IIB, Plant Biology, are provided for self-study and as material for the exam. Please note that the
Questions for Biology IIB (SS 2006) Plant biology Wilhelm Gruissem The questions for my part of Biology IIB, Plant Biology, are provided for self-study and as material for the exam. Please note that the
Useful Propagation Terms. Propagation The application of specific biological principles and concepts in the multiplication of plants.
 Useful Propagation Terms Propagation The application of specific biological principles and concepts in the multiplication of plants. Adventitious Typically describes new organs such as roots that develop
Life Science Journal 2014;11(9) Cryptochrome 2 negatively regulates ABA-dependent seed germination in Arabidopsis
 Cryptochrome 2 negatively regulates ABA-dependent seed germination in Arabidopsis") Cryptochrome 2 negatively regulates ABA-dependent seed germination in Arabidopsis Sung-Il Kim 1, Sang Ik Song 3, Hak Soo Seo 1, 2, 4 * 1 Department of Plant Science and Research Institute of Agriculture
Cryptochrome 2 negatively regulates ABA-dependent seed germination in Arabidopsis Sung-Il Kim 1, Sang Ik Song 3, Hak Soo Seo 1, 2, 4 * 1 Department of Plant Science and Research Institute of Agriculture
HRS1 Acts as a Negative Regulator of Abscisic Acid Signaling to Promote Timely Germination of Arabidopsis Seeds
 HRS1 Acts as a Negative Regulator of Abscisic Acid Signaling to Promote Timely Germination of Arabidopsis Seeds Chongming Wu 1,2., Juanjuan Feng 1,2., Ran Wang 1,2, Hong Liu 1,2, Huixia Yang 1,2, Pedro
Regulation of Transcription in Eukaryotes. Nelson Saibo
 Regulation of Transcription in Eukaryotes Nelson Saibo saibo@itqb.unl.pt In eukaryotes gene expression is regulated at different levels 1 - Transcription 2 Post-transcriptional modifications 3 RNA transport
can affect division, elongation, & differentiation of cells to another region of plant where they have an effect
 Note that the following is a rudimentary outline of the class lecture; it does not contain everything discussed in class. Plant Hormones Plant Hormones compounds regulators growth or can affect division,
** * * * Col-0 cau1 CAU1. Actin2 CAS. Actin2. Supplemental Figure 1. CAU1 affects calcium accumulation.
 Ca 2+ ug g -1 DW Ca 2+ ug g -1 DW Ca 2+ ug g -1 DW Supplemental Data. Fu et al. Plant Cell. (213). 1.115/tpc.113.113886 A 5 4 3 * Col- cau1 B 4 3 2 Col- cau1 ** * * ** C 2 1 25 2 15 1 5 Shoots Roots *
Abscisic Acid Represses Growth of the Arabidopsis Embryonic Axis after Germination by Enhancing Auxin Signaling W
 The Plant Cell, Vol. 21: 2253 2268, August 2009, www.plantcell.org ã 2009 American Society of Plant Biologists Abscisic Acid Represses Growth of the Arabidopsis Embryonic Axis after Germination by Enhancing
Figure 18.1 Blue-light stimulated phototropism Blue light Inhibits seedling hypocotyl elongation
 Blue Light and Photomorphogenesis Q: Figure 18.3 Blue light responses - phototropsim of growing Corn Coleoptile 1. How do we know plants respond to blue light? 2. What are the functions of multiple BL
CONTROL OF GROWTH BY HORMONES
 CONTROL OF GROWTH BY HORMONES Growth and organogenesis are controlled......by genes (independent of environment): e.g., number of primary vascular bundles, general shape of a leaf or flower...by genes
Stress Effects on Myosin Mutant Root Length in Arabidopsis thaliana
 University of Tennessee, Knoxville Trace: Tennessee Research and Creative Exchange University of Tennessee Honors Thesis Projects University of Tennessee Honors Program 5-2011 Stress Effects on Myosin
Supplemental Data. Perrella et al. (2013). Plant Cell /tpc
. Plant Cell /tpc") Intensity Intensity Intensity Intensity Intensity Intensity 150 50 150 0 10 20 50 C 150 0 10 20 50 D 0 10 20 Distance (μm) 50 20 40 E 50 F 0 10 20 50 0 15 30 Distance (μm) Supplemental Figure 1: Co-localization
Intensity Intensity Intensity Intensity Intensity Intensity 150 50 150 0 10 20 50 C 150 0 10 20 50 D 0 10 20 Distance (μm) 50 20 40 E 50 F 0 10 20 50 0 15 30 Distance (μm) Supplemental Figure 1: Co-localization
Regulation of Phosphate Homeostasis by microrna in Plants
 Regulation of Phosphate Homeostasis by microrna in Plants Tzyy-Jen Chiou 1 *, Kyaw Aung 1,2, Shu-I Lin 1,3, Chia-Chune Wu 1, Su-Fen Chiang 1, and Chun-Lin Su 1 Abstract Upon phosphate (Pi) starvation,
The sucrose non-fermenting-1-related protein kinases SAPK1 and SAPK2 function collaboratively as positive regulators of salt stress tolerance in rice
 Lou et al. BMC Plant Biology (2018) 18:203 https://doi.org/10.1186/s12870-018-1408-0 RESEARCH ARTICLE Open Access The sucrose non-fermenting-1-related protein kinases SAPK1 and SAPK2 function collaboratively
Bio 100 Guide 27.
 Bio 100 Guide 27 http://www.offthemarkcartoons.com/cartoons/1994-11-09.gif http://www.cneccc.edu.hk/subjects/bio/album/chapter20/images/plant_growth.jpg http://pgjennielove.files.wordpress.com/2008/06/apical_meristem.png
Chapter 39. Plant Reactions. Plant Hormones 2/25/2013. Plants Response. What mechanisms causes this response? Signal Transduction Pathway model
 Chapter 39 Plants Response Plant Reactions Stimuli & a Stationary life Animals respond to stimuli by changing behavior Move toward positive stimuli Move away from negative stimuli Plants respond to stimuli
CBSE Quick Revision Notes (Class-11 Biology) CHAPTER-15 PLANT GROWTH AND DEVELOPMENT
 CHAPTER-15 PLANT GROWTH AND DEVELOPMENT") CBSE Quick Revision Notes (Class-11 Biology) CHAPTER-15 PLANT GROWTH AND DEVELOPMENT Root, stem leaves, flower, fruits and seeds arise in orderly manner in plants. The sequence of growth is as follows-
CBSE Quick Revision Notes (Class-11 Biology) CHAPTER-15 PLANT GROWTH AND DEVELOPMENT Root, stem leaves, flower, fruits and seeds arise in orderly manner in plants. The sequence of growth is as follows-
By Jonathan I. Watkinson. Virginia Polytechnic Institute and State University. Doctor of Philosophy Horticulture
 Characterization of two genes, trehalose-6-phosphate synthase/phosphatase and nucleotide binding protein, shown to be differentially regulated in roots of Cypripedium parviflorum var. pubescens grown with
Genetic Characterization and Functional Analysis of the GID1 Gibberellin Receptors in Arabidopsis W
 The Plant Cell, Vol. 18, 3399 3414, December 2006, www.plantcell.org ª 2006 American Society of Plant Biologists Genetic Characterization and Functional Analysis of the GID1 Gibberellin Receptors in Arabidopsis
Plants are sessile. 10d-17/giraffe-grazing.jpg
 Plants are sessile www.mccullagh.org/db9/ 10d-17/giraffe-grazing.jpg Plants have distinct requirements because of their sessile nature Organism-level requirements Must adjust to environment at given location
Chapter 33 Control Systems in Plants
 Chapter 33 Control Systems in Plants PowerPoint Lectures for Biology: Concepts & Connections, Sixth Edition Campbell, Reece, Taylor, Simon, and Dickey Copyright 2009 Pearson Education, Inc. Lecture by
Electromagenetic spectrum
 Light Controls of Plant Development 1 Electromagenetic spectrum 2 Light It is vital for photosynthesis and is also necessary to direct plant growth and development. It acts as a signal to initiate and
Introduction. Gene expression is the combined process of :
 1 To know and explain: Regulation of Bacterial Gene Expression Constitutive ( house keeping) vs. Controllable genes OPERON structure and its role in gene regulation Regulation of Eukaryotic Gene Expression
AND MOLECULAR CHARACT~RIZATION. By DEBORAH MARIE LONG,
 NITRATE REDUCTA3E IN MAIZE ROOTS: LOCALIZATION AND MOLECULAR CHARACT~RIZATION By DEBORAH MARIE LONG, B.Sc. A Thesis Submitted to the School of Graduate Studies in Partial Fulfilment of the Requirements
7.06 Problem Set #4, Spring 2005
 7.06 Problem Set #4, Spring 2005 1. You re doing a mutant hunt in S. cerevisiae (budding yeast), looking for temperaturesensitive mutants that are defective in the cell cycle. You discover a mutant strain
NATURAL VARIATION IN THE CYTOKININ METABOLIC NETWORK IN ARABIDOPSIS THALIANA
 NATURAL VARIATION IN THE CYTOKININ METABOLIC NETWORK IN ARABIDOPSIS THALIANA PŘÍRODNÍ VARIACE METABOLISMU CYTOKININŮ U ARABIDOPSIS THALIANA Samsonová Z. 1, 2, 3, Kuklová A. 1, 2, Mazura P. 1, 2, Rotková
Complete all warm up questions Focus on operon functioning we will be creating operon models on Monday
 Complete all warm up questions Focus on operon functioning we will be creating operon models on Monday 1. What is the Central Dogma? 2. How does prokaryotic DNA compare to eukaryotic DNA? 3. How is DNA
Photoreceptor Regulation of Constans Protein in Photoperiodic Flowering
 Photoreceptor Regulation of Constans Protein in Photoperiodic Flowering by Valverde et. Al Published in Science 2004 Presented by Boyana Grigorova CBMG 688R Feb. 12, 2007 Circadian Rhythms: The Clock Within
Arabidopsis thaliana. Lucia Strader. Assistant Professor, Biology
 Arabidopsis thaliana Lucia Strader Assistant Professor, Biology Arabidopsis as a genetic model Easy to grow Small genome Short life cycle Self fertile Produces many progeny Easily transformed HIV E. coli
Actions of auxin. Hormones: communicating with chemicals History: Discovery of a growth substance (hormone- auxin)
") Hormones: communicating with chemicals History- discovery of plant hormone. Auxin Concepts of hormones Auxin levels are regulated by synthesis/degradation, transport, compartmentation, conjugation. Polar
Hormones: communicating with chemicals History- discovery of plant hormone. Auxin Concepts of hormones Auxin levels are regulated by synthesis/degradation, transport, compartmentation, conjugation. Polar
THE ROLE OF THE PHYTOCHROME B PHOTORECEPTOR IN THE REGULATION OF PHOTOPERIODIC FLOWERING. AnitaHajdu. Thesis of the Ph.D.
 THE ROLE OF THE PHYTOCHROME B PHOTORECEPTOR IN THE REGULATION OF PHOTOPERIODIC FLOWERING AnitaHajdu Thesis of the Ph.D. dissertation Supervisor: Dr. LászlóKozma-Bognár - senior research associate Doctoral
Supplementary Materials for
 www.sciencesignaling.org/cgi/content/full/9/452/ra106/dc1 Supplementary Materials for Stem-piped light activates phytochrome B to trigger light responses in Arabidopsis thaliana roots Hyo-Jun Lee, Jun-Ho
SMALL AUXIN UP RNA (SAUR) genes are the largest class of primary auxin (growth
 genes are the largest class of primary auxin (growth") Abstract SMALL AUXIN UP RNA (SAUR) genes are the largest class of primary auxin (growth hormone) responsive genes in all land plants, many of which are expressed in actively growing plant tissues. This
Abstract SMALL AUXIN UP RNA (SAUR) genes are the largest class of primary auxin (growth hormone) responsive genes in all land plants, many of which are expressed in actively growing plant tissues. This
Chapter 39. Plant Response. AP Biology
 Chapter 39. Plant Response 1 Plant Reactions Stimuli & a Stationary Life u animals respond to stimuli by changing behavior move toward positive stimuli move away from negative stimuli u plants respond
Biological Roles of Cytokinins
 Direct Control of Shoot Meristem Activity by a Cytokinin-Activating Enzyme By Kurakawa et. Al. Published in Nature Presented by Boyana Grigorova Biological Roles of Cytokinins Cytokinins are positive regulators
Epigenetics and Flowering Any potentially stable and heritable change in gene expression that occurs without a change in DNA sequence
 Epigenetics and Flowering Any potentially stable and heritable change in gene expression that occurs without a change in DNA sequence www.plantcell.org/cgi/doi/10.1105/tpc.110.tt0110 Epigenetics Usually
Supplementary Figure 1
 Supplementary Figure 1 Supplementary Figure 1. HSP21 expression in 35S:HSP21 and hsp21 knockdown plants. (a) Since no T- DNA insertion line for HSP21 is available in the publicly available T-DNA collections,
Genetic interaction and phenotypic analysis of the Arabidopsis MAP kinase pathway mutations mekk1 and mpk4 suggests signaling pathway complexity
 Genetic interaction and phenotypic analysis of the Arabidopsis MAP kinase pathway mutations mekk1 and mpk4 suggests signaling pathway complexity Shih-Heng Su, Maria Cristina Suarez-Rodriguez, Patrick Krysan
Other funding Sources Agency Name: MSU Agricultural Experiment Station /Project GREEEN Amount requested or awarded: 30,000
 FINAL PROJECT REPORT Project Title: Functional genomics of flowering in apple PI: Herb Aldwinckle Co-PI(2): Steve VanNocker Organization: Cornell University Organization: Michigan State University Telephone/email:
Biology 213 Exam 3 Practice Key
 Biology 213 Practice Key 1. (4) Explain the difference between a macronutrient and a micronutrient and cite two examples of each category? Macronutrients are the minerals needed by the plant in greater
Arabidopsis PPR40 connects abiotic stress responses to mitochondrial electron transport
 Ph.D. thesis Arabidopsis PPR40 connects abiotic stress responses to mitochondrial electron transport Zsigmond Laura Supervisor: Dr. Szabados László Arabidopsis Molecular Genetic Group Institute of Plant
(A) Ethylene (B) Absisic acid (C) Auxin (D) Gibberellin (E) Cytokinin
 Ethylene (B) Absisic acid (C) Auxin (D) Gibberellin (E) Cytokinin") College Biology - Problem Drill 17: Plant Function Question No. 1 of 10 1. Which of the following plant hormones is responsible for phototropism? Question #01 (A) Ethylene (B) Absisic acid (C) Auxin (D)
College Biology - Problem Drill 17: Plant Function Question No. 1 of 10 1. Which of the following plant hormones is responsible for phototropism? Question #01 (A) Ethylene (B) Absisic acid (C) Auxin (D)
PLANT HORMONES-Introduction
 PLANT HORMONES-Introduction By convention hormone are said to be a substances whose site of synthesis and site of action are different; the two events are separated by space and time. Hormones are known
Plant Stimuli pp Topic 3: Plant Behaviour Ch. 39. Plant Behavioural Responses. Plant Hormones. Plant Hormones pp
 Topic 3: Plant Behaviour Ch. 39 Plants exist in environments that are constantly changing. Like animals, plants must be able to detect and react to stimuli in the environment. Unlike animals, plants can
The Clubroot Pathogen (Plasmodiophora brassicae) Influences Auxin Signaling to Regulate Auxin Homeostasis in Arabidopsis
 Influences Auxin Signaling to Regulate Auxin Homeostasis in Arabidopsis") Plants 2013, 2, 726-749; doi:10.3390/plants2040726 Article OPEN ACCESS plants ISSN 2223-7747 www.mdpi.com/journal/plants The Clubroot Pathogen (Plasmodiophora brassicae) Influences Auxin Signaling to Regulate
Plants 2013, 2, 726-749; doi:10.3390/plants2040726 Article OPEN ACCESS plants ISSN 2223-7747 www.mdpi.com/journal/plants The Clubroot Pathogen (Plasmodiophora brassicae) Influences Auxin Signaling to Regulate
Lipid transfer proteins confer resistance to trichothecenes
 Lipid transfer proteins confer resistance to trichothecenes John McLaughlin and Anwar Bin-Umer Tumer Laboratory National Fusarium Head Blight Forum December 6th, 2012 FY09-11: Identify trichothecene resistance
Utilizing Illumina high-throughput sequencing technology to gain insights into small RNA biogenesis and function
 Utilizing Illumina high-throughput sequencing technology to gain insights into small RNA biogenesis and function Brian D. Gregory Department of Biology Penn Genome Frontiers Institute University of Pennsylvania
The combined use of Arabidopsis thaliana and Lepidium sativum to find conserved mechanisms of seed germination within the Brassicaceae family
 www.seedbiology.de The combined use of Arabidopsis thaliana and Lepidium sativum to find conserved mechanisms of seed germination within the Brassicaceae family Linkies, A., Müller, K., Morris, K., Gräber,
A. Stimulus Response:
 Plant Hormones A. Stimulus Response: A house plant on a windowsill grows light. If you rotate the plant, it reorients its growth until its leaves face the window again. The growth of a shoot towards light
SOMNUS, a CCCH-Type Zinc Finger Protein in Arabidopsis, Negatively Regulates Light-Dependent Seed Germination Downstream of PIL5 W
 The Plant Cell, Vol. 20: 1260 1277, May 2008, www.plantcell.org ª 2008 American Society of Plant Biologists SOMNUS, a CCCH-Type Zinc Finger Protein in Arabidopsis, Negatively Regulates Light-Dependent
16 The Cell Cycle. Chapter Outline The Eukaryotic Cell Cycle Regulators of Cell Cycle Progression The Events of M Phase Meiosis and Fertilization
 The Cell Cycle 16 The Cell Cycle Chapter Outline The Eukaryotic Cell Cycle Regulators of Cell Cycle Progression The Events of M Phase Meiosis and Fertilization Introduction Self-reproduction is perhaps
Plant hormones. Characteristics
 Plant hormones Plant hormones (also known as phytohormones) are chemicals that regulate plant growth, which, in the UK, are termed 'plant growth substances'. Plant hormones are signal molecules produced
Supplemental Data. Hou et al. (2016). Plant Cell /tpc
. Plant Cell /tpc") Supplemental Data. Hou et al. (216). Plant Cell 1.115/tpc.16.295 A Distance to 1 st nt of start codon Distance to 1 st nt of stop codon B Normalized PARE abundance 8 14 nt 17 nt Frame1 Arabidopsis inflorescence
Supplemental Data. Hou et al. (216). Plant Cell 1.115/tpc.16.295 A Distance to 1 st nt of start codon Distance to 1 st nt of stop codon B Normalized PARE abundance 8 14 nt 17 nt Frame1 Arabidopsis inflorescence
Abiotic Stress in Crop Plants
 1 Abiotic Stress in Crop Plants Mirza Hasanuzzaman, PhD Professor Department of Agronomy Sher-e-Bangla Agricultural University E-mail: mhzsauag@yahoo.com Stress Stress is usually defined as an external
Responses to Light. Responses to Light
 Sensory Systems in Plants Chapter 41 Pigments other than those used in photosynthesis can detect light and mediate the plant s response to it Photomorphogenesis refers to nondirectional, light-triggered
GFP GAL bp 3964 bp
 Supplemental Data. Møller et al. (2009) Shoot Na + exclusion and increased salinity tolerance engineered by cell type-specific alteration of Na + transport in Arabidopsis Supplemental Figure 1. Salt-sensitive
Department of Biology, Indiana University, Bloomington, Indiana 47405
 The Plant Cell, Vol. 20: 3258 3272, December 2008, www.plantcell.org ã 2008 American Society of Plant Biologists Phosphate Availability Alters Lateral Root Development in Arabidopsis by Modulating Auxin
Life Sciences 1a: Section 3B. The cell division cycle Objectives Understand the challenges to producing genetically identical daughter cells
 Life Sciences 1a: Section 3B. The cell division cycle Objectives Understand the challenges to producing genetically identical daughter cells Understand how a simple biochemical oscillator can drive the
Chapter 17. From Gene to Protein. Biology Kevin Dees
 Chapter 17 From Gene to Protein DNA The information molecule Sequences of bases is a code DNA organized in to chromosomes Chromosomes are organized into genes What do the genes actually say??? Reflecting
Ch Plant Hormones
 Ch. 39 Plant Hormones I. Plant Hormones Chemical signals that coordinate the parts of an organism. Only minute amounts are needed to get the desired response. Control plant growth and development by affecting
Elisabeth J Chapman and Mark Estelle
 Minireview Cytokinin and auxin intersection in root meristems Elisabeth J Chapman and Mark Estelle Address: Division of Biology, 9500 Gilman Drive, La Jolla, CA 92093-0116, USA. Correspondence: Mark Estelle.
7.06 Cell Biology EXAM #3 April 21, 2005
 7.06 Cell Biology EXAM #3 April 21, 2005 This is an open book exam, and you are allowed access to books, a calculator, and notes but not computers or any other types of electronic devices. Please write
Unit Two: Chemical Control
 Unit Two: Chemical Control 3.1 Plant growth and development are regulated by hormones Tropism is a biological phenomenon in which plants grow toward or away from an environmental stimulus, such as light,
Nature Genetics: doi: /ng Supplementary Figure 1. The phenotypes of PI , BR121, and Harosoy under short-day conditions.
 Supplementary Figure 1 The phenotypes of PI 159925, BR121, and Harosoy under short-day conditions. (a) Plant height. (b) Number of branches. (c) Average internode length. (d) Number of nodes. (e) Pods
POTASSIUM IN PLANT GROWTH AND YIELD. by Ismail Cakmak Sabanci University Istanbul, Turkey
 POTASSIUM IN PLANT GROWTH AND YIELD by Ismail Cakmak Sabanci University Istanbul, Turkey Low K High K High K Low K Low K High K Low K High K Control K Deficiency Cakmak et al., 1994, J. Experimental Bot.
SUPPLEMENTARY INFORMATION
 SUPPLEMENTARY INFORMATION doi:10.1038/nature10534 Supplementary Fig. 1. Diagrammatic representation of the N-end rule pathway of targeted proteolysis (after Graciet and Wellmer 2010 9 ). Tertiary, secondary
Plant Molecular and Cellular Biology Lecture 10: Plant Cell Cycle Gary Peter
 Plant Molecular and Cellular Biology Lecture 10: Plant Cell Cycle Gary Peter 9/10/2008 1 Learning Objectives Explain similarities and differences between fungal, mammalian and plant cell cycles Explain
Is that artificial turf or real grass? Its thicker than Bermuda!
 Is that artificial turf or real grass? Its thicker than Bermuda! 1 Using Plant Growth Regulators Growth regulators DO NOT interfere with plant respiration, photosynthesis, or other internal plant functions
Effect of Acetosyringone on Agrobacterium-mediated Transformation of Eustoma grandiflorum Leaf Disks
 JARQ 51 (4), 351-355 (2017) https://www.jircas.go.jp Improvement in Agrobacterium-mediated Transformation of Eustoma grandiflorum by Acetosyringone Effect of Acetosyringone on Agrobacterium-mediated Transformation
UNIVERSITY OF AGRICULTURAL SCIENCES AND VETERINARY MEDICINE
 UNIVERSITY OF AGRICULTURAL SCIENCES AND VETERINARY MEDICINE FACULTY OF HORTICULTURE OANA CIUZAN ROLE OF THE GLYCINE-RICH RNA-BINDING PROTEINS IN PLANT EARLY DEVELOPMENT AND ABIOTIC STRESS RESPONSE ABSTRACT
Plant Propagation PLS 3221/5222
 Plant Propagation PLS 3221/5222 Dr. Sandra Wilson Dr. Mack Thetford Chapter 2 Introduction to the Biology of Plant Propagation -A review- 1 5. Plant Hormones and Plant development Phytohormones Nt Naturally
Because plants have a sessile lifestyle, they must adjust to
 Vol 459j25 June 2009jdoi:10.1038/nature08122 REVIEWS Recent advances and emerging trends in plant hormone signalling Aaron Santner 1 & Mark Estelle 2 Plant growth and development is regulated by a structurally
Plant Growth Regulators(NCERT)
") Plant Growth Regulators(NCERT) Promoters: 1. Auxins: -first isolated from urine, contains Zinc. -Natural: Indole Acetic Acid (IAA) Indole Butyric Acid (IBA) -Synthetic: Naphthalene Acetic Acid (NAA) 2-4
Plant Growth Regulators(NCERT) Promoters: 1. Auxins: -first isolated from urine, contains Zinc. -Natural: Indole Acetic Acid (IAA) Indole Butyric Acid (IBA) -Synthetic: Naphthalene Acetic Acid (NAA) 2-4
Chapter 2 Cross-Talk Between Phytohormone Signaling Pathways Under Both Optimal and Stressful Environmental Conditions
 Chapter 2 Cross-Talk Between Phytohormone Signaling Pathways Under Both Optimal and Stressful Environmental Conditions Marcia A. Harrison Abstract The perception of abiotic stress triggers the activation
RNA Synthesis and Processing
 RNA Synthesis and Processing Introduction Regulation of gene expression allows cells to adapt to environmental changes and is responsible for the distinct activities of the differentiated cell types that
The Plant Cell, November. 2017, American Society of Plant Biologists. All rights reserved
 The Genetics of Floral Development Teaching Guide Overview The development of flowers in angiosperm plants provided a critical evolutionary advantage, allowing more options for pollen dispersal and seed
Regulation of auxin response by mir393-targeted transport inhibitor response protein 1 is involved in normal development in Arabidopsis
 Plant Mol Biol (2011) 77:619 629 DOI 10.1007/s11103-011-9838-1 Regulation of auxin response by mir393-targeted transport inhibitor response protein 1 is involved in normal development in Arabidopsis Zhe-Hao
Regulation of Gene Expression
 Chapter 18 Regulation of Gene Expression Edited by Shawn Lester PowerPoint Lecture Presentations for Biology Eighth Edition Neil Campbell and Jane Reece Lectures by Chris Romero, updated by Erin Barley
Insights into the molecular mechanism of RGL2-mediated inhibition of seed germination in Arabidopsis thaliana
 Stamm et al. BMC Plant Biology 2012, 12:179 RESEARCH ARTICLE Open Access Insights into the molecular mechanism of RGL2-mediated inhibition of seed germination in Arabidopsis thaliana Petra Stamm 1, Pratibha
SUPPLEMENTARY INFORMATION
 SUPPLEMENTARY INFORMATION doi:10.1038/nature12791 Supplementary Figure 1 (1/3) WWW.NATURE.COM/NATURE 1 RESEARCH SUPPLEMENTARY INFORMATION Supplementary Figure 1 (2/3) 2 WWW.NATURE.COM/NATURE SUPPLEMENTARY
Hormones in plants. Molecular Endocrinology, 2006: ISBN: Editor: Patricia Joseph-Bravo
 Research Signpost 37/661 (2), Fort P.O., Trivandrum-695 023, Kerala, India Molecular Endocrinology, 2006: 193-244 ISBN: 81-308-0100-0 Editor: Patricia Joseph-Bravo 10 Hormones in plants Alejandra A. Covarrubias,
CHAPTER : Prokaryotic Genetics
 CHAPTER 13.3 13.5: Prokaryotic Genetics 1. Most bacteria are not pathogenic. Identify several important roles they play in the ecosystem and human culture. 2. How do variations arise in bacteria considering