Introduction to Microarray Data Analysis and Gene Networks lecture 8. Alvis Brazma European Bioinformatics Institute
|
|
|
- Charles Cain
- 5 years ago
- Views:
Transcription
1 Introduction to Microarray Data Analysis and Gene Networks lecture 8 Alvis Brazma European Bioinformatics Institute
2 Lecture 8 Gene networks part 2 Network topology (part 2) Network logics Network dynamics
3 Gene Networks - four levels of hierarchical description Parts list genes, transcription factors, promoters, binding sites, Topology a graph describing the connections between the parts Control logics how combinations of regulatory signals interact (e.g., promoter logics) Dynamics how does it all work in real time
4 Gene Networks - four levels of hierarchical description Parts list genes, transcription factors, promoters, binding sites, Topology a graph describing the connections between the parts Control logics how combinations of regulatory signals interact (e.g., promoter logics) Dynamics how does it all work in real time
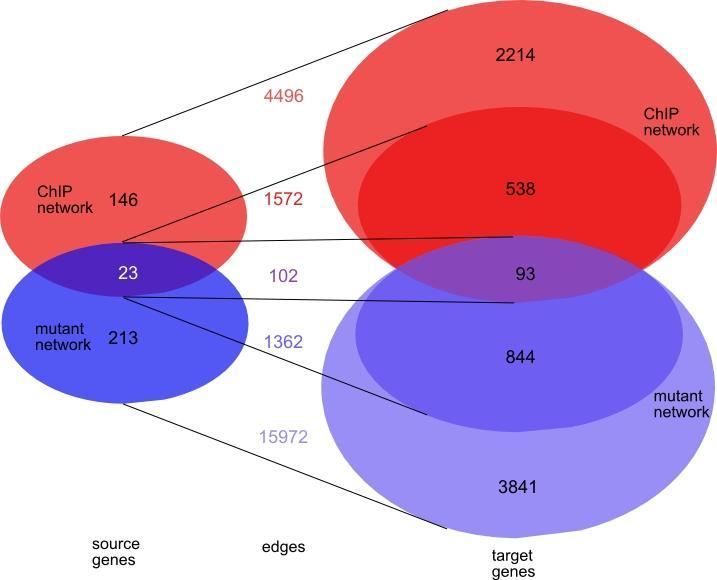
5 The arcs can have different meaning G1 G2 - The product of gene G1 is a transcription factor, which binds to the promoter of gene G2 (in Chip-chip experiment) physical interaction network (direct network) G1 G2 - The disruption of gene G1 changes the expression level of gene G2 data interpretation network (indirect network)
6 How both networks compare How much the two networks have in common We can look at the intersection of the networks whether the common parts have evidence in our existing knowledge If the target sets of the transcription factors present in both networks are similar Are the network topology (e.g., connectivity) properties similar
7 How both networks compare How much the two networks have in common We can look at the intersection of the networks whether the common parts have evidence in our existing knowledge If the target sets of the transcription factors present in both networks are similar Are the network topology (e.g., connectivity) properties similar
8 A couple of simple notions Any gene (node in the graph) with outgoing edges is called a source gene Any gene with incoming edges is a target gene Target set target node source node target set
9 A problem: Both network depend on the chosen significance threshold - i.e., what level of microarray signal to use to draw and edge in the network
10 The size of the networks for different significance thresholds ChIP network (p<0.01) ChIP network (p<0.001) mutant network (γ=2.0) mutant network (γ=2.5) mutant network (γ=3.0) source genes target genes genes edges edges where source gene and target gene have the same cellular role annotation in YPD ( ) 3694 (19.6%) 857 (13.9%) 4096 (12.8%) 2425 (13.9%) 1507 (14.6%) edges per source gene
11
12 How both networks compare How much networks have in common We can look at the intersection of the networks whether the common parts have evidence in our existing knowledge If the target sets of the transcription factors present in both networks are similar Are the network topology (e.g., connectivity) properties similar
13 Intersection of the networks many connections are consistent with out a priori knowledge ARG5 LEU4 ECM40 ARG10 GCN4 HOM3 ARO1 CPA2 MET22 GIC2 YLR104W SPT21 MUT5 RFA2 YJR030C PDS1 YNL313C YOX1 UFE1 YDR115W CDC21 FUS1 RAD27 PDS5 IRR1 DIN7 ERP3 GPA1 STE12 SST2 GSH1 KAR4 STE2 YBR070C YHR149C YJL073W GIN4 YAP1 SGA1 MNN5 SW I6 SMC3 DUN1 YLR460C PCL1 YLR103C PCL2 YER079W RNR1 MBP1 YHR150W YDR528W YLR297W YER128W YPL267W SWE1 PRY2 PLB3 SVS1 SWI4 ABF1 HCM1 MCD1 SIC1 YKL185W YPL158C YGR086C SWI5 YLR194C CHS1 PST1 CCW6 YLR049C YPR157W YER078C SCW10 CLB2 MNN1 CIS3
14 Figure 6 YGR086C CCW6 SIC1 YLR194C CHS1 ARO1 CPA2 ARG10 MET22 STE12 FUS1 KAR4 STE2 GPA1 SST2 YAP1 GSH1 YLR460C SW I5 ARG5 ECM40 LEU4 GCN4 HOM3 CLB2 MBP1 SCW 10 CIS3 MNN1 SW I4 GIC2 SWI6 YKL185W YPL158C YLR049C PST1 YHR149C YBR070C MNN5 SGA1 PCL1 PCL2 YER079W YHR150W YDR528W YLR297W YER128W SWE1 YPR157W YER078C PRY2 PLB3 SVS1 ABF1 RNR1 HCM1 MCD1 YLR103C DUN1 SMC3 RFA2 MUT5 SPT21 YLR104W YJR030C PDS1 YNL313C YOX1 UFE1 YDR115W CDC21 RAD27 PDS5 IRR1 DIN7 ERP3 YJL073W GIN4 YPL267W
15 How both networks compare How much networks have in common We can look at the intersection of the networks whether the common parts have evidence in our existing knowledge If the target sets of the transcription factors present in both networks are similar Are the network topology (e.g., connectivity) properties similar
16 How Chip-chip and disruption networks relate? All genes All genes t Transcription factors Regulation set of t h Disrupted genes Effectual set of h
17 How Chip-chip and disruption networks relate? All genes All genes Transcription factors Regulation set of g Disrupted genes Effectual set of g
18 How to estimate that the overlap is more than expected by random? G R E R E We assume that the elements of the set E are marked, and pick the set of size R at random. Then the size x= R E of the intersection are distributed according to hypergeometric distribution. The probability of observing an intersection of size k or larger can be computed according to formula: = = k i R G i R E G i E k x P 0 1 ) (
19 How Chip-chip and disruption networks relate? All genes All genes 146 Transcription factors 23(9) Disrupted genes 213 Regulation set of g Effectual set of g From 23 transcription factors studied in both networks only 9 have their target sets overlapping more than expected by chancel
20 From 23 transcription factors studied in both networks only 9 have their target sets overlapping more than expected by chance Is it as bad as my look? We will expect many indirect connections in the disruption network that are not present in Chip network is this the case?
21 Direct vs. indirect interactions Y Direct Direct X Z Indirect
22 GLN3 RTG1 YAP1 LYS2 GCN4 YHM1 ARO3 ARO1 ARG4 YJL200C CPA2 BAS1 HIS4 ADE3 ADE13 ADE17 ADE4 YOL158C YAP6 FET4 ROX1 MBP1 SWI6 SWI4 RNR1 NDD1 YBR070C GIC2 SVS1 SOK2 YNL058C GDH3 ECM33 SWI5 SLY1 YDR451C YER189W YER190W PMA1 YGL114W YHL029C YIL158W YJL051W CIS3 SUR7 CDC5 CLN1 SRL1 YOR248W YOR315W CLB2 NCE102 YBL029W UTR2
23 From 23 transcription factors studied in both networks only 9 have their target sets overlapping more than expected by chance Is it as bad as my look? We will expect many indirect connections in the disruption network that are not present in Chip network is this the case? There is an anecdotal evidence that this is the case What about the connections present in the Chip network, but not in the disruption network? can be explained by nonfunctional relationships in the chip network and combinatorial regulatory effects
24 Conclusions We want to think that networks share enough in common both to be meaningful, but at the same time apparently there is a lots of noise in at least one of them present
25 How both networks compare How much networks have in common We can look at the intersection of the networks whether the common parts have evidence in our existing knowledge If the target sets of the transcription factors present in both networks are similar Are the network topology (e.g., connectivity) properties similar and what are they
26 Degree of a node in a graph The central node has degree = 7 indegree = 3 outdegree = 4
27 Important genes and genes with complex regulation Most genes have only a few incoming / outgoing edges, but some have high numbers (>500) Indegree Outdegree
28 Genes with highest in- and out-degree γ outdegree m n indegree m n 2.0 Carbohydrate metabolism Amino-acid metabolism RNA turnover Nucleotide metabolism 6 82 Meiosis Energy generation Cellstress Small molecule transport Protein translocation Other metabolism RNA turnover Amino-acid metabolism Cellstress 62 8 Nucleotide metabolism 3 67 Meiosis 54 3 Energy generation Proteinsynthesis 53 7 Differentiation 2 43 Cellwallmaintenance 47 6 Small molecule transport RNA turnover 48 4 Small molecule transport RNA processing/ modification 41 4 Other metabolism 2 96 Cellstress 27 8 Nucleotide metabolism 2 58 Small molecule transport 19 8 Matingresponse 2 57 Cellwallmaintenance 19 6 Amino-acid metabolism Cellular role table showing the top 5 groups with the highest median degrees for the networks with γ=2.0, 2.8 and 3.6 with a minimum group size of 3 for outdegree and 40 for the indegree (m median degree, n number of genes per group)
29 Node degree distributions for both networks roughly follow power-law ChIP network mutant network connections per gene connections per gene proportion of genes proportion of genes
30 Yeast network topology properties ChIP network connections per gene mutant network connections per gene proportion of genes proportion of genes Power-law property on logarithmic scale approximately linear relationship Whether this is so is still open to debate what is clear however is that most genes have relatively few connections, a few have many
31 Why topology is important? Reduce hypothesis space when analysing next layers of model complexity instead of default all genes depend on all, topology tells us which genes are independent What is the complexity of gene regulation Given a transcription factor T how many genes does T regulate? Given a gene A, how many transcription factors regulate A? Are networks modular?
32 What does modular mean? Are there only one connected component or several In scale free graphs there are hub nodes (nodes with high degree keeping everything together) and there is a theory that networks fall into pieces (modules) if the hub nodes are removed is this the case for real netoworks
33
34
35
36
37 Looking for modules full removed 1% 5% 10% largest ChIP network second total number in-silico network largest second total number largest mutant network second total number
38 Network modularity On static topology level there are no obvious modules in yeast transcription regulation network This does not mean however that there are no modules? there is evidence for modules More subtle methods may be needed to find them
39 What have we learned on the topology level? Comparison of different networks shows that we have some idea of what the true topology is like, but it is far from perfect The network topology is roughly scale free There are not obvious modules in these networks on the topology level one giant component
40 Gene Networks - four levels of hierarchical description Parts list genes, transcription factors, promoters, binding sites, Topology a graph describing the connections between the parts Control logics how combinations of regulatory signals interact (e.g., promoter logics) Dynamics how does it all work in real time
41 Gene Networks - four levels of hierarchical description Parts list genes, transcription factors, promoters, binding sites, Topology a graph describing the connections between the parts Control logics how combinations of regulatory signals interact (e.g., promoter logics) Dynamics how does it all work in real time
42 More complex interactions G1 G2 G3
43 Logics A A B & D B C & D C D = A & B & C
44 Control functions Discrete vs. continuous D = A & B & C D = w 1 A + w 2 B + w 3 C
45 Decision trees no A>5 no yes B>2 C>3 yes no yes if A>5 and B<=2 then D=1 if A>5 and B>2 then D=0 if A<=5 and C<=3 then E=1 if A<=5 and C>3 then E=0 D=1 D=0 E=1 E=0
46 Decision tree for CLN2 gene in yeast 1.1 > > >0.8
47 Logics high throughput data is only now beginning to have impact Predicting gene expression from combination of expression levels of other genes (Soinov et al, 2003) Limited to about 20 genes For instance, by choosing genes well known to be involved in yeast cell cycle regulation it is possible to derive decision trees describing the combinatorial regulatory effects for these genes At least some of the conclusions are supported by a priori knowledge
48 What is known about the regulatory logics from classical low throughput approaches? Yuh, C.H., Bolouri, H. and Davidson, E.H. (1998) Genomic cisregulatory logic: experimental and computational analysis of a sea urchin gene. Science 279, Boolean, linear and decision tree concepts are all used 12 input variables
49 Probabilistic approaches
50 Canalizing Boolean functions There is one input and one value for that input that determines the output regardless of the values of other inputs F = x V y canalizing x=1 -> F=1 F = x & y canalizing x= 0 -> F=0 F = x y not canalizing none of the values of none of the inputs can determine the value of F For Boolean functions of many inputs only a small number of the possible functions are canalizing
51 Gene Networks - four levels of hierarchical description Parts list genes, transcription factors, promoters, binding sites, Topology a graph depicting the connections of the parts Control logics how combinations of regulatory signals interact (e.g., promoter logics) Dynamics how does it all work in real time
52 Classification of dynamic network models Continuous versus discrete state (e.g, boolean) Deterministic versus probabilistic state transitions (e.g. differential equations versus Bayesian models); Ignoring spatial effects vs modelling spatial effects
53 Differential equation based models The basic assumption the rate of changes in gene product abundance at a particular time are determined by the abundance of gene products at the time g i (t) the abundance of the product of gene i at time t w ij the weight of the contribution of gene j to the expression of gene i
54 Differential equation based models Difference equation model: g 1 (t+ t) g 1 (t) = (w 11 g 1 (t) w 1n g n (t)) t... g n (t+ t) g n (t) = (w n1 g 1 (t) w nn g n (t)) t where: g i (t) the abundance of the product of gene i at time t w ij the weight of the contribution of gene j to the expression of gene I The main problem we don t know the constants w ij
55 Differential equation model for drosophila embryo development von Dassow, G., Meir, E., Munro, E.M. and Odell, G.M. (2000) The segment polarity network is a robust developmental module. Nature 406,
56 Synchronous Boolean networks the assumptions Each gene the system (cell) can be in one of two states expressed 1, not expressed 0 The genes can switch from state to state all simultaneously in synchronous manner The next state of each gene is determined by previous states of all genes by Boolean functions describing the network
57 Y=X&Z, X=Y, Z= X Y & X Z t t+1 X Y Z X Y Z State transitions State space
58 Reverse engineering: Given the state space transitions: Reconstruct the network:
59 Reverse engineering problem On one hand the problem is trivial the stage space immediately gives one a transition table, which is an equivalent representation to the wiring diagram However the problem of building the smallest wiring diagram from the table is NP-hard, i.e., it takes exponential time to do this For small networks (3 genes as above) this is not a problem, but for thousands of genes this is not a solution
60 Exponential algorithm Assume that all genes depend on all, i.e., in the wiring diagram connect each to all The Boolean function is the disjunctions of all vectors as given in the table This gives a hugely long Boolean functions for each gene (i.e, n2 n for a network of each gene) The minimisation of this Boolean function to the smallest equivalent one is a classic NP hard problem
61 Solution Instead of the minimal possible network look for simply small network Somogyi et al algorithm using mutual information not clear how good is this heuristics
62 Attractors in the state space
63 Canalizing Boolean functions There is one input and one value, which determines the output regardless of the values of other imputs F = x V y canalizing x=1 -> F=1 F = x & y canalizing x= 0 -> F=0 F = x y not canalizing none of the values of none of the inputs can determine the value of F For Boolean functions of many inputs only a small number of the possible functions are canalizing
64 Kaufman s simulations Randomly constructed Boolean networks such that the number of inputs of each gene is small the control functions are canalizing have a property that their state space consists of a relatively small number of attractors most of the time the spend in attractor states
65 Attractors in the state space
66 Kaufman s hypothesis Gene networks are predominantly controlled by canalizing functions Attractors are cell types He estimated that under certain conditions on network connectivity and assuming genes, there should be a few hundred different cell types
67 A hybrid models the finite state linear model B 1 F i B 2 & r i =(-1.5, 0.5) B 3
68 B 1 1 F i B 2 1 & r i =(-1.5, 0.5) B 3 0
69 B 1 1 F i B 2 1 & 1 r i =(-1.5, 0.5) B 3 0
70 c i B 1 1 F i t B 2 1 & 1 B 3 0
71 c i B 1 1 F i t B 2 1 & 0 B 3 1
72 0 1 r r r + b rep S rep b rep S rep b rep S rep asso rep concentration of repressor concentration of repressor concentration of repressor disso rep asso rep disso rep asso rep disso rep time t 1 time t 1 t 2 time
73 Simulations on a FSLM
74 Lac operon in E.coli bacteria There are two modes in E.coli glucose or lactose utilisation mode that is regulated by the presence or absence of lactose
75 Finite state model for Lac-Operon network FSLM representation Repressor Lactose + Galactose Glucose repressor galactose & repressor Promoter laci Promoter Operator Galactosidase lacz... activator glucose & activator galactosidase Activator galactosidase repressor see table galactosidase Glucose activator glucose galactose
76 0,1 N Finite state linear model for lambda phage lytic/lysogenic mode switch cro/ci cii Q P L P R P L1 P L1 N 0,1 Struc 0,1,2 N 0,1 P L2 ciii P L2 0,1 xis P int 0,1 int cii P E P E P ci ci O R1 O R2 O R3 ci/cro ci/cro ci/cro P M P R P M 0,1,2 cro 0,1,2,3 cii 0,1,2 stress Other ci N P R1 0,1,2,3, 4,5,6 O P ciii cii Other cii cell not implemented in the simulator P R2 Q N 0,1,2,3
77 Network dynamics the state of art Most of the current dynamic models include less than 10 genes, and the knowledge used in the modelling mostly comes from traditional biology studies There are no convincing examples where high throughput technologies had a substantial impact on network modelling on the dynamics level yet
78 Conclusions what have we learned on each level so far? Parts list we are dealing with thousands to tens of thousands of elements in these networks, and hundreds to thousands regulating elements; Topology may be tens of thousands of connections, it seems to be scale free, no obvious modules Control logics a gene can be controlled by dozens of transcription factors in a rather complex way Dynamics we are not yet able to model dynamics of genome scale transcription regulation networks
79 What do I hope you have learned in this course Some feel what real microarray data are like, some idea of the basic methods (if you didn t know this before) How to use ArrayExpress and Expression Profiler if you need this A flavour what is our current knowledge how genes are regulated and how little we know
Using graphs to relate expression data and protein-protein interaction data
 Using graphs to relate expression data and protein-protein interaction data R. Gentleman and D. Scholtens October 31, 2017 Introduction In Ge et al. (2001) the authors consider an interesting question.
Boolean models of gene regulatory networks. Matthew Macauley Math 4500: Mathematical Modeling Clemson University Spring 2016
 Boolean models of gene regulatory networks Matthew Macauley Math 4500: Mathematical Modeling Clemson University Spring 2016 Gene expression Gene expression is a process that takes gene info and creates
Self Similar (Scale Free, Power Law) Networks (I)
 Networks (I)") Self Similar (Scale Free, Power Law) Networks (I) E6083: lecture 4 Prof. Predrag R. Jelenković Dept. of Electrical Engineering Columbia University, NY 10027, USA {predrag}@ee.columbia.edu February 7, 2007
Self Similar (Scale Free, Power Law) Networks (I) E6083: lecture 4 Prof. Predrag R. Jelenković Dept. of Electrical Engineering Columbia University, NY 10027, USA {predrag}@ee.columbia.edu February 7, 2007
Computational Genomics. Systems biology. Putting it together: Data integration using graphical models
 02-710 Computational Genomics Systems biology Putting it together: Data integration using graphical models High throughput data So far in this class we discussed several different types of high throughput
Introduction to Bioinformatics
 CSCI8980: Applied Machine Learning in Computational Biology Introduction to Bioinformatics Rui Kuang Department of Computer Science and Engineering University of Minnesota kuang@cs.umn.edu History of Bioinformatics
3.B.1 Gene Regulation. Gene regulation results in differential gene expression, leading to cell specialization.
 3.B.1 Gene Regulation Gene regulation results in differential gene expression, leading to cell specialization. We will focus on gene regulation in prokaryotes first. Gene regulation accounts for some of
GENETICS - CLUTCH CH.12 GENE REGULATION IN PROKARYOTES.
 GEETICS - CLUTCH CH.12 GEE REGULATIO I PROKARYOTES!! www.clutchprep.com GEETICS - CLUTCH CH.12 GEE REGULATIO I PROKARYOTES COCEPT: LAC OPERO An operon is a group of genes with similar functions that are
GLOBEX Bioinformatics (Summer 2015) Genetic networks and gene expression data
 Genetic networks and gene expression data") GLOBEX Bioinformatics (Summer 2015) Genetic networks and gene expression data 1 Gene Networks Definition: A gene network is a set of molecular components, such as genes and proteins, and interactions between
GLOBEX Bioinformatics (Summer 2015) Genetic networks and gene expression data 1 Gene Networks Definition: A gene network is a set of molecular components, such as genes and proteins, and interactions between
REVIEW SESSION. Wednesday, September 15 5:30 PM SHANTZ 242 E
 REVIEW SESSION Wednesday, September 15 5:30 PM SHANTZ 242 E Gene Regulation Gene Regulation Gene expression can be turned on, turned off, turned up or turned down! For example, as test time approaches,
Systems biology and biological networks
 Systems Biology Workshop Systems biology and biological networks Center for Biological Sequence Analysis Networks in electronics Radio kindly provided by Lazebnik, Cancer Cell, 2002 Systems Biology Workshop,
Control of Gene Expression in Prokaryotes
 Why? Control of Expression in Prokaryotes How do prokaryotes use operons to control gene expression? Houses usually have a light source in every room, but it would be a waste of energy to leave every light
REGULATION OF GENE EXPRESSION. Bacterial Genetics Lac and Trp Operon
 REGULATION OF GENE EXPRESSION Bacterial Genetics Lac and Trp Operon Levels of Metabolic Control The amount of cellular products can be controlled by regulating: Enzyme activity: alters protein function
CHAPTER 13 PROKARYOTE GENES: E. COLI LAC OPERON
 PROKARYOTE GENES: E. COLI LAC OPERON CHAPTER 13 CHAPTER 13 PROKARYOTE GENES: E. COLI LAC OPERON Figure 1. Electron micrograph of growing E. coli. Some show the constriction at the location where daughter
Regulation of Gene Expression
 Chapter 18 Regulation of Gene Expression PowerPoint Lecture Presentations for Biology Eighth Edition Neil Campbell and Jane Reece Lectures by Chris Romero, updated by Erin Barley with contributions from
Hotspots and Causal Inference For Yeast Data
 Hotspots and Causal Inference For Yeast Data Elias Chaibub Neto and Brian S Yandell October 24, 2012 Here we reproduce the analysis of the budding yeast genetical genomics data-set presented in Chaibub
Controlling Gene Expression
 Controlling Gene Expression Control Mechanisms Gene regulation involves turning on or off specific genes as required by the cell Determine when to make more proteins and when to stop making more Housekeeping
Bacterial Genetics & Operons
 Bacterial Genetics & Operons The Bacterial Genome Because bacteria have simple genomes, they are used most often in molecular genetics studies Most of what we know about bacterial genetics comes from the
Rule learning for gene expression data
 Rule learning for gene expression data Stefan Enroth Original slides by Torgeir R. Hvidsten The Linnaeus Centre for Bioinformatics Predicting biological process from gene expression time profiles Papers:
Chapter 16 Lecture. Concepts Of Genetics. Tenth Edition. Regulation of Gene Expression in Prokaryotes
 Chapter 16 Lecture Concepts Of Genetics Tenth Edition Regulation of Gene Expression in Prokaryotes Chapter Contents 16.1 Prokaryotes Regulate Gene Expression in Response to Environmental Conditions 16.2
Introduction. Gene expression is the combined process of :
 1 To know and explain: Regulation of Bacterial Gene Expression Constitutive ( house keeping) vs. Controllable genes OPERON structure and its role in gene regulation Regulation of Eukaryotic Gene Expression
56:198:582 Biological Networks Lecture 8
 56:198:582 Biological Networks Lecture 8 Course organization Two complementary approaches to modeling and understanding biological networks Constraint-based modeling (Palsson) System-wide Metabolism Steady-state
Supplementary Information
 Supplementary Information For the article "The organization of transcriptional activity in the yeast, S. cerevisiae" by I. J. Farkas, H. Jeong, T. Vicsek, A.-L. Barabási, and Z. N. Oltvai For the Referees
Gene regulation I Biochemistry 302. Bob Kelm February 25, 2005
 Gene regulation I Biochemistry 302 Bob Kelm February 25, 2005 Principles of gene regulation (cellular versus molecular level) Extracellular signals Chemical (e.g. hormones, growth factors) Environmental
Topic 4 - #14 The Lactose Operon
 Topic 4 - #14 The Lactose Operon The Lactose Operon The lactose operon is an operon which is responsible for the transport and metabolism of the sugar lactose in E. coli. - Lactose is one of many organic
32 Gene regulation, continued Lecture Outline 11/21/05
 32 Gene regulation, continued Lecture Outline 11/21/05 Review the operon concept Repressible operons (e.g. trp) Inducible operons (e.g. lac) Positive regulation of lac () Practice applying the operon concept
Inferring Transcriptional Regulatory Networks from Gene Expression Data II
 Inferring Transcriptional Regulatory Networks from Gene Expression Data II Lectures 9 Oct 26, 2011 CSE 527 Computational Biology, Fall 2011 Instructor: Su-In Lee TA: Christopher Miles Monday & Wednesday
AP Bio Module 16: Bacterial Genetics and Operons, Student Learning Guide
 Name: Period: Date: AP Bio Module 6: Bacterial Genetics and Operons, Student Learning Guide Getting started. Work in pairs (share a computer). Make sure that you log in for the first quiz so that you get
Hub Gene Selection Methods for the Reconstruction of Transcription Networks
 for the Reconstruction of Transcription Networks José Miguel Hernández-Lobato (1) and Tjeerd. M. H. Dijkstra (2) (1) Computer Science Department, Universidad Autónoma de Madrid, Spain (2) Institute for
Linking the Signaling Cascades and Dynamic Regulatory Networks Controlling Stress Responses
 Linking the Signaling Cascades and Dynamic Regulatory Networks Controlling Stress Responses Anthony Gitter, Miri Carmi, Naama Barkai, and Ziv Bar-Joseph Supplementary Information Supplementary Results
Bioinformatics. Transcriptome
 Bioinformatics Transcriptome Jacques.van.Helden@ulb.ac.be Université Libre de Bruxelles, Belgique Laboratoire de Bioinformatique des Génomes et des Réseaux (BiGRe) http://www.bigre.ulb.ac.be/ Bioinformatics
Name Period The Control of Gene Expression in Prokaryotes Notes
 Bacterial DNA contains genes that encode for many different proteins (enzymes) so that many processes have the ability to occur -not all processes are carried out at any one time -what allows expression
Bi 8 Lecture 11. Quantitative aspects of transcription factor binding and gene regulatory circuit design. Ellen Rothenberg 9 February 2016
 Bi 8 Lecture 11 Quantitative aspects of transcription factor binding and gene regulatory circuit design Ellen Rothenberg 9 February 2016 Major take-home messages from λ phage system that apply to many
Bi 1x Spring 2014: LacI Titration
 Bi 1x Spring 2014: LacI Titration 1 Overview In this experiment, you will measure the effect of various mutated LacI repressor ribosome binding sites in an E. coli cell by measuring the expression of a
CHAPTER : Prokaryotic Genetics
 CHAPTER 13.3 13.5: Prokaryotic Genetics 1. Most bacteria are not pathogenic. Identify several important roles they play in the ecosystem and human culture. 2. How do variations arise in bacteria considering
Causal Graphical Models in Systems Genetics
 1 Causal Graphical Models in Systems Genetics 2013 Network Analysis Short Course - UCLA Human Genetics Elias Chaibub Neto and Brian S Yandell July 17, 2013 Motivation and basic concepts 2 3 Motivation
CELL CYCLE RESPONSE STRESS AVGPCC. YER179W DMC1 meiosis-specific protein unclear
 ORFNAME LOCUS DESCRIPTION DATE HUBS: ESSENTIAL k AVGPCC STRESS RESPONSE CELL CYCLE PHEROMONE TREATMENT UNFOLDED PROTEIN RESPONSE YER179W DMC1 meiosis-specific protein 9-0.132-0.228-0.003-0.05 0.138 0.00
Introduction to Bioinformatics
 Systems biology Introduction to Bioinformatics Systems biology: modeling biological p Study of whole biological systems p Wholeness : Organization of dynamic interactions Different behaviour of the individual
Regulation of Gene Expression in Bacteria and Their Viruses
 11 Regulation of Gene Expression in Bacteria and Their Viruses WORKING WITH THE FIGURES 1. Compare the structure of IPTG shown in Figure 11-7 with the structure of galactose shown in Figure 11-5. Why is
Case story: Analysis of the Cell Cycle
 DNA microarray analysis, January 2 nd 2006 Case story: Analysis of the Cell Cycle Center for Biological Sequence Analysis Outline Introduction Cell division and cell cycle regulation Experimental studies
Alterations in DNA Replication and Histone Levels Promote Histone Gene Amplification in Saccharomyces cerevisiae
 Supporting Information http://www.genetics.org/cgi/content/full/genetics.109.113662/dc1 Alterations in DNA Replication and Histone Levels Promote Histone Gene Amplification in Saccharomyces cerevisiae
Lecture 18 June 2 nd, Gene Expression Regulation Mutations
 Lecture 18 June 2 nd, 2016 Gene Expression Regulation Mutations From Gene to Protein Central Dogma Replication DNA RNA PROTEIN Transcription Translation RNA Viruses: genome is RNA Reverse Transcriptase
Graph Alignment and Biological Networks
 Graph Alignment and Biological Networks Johannes Berg http://www.uni-koeln.de/ berg Institute for Theoretical Physics University of Cologne Germany p.1/12 Networks in molecular biology New large-scale
From protein networks to biological systems
 FEBS 29314 FEBS Letters 579 (2005) 1821 1827 Minireview From protein networks to biological systems Peter Uetz a,1, Russell L. Finley Jr. b, * a Research Center Karlsruhe, Institute of Genetics, P.O. Box
Written Exam 15 December Course name: Introduction to Systems Biology Course no
 Technical University of Denmark Written Exam 15 December 2008 Course name: Introduction to Systems Biology Course no. 27041 Aids allowed: Open book exam Provide your answers and calculations on separate
6.047 / Computational Biology: Genomes, Networks, Evolution Fall 2008
 MIT OpenCourseWare http://ocw.mit.edu 6.047 / 6.878 Computational Biology: Genomes, Networks, Evolution Fall 2008 For information about citing these materials or our Terms of Use, visit: http://ocw.mit.edu/terms.
Regulation of Gene Expression
 Chapter 18 Regulation of Gene Expression Edited by Shawn Lester PowerPoint Lecture Presentations for Biology Eighth Edition Neil Campbell and Jane Reece Lectures by Chris Romero, updated by Erin Barley
Modeling and Visualizing Uncertainty in Gene Expression Clusters using Dirichlet Process Mixtures
 JOURNAL OF LATEX CLASS FILES, VOL. 1, NO. 8, AUGUST 2002 1 Modeling and Visualizing Uncertainty in Gene Expression Clusters using Dirichlet Process Mixtures Carl Edward Rasmussen, Bernard J de la Cruz,
GENETICS. Supporting Information
 GENETICS Supporting Information http://www.genetics.org/cgi/content/full/genetics.110.117655/dc1 Trivalent Arsenic Inhibits the Functions of Chaperonin Complex XuewenPan,StefanieReissman,NickR.Douglas,ZhiweiHuang,DanielS.Yuan,
Inferring Transcriptional Regulatory Networks from High-throughput Data
 Inferring Transcriptional Regulatory Networks from High-throughput Data Lectures 9 Oct 26, 2011 CSE 527 Computational Biology, Fall 2011 Instructor: Su-In Lee TA: Christopher Miles Monday & Wednesday 12:00-1:20
Evolutionary analysis of the well characterized endo16 promoter reveals substantial variation within functional sites
 Evolutionary analysis of the well characterized endo16 promoter reveals substantial variation within functional sites Paper by: James P. Balhoff and Gregory A. Wray Presentation by: Stephanie Lucas Reviewed
Random Boolean Networks
 Random Boolean Networks Boolean network definition The first Boolean networks were proposed by Stuart A. Kauffman in 1969, as random models of genetic regulatory networks (Kauffman 1969, 1993). A Random
Detecting temporal protein complexes from dynamic protein-protein interaction networks
 Detecting temporal protein complexes from dynamic protein-protein interaction networks Le Ou-Yang, Dao-Qing Dai, Xiao-Li Li, Min Wu, Xiao-Fei Zhang and Peng Yang 1 Supplementary Table Table S1: Comparative
Gene Switches Teacher Information
 STO-143 Gene Switches Teacher Information Summary Kit contains How do bacteria turn on and turn off genes? Students model the action of the lac operon that regulates the expression of genes essential for
RNA Synthesis and Processing
 RNA Synthesis and Processing Introduction Regulation of gene expression allows cells to adapt to environmental changes and is responsible for the distinct activities of the differentiated cell types that
Chapter 15 Active Reading Guide Regulation of Gene Expression
 Name: AP Biology Mr. Croft Chapter 15 Active Reading Guide Regulation of Gene Expression The overview for Chapter 15 introduces the idea that while all cells of an organism have all genes in the genome,
Computational Genomics. Reconstructing dynamic regulatory networks in multiple species
 02-710 Computational Genomics Reconstructing dynamic regulatory networks in multiple species Methods for reconstructing networks in cells CRH1 SLT2 SLR3 YPS3 YPS1 Amit et al Science 2009 Pe er et al Recomb
4. Why not make all enzymes all the time (even if not needed)? Enzyme synthesis uses a lot of energy.
? Enzyme synthesis uses a lot of energy.") 1 C2005/F2401 '10-- Lecture 15 -- Last Edited: 11/02/10 01:58 PM Copyright 2010 Deborah Mowshowitz and Lawrence Chasin Department of Biological Sciences Columbia University New York, NY. Handouts: 15A
1 C2005/F2401 '10-- Lecture 15 -- Last Edited: 11/02/10 01:58 PM Copyright 2010 Deborah Mowshowitz and Lawrence Chasin Department of Biological Sciences Columbia University New York, NY. Handouts: 15A
AUTOMATIC CREATION OF A GENETIC NETWORK FOR THE lac OPERON FROM OBSERVED DATA BY MEANS OF GENETIC PROGRAMMING
 AUTOMATIC CREATION OF A GENETIC NETWORK FOR THE lac OPERON FROM OBSERVED DATA BY MEANS OF GENETIC PROGRAMMING Guido Lanza Genetic Programming Inc., Los Altos, California, guidissimo@hotmail.com William
Name: SBI 4U. Gene Expression Quiz. Overall Expectation:
 Gene Expression Quiz Overall Expectation: - Demonstrate an understanding of concepts related to molecular genetics, and how genetic modification is applied in industry and agriculture Specific Expectation(s):
Eukaryotic Gene Expression
 Eukaryotic Gene Expression Lectures 22-23 Several Features Distinguish Eukaryotic Processes From Mechanisms in Bacteria 123 Eukaryotic Gene Expression Several Features Distinguish Eukaryotic Processes
THE EDIBLE OPERON David O. Freier Lynchburg College [BIOL 220W Cellular Diversity]
![THE EDIBLE OPERON David O. Freier Lynchburg College [BIOL 220W Cellular Diversity]](/thumbs/90/102203867.jpg "THE EDIBLE OPERON David O. Freier Lynchburg College [BIOL 220W Cellular Diversity]") THE EDIBLE OPERON David O. Freier Lynchburg College [BIOL 220W Cellular Diversity] You have the following resources available to you: Short bread cookies = DNA / genetic elements Fudge Mint cookies = RNA
THE EDIBLE OPERON David O. Freier Lynchburg College [BIOL 220W Cellular Diversity] You have the following resources available to you: Short bread cookies = DNA / genetic elements Fudge Mint cookies = RNA
Chapter 18: Control of Gene Expression
 Chapter 18: Control of Gene Expression 海洋生物研究所 曾令銘 海事大樓 426 室分機 : 5326 Differential Expression of Genes Prokaryotes and eukaryotes precisely regulate gene expression in response to environmental conditions
Regulation of Gene Expression at the level of Transcription
 Regulation of Gene Expression at the level of Transcription (examples are mostly bacterial) Diarmaid Hughes ICM/Microbiology VT2009 Regulation of Gene Expression at the level of Transcription (examples
Complete all warm up questions Focus on operon functioning we will be creating operon models on Monday
 Complete all warm up questions Focus on operon functioning we will be creating operon models on Monday 1. What is the Central Dogma? 2. How does prokaryotic DNA compare to eukaryotic DNA? 3. How is DNA
Translation - Prokaryotes
 1 Translation - Prokaryotes Shine-Dalgarno (SD) Sequence rrna 3 -GAUACCAUCCUCCUUA-5 mrna...ggagg..(5-7bp)...aug Influences: Secondary structure!! SD and AUG in unstructured region Start AUG 91% GUG 8 UUG
Prokaryotic Gene Expression (Learning Objectives)
") Prokaryotic Gene Expression (Learning Objectives) 1. Learn how bacteria respond to changes of metabolites in their environment: short-term and longer-term. 2. Compare and contrast transcriptional control
Prokaryotic Gene Expression (Learning Objectives) 1. Learn how bacteria respond to changes of metabolites in their environment: short-term and longer-term. 2. Compare and contrast transcriptional control
56:198:582 Biological Networks Lecture 9
 56:198:582 Biological Networks Lecture 9 The Feed-Forward Loop Network Motif Subgraphs in random networks We have discussed the simplest network motif, self-regulation, a pattern with one node We now consider
Cytoscape An open-source software platform for the exploration of molecular interaction networks
 Cytoscape An open-source software platform for the exploration of molecular interaction networks Systems Biology Group UP Biologie Systémique Institut Pasteur, Paris Overview 1. Molecular interaction networks
Computational Biology: Basics & Interesting Problems
 Computational Biology: Basics & Interesting Problems Summary Sources of information Biological concepts: structure & terminology Sequencing Gene finding Protein structure prediction Sources of information
Computational Cell Biology Lecture 4
 Computational Cell Biology Lecture 4 Case Study: Basic Modeling in Gene Expression Yang Cao Department of Computer Science DNA Structure and Base Pair Gene Expression Gene is just a small part of DNA.
Network motifs in the transcriptional regulation network (of Escherichia coli):
:") Network motifs in the transcriptional regulation network (of Escherichia coli): Janne.Ravantti@Helsinki.Fi (disclaimer: IANASB) Contents: Transcription Networks (aka. The Very Boring Biology Part ) Network
Network motifs in the transcriptional regulation network (of Escherichia coli): Janne.Ravantti@Helsinki.Fi (disclaimer: IANASB) Contents: Transcription Networks (aka. The Very Boring Biology Part ) Network
Development Team. Regulation of gene expression in Prokaryotes: Lac Operon. Molecular Cell Biology. Department of Zoology, University of Delhi
 Paper Module : 15 : 23 Development Team Principal Investigator : Prof. Neeta Sehgal Department of Zoology, University of Delhi Co-Principal Investigator : Prof. D.K. Singh Department of Zoology, University
Lecture 8: Temporal programs and the global structure of transcription networks. Chap 5 of Alon. 5.1 Introduction
 Lecture 8: Temporal programs and the global structure of transcription networks Chap 5 of Alon 5. Introduction We will see in this chapter that sensory transcription networks are largely made of just four
Lesson Overview. Gene Regulation and Expression. Lesson Overview Gene Regulation and Expression
 13.4 Gene Regulation and Expression THINK ABOUT IT Think of a library filled with how-to books. Would you ever need to use all of those books at the same time? Of course not. Now picture a tiny bacterium
Computational Systems Biology
 Computational Systems Biology Vasant Honavar Artificial Intelligence Research Laboratory Bioinformatics and Computational Biology Graduate Program Center for Computational Intelligence, Learning, & Discovery
Chapter 7: Regulatory Networks
 Chapter 7: Regulatory Networks 7.2 Analyzing Regulation Prof. Yechiam Yemini (YY) Computer Science Department Columbia University The Challenge How do we discover regulatory mechanisms? Complexity: hundreds
BioControl - Week 6, Lecture 1
 BioControl - Week 6, Lecture 1 Goals of this lecture Large metabolic networks organization Design principles for small genetic modules - Rules based on gene demand - Rules based on error minimization Suggested
Inferring Protein-Signaling Networks
 Inferring Protein-Signaling Networks Lectures 14 Nov 14, 2011 CSE 527 Computational Biology, Fall 2011 Instructor: Su-In Lee TA: Christopher Miles Monday & Wednesday 12:00-1:20 Johnson Hall (JHN) 022 1
Combining Microarrays and Biological Knowledge for Estimating Gene Networks via Bayesian Networks
 Combining Microarrays and Biological Knowledge for Estimating Gene Networks via Bayesian Networks Seiya Imoto 1, Tomoyuki Higuchi 2, Takao Goto 1, Kousuke Tashiro 3, Satoru Kuhara 3 and Satoru Miyano 1
Big Idea 3: Living systems store, retrieve, transmit and respond to information essential to life processes. Tuesday, December 27, 16
 Big Idea 3: Living systems store, retrieve, transmit and respond to information essential to life processes. Enduring understanding 3.B: Expression of genetic information involves cellular and molecular
Warm-Up. Explain how a secondary messenger is activated, and how this affects gene expression. (LO 3.22)
") Warm-Up Explain how a secondary messenger is activated, and how this affects gene expression. (LO 3.22) Yesterday s Picture The first cell on Earth (approx. 3.5 billion years ago) was simple and prokaryotic,
Warm-Up Explain how a secondary messenger is activated, and how this affects gene expression. (LO 3.22) Yesterday s Picture The first cell on Earth (approx. 3.5 billion years ago) was simple and prokaryotic,
Biology. Biology. Slide 1 of 26. End Show. Copyright Pearson Prentice Hall
 Biology Biology 1 of 26 Fruit fly chromosome 12-5 Gene Regulation Mouse chromosomes Fruit fly embryo Mouse embryo Adult fruit fly Adult mouse 2 of 26 Gene Regulation: An Example Gene Regulation: An Example
GENE REGULATION AND PROBLEMS OF DEVELOPMENT
 GENE REGULATION AND PROBLEMS OF DEVELOPMENT By Surinder Kaur DIET Ropar Surinder_1998@ yahoo.in Mob No 9988530775 GENE REGULATION Gene is a segment of DNA that codes for a unit of function (polypeptide,
Gene Regulation and Expression
 THINK ABOUT IT Think of a library filled with how-to books. Would you ever need to use all of those books at the same time? Of course not. Now picture a tiny bacterium that contains more than 4000 genes.
Causal Model Selection Hypothesis Tests in Systems Genetics: a tutorial
 Causal Model Selection Hypothesis Tests in Systems Genetics: a tutorial Elias Chaibub Neto and Brian S Yandell July 2, 2012 1 Motivation Current efforts in systems genetics have focused on the development
Unit 3: Control and regulation Higher Biology
 Unit 3: Control and regulation Higher Biology To study the roles that genes play in the control of growth and development of organisms To be able to Give some examples of features which are controlled
Basic modeling approaches for biological systems. Mahesh Bule
 Basic modeling approaches for biological systems Mahesh Bule The hierarchy of life from atoms to living organisms Modeling biological processes often requires accounting for action and feedback involving
UNIT 6 PART 3 *REGULATION USING OPERONS* Hillis Textbook, CH 11
 UNIT 6 PART 3 *REGULATION USING OPERONS* Hillis Textbook, CH 11 REVIEW: Signals that Start and Stop Transcription and Translation BUT, HOW DO CELLS CONTROL WHICH GENES ARE EXPRESSED AND WHEN? First of
Emergence of gene regulatory networks under functional constraints
 under functional constraints Institute of Physics, Jagiellonian University, Kraków, Poland in collaboration with Zdzislaw Burda, Andre Krzywicki and Olivier C. Martin 30 November 2012, Leipzig, CompPhys12
Prokaryotic Gene Expression (Learning Objectives)
") Prokaryotic Gene Expression (Learning Objectives) 1. Learn how bacteria respond to changes of metabolites in their environment: short-term and longer-term. 2. Compare and contrast transcriptional control
Prokaryotic Gene Expression (Learning Objectives) 1. Learn how bacteria respond to changes of metabolites in their environment: short-term and longer-term. 2. Compare and contrast transcriptional control
hsnim: Hyper Scalable Network Inference Machine for Scale-Free Protein-Protein Interaction Networks Inference
 CS 229 Project Report (TR# MSB2010) Submitted 12/10/2010 hsnim: Hyper Scalable Network Inference Machine for Scale-Free Protein-Protein Interaction Networks Inference Muhammad Shoaib Sehgal Computer Science
A Re-annotation of the Saccharomyces cerevisiae Genome
 Comparative and Functional Genomics Comp Funct Genom 2001; 2: 143 154. DOI: 10.1002 / cfg.86 Research Article A Re-annotation of the Saccharomyces cerevisiae Genome V. Wood*, K. M. Rutherford, A Ivens,
Bioinformatics 2. Yeast two hybrid. Proteomics. Proteomics
 GENOME Bioinformatics 2 Proteomics protein-gene PROTEOME protein-protein METABOLISM Slide from http://www.nd.edu/~networks/ Citrate Cycle Bio-chemical reactions What is it? Proteomics Reveal protein Protein
Welcome to Class 21!
 Welcome to Class 21! Introductory Biochemistry! Lecture 21: Outline and Objectives l Regulation of Gene Expression in Prokaryotes! l transcriptional regulation! l principles! l lac operon! l trp attenuation!
Lecture 4: Transcription networks basic concepts
 Lecture 4: Transcription networks basic concepts - Activators and repressors - Input functions; Logic input functions; Multidimensional input functions - Dynamics and response time 2.1 Introduction The
Central postgenomic. Transcription regulation: a genomic network. Transcriptome: the set of all mrnas expressed in a cell at a specific time.
 Transcription regulation: a genomic network Nicholas Luscombe Laboratory of Mark Gerstein Department of Molecular Biophysics and Biochemistry Yale University Understand Proteins, through analyzing populations
ActiveNetworks Cross-Condition Analysis of Functional Genomic Data
 ActiveNetworks Cross-Condition Analysis of Functional Genomic Data T. M. Murali April 18, 2006 Motivation: Manual Systems Biology Biologists want to study a favourite stress, e.g., oxidative stress or
10-810: Advanced Algorithms and Models for Computational Biology. microrna and Whole Genome Comparison
 10-810: Advanced Algorithms and Models for Computational Biology microrna and Whole Genome Comparison Central Dogma: 90s Transcription factors DNA transcription mrna translation Proteins Central Dogma:
BMD645. Integration of Omics
 BMD645 Integration of Omics Shu-Jen Chen, Chang Gung University Dec. 11, 2009 1 Traditional Biology vs. Systems Biology Traditional biology : Single genes or proteins Systems biology: Simultaneously study
Prokaryotic Regulation
 Prokaryotic Regulation Control of transcription initiation can be: Positive control increases transcription when activators bind DNA Negative control reduces transcription when repressors bind to DNA regulatory