Supplemental Information. Polo Kinase Phosphorylates Miro to Control. ER-Mitochondria Contact Sites and Mitochondrial
|
|
|
- Merilyn Joseph
- 6 years ago
- Views:
Transcription
1 Developmental Cell, Volume 37 Supplemental Information Polo Kinase Phosphorylates Miro to Control ER-Mitochondria Contact Sites and Mitochondrial Ca 2+ Homeostasis in Neural Stem Cell Development Seongsoo Lee, Kyu-Sun Lee, Sungun Huh, Song Liu, Do-Yeon Lee, Seung Hyun Hong, Kweon Yu, and Bingwei Lu
2 Inventory of Supplementary Materials: Figure S1, Related to Figure 1. Analysis of Miro Function in Fly NBs. Figure S2, Related to Figure 2. Analyses of the Effects of Miro on Ca 2+ mito Homeostasis. Figure S3, Related to Figure 3. Analyses of the Effects of Miro on Mitochondrial Function. Figure S4, Related to Figure 4. Additional Analysis of the Function of ER-Mitochondria Ca 2+ Transfer- Related Genes in NB Maintenance. Figure S5, Related to Figure 5. Additional Data Showing the Effects of Polo-Miro Signaling on Ca 2+ mito Homeostasis. Figure S6, Related to Figure 6. Additional Data Showing the Effects of Miro Phosphorylation by Polo. Figure S7, Related to Figure 7. Additional Data Showing the Effects of PLK-Miro Signaling in Mammalian Cells. Supplementary Experimental Procedures Supplementary References
3
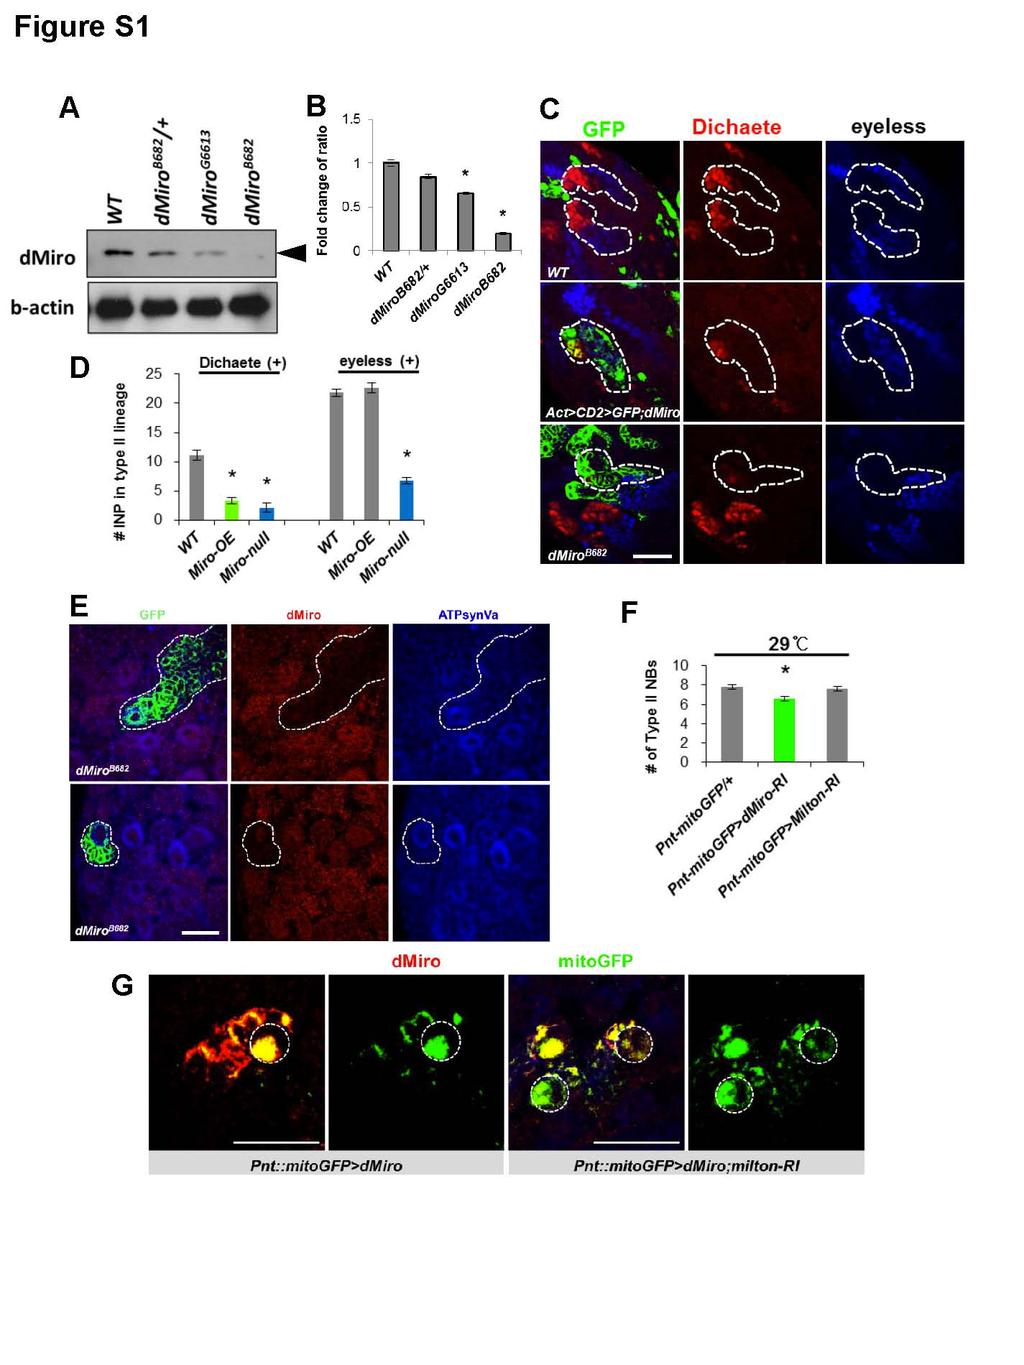
4 Figure S1, Related to Figure 1. Analysis of Miro Function in Fly NBs (A) WB analysis showing lack of dmiro protein expression in dmiro B682 mutant. Actin serves as loading control. (B) Quantification of dmiro protein level from A. (C) Immunostaining and quantification of D-positive young IPs (Red) and Ey-positive old IPs (Blue) in dmiro mutant MARCM clones or Flip-out dmiro OE clones in larval brain. Clones were visualized with GFP marker and the type II NB lineages are outlined with white dashed line. (D) Quantification of the number of young (D+) or old (Ey+) IPs from C. (E) Immunostaining showing lack of effect on mitochondrial morphology by dmiro mutation in type II (upper panels) or type I (lower panels) NB clones. Clones were visualized with GFP marker and the NB lineages are outlined with white dashed line. dmiro staining verifies lack of dmiro expression in mutant clones and ATPsynVa staining shows mitochondrial morphology. (F) Quantification showing effects of dmiro or Milton RNAi on type II NB number. Animals were raised at 29 o C to enhance RNAi efficiency. (G) Knockdown of Milton rescued abnormal mitochondrial distribution caused by dmiro OE in larval brain NBs. Circles with white dashed line mark the NBs of interest. Error bar, SEM; *, P<0.05 in Student s t-tests. Scale bars, 20 µm.
5
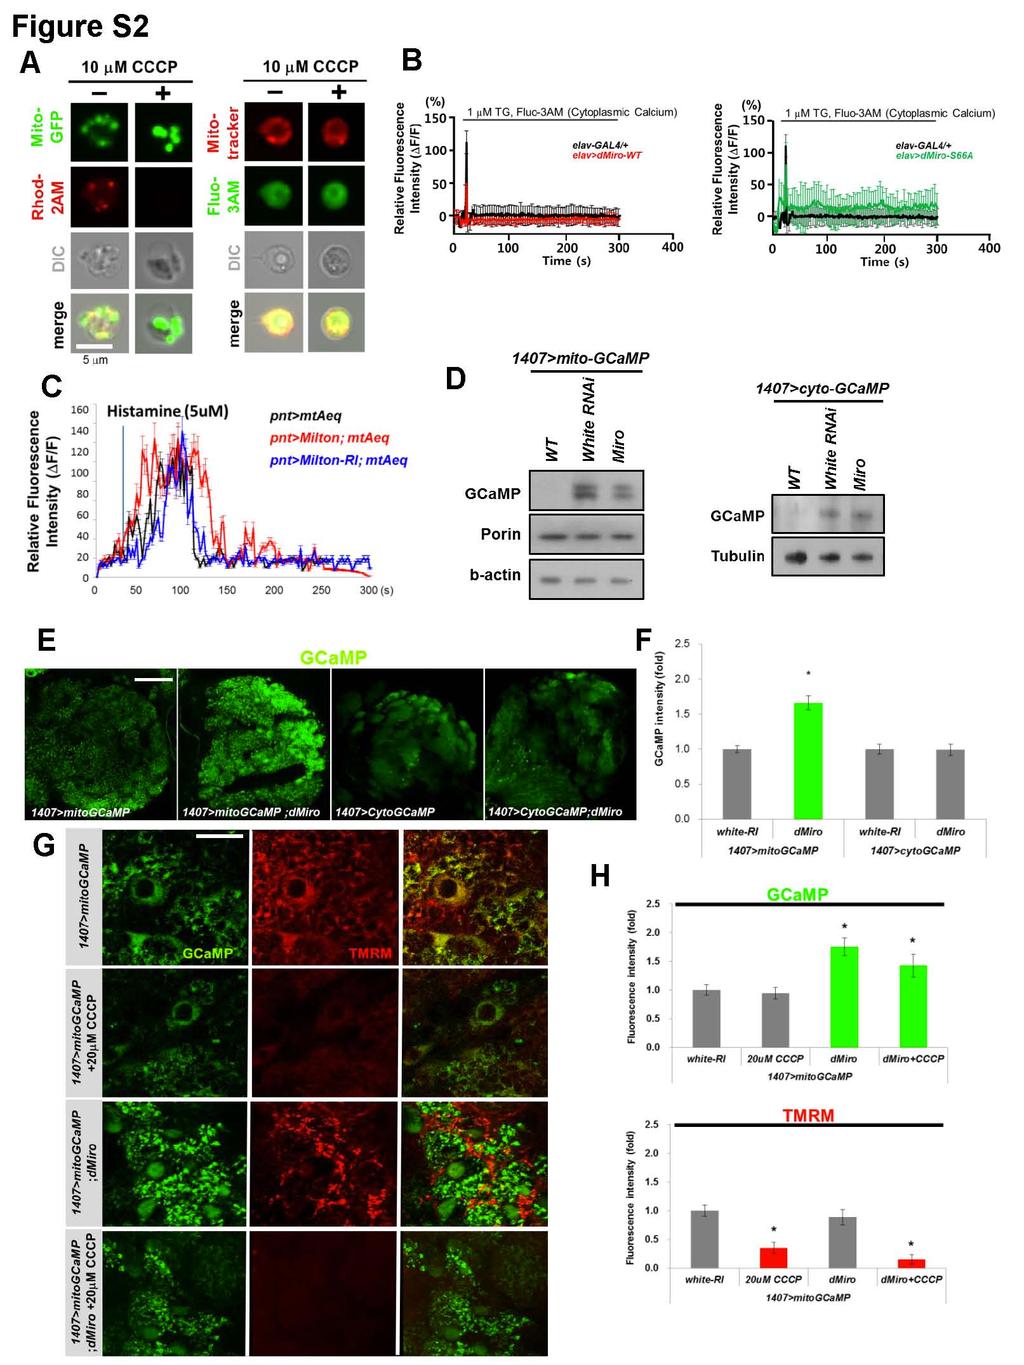
6 Figure S2, Related to Figure 2. Analyses of the Effects of Miro on Ca 2+ mito Homeostasis (A) Evidence that Rhod-2 AM specifically monitors mitochondrial Ca 2+. In primary Drosophila neuronal culture, Rhod-2 AM signal overlaps extensively with the mitochondrial marker mito-gfp. Depolarization of mitochondrial membrane potential with CCCP abolished Rhod-2AM signal without affecting cytosolic Ca 2+ signal monitored with Fluo-3 AM fluorescence, thus validating the specificity of Rhod-2 AM in monitoring mitochondrial Ca 2+. (B) Effects of pan-neuronal elav-gal4 driven dmiro-wt or dmiro-s66a on TG-stimulated elevation of cytosolic Ca 2+ as measured with Fluo-3 AM fluorescence in primary cultured fly neurons. The traces show mean response of cells present in the microscope field and are representative of more than 3 experiments. (C) Lack of effect of Milton OE or RNAi on Ca 2+ mito as monitored with genetically-encoded mito-aeq. The traces show mean response of 10 dissected larval brains present in the microtiter plate and are representative of more than 3 tests. (D) WB analysis with anti-gfp quantifying mito-gcamp and cytosolic GCaMP protein levels in 3 rd instar larva brain expressing Miro or a control white RNAi transgene. Porin serves as mitochondrial marker and actin or tubulin serve as loading controls. (E, F) In vivo Ca 2+ imaging showing that NB-specific dmiro-oe altered basal mitochondrial calcium level (monitored with mito-gcamp), but not cytosolic calcium level (monitored with cyto-gcamp). (F) Quantification of normalized GCaMP intensity from E. (G) NB-specific dmiro-oe altered mitochondrial calcium level without changing mitochondrial membrane potential as measured with TMRM. TMRM signals were dramatically reduced by CCCP treatment, which causes mitochondrial depolarization, indicating specificity of this dye staining. (H) Quantification showing normalized Ca 2+ mito (mito-gcamp) and mitochondrial membrane potential (TMRM) fluorescence signals from G. Error bar, SEM; *, P<0.05 in Student s t-tests. Scale bars, 20 µm (A, G), 100 µm (E).
7
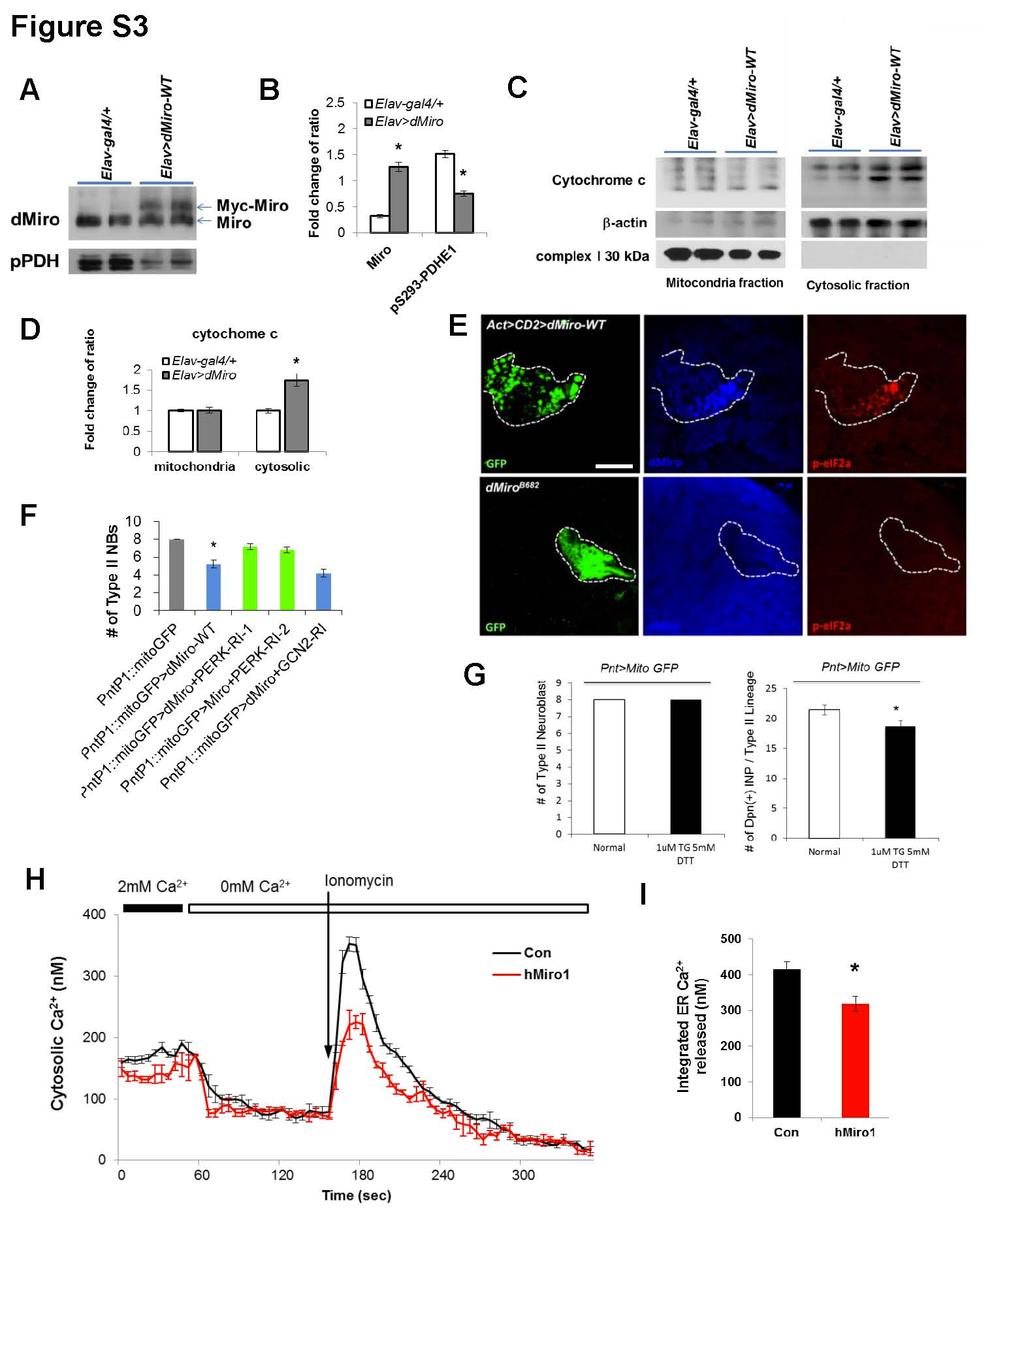
8 Figure S3, Related to Figure 3. Analyses of the Effects of Miro on Mitochondrial Function (A, B) WB analysis showing reduced p-pdhe1 level in dmiro-oe fly brain extract. Note that the level of transgenic Miro is not exceeding endogenous Miro level. B, quantification of the levels of dmiro and phosphorylated PDHE1 in control Elav-Gal4/+ and Elav>dMiro-OE samples from A. (C, D) WB analysis showing the release of cyt C into the cytosol in dmiro-oe animal brain. Complex I 30 kd and β-actin were used as markers for mitochondrial and cytosolic fractions, respectively. D, quantification of the levels of cyt C from C. (E) Immunostaining of p-eif2α, an ER stress marker, in dmiro-oe Flip-out clones or dmiro B682 mutant MARCM clones. Clones were visualized with a GFP marker and outlined with white dashed lines. (F) Genetic interaction studies showing rescue of dmiro OE-induced NB loss by RNAi of a candidate eif2α kinase PERK, but not GCN2. Two independent PERK RNAi lines showed the same effect. (G) ER stress-inducing chemicals (DTT + TG) had no obvious effect on the number of type II NB but reduced the number of Dpn-positive IPs. (H) Estimating ER Ca 2+ level by measuring ionomycin-releasable Ca 2+ content from intracellular stores in hmiro1 transfected HeLa cells. Representative Ca 2+ traces following emptying of ER stores with 5 µm ionomycin in HeLa cells with or without hmiro1 transfection are shown. Cells were cultured in low Ca 2+ media (100 µm) after transfection, following by a 30-min incubation in normal Ca 2+ (2 mm) immediately before calcium imaging to allow restoration of ER calcium. (I) Quantification showing integrated release of Ca2 + from intracellular stores in hmiro1 transfected cells within 2 min after ionomycin treatment. Error bar: SEM; *, p<0.05 in Student s t-tests. Scale bars, 20 µm.
9
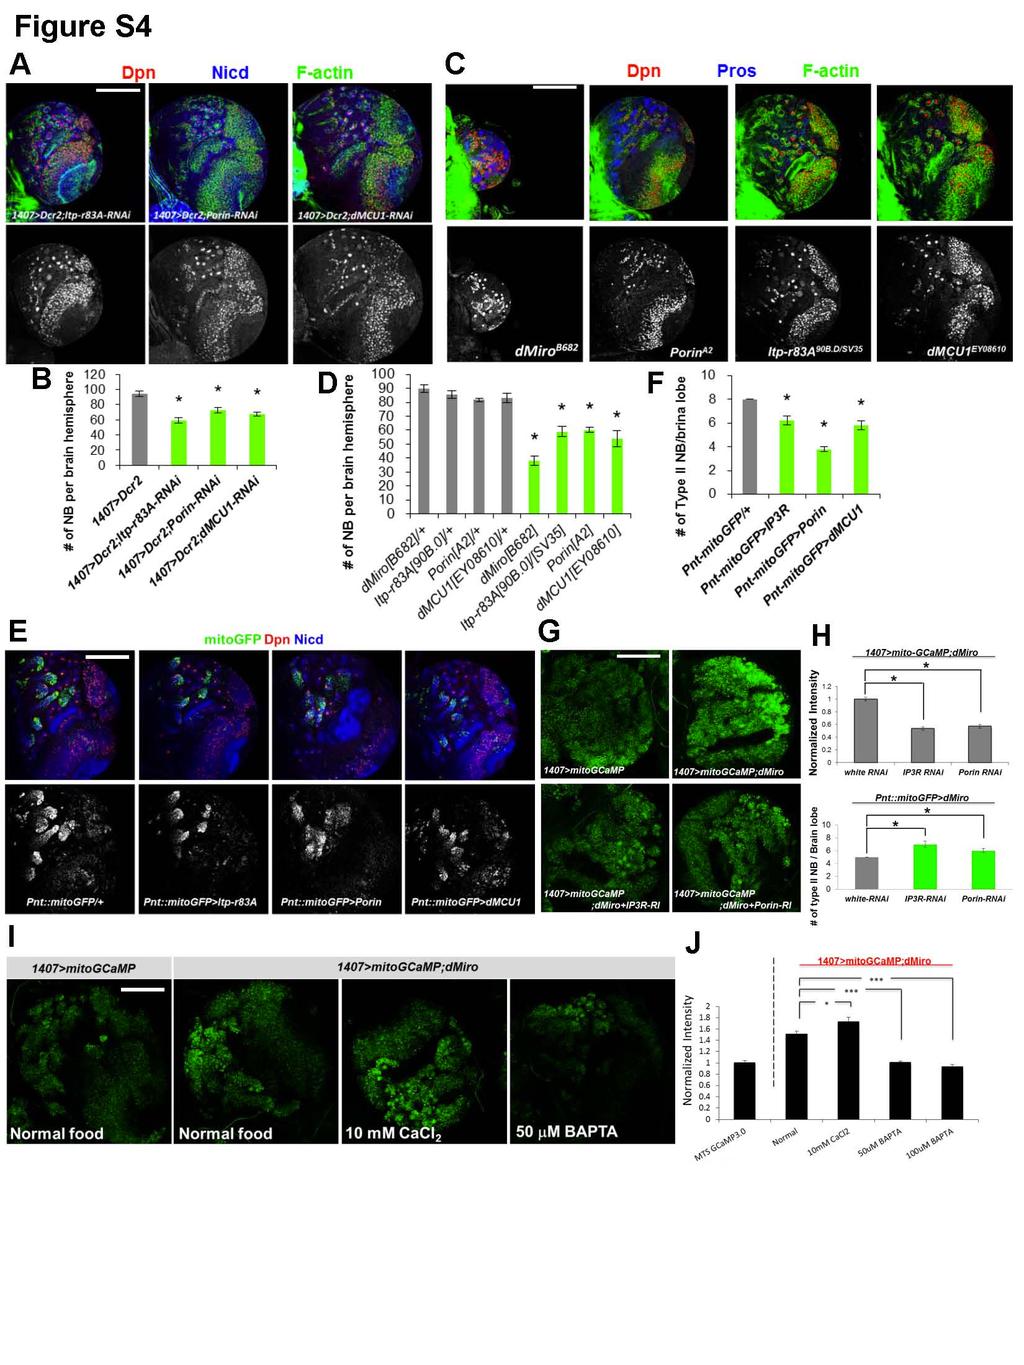
10 Figure S4, Related to Figure 4. Additional Analysis of the Function of ER-Mitochondria Ca 2+ Transfer-Related Genes in NB Maintenance (A, B) RNAi of fly IP3R, Porin, or MCU resulted in reduced NB number in the larval brain. B, quantification of NB number shown in A. (C, D) Homozygous mutants of dmiro, Porin, IP3R, or MCU show reduced NB number in third instar larval brain. D, quantification of NB number shown in C. Larval brains were immunostained for Dpn, Nicd, and F-actin in A or Dpn, Pros, and F-actin in C. Dpn only signal is shown in the lower panels in A and C. (E, F) IP3R, Porin, or MCU overexpression driven by Pnt-Gal4 in type II NB lineages led to reduced NB number. Type II NBs are marked by a co-expressed mito-gfp marker and also stained for Dpn and Nicd. Dpn only signal is shown in the lower panels in E. F, quantification of type II NB number shown in E. (G, H) Increased basal mitochondrial calcium level (mito-gcamp signal) induced by dmiro OE was reduced by RNAi-mediated knockdown of ERMCS components IP3R and Porin. H, quantification of normalized GCaMP intensity from G, and effect of IP3R RNAi and Porin RNAi on dmiro OE induced type II NB loss. (I, J) Response of mitochondrial calcium level to exogenous calcium (CaCl 2 ) and calcium chelator (BAPTA) in 3 rd instar larva brains. CaCl 2 and BAPTA were supplemental to normal fly food. J, quantification of normalized GCaMP intensity from I. Error bar, SEM; *, P<0.05 in Student s t-tests. Scale bars, 100 µm.
11
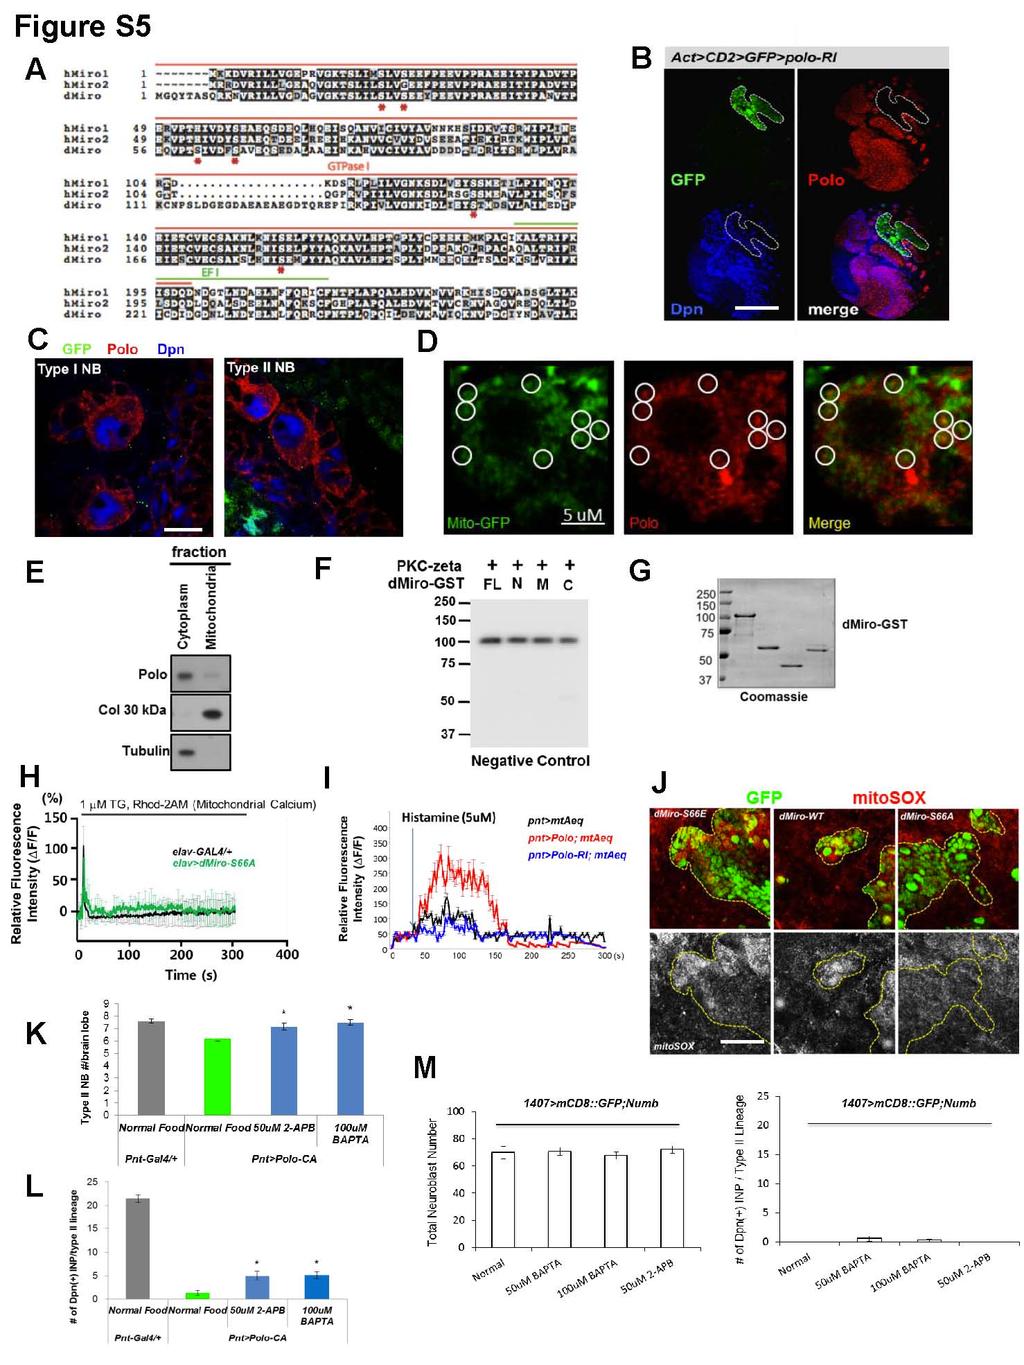
12 Figure S5, Related to Figure 5. Additional Data Showing the Effects of Polo-Miro Signaling on Ca 2+ mito Homeostasis (A) Alignment between dmiro and human Miro amino acid sequences showing the position of the conserved Ser residue (marked with *) in the first GTPase domain. (B) Immunostaining of Polo in Polo-RNAi Flip-out clones validating the specificity of the Polo antibody. (C) Punctate cytoplasmic staining of Polo in type I and type II NBs of larval brain. (D) Co-localization between endogenous Polo (red) and the mitochondrial marker mito-gfp (green). Circles mark areas of Polo and mito-gfp colocalization. (E) WB analysis of subcellular fractions indicates that Polo protein was present in both the cytoplasmic and mitochondrial fractions prepared from 3 rd instar larval brains. Complex-I 30 kd subunit and tubulin serve as mitochondrial and cytoplasmic markers, respectively. (F) Control experiment showing lack of phosphorylation of full-length or fragments of dmiro by PKCzeta in vitro. Autoradiograph is shown. Only kinase autophosphorylation of PKC-zeta was detected. (G) Coomassie blue staining indicating that equal amounts of GST-Miro fusion proteins were used in F. (H) Rhod-2 AM staining showing that Miro-S66A OE failed to induce elevated mitochondrial calcium levels. Traces show mean response of cells present in the microscope field and are representative of more than 3 experiments. (I) Mitochondrial calcium imaging with mito-aeq showing effects of Polo-OE or Polo-RNAi on Ca 2+ mito level. The traces show mean response of 10 dissected larval brains present in the microtiter plate and are representative of more than 3 tests. (J) Mito-SOX staining in Flip-out clones of dmiro-wt, -S66A, -S66E OE NBs. Clones are marked with GFP and outlined with dashed line. Lower panels show Mito-SOX staining only. (K, L) Quantification showing effects of 2-APB or BAPTA feeding in rescuing the loss of type II NBs and IPs induced by Polo-CA OE.
13 (M) Quantification showing that the reduction in the numbers of total NBs and Dpn-positive IPs in Numb OE larval brain was not rescued by feeding with BAPTA and 2-APB. Error bar, SEM; *, P<0.05 in Student s t-tests. Scale bars, 100 µm (B), 10 µm (C, D), 20 µm (J).
14
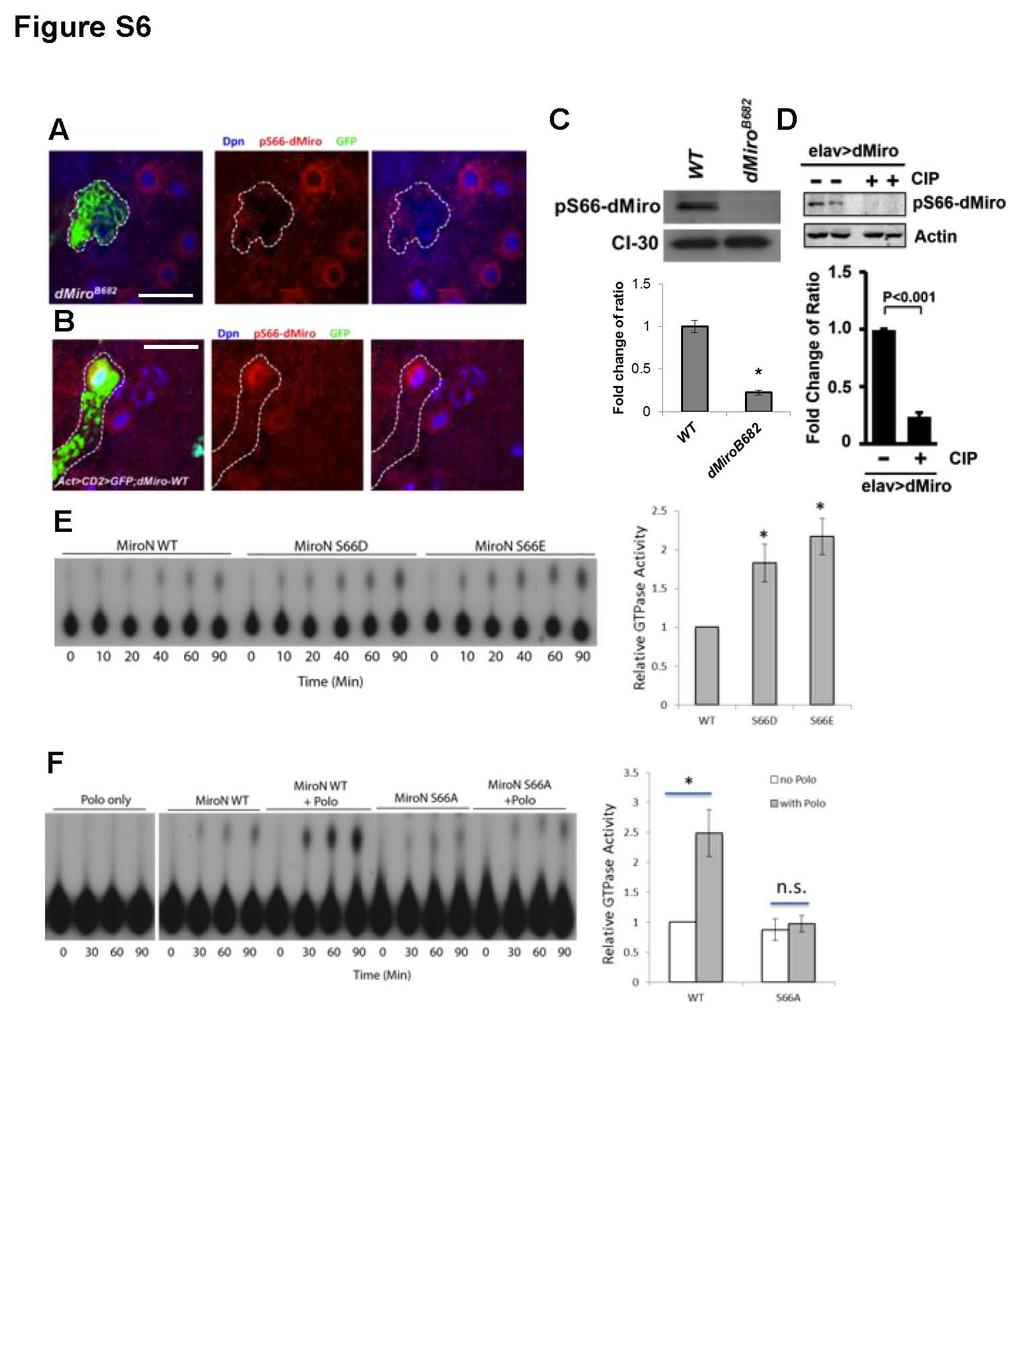
15 Figure S6, Related to Figure 6. Additional Data Showing the Effects of Miro Phosphorylation by Polo (A-C) Immunostaining and WB analyses showing specificity of the p-s66-miro antibody. p-s66-miro signal was lost in immunostaining of dmiro mutant clones (A) or in WB analysis of dmiro mutant brain extracts (C), but increased in immunostaining of dmiro OE NBs (B). NB clones are marked with GFP expression and outlined with dashed lines. (D) WB analysis showing that the ps66-miro signal is sensitive to phosphatase treatment. Protein extract prepared from elav-gal4>dmiro-oe was mocked-treated or treated with calf intestinal alkaline phosphatase (CIP) and subjected to WB analysis. Bar graph shows data quantification. (E) In vitro GTPase assays showing that phospho-mimetic dmiro possesses increased GTPase activity. (F) In vitro GTPase assays showing that prior phosphorylation of dmiro-wt, but not dmiro-s66a, with PLK1 resulted in increased GTPase activity. Error bar, SEM; *, P<0.05 in Student s t-tests.
16
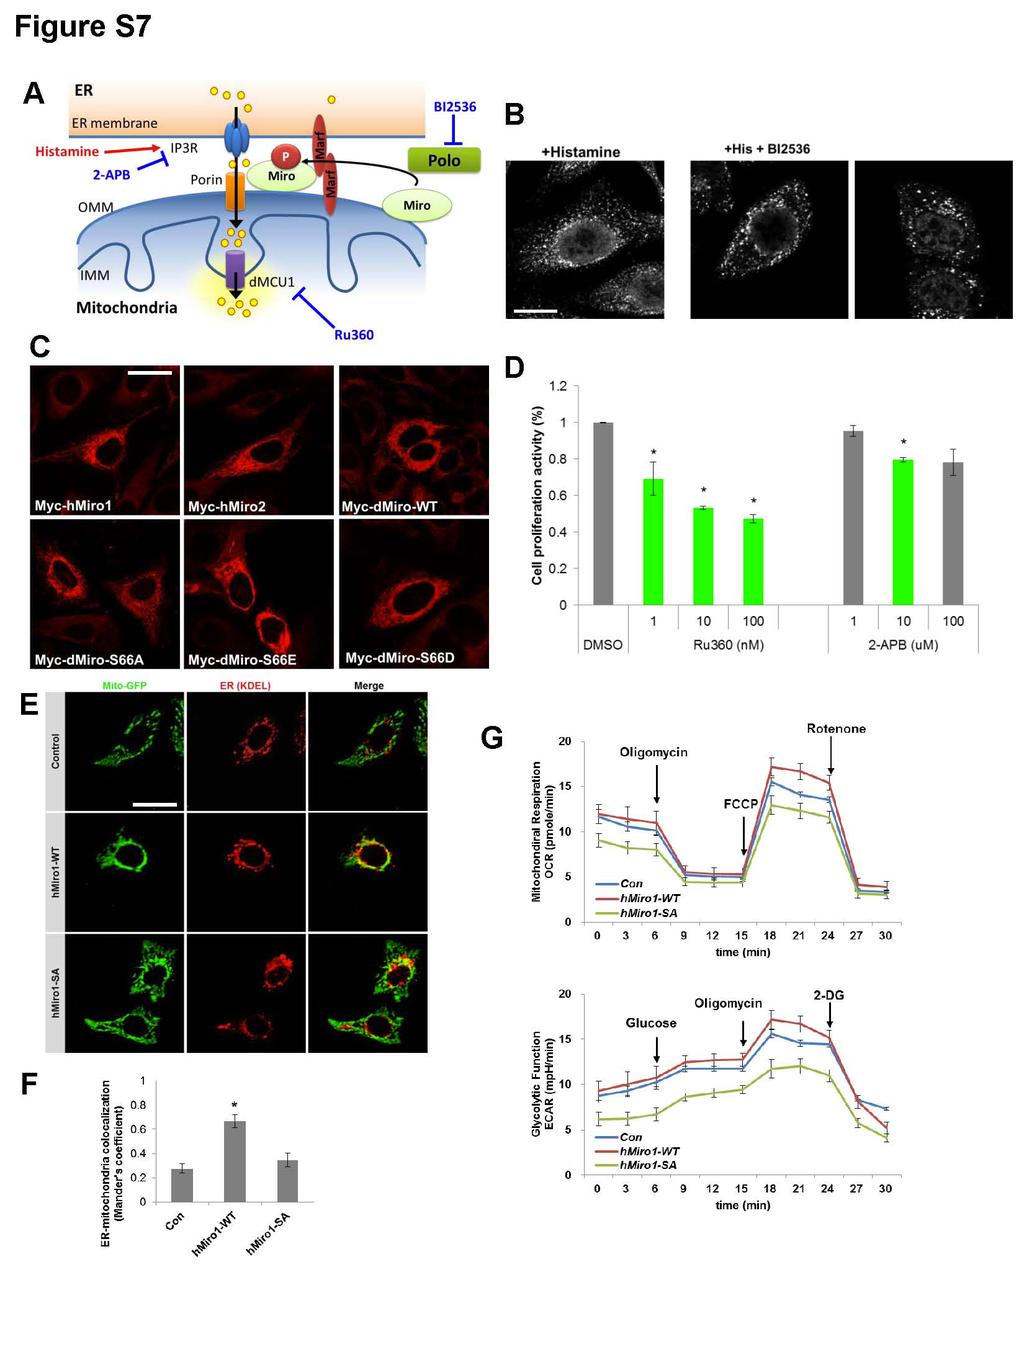
17 Figure S7, Related to Figure 7. Additional Data Showing the Effects of PLK-Miro Signaling in Mammalian Cells (A) Diagram of the molecular players at the ERMCS and the targets of the various compounds used in this study. (B) PLK inhibitor BI2536 reduced the recruitment of hmiro1/rhot1 to the perinuclear ER area induced by histamine in HeLa cells. Immunostaining for hmiro1 is shown. (C) Immunostaining showing differential localization patterns of myc-tagged hmiro1, hmiro2, dmiro, and dmiro phospho-variants to the perinuclear ER area in cultured HeLa cells. Immunostaining for myc is shown. (D) Effects of RU360 and 2-APB on mammalian NSC proliferation. Various concentrations of the compounds were used in cell proliferation assays. (E, F) Immunostaining showing that ER-mitochondria interaction was increased in hmiro1-wt transfected cells comparing with control cells, while ER-mitochondrial interaction did not change in cells transfected with phospho-mutant form of hmiro1 (hmiro1-s59a). F, quantification of mitochondria (Mito-GFP) and ER (KDEL) colocalization using Mander s coefficient evaluation. (G) Real-time changes in OCR and Glycolytic rate (ECAR) were measured in control and hmiro1-wt or hmiro1-s59a transfected human NSCs using the Seahorse Bioscience XF Analyzer. Error bar, SEM; *, P<0.05 in Student s t-tests. Scale bars, 100 µm.
18 Supplemental Experimental Procedures Drosophila Genetics Other Drosophila stocks used in this study are: dmiro B628, UAS-dMiro, UAS-dMiro-Myc (K Zinsmaier); milton 92 (X Wang); porin A2 (JK Chung); polo 9 and polo 10 (DM Glover); UAS-Marf (A Whitworth); UAS-mito-Apoeaquorin (SA Davies), UAS-mito-GCaMP3 (F Kawasaki), PntP1-Gal4 (YN. Jan); 1407-Gal4 (L. Luo). Other transgenes used are: Polo-WT, Polo-CA (J Lipsick); mitogfp (W. Saxton); Marf-RNAi (M. Guo); white-rnai (D. Smith); UAS-Drp1 (H. Bellen); UAS-yNDI1 (D. Walker). dmiro -RNAi (v106683), Polo RNAi (v20177), Porin-RNAi (v101336), dmcu1-rnai (v110781), pdk- RNAi (v106641) and Dicer2 (v60008) are from VDRC; dmiro G6613 (B30172), Itp-r83A 90B.0 (B30737), Itpr83A SV35 (B30740), Df(3L)H99 (B1576), Itp-r83A-RNAi (B51686), UAS-p35 (B5072), Milton EY (B15518), dmcu1 EY (B16357), UAS-GCaMP3.0 (B32116), and other common stocks were obtained from Bloomington Drosophila Stock Center (USA). To enhance the efficiency of knock-down, Dicer2 was coexpressed with RNAi transgenes as previously described (Song and Lu, 2011). Pharmacological Treatments EDTA/EGTA, BAPTA, 2-APB treatments of adult flies: Newly eclosed adult flies were collected and raised on standard corn meal food mixed with the following reagents: EDTA/EGTA (final concentration µm), BAPTA (final concentration µm), 2-APB (final concentration µm). Each vial contained 10 flies and was maintained at 25 C. Drug-containing food was freshly made and replaced every 2-3 days. For the measurements of NB phenotypes (NB size and NB/INP number), flies were mated on drug-containing food and maintained in 25 C. 3 rd instar larvae developed in these foods were selected for dissection and immunohistochemical analysis. Biochemical Assays
19 To perform the dephosphorylation assay for testing the specificity of p-s66 Miro antibody, 50 frozen fly heads of elav-gal4>uas-dmiro-wt genotype was collected and homogenized in the CIPlysis buffer (1x CIP buffer, 50mM Tris HCl ph 8.0, 0.1% NP40, 150mM NaCl, 10% glycerol and EDTA-free protease inhibitors) and centrifuged at 12,000g for 30 min at 4 C. Supernatant was incubated with CIP (New England Biolabs) for 60 min at 37 C. SDS sample loading buffer was added into the mixture to stop the CIP reaction. Samples were boiled at 100 C for 2 min and subjected to WB analysis. For WB analysis in subcellular fractions, fifty 3 rd instar larva brains were dissected and homogenized in HBS buffer, and cytoplasmic and mitochondrial fractions separated as described above. For measuring the level of cytosolic GCaMP and mito-gcamp proteins, 3 rd instar larva brains were dissected and homogenized in lysis buffer and blotted with anti-gfp antibody. The primary antibodies used for WB were: dmiro (1:1000), p-pdhe1 (1:1000, Millipore), PDHE1 (1:1000, abcam), p-ampk (1:1000, Cell Signaling), AMPK (1:500, Cell Signaling), cyt C (1:100; Invitrogen), p-thr (1:1000, Sigma), p-ser (1:2000, Invitrogen), VDAC (1:1000; Cell Signaling), Marf (1:1000, Dr. A Whitworth), IP3R (1:1000; Dr. G Hasan), IP3R (1:1000, Santa Cruz), MCU1 (1:1000; Santa Cruz), Actin (1:1000; Millipore), NDUFS3 (1:10000, MitoScience), Calnexin (1:1000; Novus), dkhc (1:1000, Cytoskeleton), GFP (1:5000, abcam), alpha-tubulin (1:1000, AbD Serotec), Porin (1:1000, Dr. JK Chung), Polo (1:1000, Dr. J Lipsick). In Vitro GTPase Assay GST fusion proteins of dmiro-n fragment containing the first GTPase domain were used in the assay. To test the effect of Polo phosphorylation on dmiro GTPase activity, GST-dMiro-N coupled to glutathione agarose beads was first subjected to in vitro phosphorylation by PLK1, extensively washed with GTPase assay buffer, before used in the GTPase assay. The GTPase activity of Miro (final concentration of 5 µm) was assayed in 10µl of 20 mm HEPES buffer (ph 7.4) containing 100 mm KCl, 10 mm MgCl 2, 5 µm cold GTP, 5 µm GDP, 1 mm DTT in the presence of 18 nm hot GTP (α- 32 P-labeled
20 GTP) at 30 C. At each incubation time, the reaction was quenched by the addition of an equal volume of a stop solution (0.5% SDS, 10 mm EDTA, and 2 mm DTT) and heated at 65 C for 1 min. One microliter of each reaction was spotted onto a polyethyleneimine-cellulose thin layer chromatography (TLC) plate (Sigma-Aldrich) and resolved in 1 M formic acid and 0.5 M LiCl solution. The TLC plate was then dried and exposed to Kodak BioMax MS Film. In vivo Ca 2+ Imaging For measuring mitochondrial Ca 2+ with mito-aeq (apoaequorin), larval brains were dissected from transgenic flies and incubated for 4 h in Schneider's medium containing the cofactor of apoaequorin (2.5 µm coelenterazine). Larval brains were placed in an automated luminometer, and base-line luminescence was measured for at least 30 s before adding the IP3R agonist histamine (5 µm). Real-time luminescence was then continuously measured for 5 min. For measuring background level of intercellular calcium, tissue was discharged by incubating in a lysis buffer (1% Triton X-100, 100mM CaCl 2 ). The relative change in luminescence were determined by calculations of ΔF/F 0 for each time point of each measurement as (F i -F 0 )/F 0 X100, where F 0 is the background luminescence without larval brain, and F i the luminescence value for each time point of each measurement. For calcium imaging with GCaMP, the pan-nb 1407-Gal4 driver was used to express mitochondria-targeted (UAS-mito-GCaMP3.0) (Lutas et al., 2012) or cytosolic (UAS-GCaMP3.0) GCaMP in 3 rd instar larvae raised at 29 C. After briefly washing the larvae in 1x PBS, brains were dissected and immediately placed on the glass slides for live imaging. Images were taken with a Leica TCS SP5 AOBS confocal microscope equipped with a laser scanner and a 40x oil-immersion objective. Series of z-stack images of the larvae brain (step size of 0.5 µm) were taken (1024x1024 pixel; pinhole 1AU; 1x digital zoom) using the 488 nm excitation argon laser set at 20% output power for GFP signals. The intensity of GFP signals in 10 different NBs were measured in merged images through LAS AF (Leica).
21 Measurement of cytosolic Calcium [Ca 2+ ] c and estimation of ER store Ca 2+ content was performed as previously described (Feng et al., 2010) with minor modification. HeLa cells were plated on coverslips and then transfected with pcdna-hmiro1 or empty vector before measuring cytosolic Ca 2+. Cells were loaded with Fura-2 AM at 1µM in calcium recording buffer (126 mm NaCl, 2 mm MgCl 2, 4.5 mm KCl, 10 mm Glucose, 20 mm Hepes ph 7.4, 2 mm CaCl 2 ) or Ca 2+ -free buffer (No CaCl 2 in calcium recording buffer) for 30 min. After loading, cells were incubated in same calcium recording buffer without Fura-2 AM for 20 min. Cells were excited at 340 nm and 380 nm, and Fura-2 AM emission at 505 nm was monitored in Olympus real-time Calcium imaging microscope (FV-1000). Calibration of Fura-2 AM was performed as described (Palmer et al., 2004). Cells were treated with 10 mm ionomycin and 10 mm EGTA in Ca 2+ free buffer to obtain R min and with 20 mm Ca 2+ in calcium recording buffer to obtain R max. The standard equation: K d [(R-R min )/(R max -R)]*S f /S b was used to convert the Fura-2 AM ratio to cytosolic calcium, where S f and S b are the emission intensities at 380 nm for Ca 2+ free and Ca 2+ -bound Fura-2 AM, respectively. R min and R max values were multiplied by 0.85 to adjust for the minimum viscosity effect. For quantification of ionomycin-releasable ER Ca 2+ stores, the integrated Ca 2+ flux within the 2min after ionomycin treatment was calculated using the summation of ([R n /R 0 ]-1); R is the ratio of fluorescence intensity upon excitation at 340 nm to that upon excitation at 380 nm, n is the number of measurement, R 0 is the background intensity ratio, and R n is the fluorescence intensity ratio at time point n. Immunohistochemistry Immunohistochemistry of mito-gfp in Drosophila brain was performed as described (Wu et al., 2013). The primary antibodies used were: chicken anti-gfp (1:2000; Abcam), mouse anti-eyeless (1:1000), mouse anti-pros (1:200) and mouse anti-nicd (1:100; Developmental Studies Hybridoma Bank [DSHB]), guinea pig anti-dpn (1:1000; J. Skeath), rabbit anti-dpn (1:1000; YN Jan), guinea pig anti- Dichaete (1:500; J. Nambu), anti-miranda (1:500; YN Jan), rabbit anti-th (1:500), Guinea pig antidmiro (1:500; K Zinsmaier), ps66-dmiro (1:200), Rhot1 (1:200), KDEL (1:200, Chemicon), ppdhe1
22 (1:200, Millipore), Caspase-3 (1:100, Cell Signaling), p-eif2alpha (1:100, Cell Signaling), ATPsyn5α (1:500, abcam), Calnexin (1:200, abcam), Myc (1:1000, Santa Cruz). All secondary antibodies (Molecular Probes) and Texas Red or FITC-conjugated anti-hrp (Jackson ImmunoResearch Laboratories) were used at 1:200 and incubated for about 2 hours at room temperature. Laval preparations were mounted in SlowFade Antifade kit (Invitrogen). Measuring Mitochondrial Membrane Potential Third instar level brains expressing mito-gcamp3.0 were dissected and treated with 100 nm TMRM (Tetramethylrhodamine methyl ester perchlorate, Sigma) in 0.1% PBST for 1 hr at room temperature. After treatment with TMRM, brains were mounted in 1X PBS. As a control, 20 µm CCCP was applied for 1 hour on the same brain samples under the coverslip. Images were taken with a Leica TCS SP5 AOBS confocal microscope equipped with a laser scanner and a 40x oil-immersion objective. Series of z-stack images of the larval brain (step size of 0.5 µm) were taken (1024x1024 pixel; pinhole 1AU; 1x digital zoom), and processed under identical conditions in Photoshop. Measurement of Mitochondrial Oxygen Consumption Rate (OCR) and Glycolytic Rate (ECAR) The mitochondrial OCR was determined using a XF-24 analyzer (Seahorse Biosciences). ReN cells were plated in a XF 24 cell culture microplate. The next day, the cells were incubated with lowglucose (1 mm) medium overnight and the sensor cartridge was hydrated overnight according to the manufacturers instructions. Measurements were performed 48 h after transfection. The measured values were normalized to protein levels. The cells were washed using the XF Prep Station three times with Seahorse Medium containing 10 mm galactose and 1 mm pyruvate. Mitochondrial function was analyzed using the XF Cell Mito Stress Test Kit (Seahorse Biosciences) and all measurements were carried out at 37 C. The following drugs were diluted in Seahorse Medium and loaded onto the sensor cartridge: oligomycin, carbonyl cyanide p-(trifluoromethoxy) phenylhydrazone (FCCP), and rotenone. The drugs
23 were diluted in Seahorse Medium and loaded onto the sensor cartridge. Measured values were normalized to protein levels. For measuring glycolytic rate (ECAR), cells in a XF 24 cell culture microplate were incubated for 24 hr before the assay. The media was changed to DMEM (without serum, glucose or bicarbonate, but with 2 mm Glutamine). Injections of 10 mm glucose, 3 µm oligomycin and 0.1 M 2-DG were diluted in the DMEM media and loaded onto ports A, B and C respectively. The assay was repeated at least 3 times. Statistical Analysis: Statistical significance of all data were evaluated by unpaired Student's t-tests. Error bars represent standard error of the mean (SEM).
24 Supplemental References Feng, M., Grice, D.M., Faddy, H.M., Nguyen, N., Leitch, S., Wang, Y., Muend, S., Kenny, P.A., Sukumar, S., Roberts-Thomson, S.J., et al. (2010). Store-independent activation of Orai1 by SPCA2 in mammary tumors. Cell 143, Lutas, A., Wahlmark, C.J., Acharjee, S., and Kawasaki, F. (2012). Genetic analysis in Drosophila reveals a role for the mitochondrial protein p32 in synaptic transmission. G3 2, Palmer, A.E., Jin, C., Reed, J.C., and Tsien, R.Y. (2004). Bcl-2-mediated alterations in endoplasmic reticulum Ca2+ analyzed with an improved genetically encoded fluorescent sensor. Proc Natl Acad Sci USA 101, Song, Y., and Lu, B. (2011). Regulation of cell growth by Notch signaling and its differential requirement in normal vs. tumor-forming stem cells in Drosophila. Genes Dev 25, Wu, Z., Sawada, T., Shiba, K., Liu, S., Kanao, T., Takahashi, R., Hattori, N., Imai, Y., and Lu, B. (2013). Tricornered/NDR kinase signaling mediates PINK1-directed mitochondrial quality control and tissue maintenance. Genes Dev 27,
09/30/2017. Kyu-Sun Lee, Ph.D. Metabolism & Neurophysiology Research Group Hazard Monitoring BNT Res Center
 09/30/2017 Kyu-Sun Lee, Ph.D. Metabolism & Neurophysiology Research Group Hazard Monitoring BNT Res Center Conflict of interest disclosure None Committee of Scientific Affairs Committee of Scientific Affairs
Supplementary Figure 1.
 Supplementary Figure 1. Characterisation of IHG-1 overexpressing and knockdown cell lines. (A) Total cellular RNA was prepared from HeLa cells stably overexpressing IHG-1 or mts-ihg-1. IHG-1 mrna was quantified
Role of Mitochondrial Remodeling in Programmed Cell Death in
 Developmental Cell, Vol. 12 Supplementary Data Role of Mitochondrial Remodeling in Programmed Cell Death in Drosophila melanogaster Gaurav Goyal, Brennan Fell, Apurva Sarin, Richard J. Youle, V. Sriram.
Mitochondrial Dynamics Is a Distinguishing Feature of Skeletal Muscle Fiber Types and Regulates Organellar Compartmentalization
 Cell Metabolism Supplemental Information Mitochondrial Dynamics Is a Distinguishing Feature of Skeletal Muscle Fiber Types and Regulates Organellar Compartmentalization Prashant Mishra, Grigor Varuzhanyan,
Supplemental material
 Supplemental material THE JOURNAL OF CELL BIOLOGY Mourier et al., http://www.jcb.org/cgi/content/full/jcb.201411100/dc1 Figure S1. Size and mitochondrial content in Mfn1 and Mfn2 knockout hearts. (A) Body
Supplementary Information
 Supplementary Information MAP2/Hoechst Hyp.-AP ph 6.5 Hyp.-SD ph 7.2 Norm.-SD ph 7.2 Supplementary Figure 1. Mitochondrial elongation in cortical neurons by acidosis. Representative images of neuronal
Supplemental Figures S1 S5
 Beyond reduction of atherosclerosis: PON2 provides apoptosis resistance and stabilizes tumor cells Ines Witte (1), Sebastian Altenhöfer (1), Petra Wilgenbus (1), Julianna Amort (1), Albrecht M. Clement
SUPPLEMENTARY INFORMATION
 Supplementary Notes Downregulation of atlastin does not affect secretory traffic We investigated whether Atlastin might play a role in secretory traffic. Traffic impairment results in disruption of Golgi
Supplemental Information. The Mitochondrial Fission Receptor MiD51. Requires ADP as a Cofactor
 Structure, Volume 22 Supplemental Information The Mitochondrial Fission Receptor MiD51 Requires ADP as a Cofactor Oliver C. Losón, Raymond Liu, Michael E. Rome, Shuxia Meng, Jens T. Kaiser, Shu-ou Shan,
SUPPLEMENTARY INFORMATION
 DOI: 10.1038/ncb3267 Supplementary Figure 1 A group of genes required for formation or orientation of annular F-actin bundles and aecm ridges: RNAi phenotypes and their validation by standard mutations.
Baz, Par-6 and apkc are not required for axon or dendrite specification in Drosophila
 Baz, Par-6 and apkc are not required for axon or dendrite specification in Drosophila Melissa M. Rolls and Chris Q. Doe, Inst. Neurosci and Inst. Mol. Biol., HHMI, Univ. Oregon, Eugene, Oregon 97403 Correspondence
Supplementary Figure 1. Real time in vivo imaging of SG secretion. (a) SGs from Drosophila third instar larvae that express Sgs3-GFP (green) and
 SGs from Drosophila third instar larvae that express Sgs3-GFP (green) and") Supplementary Figure 1. Real time in vivo imaging of SG secretion. (a) SGs from Drosophila third instar larvae that express Sgs3-GFP (green) and Lifeact-Ruby (red) were imaged in vivo to visualize secretion
Supplementary Figure 1. Real time in vivo imaging of SG secretion. (a) SGs from Drosophila third instar larvae that express Sgs3-GFP (green) and Lifeact-Ruby (red) were imaged in vivo to visualize secretion
SUPPLEMENTAL MATERIAL
 SUPPLEMENTAL MATERIAL Figure S1. Mitochondrial morphology in Fis1-null, Mff-null and Fis1/Mff-null MEF cells. (A) Western blotting of lysates from Fis1-null, Mff-null and Fis1/Mff-null cells. Lysates were
Supplementary Figure 1. CoMIC in 293T, HeLa, and HepG2 cells. (a) Mitochondrial morphology in 293T, HeLa and HepG2 cells. Cells were transfected with
 Mitochondrial morphology in 293T, HeLa and HepG2 cells. Cells were transfected with") Supplementary Figure 1. CoMIC in 293T, HeLa, and HepG2 cells. (a) Mitochondrial morphology in 293T, HeLa and HepG2 cells. Cells were transfected with DsRed-mito. Right panels are time-course enlarged images
Supplementary Figure 1. CoMIC in 293T, HeLa, and HepG2 cells. (a) Mitochondrial morphology in 293T, HeLa and HepG2 cells. Cells were transfected with DsRed-mito. Right panels are time-course enlarged images
Supplementary Figure 1. Biochemical and sequence alignment analyses the
 Supplementary Figure 1. Biochemical and sequence alignment analyses the interaction of OPTN and TBK1. (a) Analytical gel filtration chromatography analysis of the interaction between TBK1 CTD and OPTN(1-119).
SUPPLEMENTARY INFORMATION
 DOI: 10.1038/ncb2647 Figure S1 Other Rab GTPases do not co-localize with the ER. a, Cos-7 cells cotransfected with an ER luminal marker (either KDEL-venus or mch-kdel) and mch-tagged human Rab5 (mch-rab5,
SUPPLEMENTARY INFORMATION
 Cell viability rate 0.8 0.6 0 0.05 0.1 0.2 0.3 0.4 0.5 0.7 1 Exposure duration (s) Supplementary Figure 1. Femtosecond laser could disrupt and turn off GFP without photons at 473 nm and keep cells alive.
T H E J O U R N A L O F C E L L B I O L O G Y
 T H E J O U R N A L O F C E L L B I O L O G Y Supplemental material Eisner et al., http://www.jcb.org/cgi/content/full/jcb.201312066/dc1 Figure S1. Mitochondrial continuity in adult skeletal muscle. (A)
Nature Neuroscience: doi: /nn.2662
 Supplementary Figure 1 Atlastin phylogeny and homology. (a) Maximum likelihood phylogenetic tree based on 18 Atlastin-1 sequences using the program Quicktree. Numbers at internal nodes correspond to bootstrap
Supporting Online Material for
 www.sciencemag.org/cgi/content/full/1121356/dc1 Supporting Online Material for Polar PIN Localization Directs Auxin Flow in Plants Justyna Wiśniewska, Jian Xu, Daniela Seifertová, Philip B. Brewer, Kamil
Supporting Information
 Supporting Information Mullins et al. 10.1073/pnas.0906781106 SI Text Detection of Calcium Binding by 45 Ca 2 Overlay. The 45 CaCl 2 (1 mci, 37 MBq) was obtained from NEN. The general method of 45 Ca 2
13-3. Synthesis-Secretory pathway: Sort lumenal proteins, Secrete proteins, Sort membrane proteins
 13-3. Synthesis-Secretory pathway: Sort lumenal proteins, Secrete proteins, Sort membrane proteins Molecular sorting: specific budding, vesicular transport, fusion 1. Why is this important? A. Form and
Supporting Information
 Supporting Information Wang et al. 10.1073/pnas.0804871105 SI Materials and Methods Cell Culture and Transfection. Human neuroblastoma M17 cells were grown as described before (1). Transfection was performed
4) Please cite Dagda et al J Biol Chem 284: , for any publications or presentations resulting from use or modification of the macro.
 Please cite Dagda et al J Biol Chem 284: , for any publications or presentations resulting from use or modification of the macro.") Supplement Figure S1. Algorithmic quantification of mitochondrial morphology in SH- SY5Y cells treated with known fission/fusion mediators. Parental SH-SY5Y cells were transiently transfected with an empty
Supplement Figure S1. Algorithmic quantification of mitochondrial morphology in SH- SY5Y cells treated with known fission/fusion mediators. Parental SH-SY5Y cells were transiently transfected with an empty
Supplementary Figure 1: To test the role of mir-17~92 in orthologous genetic model of ADPKD, we generated Ksp/Cre;Pkd1 F/F (Pkd1-KO) and Ksp/Cre;Pkd1
 and Ksp/Cre;Pkd1") Supplementary Figure 1: To test the role of mir-17~92 in orthologous genetic model of ADPKD, we generated Ksp/Cre;Pkd1 F/F (Pkd1-KO) and Ksp/Cre;Pkd1 F/F ;mir-17~92 F/F (Pkd1-miR-17~92KO) mice. (A) Q-PCR
Supplementary Figure 1: To test the role of mir-17~92 in orthologous genetic model of ADPKD, we generated Ksp/Cre;Pkd1 F/F (Pkd1-KO) and Ksp/Cre;Pkd1 F/F ;mir-17~92 F/F (Pkd1-miR-17~92KO) mice. (A) Q-PCR
TNFα 18hr. Control. CHX 18hr. TNFα+ CHX 18hr. TNFα: 18 18hr (KDa) PARP. Cleaved. Cleaved. Cleaved. Caspase3. Pellino3 shrna. Control shrna.
 PARP. Cleaved. Cleaved. Cleaved. Caspase3. Pellino3 shrna. Control shrna.") Survival ( %) a. TNFα 18hr b. Control sirna Pellino3 sirna TNFα: 18 18hr c. Control shrna Pellino3 shrna Caspase3 Actin Control d. Control shrna Pellino3 shrna *** 100 80 60 CHX 18hr 40 TNFα+ CHX 18hr
Survival ( %) a. TNFα 18hr b. Control sirna Pellino3 sirna TNFα: 18 18hr c. Control shrna Pellino3 shrna Caspase3 Actin Control d. Control shrna Pellino3 shrna *** 100 80 60 CHX 18hr 40 TNFα+ CHX 18hr
camp Direct Immunoassay Kit
 camp Direct Immunoassay Kit Catalog Number KA0886 100 assays Version: 05 Intended for research use only www.abnova.com Table of Contents Introduction... 3 Background... 3 General Information... 4 Materials
In Situ Gelation-Induced Death of Cancer Cells Based on Proteinosomes
 Supporting information for In Situ Gelation-Induced Death of Cancer Cells Based on Proteinosomes Yuting Zhou, Jianmin Song, Lei Wang*, Xuting Xue, Xiaoman Liu, Hui Xie*, and Xin Huang* MIIT Key Laboratory
Supplemental Data. Chen and Thelen (2010). Plant Cell /tpc
. Plant Cell /tpc") Supplemental Data. Chen and Thelen (2010). Plant Cell 10.1105/tpc.109.071837 1 C Total 5 kg 20 kg 100 kg Transmission Image 100 kg soluble pdtpi-gfp Plastid (PDH-alpha) Mito (PDH-alpha) GFP Image vector
Supplemental Data. Chen and Thelen (2010). Plant Cell 10.1105/tpc.109.071837 1 C Total 5 kg 20 kg 100 kg Transmission Image 100 kg soluble pdtpi-gfp Plastid (PDH-alpha) Mito (PDH-alpha) GFP Image vector
Supporting Information
 Supporting Information Cao et al. 10.1073/pnas.1306220110 Gram - bacteria Hemolymph Cytoplasm PGRP-LC TAK1 signalosome Imd dfadd Dredd Dnr1 Ikk signalosome P Relish Nucleus AMP and effector genes Fig.
Illegitimate translation causes unexpected gene expression from on-target out-of-frame alleles
 Illegitimate translation causes unexpected gene expression from on-target out-of-frame alleles created by CRISPR-Cas9 Shigeru Makino, Ryutaro Fukumura, Yoichi Gondo* Mutagenesis and Genomics Team, RIKEN
7.06 Cell Biology EXAM #3 April 21, 2005
 7.06 Cell Biology EXAM #3 April 21, 2005 This is an open book exam, and you are allowed access to books, a calculator, and notes but not computers or any other types of electronic devices. Please write
Optimization of Immunoblot Protocol for Use with a Yeast Strain Containing the CDC7 Gene Tagged with myc
 OPTIMIZATION OF IMMUNOBLOT PROTOCOL 121 Optimization of Immunoblot Protocol for Use with a Yeast Strain Containing the CDC7 Gene Tagged with myc Jacqueline Bjornton and John Wheeler Faculty Sponsor: Anne
cgmp ELISA Kit (Direct Competitive) Based on Monoclonal Anti-cGMP Antibody
 Based on Monoclonal Anti-cGMP Antibody") (FOR RESEARCH USE ONLY. DO NOT USE IT IN CLINICAL DIAGNOSIS!) cgmp ELISA Kit (Direct Competitive) Based on Monoclonal Anti-cGMP Antibody Catalog No: E-EL-DS02 96T This manual must be read attentively and
(FOR RESEARCH USE ONLY. DO NOT USE IT IN CLINICAL DIAGNOSIS!) cgmp ELISA Kit (Direct Competitive) Based on Monoclonal Anti-cGMP Antibody Catalog No: E-EL-DS02 96T This manual must be read attentively and
FSC-W FSC-H CD4 CD62-L
 Supplementary Fig. 1 a SSC-A FSC-A FSC-W FSC-H SSC-W SSC-H CD4 CD62-L b SSC-A FSC-A FSC-W FSC-A FSC-A 7-AAD FSC-A CD4 IL-9 CD4 c SSC-A FSC-A FSC-W FSC-H SSC-W SSC-H 7-AAD KI67 Annexin-V 7-AAD d I L -5
Protease Inhibitor Cocktail A (1 tablet / 7 10 ml, Roche Cat# ) Protease inhibitor Cocktail B (0.5ml per 250ml, Calbiochem Cat# )
 Protease inhibitor Cocktail B (0.5ml per 250ml, Calbiochem Cat# )") Protocol for Western Blotting Tissue/Cell Sample Preparation Lysis Buffer 1 (ph8.0) o 50mM Tris-Cl o 150mM NaCl o 1% v/v NP40 o protease inhibitor cocktail A/B Lysis Buffer 2 (RIPA) (ph 8.0) o 50mM Tris-Cl
Protocol for Western Blotting Tissue/Cell Sample Preparation Lysis Buffer 1 (ph8.0) o 50mM Tris-Cl o 150mM NaCl o 1% v/v NP40 o protease inhibitor cocktail A/B Lysis Buffer 2 (RIPA) (ph 8.0) o 50mM Tris-Cl
T H E J O U R N A L O F C E L L B I O L O G Y
 Supplemental material Kasprowicz et al., http://www.jcb.org/cgi/content/full/jcb.201310090/dc1 T H E J O U R N A L O F C E L L B I O L O G Y Figure S1. NMJ morphology of shi 12-12B ; shi-4c not treated
SUPPLEMENTARY INFORMATION
 doi:10.1038/nature10923 Supplementary Figure 1 Ten-a and Ten-m antibody and cell type specificities. a c, Representative single confocal sections of a Drosophila NMJ stained with antibodies to Ten-a (red),
NucView TM 488 Caspase-3 Assay Kit for Live Cells
 NucView TM 488 Caspase-3 Assay Kit for Live Cells Catalog Number: 30029 (100-500 assays) Contact Information Address: Biotium, Inc. 3423 Investment Blvd. Suite 8 Hayward, CA 94545 USA Telephone: (510)
Immunoassay Kit (Colorimetric)
") RayBio cgmp Direct Immunoassay Kit (Colorimetric) User Manual Version 1.0 May 25, 2014 RayBio cgmp Direct Immunoassay Kit (Colorimetric) Protocol (Cat#: 68AT-cGMP-S100) RayBiotech, Inc. We Provide You
RayBio cgmp Direct Immunoassay Kit (Colorimetric) User Manual Version 1.0 May 25, 2014 RayBio cgmp Direct Immunoassay Kit (Colorimetric) Protocol (Cat#: 68AT-cGMP-S100) RayBiotech, Inc. We Provide You
Hybrid Gold Superstructures: Synthesis and. Specific Cell Surface Protein Imaging Applications
 Supporting Information Hybrid Gold Nanocube@Silica@Graphene-Quantum-Dot Superstructures: Synthesis and Specific Cell Surface Protein Imaging Applications Liu Deng, Ling Liu, Chengzhou Zhu, Dan Li and Shaojun
Chapter 4 Evaluating a potential interaction between deltex and git in Drosophila: genetic interaction, gene overexpression and cell biology assays.
 Evaluating a potential interaction between deltex and git in Drosophila: genetic interaction, gene overexpression and cell biology assays. The data described in chapter 3 presented evidence that endogenous
Supplementary Information
 Supplementary Information Supplementary Figure 1. JAK/STAT in early wing development (a-f) Wing primordia of second instar larvae of the indicated genotypes labeled to visualize expression of upd mrna
NAD + /NADH Assay [Colorimetric]
![NAD + /NADH Assay [Colorimetric]](/thumbs/91/105496846.jpg "NAD + /NADH Assay [Colorimetric]") G-Biosciences 1-800-628-7730 1-314-991-6034 technical@gbiosciences.com A Geno Technology, Inc. (USA) brand name NAD + /NADH Assay [Colorimetric] (Cat. #786 1539, 786 1540) think proteins! think G-Biosciences
G-Biosciences 1-800-628-7730 1-314-991-6034 technical@gbiosciences.com A Geno Technology, Inc. (USA) brand name NAD + /NADH Assay [Colorimetric] (Cat. #786 1539, 786 1540) think proteins! think G-Biosciences
Human Coagulation Factor X Total Antigen ELISA Kit
 Human Coagulation Factor X Total Antigen ELISA Kit Catalog No: IHFXKT-TOT Lot No: SAMPLE INTENDED USE This human coagulation Factor X antigen assay is intended for the quantitative determination of total
SUPPLEMENTARY INFORMATION
 DOI: 10.1038/ncb2362 Figure S1 CYLD and CASPASE 8 genes are co-regulated. Analysis of gene expression across 79 tissues was carried out as described previously [Ref: PMID: 18636086]. Briefly, microarray
SUPPLEMENTARY INFORMATION
 DOI: 10.1038/ncb2215 Figure S1 Number of egfp-vps4a bursts versus cellular expression levels. The total number of egfp-vps4a bursts, counted at the end of each movie (frame 2000, after 1h 28 min) are plotted
Supporting Information. Carbon Imidazolate Framework-8 Nanoparticles for
 Supporting Information Carbon Nanodots@Zeolitic Imidazolate Framework-8 Nanoparticles for Simultaneous ph-responsive Drug Delivery and Fluorescence Imaging Liu He, a Tingting Wang, b Jiping An, c Xiaomeng
Downloaded from at University of Washington Health Sciences Libraries, on November 12, 2010
 THE JOURNAL OF BIOLOGICAL CHEMISTRY VOL. 285, NO. 41, pp. 31590 31602, October 8, 2010 2010 by The American Society for Biochemistry and Molecular Biology, Inc. Printed in the U.S.A. Rab32 Modulates Apoptosis
Analyzing Microgram Quantities of Isolated Mitochondria in the Agilent Seahorse XFe/XF24 Analyzer
 Analyzing Microgram Quantities of Isolated Mitochondria in the Agilent Seahorse XFe/XF24 Analyzer Application Note Introduction Enhanced appreciation of the role of altered mitochondrial function in tumorigenesis,
Superoxide Dismutase Activity Assay Kit
 Superoxide Dismutase Activity Assay Kit Catalog Number KA0783 100 assays Version: 04 Intended for research use only www.abnova.com Table of Contents Introduction... 3 Background... 3 General Information...
Mitochondrial Membrane Potential by Object Spot Counting
 A p p l i c a t i o n N o t e Mitochondrial Membrane Potential by Object Spot Counting Using Gen5 to Analyze Mitochondrial Membrane Potential Sarah Beckman, PhD, Principal Scientist, BioTek Instruments,
SUPPLEMENTARY INFORMATION
 SUPPLEMENTARY METHODS Mef2 primary screen. RNAi hairpins from the VDRC collection were crossed to Mef2-GAL4 at 27 C. After 2 weeks lethality rate and stage was scored, and if possible 20-30 males containing
Live-cell imaging of alkyne-tagged small biomolecules by stimulated Raman scattering
 Live-cell imaging of alkyne-tagged small biomolecules by stimulated Raman scattering Lu Wei, Fanghao Hu, Yihui Shen, Zhixing Chen, Yong Yu, Chih-Chun Lin, Meng C. Wang, Wei Min * * To whom correspondence
Protocol for Coating QD-COOH on glass slides Chris Ochs 19/09/12 Modified by Kathy Lu 2/27/2013
 Protocol for Coating QD-COOH on glass slides cjochs@smart.mit.edu Chris Ochs 19/09/12 Modified by Kathy Lu 2/27/2013 kalu@ucsd.edu Cleaning glass slides prior to coupling and Amination with APTS (Aminopropyl
SUPPLEMENTARY INFORMATION
 GP2 Type I-piliated bacteria FAE M cell M cell pocket idc T cell mdc Generation of antigenspecific T cells Induction of antigen-specific mucosal immune response Supplementary Figure 1 Schematic diagram
Anterograde Activin Signaling Regulates Postsynaptic Membrane Potential and GluRIIA/B Abundance at the Drosophila Neuromuscular Junction
 Anterograde Activin Signaling Regulates Postsynaptic Membrane Potential and GluRIIA/B Abundance at the Drosophila Neuromuscular Junction Myung-Jun Kim, Michael B. O Connor* Department of Genetics, Cell
Rational design of a ratiometric fluorescent probe with a large emission shift for the facile detection of Hg 2+
 Rational design of a ratiometric fluorescent probe with a large emission shift for the facile detection of Hg 2+ Weimin Xuan, a Chen Chen, b Yanting Cao, a Wenhan He, a Wei Jiang, a Kejian Li, b* and Wei
Malachite Green Phosphate Detection Kit Catalog Number: DY996
 Malachite Green Phosphate Detection Kit Catalog Number: DY996 This Malachite Green Phosphate Detection Kit employs a simple, sensitive, reproducible, and non-radioactive method for measuring inorganic
7.06 Spring 2004 PS 6 KEY 1 of 14
 7.06 Spring 2004 PS 6 KEY 1 of 14 Problem Set 6. Question 1. You are working in a lab that studies hormones and hormone receptors. You are tasked with the job of characterizing a potentially new hormone
RayBio Protease Activity Assay Kit
 RayBio Protease Activity Assay Kit User Manual Version 1.0 Mar 25, 2013 RayBio Protease Activity Assay (Cat#: 68AT-Protease-S100) RayBiotech, Inc. We Provide You With Excellent Support And Service Tel:(Toll
Programmed ph-driven Reversible Association and Dissociation of Inter-Connected. Circular DNA Dimer Nanostructures
 Supporting information Programmed ph-driven Reversible Association and Dissociation of Inter-Connected Circular DNA Dimer Nanostructures Yuwei Hu, Jiangtao Ren, Chun-Hua Lu, and Itamar Willner* Institute
Supplementary Materials for
 www.sciencesignaling.org/cgi/content/full/6/301/ra98/dc1 Supplementary Materials for Regulation of Epithelial Morphogenesis by the G Protein Coupled Receptor Mist and Its Ligand Fog Alyssa J. Manning,
The Role of GRASP65 in Golgi Cisternal Stacking and Cell Cycle Progression
 Traffic 2010; 11: 827 842 2010 John Wiley & Sons A/S doi:10.1111/j.1600-0854.2010.01055.x The Role of GRASP65 in Golgi Cisternal Stacking and Cell Cycle Progression Danming Tang, Hebao Yuan and Yanzhuang
Nature Protocols: doi: /nprot Supplementary Figure 1
 Supplementary Figure 1 Photographs of the 3D-MTC device and the confocal fluorescence microscopy. I: The system consists of a Leica SP8-Confocal microscope (with an option of STED), a confocal PC, a 3D-MTC
Figure S1, related to Figure 1. Mitochondrial localization of Mfn2 ActA and ER localization of Mfn2 IYFFT and their functional analyses.
 Molecular Cell, Volume 51 Supplemental Information MITOL Regulates Endoplasmic Reticulum-Mitochondria Contacts via Mitofusin2 Ayumu Sugiura, Shun Nagashima, Takeshi Tokuyama, Taku Amo, Yohei Matsuki, Satoshi
Supplementary Materials for
 www.sciencemag.org/cgi/content/full/science.1244624/dc1 Supplementary Materials for Cytoneme-Mediated Contact-Dependent Transport of the Drosophila Decapentaplegic Signaling Protein Sougata Roy, Hai Huang,
7.06 Cell Biology EXAM #3 KEY
 7.06 Cell Biology EXAM #3 KEY May 2, 2006 This is an OPEN BOOK exam, and you are allowed access to books, a calculator, and notes BUT NOT computers or any other types of electronic devices. Please write
Supplementary Information
 Supplementary Information N-propargyloxycarbamate monosaccharides as metabolic chemical reporters of carbohydrate salvage pathways and protein glycosylation Leslie A. Bateman, Balyn W. Zaro, Kelly N. Chuh
A mitochondria-targeting fluorescent probe for detection of mitochondrial labile Fe(II) ion
 ion") Electronic Supplementary Material (ESI) for Metallomics. This journal is The Royal Society of Chemistry 2018 A mitochondria-targeting fluorescent probe for detection of mitochondrial labile Fe(II) ion
Electronic Supplementary Material (ESI) for Metallomics. This journal is The Royal Society of Chemistry 2018 A mitochondria-targeting fluorescent probe for detection of mitochondrial labile Fe(II) ion
Supplementary figure 1 Application of tmfret in LeuT. (a) To assess the feasibility of using tmfret for distance-dependent measurements in LeuT, a
 To assess the feasibility of using tmfret for distance-dependent measurements in LeuT, a") Supplementary figure 1 Application of tmfret in LeuT. (a) To assess the feasibility of using tmfret for distance-dependent measurements in LeuT, a series of tmfret-pairs comprised of single cysteine mutants
Supplementary figure 1 Application of tmfret in LeuT. (a) To assess the feasibility of using tmfret for distance-dependent measurements in LeuT, a series of tmfret-pairs comprised of single cysteine mutants
SUPPLEMENTARY INFORMATION
 doi:10.1038/nature11419 Supplementary Figure 1 Schematic representation of innate immune signaling pathways induced by intracellular Salmonella in cultured macrophages. a, During the infection Salmonella
Optimization of an Adapta Kinase Assay for CAMK1
 Overview Optimization of an Adapta Kinase Assay for CAMK1 This protocol describes how to perform an Adapta assay with the kinase CAMK1. To maximize the ability of the assay to detect ATP-competitive inhibitors,
RayBio Human Phospho-eIF- 2alpha (Ser52) ELISA Kit
 ELISA Kit") RayBio Human Phospho-eIF- 2alpha (Ser52) ELISA Kit Catalog #: PEL-EIF2A-S52 User Manual Last revised August 10, 2016 Caution: Extraordinarily useful information enclosed ISO 13485 Certified 3607 Parkway
RayBio Human Phospho-eIF- 2alpha (Ser52) ELISA Kit Catalog #: PEL-EIF2A-S52 User Manual Last revised August 10, 2016 Caution: Extraordinarily useful information enclosed ISO 13485 Certified 3607 Parkway
Acid Phosphatase Assay Kit (Colorimetric)
") Acid Phosphatase Assay Kit (Colorimetric) Catalog Number KA0816 500 assays Version: 03 Intended for research use only www.abnova.com Table of Contents Introduction... 3 Background... 3 General Information...
Acid Phosphatase Assay Kit (Colorimetric) Catalog Number KA0816 500 assays Version: 03 Intended for research use only www.abnova.com Table of Contents Introduction... 3 Background... 3 General Information...
Protocol for Minichip hybridization. Equipment and Reagents needed: BLOCKING SOLUTION (2% [w/v]) CY-3 STREPTAVIDIN
![Protocol for Minichip hybridization. Equipment and Reagents needed: BLOCKING SOLUTION (2% [w/v]) CY-3 STREPTAVIDIN](/thumbs/75/71532736.jpg "Protocol for Minichip hybridization. Equipment and Reagents needed: BLOCKING SOLUTION (2% [w/v]) CY-3 STREPTAVIDIN") Protocol for Minichip hybridization Equipment and Reagents needed: 1,000mL or 250mL Filter Units (PES Membrane) (VWR, 73520-986) 1,000mL or 250mL Receiver Units (VWR, 28199-346/28199-225) Weighing Plate
Protocol for Minichip hybridization Equipment and Reagents needed: 1,000mL or 250mL Filter Units (PES Membrane) (VWR, 73520-986) 1,000mL or 250mL Receiver Units (VWR, 28199-346/28199-225) Weighing Plate
Intracellular GSH Assay Kit
 ab112132 Intracellular GSH Assay Kit Instructions for Use For detecting Intracellular GSH in cells by using our proprietary green fluorescence probe This product is for research use only and is not intended
Supporting information for
 Supporting information for Rewiring multi-domain protein switches: transforming a fluorescent Zn 2+ -sensor into a light-responsive Zn 2+ binding protein Stijn J.A. Aper and Maarten Merkx Laboratory of
Certificate of Analysis
 Certificate of Analysis 10 Old Barn Road Lake Placid, NY 12946 Technical Support: T: 800 548-7853 F: 518 523-4513 email: techserv@upstate.com Sales Department: T: 800 233-3991 F: 781 890-7738 Licensing
Human papillomavirus,hpv ELISA Kit
 Human papillomavirus,hpv ELISA Kit Catalog No: E0787h 96 Tests Operating instructions www.eiaab.com FOR RESEARCH USE ONLY; NOT FOR THERAPEUTIC OR DIAGNOSTIC APPLICATIONS! PLEASE READ THROUGH ENTIRE PROCEDURE
For the rapid, sensitive and accurate measurement of Caspase 9 activity in cell and tissue lysates.
 ab65608 Caspase 9 Assay Kit (Colorimetric) Instructions for Use For the rapid, sensitive and accurate measurement of Caspase 9 activity in cell and tissue lysates. This product is for research use only
A Highly Selective Fluorescent Probe for Fe 3+ in Living Cells: A Stress Induced Cell Based Model Study
 Electronic Supplementary Material (ESI) for rganic & Biomolecular Chemistry. This journal is The Royal Society of Chemistry 2016 Electronic Supplementary Information A Highly Selective Fluorescent Probe
Supplementary Figure 1. SDS-PAGE analysis of GFP oligomer variants with different linkers. Oligomer mixtures were applied to a PAGE gel containing
 Supplementary Figure 1. SDS-PAGE analysis of GFP oligomer variants with different linkers. Oligomer mixtures were applied to a PAGE gel containing 0.1% SDS without boiling. The gel was analyzed by a fluorescent
Measuring Mitochondrial Membrane Potential with JC-1 Using the Cellometer Vision Image Cytometer
 Measuring Mitochondrial Membrane Potential with JC-1 Using the Cellometer Vision Image Cytometer Nexcelom Bioscience LLC. 360 Merrimack Street, Building 9 Lawrence, MA 01843 T: 978.327.5340 F: 978.327.5341
GST Activity Assay Kit (Colorimetric)
") GST Activity Assay Kit (Colorimetric) Catalog Number KA0799 100 assays Version: 03 Intended for research use only www.abnova.com Table of Contents Introduction... 3 Background... 3 General Information...
GST Activity Assay Kit (Colorimetric) Catalog Number KA0799 100 assays Version: 03 Intended for research use only www.abnova.com Table of Contents Introduction... 3 Background... 3 General Information...
Supplementary Figure 1 Structure of the Orai channel. (a) The hexameric Drosophila Orai channel structure derived from crystallography 1 comprises
 The hexameric Drosophila Orai channel structure derived from crystallography 1 comprises") Supplementary Figure 1 Structure of the Orai channel. (a) The hexameric Drosophila Orai channel structure derived from crystallography 1 comprises six Orai subunits, each with identical amino acid sequences
Supplementary Figure 1 Structure of the Orai channel. (a) The hexameric Drosophila Orai channel structure derived from crystallography 1 comprises six Orai subunits, each with identical amino acid sequences
Quantification of NS1 dengue biomarker in serum via optomagnetic nanocluster detection
 Supplementary Information Quantification of NS1 dengue biomarker in serum via optomagnetic nanocluster detection Paula Antunes 1, Daniel Watterson 3, Mattias Parmvi 1, Robert Burger 1, Anja Boisen 1, Paul
Instantaneous and Quantitative Functionalization of Gold Nanoparticles with Thiolated DNA Using a ph-assisted and Surfactant-Free Route
 Supporting Information Instantaneous and Quantitative Functionalization of Gold Nanoparticles with Thiolated DNA Using a ph-assisted and Surfactant-Free Route Xu Zhang,, Mark R. Servos and Juewen Liu *
Monitoring neurite morphology and synapse formation in primary neurons for neurotoxicity assessments and drug screening
 APPLICATION NOTE ArrayScan High Content Platform Monitoring neurite morphology and synapse formation in primary neurons for neurotoxicity assessments and drug screening Suk J. Hong and Richik N. Ghosh
horseradish peroxidase-labeled anti-mouse secondary antibody were procured from
 SUPPORTING INFORMATION Characterization of anti-platelet properties of silver nanoparticles Siddhartha Shrivastava, Tanmay Bera, Sunil K. Singh, Gajendra Singh, P. Ramachandrarao and Debabrata Dash 1.
Lactate Dehydrogenase Assay Kit
 Lactate Dehydrogenase Assay Kit Catalog Number KA0878 500 assays Version: 10 Intended for research use only www.abnova.com Table of Contents Introduction... 3 Background... 3 General Information... 4 Materials
Rat Prolactin ELISA Kit
 Rat Prolactin ELISA Kit Catalog No: IRPRLKT Lot No: SAMPLE INTENDED USE This rat prolactin antigen assay is intended for the quantitative determination of prolactin antigen in rat plasma. For research
Supplementary Figure 1
 Supplementary Figure 1 Supplementary Figure 1. HSP21 expression in 35S:HSP21 and hsp21 knockdown plants. (a) Since no T- DNA insertion line for HSP21 is available in the publicly available T-DNA collections,
Protease Activity Assay Kit
 ab111750 Protease Activity Assay Kit Instructions for Use For the rapid, sensitive and accurate measurement of Protease activity in various samples. This product is for research use only and is not intended
SUPPLEMENTARY INFORMATION
 Supplementary Figure 1 Sns and Duf co-localise in embryonic nephrocytes a-c, Wild-type stage 11 (a),14 (b) and 16 (c) embryos stained with anti-duf (green) and anti-sns (red). Higher magnification images
Full-length GlpG sequence was generated by PCR from E. coli genomic DNA. (with two sequence variations, D51E/L52V, from the gene bank entry aac28166),
,") Supplementary Methods Protein expression and purification Full-length GlpG sequence was generated by PCR from E. coli genomic DNA (with two sequence variations, D51E/L52V, from the gene bank entry aac28166),
Supplementary Methods Protein expression and purification Full-length GlpG sequence was generated by PCR from E. coli genomic DNA (with two sequence variations, D51E/L52V, from the gene bank entry aac28166),
In-gel digestion of immunoprecipitated proteins separated by SDS-PAGE
 In-gel digestion of immunoprecipitated proteins separated by SDS-PAGE (Lamond Lab / April 2008)! Perform all the pipetting steps in a laminar flow hood. We routinely do our digestions in our TC room hoods.
Mitofusin 1 and 2 play distinct roles in mitochondrial fusion reactions via GTPase activity
 Research Article 6535 Mitofusin 1 and 2 play distinct roles in mitochondrial fusion reactions via GTPase activity Naotada Ishihara, Yuka Eura and Katsuyoshi Mihara* Department of Molecular Biology, Graduate
Catalase Assay Kit. Catalog Number KA assays Version: 04. Intended for research use only.
 Catalase Assay Kit Catalog Number KA0884 100 assays Version: 04 Intended for research use only www.abnova.com Table of Contents Introduction... 3 Background... 3 General Information... 4 Materials Supplied...
Caspase Substrate Assay Kit (Colorimetric)
") Caspase Substrate Assay Kit (Colorimetric) Catalog Number KA3694 7 x 25 assays Version: 02 Intended for research use only www.abnova.com Table of Contents Introduction... 3 Background... 3 General Information...
Caspase Substrate Assay Kit (Colorimetric) Catalog Number KA3694 7 x 25 assays Version: 02 Intended for research use only www.abnova.com Table of Contents Introduction... 3 Background... 3 General Information...