INVESTIGATION OF STOCHASTICITY IN GENE EXPRESSION IN RESPONSE TO OSMOTIC STRESS
|
|
|
- Christina Welch
- 6 years ago
- Views:
Transcription
1 INVESTIGATION OF STOCHASTICITY IN GENE EXPRESSION IN RESPONSE TO OSMOTIC STRESS By GAYATHRI BALANDARAM A thesis submitted in partial fulfillment of the requirements for the degree of MASTER OF SCIENCE IN BIOCHEMISTRY WASHINGTON STATE UNIVERSITY School of Molecular Biosciences DECEMBER 2009
2 ii To the Faculty of Washington State University: The members of the Committee appointed to examine the thesis of GAYATHRI BALANDARAM find it satisfactory and recommend that it be accepted. Subra Muralidharan, Ph.D., Chair Raymond Reeves, Ph.D. ChulHee Kang, Ph.D. Chengtao Her, Ph.D.
3 iii ACKNOWLEDGMENT I would like to thank my mentor, Dr. Subra Muralidharan for his guidance, support, motivation, patience, and understanding throughout my years of graduate study. I would also like to thank my committee members, Dr Raymond Reeves, Dr ChulHee Kang and Dr Chengtao Her for their constructive input and help with my research progress. Next I would like to thank the Murali lab members and Assistant Research Professor Dr. Narayanan Srividya for lending their support and assistance in more ways than one. I am grateful to Professor van Oudenaarden, Department of Physics, Massachusetts Institute of Technology for kindly providing the plasmid for my studies. I would like to express my sincerest appreciation and thanks to the family of Marian E. Smith for their endowment to Washington State University that provided support for this research. Finally I want to thank my family for their love and encouragement. I would also like to extend my appreciation to Vijay Navaneethakrishnan for his immense moral support.
4 iv INVESTIGATION OF STOCHASTICITY IN GENE EXPRESSION IN RESPONSE TO OSMOTIC STRESS Abstract by Gayathri Balandaram, M.S. Washington State University December 2009 Chair: Subra Muralidharan Stochasticity in gene expression of a synthetic gene network in E.coli in response to osmotic stress has been characterized by fluorescence microscopy. A synthetic gene network consisting of three genes in a cascade that are sequentially downregulated and reported by CFP and YFP, and fourth independent gene reported by RFP has been subjected to osmotic stress in the range of atmospheres exerted by NaCl and sucrose (0 3 M). The fluorescence intensities and self-correlation parameters for cfp, yfp, and rfp gene expression, and intrinsic, and extrinsic noise parameters for cfp-yfp, cfp-rfp, and yfp-rfp gene pairs determined from the respective protein expression exhibit a combined repression and activation dependence on osmotic stress. Stochasticity in gene expression is almost entirely due to intrinsic noise and decreases in the order cfp-yfp>cfp-rfp>yfp-rfp. This result is surprising given the gene construct where the expression of RFP protein should be independent of CFP and YFP proteins, whose genes repress each other. Under osmotic stress, interaction between coupled and uncoupled genes are activated or repressed to varying levels as a function of pressure contributing to stochasticity in the expression of the genes.
5 v TABLE OF CONTENTS Page ACKNOWLEDGEMENT... iii ABSTRACT... iv LIST OF FIGURES... vi LIST OF TABLES...viii CHAPTER 1. INTRODUCTION Stochasticity in gene expression Noise in synthetic networks Cellular responses to mechanical stress Mechanical Perturbation in the form of osmotic stress MATERIALS AND METHODS RESULTS AND DISCUSSION FUTURE DIRECTIONS...15 REFERENCE...17 APPENDIX...21
6 vi LIST OF FIGURES PAGE Figure-1. Synthetic gene network of 4 genes in E.Coli...9 Figure-2. Bimodal fit for η 2 int for cfp-yfp vs. osmotic stress with NaCl and Bimodal fit for CFP intensity vs. osmotic stress with NaCl...13 Figure-S1. pjm31 plasmid construct...24 Figure-S2. Fluorescence Microscopy images of bacterial populations...25 Figure-S3. Fluorescence intensity distribution in NaCl...26 Figure-S4. Fluorescence intensity distribution in Sucrose...27 Figure-S5. Absorption spectra of bacterial population in NaCl and Sucrose...28 Figure-S6. Fluorescence emission spectra...29 Figure-S7. Fluorescence intensity with increasing osmotic pressure for bacterial populations in NaCl...30 Figure-S8. Fluorescence intensity with increasing osmotic pressure for bacterial populations in Sucrose...31 Figure-S9. Fluorescence Intensity correlation for bacterial population in NaCl...32 Figure-S10. Fluorescence Intensity correlation for bacterial population in Sucrose...33 Figure-S11. Plots of η 2 self with increasing osmotic pressure in NaCl...34 Figure-S12. Plots of η 2 self with increasing osmotic pressure in Sucrose...35 Figure-S13. Plots of η 2 int with increasing osmotic pressure in NaCl...36 Figure-S14. Plots of η 2 int with increasing osmotic pressure in Sucrose...37 Figure-S15. Plots of η 2 ext with increasing osmotic pressure in NaCl...38 Figure-S16. Plots of η 2 ext with increasing osmotic pressure in Sucrose...39 Figure-S17. Plots of η 2 tot with increasing osmotic pressure in NaCl...40 Figure-S18. Plots of η 2 tot with increasing osmotic pressure in Sucrose...41 Figure-S19. Bimodal fits of plots of fluorescence intensities with increasing osmotic
7 vii pressure in NaCl...42 Figure-S20. Bimodal fits of plots of fluorescence intensities with increasing osmotic pressure in Sucrose...43 Figure-S21. Bimodal fits of plots of of η 2 int with increasing osmotic pressure in NaCl...44 Figure-S22. Bimodal fits of plots of of η 2 int with increasing osmotic pressure in Sucrose...45 Figure-S23. Bimodal fits of plots of η 2 self with increasing osmotic pressure in NaCl and Sucrose...46 Figure-S24. Comparison of intrinsic noise (η 2 int) for osmotic stress induced by NaCl and sucrose over 0-54 atm...47
8 viii LIST OF TABLES PAGE Table 1. Spectral properties of fluorescent proteins...8 Table 2. Densities and Osmotic pressures of NaCl and Sucrose solutions...8 Table 3. Repression and activation parameters for η 2 int as a function of osmotic stress...12 Table-S1. Intrinsic noise vs. pressure fitted to the bimodal equation...48 Table-S2. Corrected Fluorescence intensity vs. pressure fitted to the bimodal equation...48 Table-S3. η 2 sc vs. pressure fitted to the bimodal equation...48
9 ix Dedication This dissertation is dedicated to my father, Balandaram Nathan who is my pillar of support and the reason I came this far. Thank you for everything.
10 1 CHAPTER 1 INTRODUCTION Stochasticity in gene expression For an isogenic population of cells grown in homogeneous environments, phenotypic variation has been observed. Examples include, difference in coat pattern and behavior in genetically identical cats, and slight differences in fingerprints in genetically identical twins (1, 2). This variation is caused by the randomness or stochasticity in gene expression that is inherent to any given cell. This stochasticity is brought about by fluctuations in the transcriptional and translational processes during gene expression. Transcription is controlled by the various regulatory proteins that bind upstream to a promoter region or influence the binding of other regulatory molecules at the promoter to initiate transcription. The rate of transcription, and hence translation, depend greatly on the concentration of these regulatory proteins and their ability to form the appropriate transcriptionally competent complexes (3-5). Also in cells, DNAs, mrnas, and proteins are usually found in very low numbers and any fluctuation in reaction rates can have a pronounced effect on the expression of a gene causing it to be switched on or completely switched off. This is probably why protein copy number varies from cell to cell within isogenic populations (6). It is important to study the stochasticity of gene expression because fluctuations in protein concentrations can interfere with intra cellular signaling properties, which can in turn affect cellular regulation (7). Examples of how stochasticity plays a role in cell fate is seen in the entry into the state of competence for a population of cells in Bacillus Subtilis (B. Subtilis), the generation of alternative color vision in the retina of Drosophila Melanogaster and entry into persister state for certain populations of E.Coli, all of which are completely random processes (8, 9).
11 2 Noise in synthetic networks A method to study stochasticity is to measure noise levels during gene expression. Random fluctuations during gene expressions generate signals or sounds termed noise. Noise is a measure of the levels of variation in gene expression of an isogenic population of cells, regardless of the source. Noise (n tot ) generated in cells can be broken down into two components known as intrinsic noise (n int ) and extrinsic noise (n ext ) (10). Intrinsic noise arises from the fluctuations in reaction events of transcription and translation of a gene, which for a given population of identical cells, will vary from cell to cell. In this case, the stochasticity occurs locally to the gene sequence and the properties of the protein it encodes. Extrinsic noise on the other hand arises from other molecules present in the cells such as RNA polymerases and ribosomes etc, which will also vary from time to time and from cell to cell because they are gene products as well, but will affect all copies of the gene equally in a given cell. This variation will additionally contribute to the expression of a specific gene of interest. (11, 12). The use of genetically engineered synthetic networks and fluorescence based methods to monitor gene expression and mathematical modeling to calculate corresponding noise levels produced as a result in single cells has greatly advanced this area of study. For example the repressilator (13) a synthetically designed construct of three transcriptional repressors was used to show a significantly noticeable fluctuation in the oscillations of gene expression, demonstrating the stochastic effects of gene expression. In fact, work has been performed to show that autoregulatory negative feedback loops made of simple gene circuits can reduce the stochasticity in gene expression (14) and it was further shown that negative translational feedback has a greater efficacy at lowering stochasticity than negative transcriptional activity (15). This could be the in built mechanism of the cell to counteract the hindrance of stochasticity to faithful processing of cellular information.
12 3 Cellular responses to mechanical stress We have studied at how stochasticity in gene expression responds to mechanical perturbations in the form of osmotic stress. Previous work in the field have included how fluctuations in gene expression vary with induced mutations at the ribosome binding sites (16) and with varying concentrations of inducers interacting with promoters of genes of interest (16, 17). No one has of yet looked at how these stochastic processes behave in presence of mechanical stress applied to the cell. We decided to use the bacterium E.Coli as our model system because it was a much simpler system compared to a eukaryotic model, and provides a basis for comparing our studies employing mechanical stress as perturbation with existing studies employing chemical perturbations. Prokaryotes such as E.Coli and B. Subtilis, have mechanosensitive channels like the MscL (Mechano sensitive channel large conductance) protein that are gated through changes in bilayer tension and respond to mechanical stress by transducing bilayer deformations into a biochemical process such as protein motion and in the process changing conductance by opening a large aqueous pore (18-20). Another case where mechanical stress affects cellular processes is seen in the increased adhesion of E.Coli to mannose coated surfaces in response to shear stress. Elevated levels of shear stress cause conformational changes in the fimbrial FimH protein causing E.Coli to adhere more tightly to mannose coated surfaces (21). Also when various types of bacteria were grown in stimulated microgravity environment, inhibition of secondary metabolism of certain processes was discovered (22). So clearly, mechanical stress influences gene regulation and expression at the cellular level. Mechanical perturbation in the form of osmotic stress. Early transcriptional alterations to genes in the E.Coli genome in response to osmotic stress were profiled using DNA microarrays and it was shown that the osmotic upshift caused a series of genes to increase expression and at the same time causing some genes to be downregulated (23). This prompted us to look at how noise levels of gene expression varied when
13 4 subjected to osmotic stress. Sucrose and sodium chloride were used as a form of non-ionic and ionic osmotic stress inducers. Time-lapse experiments in E. Coli show that intrinsic noise occurs within the first 10 min. but extrinsic noise linger for about 40 min. (24). This directed us to exert osmotic stress to bacterial cells expressing our construct for a period of 60 min. and imaging them at 10 min intervals. We use the reporter gene network utilizing the lactose uptake network in E.Coli (pjm31, courtesy of Pedraza et al). The pjm31 synthetic network consists of four genes where three of the genes are monitored by different fluorescent proteins (CFP, YFP, and RFP). The first gene expressed will inhibit the second, and that in turn will inhibit the third gene. The fourth gene is independent of the cascade and is used to monitor other cellular processes in the cell. The E. Coli JM101 laboratory strain was transformed with this plasmid because of its unique property of having a strong Lac I gene that is constitutively transcribed. The long-term goal is to understand the effect of mechanical forces on gene networks, and how it can be used to understand and manipulate gene expression. The objective of this research is to understand how external perturbations influence noise levels in gene networks in bacterial model systems. The central hypothesis of the research is that mechanical perturbations can cause noise fluctuations in gene networks and in the process enhance or repress gene expressions. The rationale that underlies this hypothesis is that bacterial cells respond to mechanical forces via mechanosensitive channels and also to external stimulations like chemical induction. Measuring noise in gene networks in response to external perturbations will provide a fundamental understanding of their stochasticity.
14 5 CHAPTER 2 MATERIALS AND METHODS Materials and Methods The plasmid pjm31 (17) contains all the components of the synthetic network to be studied except the lac repressor, Lac I. The JM101 strain of E.Coli (supe thi-1 (lac-proab) [F trad36 proab laciqz.m15]) from Stratagene, was used to implement this network, because it has the entire lac operon deleted and has the lac I q instead which produces the same lac I repressor, but has a stronger promoter. This network of genes works in a cascade whereby the first gene laci is constitutively transcribed, producing the lactose repressor which down regulates the expression of the second gene tetr which in turn down regulates the expression of the third gene yfp. The fourth gene rfp, which is under the control of the lambda repressor promoter, is constitutively transcribed and is independent of the cascade of the other three genes. Strains, Growth Conditions, and Media JM31 E. coli cells were grown overnight in M9 minimal media supplemented with 1mM glucose and 50µg/ml of ampicillin. Cells were grown to an OD prior to stressing and imaging. Various concentrations of NaCl and Sucrose were added to cell solutions to induce osmotic stress. Cells were immobilized with poly-l-lysine (1%) on microscope slides and observed at room temperature. Image J is used to measure fluorescence intensity and the model proposed by Elowitz(10) has been used to analyze and interpret the data. Data Acquisition and Analysis: JM31 cells exposed to varying degrees of osmotic stress were imaged at 10 min. intervals for a period of 60 min. The Zeiss Axioimager D1 with an automated turret and an AxioCam MRm CCD camera was used to observe and image cells. Approximately 500 cells were imaged per sample.
15 6 Zeiss Automeasure Plus software was employed to measure fluorescence intensity of individual cells. The threshold intensity was set at 251 to only account for bacteria expressing all the three fluorescent proteins (RFP, CFP and YFP). Absorption, excitation, and emission spectra of cells exposed varying degrees of osmotic stress were obtained with the Shimadzu UV-1650 PC spectrophotometer and the RF-5301 PC fluorescence spectrometer respectively, to demonstrate that spectral characteristics of the cells at any given pressure do not vary with time. Equations for Analysis: Osmotic Stress is calculated using equation 1 where Π = osmotic stress in atmospheres, i = number of particles (2 for NaCl and 1 for sucrose), M = molality of NaCl or sucrose, R = gas constant (0.083 L atm K -1 mol -1 ), and T = temperature in K (298 K in these studies). Π = imrt (1) The parameters to characterize stochasticity in the gene network due to osmotic stress are those defined by Elowitz (10). Self-Correlation η 2 sc is given by equation 2. η 2 sc = σ µ (2) σ = standard deviation of the areas for a given protein for a population of bacteria µ = average area for a given protein for all the bacteria in the frame
16 7 Intrinsic noise η 2 int is given in equation 3 where g i and g j are the fluorescence intensities of ith and jth proteins (i j; i, j = 1,2, or 3; 1 = CFP, 2 = YFP, and 3 = RFP), and <g i > and <g j > are the average intensities. η 2 int = (g i g j )2 2 g i g j (3) Extrinsic Noise η 2 ext is given by equation 4 where the intensities and their averages are as defined in equation 3. η 2 ext = g g i j g i g j g i g j (4) Total Noise is defined by equation 5. η 2 tot = g 2 2 i + g j 2 g i g j (5) 2 g i g j The fluorescence intensities of CFP, YFP, and RFP were corrected for the quantum yields and molar absorptivities by dividing the measured intensities by the product of these two constants also known as brightness. The brightness values for these proteins are given in Table 1 (25).
17 8 Table1. Spectral Properties of fluorescent proteins Protein Color Excitation Maximum (nm) DsRed Express Emission Maximum (nm) Relative Quantum Yield Extinction Coefficient (M -1 cm -1 ) Brightness red ,800 14,870 ECFP Blue ,000 3,000 EYFP Yellow ,000 24,300 The osmotic pressure values for various concentrations of NaCl and sucrose calculated from equation 1 using the densities of NaCl and sucrose solutions are listed in Table 2. Table 2. Densities and Osmotic pressures of NaCl and Sucrose solutions NaCl/ Sucrose Concentration, M NaCl density, g/ml Sucrose density, g/ml NaCl pressure, atmospheres Sucrose pressure, atmospheres
18 9 CHAPTER 3 RESULTS AND DISCUSSION Prokaryotic and eukaryotic cells have characteristic cell mechanical properties and respond to mechanical stress such as osmotic stress (26, 27). Mechanosensitive channels (MscLs) in bacteria such as E.coli have been shown to mediate mecahnotransduction resulting in upregulation and down regulation of genes (7, 16, 23, 28-33). Gene networks are characterized by stochasticity, which has been investigated by modeling with a view to understand autoregulatory, negative, and positive feedback loops (7, 16, 33). These studies have also employed chemical perturbations to gain insights into the gene networks and their stochasticity. Perturbation of gene networks by mechanical stress and study of resulting stochasticity would illuminate on the networks and the interactions between genes. While the influence of chemical perturbations on gene networks has been widely studied, that of mechanical stress on the stochasticity is not well characterized. We have investigated the influence of osmotic stress on a synthetic gene network in E.coli bacterial cells in terms of intrinsic and extrinsic contributions to stochasticity of the genes in the network. Our long-term goal is to understand mechanotransduction in prokaryotic and eukaryotic systems through gene stochasticity in response to mechanical stress. FIGURE 1. Synthetic gene network of 4 genes in E.coli. We chose the synthetic gene network employed by Pedraza, Figure 1 to characterize the influence of osmotic stress on its stochasticity (17). The stochasticity of this network had been characterized employing chemical inducers (17), and thus provided an ideal system to compare our studies.
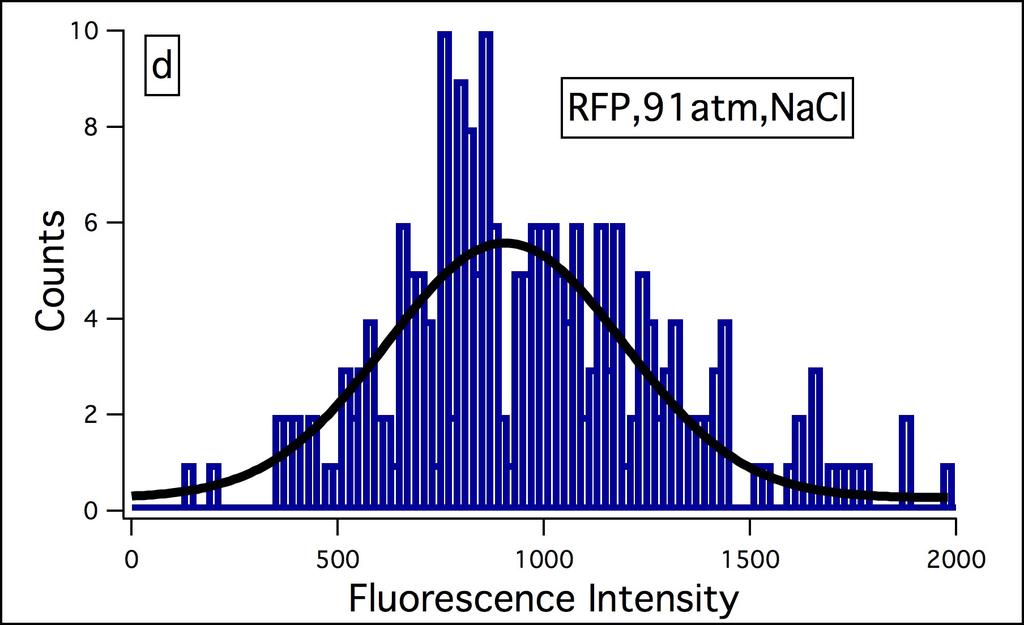
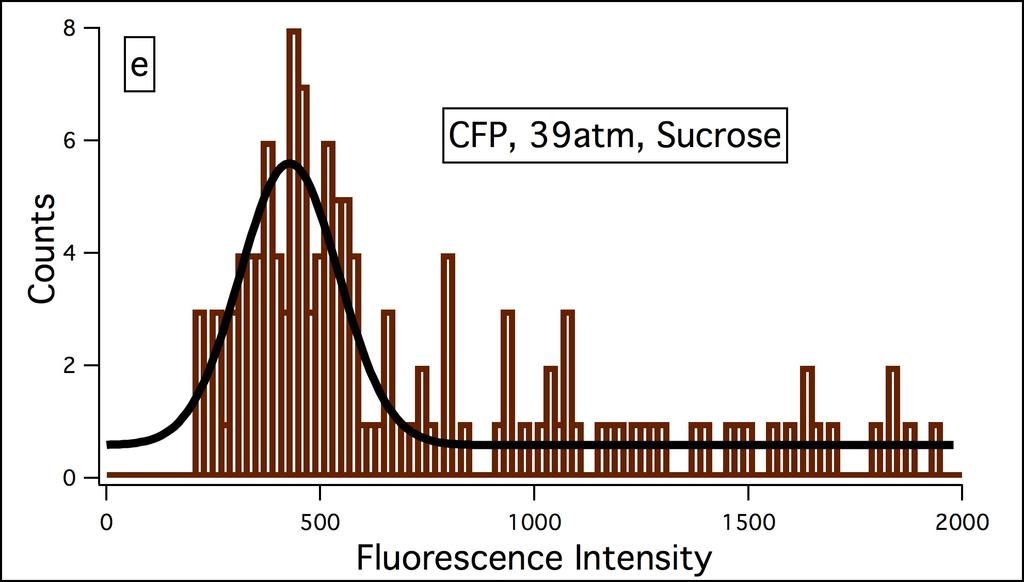
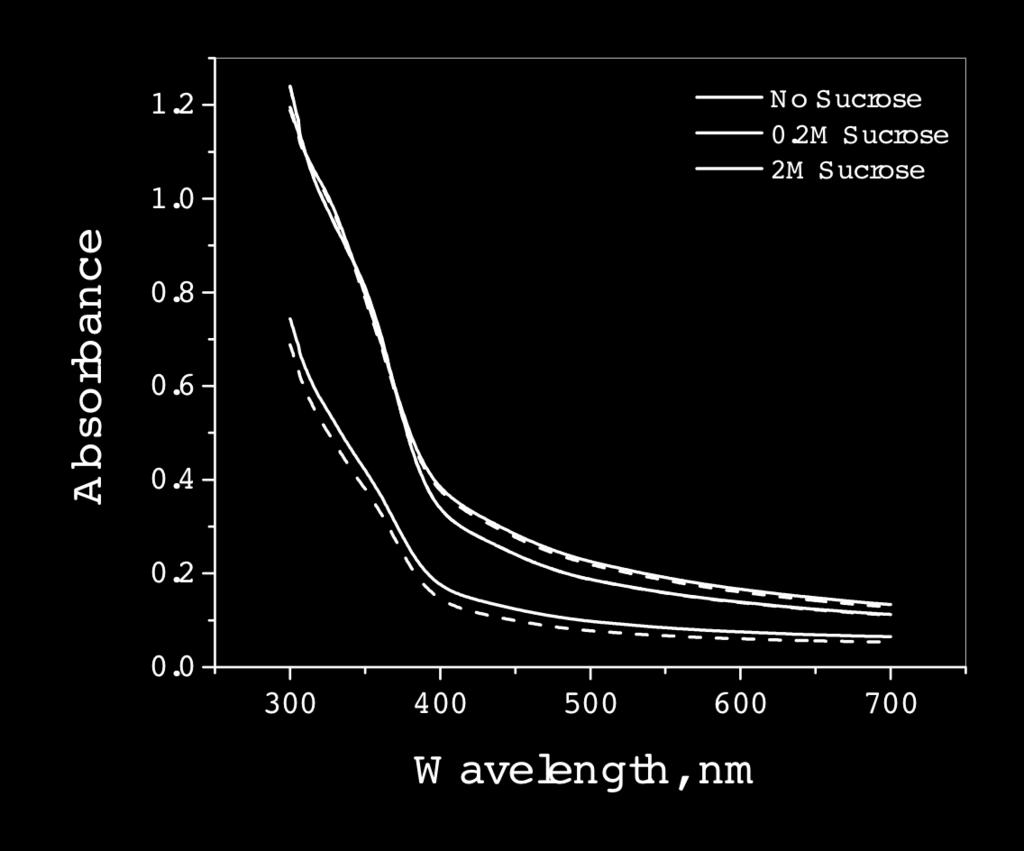
19 10 In this network pjm31 gene 0, laci codes for lactose repressor, is constitutively transcribed and downregulates transcription of gene 1, tetr, which is bicistronically transcribed with cfp. The tetracycline repressor, which is the gene product of tetr downregulates gene 2 reported by yfp. Gene 3, reported by rfp is outside the cascade of gene 0, gene 1, and gene 2 and is under the control of the strong constitutive lambda repressor promoter P L. The pjm31 plasmid (Fig. S1, Appendix) kindly provided by van Oudenaarden was transformed and expressed in E.coli strain JM101. Experimental details are provided under Materials and Methods Chapter 2, and extensive compilation of results is included in the Appendix. The bacteria were grown in M9 medium to an OD 600 of and subjected to various levels of osmotic stress employing NaCl and sucrose (0 3 M; NaCl osmotic stress range = atm., sucrose osmotic stress range = atm.; osmotic stress Π = imrt, i = number of particles, 2 for NaCl and 1 for sucrose, M = molarity, R = gas constant, T = temperature, 298 K). The fluorescence intensities of CFP, YFP, and RFP in a population of bacteria ( ) were measured with Zeiss Axioimager D1 by immobilizing the bacteria on 1 M poly-l-lysine on glass slides every 10 min. up to a maximum of 60 min. The intensity of each protein in a bacterium was determined with the Automeasure plus program from their fluorescence images (Fig. S2 contains representative data). The measured intensities were corrected for the differences in the quantum yield and molar absorptivities by dividing the intensities by the product of these two parameters, also defined as brightness (25). Representative data of fluorescence intensity distribution at 10 min. after addition of NaCl and sucrose are included in Supporting Information (Fig. S3 and S4). The absorbance (Fig. S5) and fluorescence (Fig. S6) spectra of a population of E.coli expressing CFP, YFP, and RFP were recorded for the 60 min. at the same time as microscopy measurements. The absorbance and fluorescence spectra did not change with time for a given concentration of NaCl or sucrose. The absorbance spectra at high concentrations of NaCl and sucrose at or above 2 M exhibited an immediate decrease upon the addition of these reagents
20 11 with the decrease being greater for sucrose than for NaCl but remained constant over 60 min. The viscosity of sucrose changes by a factor of 1000 from 0 3M while that of NaCl changes by a factor of 1.5. The initial absorbance decrease at high concentrations of NaCl and sucrose could be due to osmotic stress and viscosity. The spectra at high concentrations also indicate that the response of the genes to osmotic stress is very fast. This is borne out by the plots of average CFP, YFP, and RFP fluorescence intensities of bacterial populations as a function of time at various osmotic pressures (Fig. S7 for NaCl; Fig. S8 for sucrose) which indicate that variation with time for a given osmotic stress is not very large. The intensities of CFP, YFP, and RFP exhibit a bimodal behavior that is different for NaCl and sucrose. Fluorescence intensity (Fig. S7) in NaCl medium decreases up to a pressure of 60 atm. and increases up to the maximum pressure of 130 atm. except for YFP which shows a decrease through the entire range. The fluorescence intensity changes occur roughly over half the range of osmotic pressures in sucrose compared to NaCl decreasing from 0 30 atm. and increasing from atm. for all three proteins (Fig. S8). The correlation of intensities of each protein with respect to the other is useful towards understanding the interactions of the genes and the intrinsic and extrinsic contributions to these interactions (Fig. S9 and S10). The stochasticity in the expressions of the genes in response to osmotic stress was characterized by the self-correlation (η 2 sc), intrinsic (η 2 int), and extrinsic (η 2 ext) parameters as defined by Elowitz (10, 24). The intrinsic and extrinsic parameters indicate the extent of intrinsic and extrinsic factors to stochasticity. The self-correlation parameter indicates the variation of fluorescence intensities and hence gene expression due to osmotic stress. The η 2 sc values as seen for osmotic stress dependence with NaCl (Fig. S11) and sucrose (Fig. S12) exhibit bimodal behavior that could be either repression followed by activation or vice versa. It is evident that the intrinsic contribution (Fig. S13 and S14) is much higher than the extrinsic contribution (Fig. S15 and S16) to stochasticity. Almost all of the contribution to
21 12 stochasticity is from intrinsic factors. It is also evident that the intrinsic contribution in NaCl is much higher than in sucrose. The intrinsic parameter η 2 int invariably exhibits a bimodal behavior which occurs in the osmotic pressure range of atm. in the case of NaCl and 0 60 atm. in the case of sucrose. The bimodal behavior of the fluorescence intensities and η 2 sc, η 2 int, and η 2 ext can be rationalized by a combination of repression and activation of the interactions of the genes in response to osmotic stress. This can be mathematically expressed as a Hill type behavior, equation 6. (6) The first part of the equation accounts for repression and the second part activation by osmotic stress. TABLE 3. Repression and activation parameters for η 2 int as a function of osmotic stress Gene pair NaCl Sucrose Repression Activation Repression Activation a 1 k 1 n 1 a 2 k 2 n 2 a 1 k 1 n 1 a 2 k 2 n 2 cfp-yfp yfp-rfp rfp-cfp The variable y represents fluorescence intensity, η 2 sc, η 2 int,, or η 2 ext. The constants a 1 and a 2 are the initial and final values for the repression and activation osmotic stress regions, k 1 and k 2 are the mid points of osmotic stress for the repression and activation regions where y = a 1 /2 and a 2 /2 respectively. The Hill type coefficients n 1 and n 2 indicate the extent to which osmotic stress influences the repression and activation of the gene expression and interaction respectively. The various parameters obtained for η 2 int calculated 10 min. after the addition of NaCl and sucrose for pairs of genes is given in Table 3. The parameters were obtained by varying all parameters in the equation to obtain the best fit for the data. Finer refinement of the fit was
22 13 performed by keeping k 1 and k 2 constant and obtaining values of the other parameters. The values in Table 3 with standard deviations and similar parameters for fluorescence intensities and η 2 sc are given in the Appendix (Tables S1, S2, and S3 respectively). The η 2 int and CFP FIGURE 2. (a) Bimodal fit of η 2 int for cfp-yfp vs. osmotic stress with NaCl. (b) Bimodal fit for CFP intensity vs. osmotic stress with NaCl. intensity as a function of osmotic stress 10 min. after NaCl addition fitted to the bimodal equation 1 is displayed in Figures 2 (a) and (b). Table 1 indicates that repression and activation osmotic pressure mid points in sucrose medium are approximately half the values of osmotic pressure mid points in NaCl indicating that sucrose more efficiently represses and activates fluorescence intensities and gene interactions. The comparison of NaCl and sucrose induced osmotic stress on η 2 int in the range of 0 60 atm. osmotic stress is shown in Figure S24 in the Appendix. The n 1 values are relatively small for NaCl compared to n 2 values indicating a strong activation at high osmotic stress compared to weak repression at low osmotic stress. The n 1 values for sucrose osmotic stress are similar to NaCl but n 2 values are smaller than NaCl. Osmotic stress due to NaCl and sucrose have similar repression but NaCl has higher activation than sucrose despite the activation occurring at much higher osmotic pressures compared to sucrose. The gene 3 reported by RFP is outside the gene cascade in the network and yet it has
23 14 significant interactions with both CFP and YFP expressing genes 1 and 2 as indicated by the fluorescence intensity correlations and η 2 int. This is in contrast to chemical induction in which these interactions are not significant (12). The genes 1 and 2 reported by CFP and YFP are strongly correlated under all conditions as expected. In this gene network osmotic stress induced contribution to stochasticity is mainly due to intrinsic factors. A recent report in the literature indicates that the LacI repressor is downregulated at osmotic pressures greater than 16 atm. in NaCl as indicated by the increased activity of β- galactosidase in E.coli (16). Additional activation of this enzyme also occurred due to the upregulation of Lac operon in the chromosome. The LacI repressor in the chromosome in our study is most likely upregulated at low osmotic pressures resulting in reduced expression of CFP and downregulated at high osmotic pressures leading to increased expression of CFP in both NaCl and sucrose media. This is evident in Figure 2(b) from the variation of CFP intensity with increasing osmotic stress induced by NaCl. The repression and activation of gene 1 reported by CFP could be expected to have activation and repression influence respectively on gene 2 reported by YFP based on the gene network in Figure 1. In other words increased expression of CFP could be expected to result in reduced expression of YFP and vice versa. However, the expression of YFP is repressed in the entire range of osmotic pressures in NaCl and sucrose. Additionally the expression levels of RFP, which is not coupled to genes reported by CFP and YFP is also downregulated and upregulated in similar manner to CFP. These results indicate that osmotic stress impacts plasmid in addition to the chromosome in E.coli. The current studies have provided a new insight into mechanotransduction driven gene stochasticity. We are currently investigating this and other gene networks to gain a better understanding of the influence of mechanical stress on gene expression, interaction, and noise.
24 15 CHAPTER 4 CONCLUSIONS AND FUTURE DIRECTIONS Conclusions Studies of the effect of osmotic stress on synthetic gene network in E.coli consisting of three cascading genes that downregulate the next gene in sequence and a fourth uncoupled gene lead to the following significant conclusions: 1. The intensities of the fluorescent reporter proteins CFP, YFP, and RFP exhibit a bimodal change with osmotic stress, decreasing at low osmotic stress and increasing at high osmotic stress. 2. The osmotic pressure range in which repression followed by activation of genes occurs is almost half for pressure induction with sucrose compared to NaCl. Sucrose is more effective in repressing and activating genes than NaCl. However, NaCl has a much larger impact on activation compared to sucrose while repression is essentially the same for both inducers. 3. The main contribution to the stochasticities of the genes is due to intrinsic factors. Extrinsic factor contribution is very minor. 4. The coupled genes reported by CFP and YFP interact in a bimodal manner with repression occurring at low osmotic stress and activation occurring at high osmotic stress. 5. The gene reported by RFP exhibits coupling with the genes reported by CFP and YFP. The order of coupling is cfp-yfp>yfp-rfp>cfp-rfp. 6. The bimodal behavior can be modeled as a sum of repression and activation with a Hill like function. The experimental data can be fitted well with such a function, which yields Hill type coefficient for the influence of osmotic stress on gene interaction. 7. Hill coefficient for repression is small for osmotic stress exerted by NaCl and sucrose. The Hill coefficient for activation with NaCl is higher than the activation by sucrose.
25 16 8. The LacI repressor in the chromosome is most likely upregulated at low osmotic pressures and downregulated at high osmotic pressures as indicated by CFP fluorescence intensity changes. The repression and activation of RFP and the repression of YFP at all osmotic stress values also indicate that osmotic stress impacts the plasmid containing the genes of the synthetic network. Essentially osmotic stress has an impact on the chromosome and plasmid. 9. Observed bimodal behavior is the result of osmotic stress on the chromosome and the synthetic gene network. 10. Effect of osmotic stress on the gene network is essentially all intrinsic in a similar manner to chemical induction Future Directions The current studies have provided a new insight into mechanotransduction driven gene stochasticity. Study of gene stochasticity stimulated by mechanical stress would provide a fundamental understanding of mechanotransduction in gene networks. The following studies building on the current studies will illuminate further on mechanotransduction in gene networks and the response of genes to mechanical stress: 1. The synthetic gene network subjected to compression force with an inert gas such as N 2 or Ar will complement osmotic stress studies. Compression force can be increased and decreased reversibility to determine if the effect of this force on gene expression and stochasticity is also reversible. 2. The network studied consisting of four genes of which three are in a cascade sequentially downregulating the next gene can be perturbed with chemical inducers such as IPTG and ATC. Perturbing the gene network with chemical inducers and mechanical stress simultaneously is fundamentally interesting and important. 3. A gene network where identical promoters (10) equidistant from the origin of replication express two different fluorescent reporter proteins will complement the current studies
26 17 with a more complex network. Such a system is useful for understanding bimodal behavior of activation and repression. 4. The effect of mechanical perturbation on comk regulatory network in Bacillus Subtilis (B.Subtilis) that regulates the transition of this bacterium into competence will be interesting to investigate. This form of genetic competence is highly regulated in B.Subtilis and the comk gene is the master regulator of this competence (34). This state of competence allows bacteria to use this transformability as a survival strategy in fluctuating and harsh environmental conditions to which they are subjected. This regulation has been found to be a stochastic process (35). This will characterize at how biochemical pathway in prokaryotes is influenced by mechanical stress. 5. Mechanical stress could be a significant factor in promoting cancer metastasis as cells from primary tumors when they migrate are subjected to a variety of mechanical forces. Such forces could be significantly contributing to stochasticity of mechanosensitive genes and as a result to metastasis at the gene, transcription, and translation stages.
27 18 REFERENCES 1. Shin, T., D. Kraemer, J. Pryor, L. Liu, J. Rugila, L. Howe, S. Buck, K. Murphy, L. Lyons, and M. Westhusin A cat cloned by nuclear transplantation. Nature 415: Jain, A. K., S. Prabhakar, and S. Pankanti On the similarity of identical twin fingerprints. Pattern Recognition 35: Boulanger, P. A., S. K. Yoshinaga, and A. J. Berk DNA-binding properties and characterization of human transcription factor TFIIIC2. J Biol Chem 262: McAdams, H. H., and A. Arkin Stochastic mechanisms in gene expression. Proc Natl Acad Sci U S A 94: Kato, H., M. Nagamine, R. Kominami, and M. Muramatsu Formation of the Transcription Initiation Complex on Mammalian Rdna. Mol Cell Biol 6: Kaufmann, B. B., and A. van Oudenaarden Stochastic gene expression: from single molecules to the proteome. Current Opinion in Genetics & Development 17: Kaern, M., T. C. Elston, W. J. Blake, and J. J. Collins Stochasticity in gene expression: from theories to phenotypes. Nat Rev Genet 6: Bell, M. L., J. B. Earl, and S. G. Britt Two types of Drosophila R7 photoreceptor cells are arranged randomly: A model for stochastic cell-fate determination. Journal of Comparative Neurology 502: Losick, R., and C. Desplan Stochasticity and cell fate. Science 320: Elowitz, M. B., A. J. Levine, E. D. Siggia, and P. S. Swain Stochastic gene expression in a single cell. Science 297: Raser, J. M., and E. K. O'Shea Noise in gene expression: origins, consequences, and control. Science 309: Swain, P. S., M. B. Elowitz, and E. D. Siggia Intrinsic and extrinsic contributions to stochasticity in gene expression. Proc Natl Acad Sci U S A 99:
28 Elowitz, M. B., and S. Leibler A synthetic oscillatory network of transcriptional regulators. Nature 403: Becskei, A., and L. Serrano Engineering stability in gene networks by autoregulation. Nature 405: Swain, P. S Efficient attenuation of stochasticity in gene expression through posttranscriptional control. J Mol Biol 344: Ozbudak, E. M., M. Thattai, I. Kurtser, A. D. Grossman, and A. van Oudenaarden Regulation of noise in the expression of a single gene. Nat Genet 31: Pedraza, J. M., and A. van Oudenaarden Noise propagation in gene networks. Science 307: Moe, P. C., P. Blount, and C. Kung Functional and structural conservation in the mechanosensitive channel MscL implicates elements crucial for mechanosensation. Mol Microbiol 28: Perozo, E Gating prokaryotic mechanosensitive channels. Nat Rev Mol Cell Biol 7: Sukharev, S Mechanosensitive channels in bacteria as membrane tension reporters. FASEB J 13 Suppl:S Nilsson, L. M., W. E. Thomas, E. V. Sokurenko, and V. Vogel Elevated shear stress protects Escherichia coli cells adhering to surfaces via catch bonds from detachment by soluble inhibitors. Appl Environ Microbiol 72: Demain, A. L., and A. Fang Secondary metabolism in simulated microgravity. Chem Rec 1: Weber, A., and K. Jung Profiling early osmostress-dependent gene expression in Escherichia coli using DNA macroarrays. J Bacteriol 184: Rosenfeld, N., J. W. Young, U. Alon, P. S. Swain, and M. B. Elowitz Gene regulation at the single-cell level. Science 307:
29 Shaner, N. C., P. A. Steinbach, and R. Y. Tsien A guide to choosing fluorescent proteins. Nat Methods 2: Csonka, L. N Physiological and genetic responses of bacteria to osmotic stress. Microbiol Rev 53: Rep, M., J. Albertyn, J. M. Thevelein, B. A. Prior, and S. Hohmann Different signalling pathways contribute to the control of GPD1 gene expression by osmotic stress in Saccharomyces cerevisiae. Microbiology 145 ( Pt 3): Chalfie, M Neurosensory mechanotransduction. Nat Rev Mol Cell Biol 10: Facey, S. J., S. A. Neugebauer, S. Krauss, and A. Kuhn The mechanosensitive channel protein MscL is targeted by the SRP to the novel YidC membrane insertion pathway of Escherichia coli. J Mol Biol 365: Sukharev, S., S. R. Durell, and H. R. Guy Structural models of the MscL gating mechanism. Biophys J 81: Sukharev, S. I., P. Blount, B. Martinac, and C. Kung Mechanosensitive channels of Escherichia coli: the MscL gene, protein, and activities. Annu Rev Physiol 59: Wood, J. M Osmosensing by bacteria: signals and membrane-based sensors. Microbiol Mol Biol Rev 63: Raj, A., and A. van Oudenaarden Nature, nurture, or chance: stochastic gene expression and its consequences. Cell 135: Susanna, K. A., F. Fusetti, A. M. Thunnissen, L. W. Hamoen, and O. P. Kuipers Functional analysis of the competence transcription factor ComK of Bacillus subtilis by characterization of truncation variants. Microbiology 152: Dubnau, D., and R. Losick Bistability in bacteria. Mol Microbiol 61:
30 APPENDIX Figure Captions Figure S1 Gene network and pjm31 Plasmid construct. Figure S2 Fluorescence Microscopy images of bacterial populations in a) 0.33 M NaCl (a1, a4, a7 RFP at 0, 30 and 60 min., a2, a5, a8 CFP at 0, 30 and 60 min., a3, a6, a9 YFP at 0, 30, 60 min.), b) 0.83 M NaCl (b1, b4, b7 RFP at 0, 30 and 60 min., b2, b5, b8 CFP at 0, 30 and 60 min., b3, b6, b9 YFP at 0, 30, 60 min), c) 0.33 M sucrose (c1, c4, c7 RFP at 0, 30 and 60 min., c2, c5, c8 CFP at 0, 30 and 60 min., c3, c6, c9 YFP at 0, 30, 60 min) and d) 0.83 M sucrose (d1, d4, d7 RFP at 0, 30 and 60 min., d2, d5, d8 CFP at 0, 30 and 60 min., d3, d6, d9 YFP at 0, 30, 60 min). Figure S3 Fluorescence intensity distributions of a bacterial population in NaCl, a) RFP, 40 atm., b) CFP, 40 atm., c) YFP, 40 atm., d) RFP, 91 atm., e) CFP, 91 atm., f) YFP, 91 atm. Figure S4 Fluorescence intensity distributions of a bacterial population in sucrose, a) RFP, 19 atm., b) CFP, 19 atm., c) YFP, 19 atm., d) RFP, 39 atm., e) CFP, 39 atm., f) YFP, 39 atm. Figure S5 Absorption spectra of bulk JM31 in a) NaCl and b) sucrose. Figure S6 CFP fluorescence excitation and emission spectra of bulk JM31 bacteria in a) 0.83 M NaCl, (40 atm.) and b) 3M, (53 atm.) sucrose. Figure S7 Fluorescence intensity with increasing osmotic pressure in NaCl at 0 60 min., a) RFP, b) CFP and c) YFP. 0 min., 10 min -, 20 min -, 30 min -, 40 min. -, 50 min. -, 60 min -. Figure S8 Fluorescence intensity with increasing osmotic pressure in sucrose at 0 60 min., a) RFP, b) CFP and c) YFP. 0 min. -, 10 min -, 20 min -, 30 min -, 40 min. -, 50 min. -, 60 min -. Figure S9 Fluorescence intensity correlation in NaCl between a) CFP-YFP, 40 atm., b) CFP-RFP, 40 atm., c) RFP-YFP, 40 atm., d) CFP-YFP, 91 atm., e) CFP-RFP, 91 atm., f) RFP-YFP, 91 atm. Figure S10 Fluorescence intensity correlation in sucrose between a) CFP-YFP, 19 atm., b) CFP-RFP, 19 atm., c) RFP-YFP, 19 atm., d) CFP-YFP, 39 atm., e) CFP-RFP, 39 atm., f) RFP-YFP, 39 atm. 21
31 Figure S11 Self-correlation (η 2 sc) with increasing osmotic pressure in NaCl at 0 60 min. of a) RFP, b) CFP and c) YFP. 0 min -, 10 min -, 20 min -, 30 min -, 40 min. -, 50 min. -, 60 min. -. Figure S12 Self-correlation (η 2 sc) with increasing osmotic pressure in sucrose at 0 60 min. of a) RFP, b) CFP and c) YFP. 0 min. -, 10 min -, 20 min -, 30 min -, 40 min. -, 50 min. -, 60 min -. Figure S13 Intrinsic noise (η 2 int) with increasing osmotic pressure in NaCl at 0 60 min. of a) CFP-RFP, b) CFP-YFP and c) RFP- YFP. 0 min -, 10 min -, 20 min -, 30 min -, 40 min. -, 50 min. -, 60 min. -. Figure S14 Intrinsic noise (η 2 int) with increasing osmotic pressure in sucrose at 0 60 min. of a) CFP-RFP, b) CFP-YFP and c) RFP-YFP. 0 min -, 10 min -, 20 min -, 30 min -, 40 min. -, 50 min. -, 60 min. -. Figure S15 Extrinsic noise (η 2 ext) with increasing osmotic pressure in NaCl at 0 60 min. of a) CFP-RFP, b) CFP-YFP and c) RFP-YFP. 0 min -, 10 min -, 20 min -, 30 min -, 40 min. -, 50 min. -, 60 min -. Figure S16 Extrinsic noise (η 2 ext) with increasing osmotic pressure in sucrose at 0 60 min. of a) CFP-RFP, b) CFP-YFP and c) RFP-YFP. 0 min -, 10 min -, 20 min -, 30 min -, 40 min. -, 50 min. -, 60 min -. Figure S17 Total noise (η 2 tot) with increasing osmotic pressure in NaCl at 0 60 min. of a) CFP-RFP, b) CFP-YFP and c) RFP- YFP. 0 min -, 10 min -, 20 min -, 30 min -, 40 min. -, 50 min. -, 60 min. -. Figure S18 Total noise (η 2 tot) with increasing osmotic pressure in sucrose at 0 60 min. of a) CFP-RFP, b) CFP-YFP and c) RFP- YFP. 0 min -, 10 min -, 20 min -, 30 min -, 40 min. -, 50 min. -, 60 min. -. Figure S19 Bimodal fits of fluorescence intensity with increasing osmotic pressure in NaCl of a) RFP, b) CFP and c) YFP. Figure S20. Bimodal fits of fluorescence intensity with increasing osmotic pressure in sucrose of a) RFP, b) CFP and c) YFP Figure S21 Bimodal fits of η 2 int with increasing osmotic pressure in NaCl of a) CFP-YFP, b) RFP-YFP. Figure S22 Bimodal fits of η 2 int with increasing osmotic pressure in sucrose of a) CFP-YFP, b) RFP-YFP. Figure S23 Bimodal fits of η 2 sc with increasing osmotic pressure of a) CFP in NaCl and b) RFP in Sucrose 22
 for osmotic stress")

, ( sucrose) c)")
32 Figure S24 Comparison of intrinsic noise (η 2 int) for osmotic stress induced by NaCl and sucrose over 0-54 atm. a) YFP-CFP- (NaCl) ( Sucrose) b) RFP-YFP ( NaCl), ( sucrose) c) CFP-RFP ( NaCl) and ( sucrose) 23
33 Figure S1 24

34 Figure S2 25

35 Figure S3 26

36 Figure S4 27

37 Figure S5 a b 28

38 Figure S6 a b 29
39 Figure S7 30
40 Figure S8 31
41 Figure S9 a b c d e f 32
42 Figure S10 a b c d e f 33
43 Figure S11 34
44 Figure S12 35
45 Figure S13 36
46 Figure S14 37
47 Figure S15 38
48 Figure S16 39
49 Figure S17 40
50 Figure S18 41
51 Figure S19 42
52 Figure S20 43
53 Figure S21 44
54 Figure S22 45
55 Figure S23 46
56 Figure S24 47
57 Table S1. Intrinsic noise vs pressure fitted to the bimodal equation Gene pair NaCl Sucrose Repression Activation Repression Activation a 1 k 1 n 1 a 2 k 2 n 2 a 1 k 1 n 1 a 2 k 2 n 2 cfp-yfp 9.4± ± ± ± ± ± yfp-rfp 1.6± ± ± ± ±0.4 rfp-cfp 2.1± ± ± ±0.6 Table S2. Intensity vs. pressure fitted to the bimodal equation Protein NaCl Sucrose Repression Activation Repression Activation a 1 k 1 n 1 a 2 k 2 n 2 a 1 k 1 n 1 a 2 k 2 n 2 RFP ± ± ± ± ± ± ±1.9 CFP 0.4± ± ± ± ± ± ±1.9 YFP 0.03± ± ± ± ± ± ± ±1.1 Table S3. η 2 sc vs. pressure fitted to the bimodal equation Protein NaCl Sucrose Repression Activation Repression Activation a 1 k 1 n 1 a 2 k 2 n 2 a 1 k 1 n 1 a 2 k 2 n 2 RFP ± ± ±0.3 CFP ± ±2 0.32± ± YFP ± ± ± ± ±3 48
Stochastic simulations
 Stochastic simulations Application to molecular networks Literature overview Noise in genetic networks Origins How to measure and distinguish between the two types of noise (intrinsic vs extrinsic)? What
Stochastic simulations!
 Stochastic simulations! Application to biomolecular networks! Literature overview Noise in genetic networks! Origins! How to measure the noise and distinguish between the two sources of noise (intrinsic
the noisy gene Biology of the Universidad Autónoma de Madrid Jan 2008 Juan F. Poyatos Spanish National Biotechnology Centre (CNB)
") Biology of the the noisy gene Universidad Autónoma de Madrid Jan 2008 Juan F. Poyatos Spanish National Biotechnology Centre (CNB) day III: noisy bacteria - Regulation of noise (B. subtilis) - Intrinsic/Extrinsic
Biology of the the noisy gene Universidad Autónoma de Madrid Jan 2008 Juan F. Poyatos Spanish National Biotechnology Centre (CNB) day III: noisy bacteria - Regulation of noise (B. subtilis) - Intrinsic/Extrinsic
2. Mathematical descriptions. (i) the master equation (ii) Langevin theory. 3. Single cell measurements
 the master equation (ii) Langevin theory. 3. Single cell measurements") 1. Why stochastic?. Mathematical descriptions (i) the master equation (ii) Langevin theory 3. Single cell measurements 4. Consequences Any chemical reaction is stochastic. k P d φ dp dt = k d P deterministic
1. Why stochastic?. Mathematical descriptions (i) the master equation (ii) Langevin theory 3. Single cell measurements 4. Consequences Any chemical reaction is stochastic. k P d φ dp dt = k d P deterministic
3.B.1 Gene Regulation. Gene regulation results in differential gene expression, leading to cell specialization.
 3.B.1 Gene Regulation Gene regulation results in differential gene expression, leading to cell specialization. We will focus on gene regulation in prokaryotes first. Gene regulation accounts for some of
Introduction. Gene expression is the combined process of :
 1 To know and explain: Regulation of Bacterial Gene Expression Constitutive ( house keeping) vs. Controllable genes OPERON structure and its role in gene regulation Regulation of Eukaryotic Gene Expression
Chapter 15 Active Reading Guide Regulation of Gene Expression
 Name: AP Biology Mr. Croft Chapter 15 Active Reading Guide Regulation of Gene Expression The overview for Chapter 15 introduces the idea that while all cells of an organism have all genes in the genome,
Bacterial Genetics & Operons
 Bacterial Genetics & Operons The Bacterial Genome Because bacteria have simple genomes, they are used most often in molecular genetics studies Most of what we know about bacterial genetics comes from the
Topic 4 - #14 The Lactose Operon
 Topic 4 - #14 The Lactose Operon The Lactose Operon The lactose operon is an operon which is responsible for the transport and metabolism of the sugar lactose in E. coli. - Lactose is one of many organic
REVIEW SESSION. Wednesday, September 15 5:30 PM SHANTZ 242 E
 REVIEW SESSION Wednesday, September 15 5:30 PM SHANTZ 242 E Gene Regulation Gene Regulation Gene expression can be turned on, turned off, turned up or turned down! For example, as test time approaches,
CHAPTER 13 PROKARYOTE GENES: E. COLI LAC OPERON
 PROKARYOTE GENES: E. COLI LAC OPERON CHAPTER 13 CHAPTER 13 PROKARYOTE GENES: E. COLI LAC OPERON Figure 1. Electron micrograph of growing E. coli. Some show the constriction at the location where daughter
REGULATION OF GENE EXPRESSION. Bacterial Genetics Lac and Trp Operon
 REGULATION OF GENE EXPRESSION Bacterial Genetics Lac and Trp Operon Levels of Metabolic Control The amount of cellular products can be controlled by regulating: Enzyme activity: alters protein function
Lecture 4: Transcription networks basic concepts
 Lecture 4: Transcription networks basic concepts - Activators and repressors - Input functions; Logic input functions; Multidimensional input functions - Dynamics and response time 2.1 Introduction The
Name Period The Control of Gene Expression in Prokaryotes Notes
 Bacterial DNA contains genes that encode for many different proteins (enzymes) so that many processes have the ability to occur -not all processes are carried out at any one time -what allows expression
Warm-Up. Explain how a secondary messenger is activated, and how this affects gene expression. (LO 3.22)
") Warm-Up Explain how a secondary messenger is activated, and how this affects gene expression. (LO 3.22) Yesterday s Picture The first cell on Earth (approx. 3.5 billion years ago) was simple and prokaryotic,
Warm-Up Explain how a secondary messenger is activated, and how this affects gene expression. (LO 3.22) Yesterday s Picture The first cell on Earth (approx. 3.5 billion years ago) was simple and prokaryotic,
Chapter 16 Lecture. Concepts Of Genetics. Tenth Edition. Regulation of Gene Expression in Prokaryotes
 Chapter 16 Lecture Concepts Of Genetics Tenth Edition Regulation of Gene Expression in Prokaryotes Chapter Contents 16.1 Prokaryotes Regulate Gene Expression in Response to Environmental Conditions 16.2
Controlling Gene Expression
 Controlling Gene Expression Control Mechanisms Gene regulation involves turning on or off specific genes as required by the cell Determine when to make more proteins and when to stop making more Housekeeping
STOCHASTICITY IN GENE EXPRESSION: FROM THEORIES TO PHENOTYPES
 STOCHASTICITY IN GENE EXPRESSION: FROM THEORIES TO PHENOTYPES Mads Kærn*, Timothy C. Elston, William J. Blake and James J. Collins Abstract Genetically identical cells exposed to the same environmental
Prokaryotic Regulation
 Prokaryotic Regulation Control of transcription initiation can be: Positive control increases transcription when activators bind DNA Negative control reduces transcription when repressors bind to DNA regulatory
Name: SBI 4U. Gene Expression Quiz. Overall Expectation:
 Gene Expression Quiz Overall Expectation: - Demonstrate an understanding of concepts related to molecular genetics, and how genetic modification is applied in industry and agriculture Specific Expectation(s):
A synthetic oscillatory network of transcriptional regulators
 A synthetic oscillatory network of transcriptional regulators Michael B. Elowitz & Stanislas Leibler, Nature, 403, 2000 igem Team Heidelberg 2008 Journal Club Andreas Kühne Introduction Networks of interacting
Big Idea 3: Living systems store, retrieve, transmit and respond to information essential to life processes. Tuesday, December 27, 16
 Big Idea 3: Living systems store, retrieve, transmit and respond to information essential to life processes. Enduring understanding 3.B: Expression of genetic information involves cellular and molecular
Development Team. Regulation of gene expression in Prokaryotes: Lac Operon. Molecular Cell Biology. Department of Zoology, University of Delhi
 Paper Module : 15 : 23 Development Team Principal Investigator : Prof. Neeta Sehgal Department of Zoology, University of Delhi Co-Principal Investigator : Prof. D.K. Singh Department of Zoology, University
Multistability in the lactose utilization network of E. coli. Lauren Nakonechny, Katherine Smith, Michael Volk, Robert Wallace Mentor: J.
 Multistability in the lactose utilization network of E. coli Lauren Nakonechny, Katherine Smith, Michael Volk, Robert Wallace Mentor: J. Ruby Abrams Motivation Understanding biological switches in the
Prokaryotic Gene Expression (Learning Objectives)
") Prokaryotic Gene Expression (Learning Objectives) 1. Learn how bacteria respond to changes of metabolites in their environment: short-term and longer-term. 2. Compare and contrast transcriptional control
Prokaryotic Gene Expression (Learning Objectives) 1. Learn how bacteria respond to changes of metabolites in their environment: short-term and longer-term. 2. Compare and contrast transcriptional control
Written Exam 15 December Course name: Introduction to Systems Biology Course no
 Technical University of Denmark Written Exam 15 December 2008 Course name: Introduction to Systems Biology Course no. 27041 Aids allowed: Open book exam Provide your answers and calculations on separate
Complete all warm up questions Focus on operon functioning we will be creating operon models on Monday
 Complete all warm up questions Focus on operon functioning we will be creating operon models on Monday 1. What is the Central Dogma? 2. How does prokaryotic DNA compare to eukaryotic DNA? 3. How is DNA
UNIT 6 PART 3 *REGULATION USING OPERONS* Hillis Textbook, CH 11
 UNIT 6 PART 3 *REGULATION USING OPERONS* Hillis Textbook, CH 11 REVIEW: Signals that Start and Stop Transcription and Translation BUT, HOW DO CELLS CONTROL WHICH GENES ARE EXPRESSED AND WHEN? First of
Multistability in the lactose utilization network of Escherichia coli
 Multistability in the lactose utilization network of Escherichia coli Lauren Nakonechny, Katherine Smith, Michael Volk, Robert Wallace Mentor: J. Ruby Abrams Agenda Motivation Intro to multistability Purpose
56:198:582 Biological Networks Lecture 8
 56:198:582 Biological Networks Lecture 8 Course organization Two complementary approaches to modeling and understanding biological networks Constraint-based modeling (Palsson) System-wide Metabolism Steady-state
CHAPTER : Prokaryotic Genetics
 CHAPTER 13.3 13.5: Prokaryotic Genetics 1. Most bacteria are not pathogenic. Identify several important roles they play in the ecosystem and human culture. 2. How do variations arise in bacteria considering
Bi 1x Spring 2014: LacI Titration
 Bi 1x Spring 2014: LacI Titration 1 Overview In this experiment, you will measure the effect of various mutated LacI repressor ribosome binding sites in an E. coli cell by measuring the expression of a
Lecture 18 June 2 nd, Gene Expression Regulation Mutations
 Lecture 18 June 2 nd, 2016 Gene Expression Regulation Mutations From Gene to Protein Central Dogma Replication DNA RNA PROTEIN Transcription Translation RNA Viruses: genome is RNA Reverse Transcriptase
Welcome to Class 21!
 Welcome to Class 21! Introductory Biochemistry! Lecture 21: Outline and Objectives l Regulation of Gene Expression in Prokaryotes! l transcriptional regulation! l principles! l lac operon! l trp attenuation!
Gene Regulation and Expression
 THINK ABOUT IT Think of a library filled with how-to books. Would you ever need to use all of those books at the same time? Of course not. Now picture a tiny bacterium that contains more than 4000 genes.
APGRU6L2. Control of Prokaryotic (Bacterial) Genes
 Genes") APGRU6L2 Control of Prokaryotic (Bacterial) Genes 2007-2008 Bacterial metabolism Bacteria need to respond quickly to changes in their environment STOP u if they have enough of a product, need to stop production
APGRU6L2 Control of Prokaryotic (Bacterial) Genes 2007-2008 Bacterial metabolism Bacteria need to respond quickly to changes in their environment STOP u if they have enough of a product, need to stop production
4. Why not make all enzymes all the time (even if not needed)? Enzyme synthesis uses a lot of energy.
? Enzyme synthesis uses a lot of energy.") 1 C2005/F2401 '10-- Lecture 15 -- Last Edited: 11/02/10 01:58 PM Copyright 2010 Deborah Mowshowitz and Lawrence Chasin Department of Biological Sciences Columbia University New York, NY. Handouts: 15A
1 C2005/F2401 '10-- Lecture 15 -- Last Edited: 11/02/10 01:58 PM Copyright 2010 Deborah Mowshowitz and Lawrence Chasin Department of Biological Sciences Columbia University New York, NY. Handouts: 15A
Computational Cell Biology Lecture 4
 Computational Cell Biology Lecture 4 Case Study: Basic Modeling in Gene Expression Yang Cao Department of Computer Science DNA Structure and Base Pair Gene Expression Gene is just a small part of DNA.
Slide 1 / 7. Free Response
 Slide 1 / 7 Free Response Slide 2 / 7 Slide 3 / 7 1 The above diagrams illustrate the experiments carried out by Griffith and Hershey and Chaserespectively. Describe the hypothesis or conclusion that each
Bi 8 Lecture 11. Quantitative aspects of transcription factor binding and gene regulatory circuit design. Ellen Rothenberg 9 February 2016
 Bi 8 Lecture 11 Quantitative aspects of transcription factor binding and gene regulatory circuit design Ellen Rothenberg 9 February 2016 Major take-home messages from λ phage system that apply to many
Multiple Choice Review- Eukaryotic Gene Expression
 Multiple Choice Review- Eukaryotic Gene Expression 1. Which of the following is the Central Dogma of cell biology? a. DNA Nucleic Acid Protein Amino Acid b. Prokaryote Bacteria - Eukaryote c. Atom Molecule
Regulation of Gene Expression
 Chapter 18 Regulation of Gene Expression PowerPoint Lecture Presentations for Biology Eighth Edition Neil Campbell and Jane Reece Lectures by Chris Romero, updated by Erin Barley with contributions from
Stochastic dynamics of small gene regulation networks. Lev Tsimring BioCircuits Institute University of California, San Diego
 Stochastic dynamics of small gene regulation networks Lev Tsimring BioCircuits Institute University of California, San Diego Nizhni Novgorod, June, 2011 Central dogma Activator Gene mrna Protein Repressor
Lesson Overview. Gene Regulation and Expression. Lesson Overview Gene Regulation and Expression
 13.4 Gene Regulation and Expression THINK ABOUT IT Think of a library filled with how-to books. Would you ever need to use all of those books at the same time? Of course not. Now picture a tiny bacterium
The Effect of Stochasticity on the Lac Operon: An Evolutionary Perspective
 The Effect of Stochasticity on the Lac Operon: An Evolutionary Perspective Milan van Hoek *, Paulien Hogeweg Theoretical Biology/Bioinformatics Group, Utrecht University, Utrecht, The Netherlands The role
Unit 3: Control and regulation Higher Biology
 Unit 3: Control and regulation Higher Biology To study the roles that genes play in the control of growth and development of organisms To be able to Give some examples of features which are controlled
Boolean models of gene regulatory networks. Matthew Macauley Math 4500: Mathematical Modeling Clemson University Spring 2016
 Boolean models of gene regulatory networks Matthew Macauley Math 4500: Mathematical Modeling Clemson University Spring 2016 Gene expression Gene expression is a process that takes gene info and creates
Measuring TF-DNA interactions
 Measuring TF-DNA interactions How is Biological Complexity Achieved? Mediated by Transcription Factors (TFs) 2 Regulation of Gene Expression by Transcription Factors TF trans-acting factors TF TF TF TF
13.4 Gene Regulation and Expression
 13.4 Gene Regulation and Expression Lesson Objectives Describe gene regulation in prokaryotes. Explain how most eukaryotic genes are regulated. Relate gene regulation to development in multicellular organisms.
Regulation of Gene Expression
 Chapter 18 Regulation of Gene Expression Edited by Shawn Lester PowerPoint Lecture Presentations for Biology Eighth Edition Neil Campbell and Jane Reece Lectures by Chris Romero, updated by Erin Barley
Prokaryotic Gene Expression (Learning Objectives)
") Prokaryotic Gene Expression (Learning Objectives) 1. Learn how bacteria respond to changes of metabolites in their environment: short-term and longer-term. 2. Compare and contrast transcriptional control
Prokaryotic Gene Expression (Learning Objectives) 1. Learn how bacteria respond to changes of metabolites in their environment: short-term and longer-term. 2. Compare and contrast transcriptional control
Control of Prokaryotic (Bacterial) Gene Expression. AP Biology
 Gene Expression. AP Biology") Control of Prokaryotic (Bacterial) Gene Expression Figure 18.1 How can this fish s eyes see equally well in both air and water? Aka. Quatro ojas Regulation of Gene Expression: Prokaryotes and eukaryotes
Control of Prokaryotic (Bacterial) Gene Expression Figure 18.1 How can this fish s eyes see equally well in both air and water? Aka. Quatro ojas Regulation of Gene Expression: Prokaryotes and eukaryotes
Molecular Biology, Genetic Engineering & Biotechnology Operons ???
 1 Description of Module Subject Name?? Paper Name Module Name/Title XV- 04: 2 OPERONS OBJECTIVES To understand how gene is expressed and regulated in prokaryotic cell To understand the regulation of Lactose
Villa et al. (2005) Structural dynamics of the lac repressor-dna complex revealed by a multiscale simulation. PNAS 102:
 Structural dynamics of the lac repressor-dna complex revealed by a multiscale simulation. PNAS 102:") Villa et al. (2005) Structural dynamics of the lac repressor-dna complex revealed by a multiscale simulation. PNAS 102: 6783-6788. Background: The lac operon is a cluster of genes in the E. coli genome
Villa et al. (2005) Structural dynamics of the lac repressor-dna complex revealed by a multiscale simulation. PNAS 102: 6783-6788. Background: The lac operon is a cluster of genes in the E. coli genome
16 CONTROL OF GENE EXPRESSION
 16 CONTROL OF GENE EXPRESSION Chapter Outline 16.1 REGULATION OF GENE EXPRESSION IN PROKARYOTES The operon is the unit of transcription in prokaryotes The lac operon for lactose metabolism is transcribed
GENE REGULATION AND PROBLEMS OF DEVELOPMENT
 GENE REGULATION AND PROBLEMS OF DEVELOPMENT By Surinder Kaur DIET Ropar Surinder_1998@ yahoo.in Mob No 9988530775 GENE REGULATION Gene is a segment of DNA that codes for a unit of function (polypeptide,
56:198:582 Biological Networks Lecture 10
 56:198:582 Biological Networks Lecture 10 Temporal Programs and the Global Structure The single-input module (SIM) network motif The network motifs we have studied so far all had a defined number of nodes.
GENETICS - CLUTCH CH.12 GENE REGULATION IN PROKARYOTES.
 GEETICS - CLUTCH CH.12 GEE REGULATIO I PROKARYOTES!! www.clutchprep.com GEETICS - CLUTCH CH.12 GEE REGULATIO I PROKARYOTES COCEPT: LAC OPERO An operon is a group of genes with similar functions that are
CS-E5880 Modeling biological networks Gene regulatory networks
 CS-E5880 Modeling biological networks Gene regulatory networks Jukka Intosalmi (based on slides by Harri Lähdesmäki) Department of Computer Science Aalto University January 12, 2018 Outline Modeling gene
The Gene The gene; Genes Genes Allele;
 Gene, genetic code and regulation of the gene expression, Regulating the Metabolism, The Lac- Operon system,catabolic repression, The Trp Operon system: regulating the biosynthesis of the tryptophan. Mitesh
THE EDIBLE OPERON David O. Freier Lynchburg College [BIOL 220W Cellular Diversity]
![THE EDIBLE OPERON David O. Freier Lynchburg College [BIOL 220W Cellular Diversity]](/thumbs/90/102203867.jpg "THE EDIBLE OPERON David O. Freier Lynchburg College [BIOL 220W Cellular Diversity]") THE EDIBLE OPERON David O. Freier Lynchburg College [BIOL 220W Cellular Diversity] You have the following resources available to you: Short bread cookies = DNA / genetic elements Fudge Mint cookies = RNA
THE EDIBLE OPERON David O. Freier Lynchburg College [BIOL 220W Cellular Diversity] You have the following resources available to you: Short bread cookies = DNA / genetic elements Fudge Mint cookies = RNA
Translation - Prokaryotes
 1 Translation - Prokaryotes Shine-Dalgarno (SD) Sequence rrna 3 -GAUACCAUCCUCCUUA-5 mrna...ggagg..(5-7bp)...aug Influences: Secondary structure!! SD and AUG in unstructured region Start AUG 91% GUG 8 UUG
Regulation and signaling. Overview. Control of gene expression. Cells need to regulate the amounts of different proteins they express, depending on
 Regulation and signaling Overview Cells need to regulate the amounts of different proteins they express, depending on cell development (skin vs liver cell) cell stage environmental conditions (food, temperature,
Honors Biology Reading Guide Chapter 11
 Honors Biology Reading Guide Chapter 11 v Promoter a specific nucleotide sequence in DNA located near the start of a gene that is the binding site for RNA polymerase and the place where transcription begins
Newly made RNA is called primary transcript and is modified in three ways before leaving the nucleus:
 m Eukaryotic mrna processing Newly made RNA is called primary transcript and is modified in three ways before leaving the nucleus: Cap structure a modified guanine base is added to the 5 end. Poly-A tail
A Synthetic Oscillatory Network of Transcriptional Regulators
 A Synthetic Oscillatory Network of Transcriptional Regulators Michael Elowitz & Stanislas Leibler Nature, 2000 Presented by Khaled A. Rahman Background Genetic Networks Gene X Operator Operator Gene Y
GENES AND CHROMOSOMES III. Lecture 5. Biology Department Concordia University. Dr. S. Azam BIOL 266/
 GENES AND CHROMOSOMES III Lecture 5 BIOL 266/4 2014-15 Dr. S. Azam Biology Department Concordia University CELL NUCLEUS AND THE CONTROL OF GENE EXPRESSION OPERONS Introduction All cells in a multi-cellular
Control of Gene Expression
 Control of Gene Expression Mechanisms of Gene Control Gene Control in Eukaryotes Master Genes Gene Control In Prokaryotes Epigenetics Gene Expression The overall process by which information flows from
Gene Switches Teacher Information
 STO-143 Gene Switches Teacher Information Summary Kit contains How do bacteria turn on and turn off genes? Students model the action of the lac operon that regulates the expression of genes essential for
Initiation of translation in eukaryotic cells:connecting the head and tail
 Initiation of translation in eukaryotic cells:connecting the head and tail GCCRCCAUGG 1: Multiple initiation factors with distinct biochemical roles (linking, tethering, recruiting, and scanning) 2: 5
DNA Technology, Bacteria, Virus and Meiosis Test REVIEW
 Be prepared to turn in a completed test review before your test. In addition to the questions below you should be able to make and analyze a plasmid map. Prokaryotic Gene Regulation 1. What is meant by
2. What was the Avery-MacLeod-McCarty experiment and why was it significant? 3. What was the Hershey-Chase experiment and why was it significant?
 Name Date Period AP Exam Review Part 6: Molecular Genetics I. DNA and RNA Basics A. History of finding out what DNA really is 1. What was Griffith s experiment and why was it significant? 1 2. What was
Lecture 7: Simple genetic circuits I
 Lecture 7: Simple genetic circuits I Paul C Bressloff (Fall 2018) 7.1 Transcription and translation In Fig. 20 we show the two main stages in the expression of a single gene according to the central dogma.
Gene regulation II Biochemistry 302. Bob Kelm February 28, 2005
 Gene regulation II Biochemistry 302 Bob Kelm February 28, 2005 Catabolic operons: Regulation by multiple signals targeting different TFs Catabolite repression: Activity of lac operon is restricted when
Biological Pathways Representation by Petri Nets and extension
 Biological Pathways Representation by and extensions December 6, 2006 Biological Pathways Representation by and extension 1 The cell Pathways 2 Definitions 3 4 Biological Pathways Representation by and
Gene regulation I Biochemistry 302. Bob Kelm February 25, 2005
 Gene regulation I Biochemistry 302 Bob Kelm February 25, 2005 Principles of gene regulation (cellular versus molecular level) Extracellular signals Chemical (e.g. hormones, growth factors) Environmental
Regulation of Gene Expression at the level of Transcription
 Regulation of Gene Expression at the level of Transcription (examples are mostly bacterial) Diarmaid Hughes ICM/Microbiology VT2009 Regulation of Gene Expression at the level of Transcription (examples
Control of Gene Expression in Prokaryotes
 Why? Control of Expression in Prokaryotes How do prokaryotes use operons to control gene expression? Houses usually have a light source in every room, but it would be a waste of energy to leave every light
Types of biological networks. I. Intra-cellurar networks
 Types of biological networks I. Intra-cellurar networks 1 Some intra-cellular networks: 1. Metabolic networks 2. Transcriptional regulation networks 3. Cell signalling networks 4. Protein-protein interaction
Genetic transcription and regulation
 Genetic transcription and regulation Central dogma of biology DNA codes for DNA DNA codes for RNA RNA codes for proteins not surprisingly, many points for regulation of the process https://www.youtube.com/
AP Bio Module 16: Bacterial Genetics and Operons, Student Learning Guide
 Name: Period: Date: AP Bio Module 6: Bacterial Genetics and Operons, Student Learning Guide Getting started. Work in pairs (share a computer). Make sure that you log in for the first quiz so that you get
L3.1: Circuits: Introduction to Transcription Networks. Cellular Design Principles Prof. Jenna Rickus
 L3.1: Circuits: Introduction to Transcription Networks Cellular Design Principles Prof. Jenna Rickus In this lecture Cognitive problem of the Cell Introduce transcription networks Key processing network
Division Ave. High School AP Biology
 Control of Prokaryotic (Bacterial) Genes 20072008 Bacterial metabolism n Bacteria need to respond quickly to changes in their environment u if they have enough of a product, need to stop production n why?
The Making of the Fittest: Evolving Switches, Evolving Bodies
 INTRODUCTION MODELING THE REGULATORY SWITCHES OF THE PITX1 GENE IN STICKLEBACK FISH The types and amounts of proteins produced by a given cell in the body are very important and carefully regulated. Transcribing
PROTEIN SYNTHESIS INTRO
 MR. POMERANTZ Page 1 of 6 Protein synthesis Intro. Use the text book to help properly answer the following questions 1. RNA differs from DNA in that RNA a. is single-stranded. c. contains the nitrogen
Regulation of Gene Expression in Bacteria and Their Viruses
 11 Regulation of Gene Expression in Bacteria and Their Viruses WORKING WITH THE FIGURES 1. Compare the structure of IPTG shown in Figure 11-7 with the structure of galactose shown in Figure 11-5. Why is
Organization of Genes Differs in Prokaryotic and Eukaryotic DNA Chapter 10 p
 Organization of Genes Differs in Prokaryotic and Eukaryotic DNA Chapter 10 p.110-114 Arrangement of information in DNA----- requirements for RNA Common arrangement of protein-coding genes in prokaryotes=
Co-ordination occurs in multiple layers Intracellular regulation: self-regulation Intercellular regulation: coordinated cell signalling e.g.
 Gene Expression- Overview Differentiating cells Achieved through changes in gene expression All cells contain the same whole genome A typical differentiated cell only expresses ~50% of its total gene Overview
Translation and Operons
 Translation and Operons You Should Be Able To 1. Describe the three stages translation. including the movement of trna molecules through the ribosome. 2. Compare and contrast the roles of three different
Principles of Genetics
 Principles of Genetics Snustad, D ISBN-13: 9780470903599 Table of Contents C H A P T E R 1 The Science of Genetics 1 An Invitation 2 Three Great Milestones in Genetics 2 DNA as the Genetic Material 6 Genetics
Noise is often perceived as being undesirable and unpredictable;
 Intrinsic noise in gene regulatory networks Mukund Thattai and Alexander van Oudenaarden* Department of Physics, Room 13-2010, Massachusetts Institute of Technology, 77 Massachusetts Avenue, Cambridge,
Genetic transcription and regulation
 Genetic transcription and regulation Central dogma of biology DNA codes for DNA DNA codes for RNA RNA codes for proteins not surprisingly, many points for regulation of the process DNA codes for DNA replication
Chapter 18: Control of Gene Expression
 Chapter 18: Control of Gene Expression 海洋生物研究所 曾令銘 海事大樓 426 室分機 : 5326 Differential Expression of Genes Prokaryotes and eukaryotes precisely regulate gene expression in response to environmental conditions
Pre-dispositions and epigenetic inheritance in the Escherichia coli lactose operon bistable switch
 Molecular Systems Biology 6; Article number 357; doi:.38/msb.20.12 Citation: Molecular Systems Biology 6:357 & 20 EMBO and Macmillan Publishers Limited All rights reserved 1744-4292/ www.molecularsystemsbiology.com
Effects of Different Burst Form on Gene Expression Dynamic and First-Passage Time
 Advanced Studies in Biology, Vol. 9, 2017, no. 2, 91-100 HIKARI Ltd, www.m-hikari.com https://doi.org/10.12988/asb.2017.726 Effects of Different Burst Form on Gene Expression Dynamic and First-Passage
Biology. Biology. Slide 1 of 26. End Show. Copyright Pearson Prentice Hall
 Biology Biology 1 of 26 Fruit fly chromosome 12-5 Gene Regulation Mouse chromosomes Fruit fly embryo Mouse embryo Adult fruit fly Adult mouse 2 of 26 Gene Regulation: An Example Gene Regulation: An Example
Chapter 12. Genes: Expression and Regulation
 Chapter 12 Genes: Expression and Regulation 1 DNA Transcription or RNA Synthesis produces three types of RNA trna carries amino acids during protein synthesis rrna component of ribosomes mrna directs protein
URL: <
 Citation: ngelova, Maia and en Halim, sma () Dynamic model of gene regulation for the lac operon. Journal of Physics: Conference Series, 86 (). ISSN 7-696 Published by: IOP Publishing URL: http://dx.doi.org/.88/7-696/86//7
RNA Synthesis and Processing
 RNA Synthesis and Processing Introduction Regulation of gene expression allows cells to adapt to environmental changes and is responsible for the distinct activities of the differentiated cell types that
Basic Synthetic Biology circuits
 Basic Synthetic Biology circuits Note: these practices were obtained from the Computer Modelling Practicals lecture by Vincent Rouilly and Geoff Baldwin at Imperial College s course of Introduction to