The deep archaeal roots of eukaryotes. Natalya Yutin, Kira S. Makarova, Sergey L. Mekhedov, Yuri I. Wolf, Eugene V. Koonin*
|
|
|
- Vincent Williams
- 6 years ago
- Views:
Transcription
1 MBE Advance Access published May 6, 2008 The deep archaeal roots of eukaryotes Natalya Yutin, Kira S. Makarova, Sergey L. Mekhedov, Yuri I. Wolf, Eugene V. Koonin* National Center for Biotechnology Information, National Library of Medicine, National Institutes of Health, Bethesda, MD *For correspondence: Running head: Archaeal-eukaryotic relationships Published by Oxford University Press This is an Open Access article distributed under the terms of the Creative Commons Attribution Non-Commercial License ( which permits unrestricted non-commercial use, distribution, and reproduction in any medium, provided the original work is properly cited. 1
2 Abstract The set of conserved eukaryotic protein-coding genes includes distinct subsets one of which appears to be most closely related to and, by inference, derived from archaea, whereas another one appears to be of bacterial, possibly, endosymbiotic origin. The archaeal genes of eukaryotes, primarily, encode components of information-processing systems whereas the bacterial genes are predominantly operational. The precise nature of the archaeo-eukaryotic relationship remains uncertain, and it has been variously argued that eukaryotic informational genes evolved from the homologous genes of Euryarchaeota or Crenarchaeota (the major branches of extant archaea), or that the origin of eukaryotes lies outside the known diversity of archaea. We describe a comprehensive set of 355 eukaryotic genes of apparent archaeal origin identified through ortholog detection and phylogenetic analysis. Phylogenetic hypothesis testing using constrained trees, combined with a systematic search for shared derived characters in the form of homologous inserts in conserved proteins, indicate that, for the majority of these genes, the preferred tree topology is one with the eukaryotic branch placed outside the extant diversity of archaea although small subsets of genes show crenarchaeal and euryarchaeal affinities. Thus, the archaeal genes in eukaryotes appear to descend from a distinct, ancient, and otherwise uncharacterized archaeal lineage that acquired some euryarchaeal and crenarchaeal genes via early horizontal gene transfer. 2
3 Introduction The emergence of eukaryotes is one of the central, and hotly debated, themes in evolutionary biology. These debates have led to multiple, competing hypotheses which present drastically different scenarios for the origin of the complex eukaryotic cell (Martin and Muller 1998; Embley and Martin 2006; Kurland, Collins, and Penny 2006; Martin and Koonin 2006; Dagan and Martin 2007; Poole and Penny 2007b). Two key observations that must be taken into account by any concept of eukaryotic origin are currently not contested seriously. 1. All extant eukaryotes evolved from a common ancestor that already possessed an α- proteobacterial endosymbiont that gave rise to the mitochondria and their degraded relatives, hydrogenosomes and mitosomes(van der Giezen and Tovar 2005; Embley 2006). 2. Eukaryotes possess two distinct sets of genes, one of which shows apparent phylogenetic affinity with homologs from archaea, and the other one is more closely related to bacterial homologs (not all eukaryotic genes belong to these two sets, of course; many are of uncertain origin, and many more appear to be unique to eukaryotes). There is a clear functional divide between the archaeal and bacterial genes of eukaryotes, with the former encoding, largely, proteins involved in information processing (translation, transcription, replication, repair) and the latter encoding proteins with operational functions (metabolic enzymes, components of membranes and other cellular structures etc) (Esser et al. 2004; Rivera and Lake 2004). In some of the informational and operational systems, the archaeal and bacterial affinities, respectively, of eukaryotic genes are manifest qualitatively: thus, the key proteins involved in DNA replication in archaea and eukaryotes are not homologous to the functionally analogous proteins of bacteria (Leipe, Aravind, and Koonin 1999), and conversely, some of the principal enzymes of membrane biogenesis are homologous in eukaryotes and bacteria but not in archaea (Pereto, Lopez-Garcia, and Moreira 2004). 3
4 Apparently, the most parsimonious scenario of eukaryogenesis combining these two key facts is that the first eukaryote was an archaeal-bacterial chimera that emerged as a result of an invasion of an archaeon by an α proteobacterium, the well-established ancestor of the mitochondria(martin and Muller 1998; Rivera and Lake 2004; Martin and Koonin 2006). However, this is by no means the only scenario of eukaryotic origins that is currently actively considered (Embley and Martin 2006; Poole and Penny 2007b). The main competitor is, probably, the archezoan hypothesis under which the host of the α-proteobacterial endosymbiont was not an archaeon but a primitive, obviously, amitochondrial, proto-eukaryote that already possessed the hallmarks of the eukaryotic cell, such as the endomembrane system, the nucleus, and the cytoskeleton (Kurland, Collins, and Penny 2006; Poole and Penny 2007a).The symbiotic scenarios substantially differ from the archezoan hypothesis with respect to the level of complexity that is attributed to the host of the mitochondrial endosymbiont. Under the symbiotic hypotheses, the host was a garden-variety archaeon, with the dramatic complexification of the cellular organization being triggered by the symbiosis. In contrast, the archezoan hypothesis posits that, at least, some substantial aspects of the characteristic eukaryotic complexity (e.g., the endomembrane system) evolved prior to and independent of the symbiosis, and were already in place in the organism that hosted the mitochondrion. Under the archezoan scenario, the presence of archaea-like genes in the ancestral eukaryotic gene set is, then, explained either by postulating that the proto-eukaryotic lineage was a sister group of archaea and/or by horizontal transfer of archaeal genes. The archezoan hypothesis was seriously undermined by the realization that all unicellular eukaryotes previously thought to be primitively amitochondrial actually possess degraded organelles of α-proteobacterial descent. Nevertheless, the archezoan scenario stays alive, with the proviso that the ancestral archezoan lineage had gone extinct (Poole and Penny 2007a). In addition, more complex scenarios have been considered, with an ancient, primary symbiosis leading to the emergence of a nucleated, amitochondriate, protoeukaryotic cell and antedating the acquisition of an α-proteobacterium that gave rise to the mitochondria. A γ-proteobacterium (Horiike et al. 2004), a δ-proteobacterium (Moreira and Lopez-Garcia 1998; Lopez-Garcia and Moreira 2006), a Clostridium-like Grampositive bacterium (Karlin et al. 1999), or a spirochaete (Margulis 1996)(Margulis et al. 2005) have been variously proposed as bacterial counterparts of this putative primary symbiosis. The possibility also has been considered that the nucleus itself is a derived endosymbiont, a descendant 4
5 of a Crenarchaeon (Lake and Rivera 1994) or a Euryarchaeon, such as Pyrococcus (Horiike et al. 2004) that invaded a bacterial host. The rapidly growing collection of sequenced genomes from different domains and lineages of life provides for empirical testing of these hypotheses by phylogenetic analyses on genomewide data. The problem of eukaryogenesis is extremely hard and complex, given the depth of the divergences involved, and arguably, has to be tackled piecemeal, by deciphering the origins of particular subsets of eukaryotic genes and signature eukaryotic functional system through thorough phylogenetic analysis. Here we address the specific evolutionary origin(s) of those eukaryotic genes that appear to show an affinity with archaeal homologs. In particular, we asked whether the archaea-related parent of eukaryotes comes from within the phylogenetic span of the extant archaea, i.e., originates from either Euryarchaeota or Crenarchaeota, or outside that span, perhaps, representing a distinct archaeal branch, or even a distinct domain of life. Clearly, in the first case, eukaryotes are expected to be rooted within either Crenarchaeota or Euryarchaeota in phylogenetic trees whereas, in the second case, Eukarya should branch outside of the archaeal clade. Phylogenetic analyses and other types of evolutionary reconstructions aimed at elucidating the evolutionary relationship between archaea and eukaryotes have yielded conflicting results. Some early comparisons of ribosomal structure and phylogenetic analyses have suggested a specific affinity between eukaryotic genes and their orthologs from Crenarchaeota (dubbed Eocytes on the basis of this observation) (Lake et al. 1984; Lake 1988; Rivera and Lake 1992; Lake 1998). Support for the eocyte hypothesis has been subsequently claimed from comparative analysis of ribosomal protein sequences (Vishwanath et al. 2004) and from a novel approach to whole-genome-based phylogenetic analysis (Rivera and Lake 2004). By contrast, the origin of the archaeal genes of eukaryotes from euryarchaea, and specifically, from methanogens has been postulated on biological considerations, within the framework of the hydrogen hypothesis (Martin and Muller 1998) and one of the so-called syntrophic hypotheses (Lopez-Garcia and Moreira 2006) that are based on different forms of 5
6 metabolic cooperation between the archaeal and bacterial partners of the primary ensodymbiosis. The origin of these genes from methanogens also appears compatible with the results of some phylogenetic analyses (Moreira and Lopez-Garcia 1998; Horiike et al. 2004). Other researchers have argued that the archaeal parent of eukaryotes lies outside the currently known diversity of archaea, on the basis of biological considerations (Vellai, Takacs, and Vida 1998) or phylogenetic analysis results (Hedges et al. 2001; Tekaia and Yeramian 2005; Ciccarelli et al. 2006; Fukami- Kobayashi et al. 2007). Most of these analyses either employed a relatively small number of concatenated, most highly conserved protein sequences (e.g., those of ribosomal proteins) for phylogenetic tree construction (Ciccarelli et al. 2006; Hartman, Favaretto, and Smith 2006) or built trees on the basis of gene composition comparisons (phyletic patterns) (Horiike et al. 2004; Tekaia and Yeramian 2005), or else employed other features, such as domain architectures of multidomain proteins, as phylogenetic characters (Fukami-Kobayashi et al. 2007). The most complete of the relevant phylogenetic studies that have appeared so far is the work of Pisani et al. who analyzed nearly 6,000 gene sets from 185 genomes using the supertree approach (Pisani, Cotton, and McInerney 2007). These authors reported an apparent phylogenetic affinity between eukaryotes and Thermoplasma although the signal came with limited statistical support. Thermoplasma or a related archaeon also has been suggested as the likely archaeal parent of eukaryotes on the basis of biochemical and cytological considerations (Searcy, Stein, and Green 1978; Margulis and Stolz 1984; Hixon and Searcy 1993; Margulis 1996; Margulis, Dolan, and Guerrero 2000). Given these conflicting conclusions on the nature of the archaeal-eukaryotic affinity that have been reached over the years using widely different methods along with a variety of biological considerations, we were compelled to attempt an exhaustive phylogenetic analysis of eukaryotic 6
7 genes of apparent archaeal origin, with a minimal set of assumptions. We do not take it for granted that genes in a lineage share a common history (Gogarten, Doolittle, and Lawrence 2002; Bapteste et al. 2005; Doolittle and Bapteste 2007) and avoid concatenation of sequences of individual genes or a supertree-type analysis of individual trees. Instead, trees for orthologous gene sets were built separately, their topologies were assessed with several independent methods, and a post-hoc census was taken. We conclude that neither Crenarchaeota nor Euryarchaeota made the decisive contribution to the archaeal component of the ancestral eukaryotic gene set. The bulk of the eukaryotic genes with an apparent archaeal affinity seem to originate from a distinct archaeal lineage that branched off the trunk of the archaeal tree prior to the radiation of Crenarchaeota and Euryarchaeota. A limited amount of horizontal gene transfer might have led to the acquisition of the few eukaryotic genes that do show Crenarchaeal and Euryarchaeal affinities. Results Eukaryotic genes of archaeal and bacterial origins The analysis of the evolutionary relationships between eukaryotic and archaeal genes involved a series of steps from identification of orthologs to phylogenetic hypothesis testing, organized in a pipeline (Figure 1a; see Materials and Methods for details). In order to derive a comprehensive set of orthologous genes of eukaryotes and prokaryotes, we performed a comparison between updated versions of previously developed clusters of orthologous genes for eukaryotes (originally, KOGs but currently renamed KOD, eukaryotic clusters of Orthologous Domains) and prokaryotes, COGs (Tatusov et al. 2003), and a new collection of orthologous clusters for archaea, the arcogs (Makarova et al. 2007). The identification of orthologs was based on the bidirectional best hit scheme (Tatusov, Koonin, and Lipman 1997), with the difference that 7
8 the best hits were identified by running a position-specific scoring matrix (PSSM (Altschul et al. 1997)) derived from the alignment of orthologous protein sequences for each arcog against the database of KOD sequences and, reciprocally, comparing KOD PSSMs to the arcog sequence collection. This strategy was chosen to increase the detection sensitivity and also because, for the purpose of this study, it was desirable to collapse the lineage specific paralogs, i.e., those genes that evolved by duplication either in eukaryotes or in archaea. It can be easily demonstrated that, if (PSI-)BLAST scores change monotonically with evolutionary distances, the bidirectional best hit scheme is guaranteed to choose one and only one reciprocal pair of genes (COGs) on both sides of a tree branch, reducing the many-to-many relationship between members of lineage-specific expansions of paralogous families to one-to-one relationship between the selected representatives. Deviations of the (PSI-)BLAST scores from this relationship with the distances might lead to the appearance of additional pairs from the same multigene family; however, such deviations are seen only on rare occasions (E. Czabarka and YIW, unpublished observations). This step yielded 980 Archaea-Eukaryote (A-E) pairs of putative orthologous gene sets (Figure 1a). At the next step, whenever possible, bacterial orthologs from the COG database were added using either the same approach or the previous, manually curated assignments of KODs and arcogs to COGs (Makarova et al. 2005; Makarova et al. 2007). As the result of this procedure, 919 Archaeal- Eukaryotic-Bacterial (A-E-B) triplets were obtained. For the remaining 61 A-E pairs, the eukaryotic proteins were found to be closely associated with bacterial-only COGs, whereas the archaeal component had a different bacterial counterpart in the COG database. These 61 KODs were considered to be of bacterial origin; the affinity between the respective arcogs and KODs, probably, reflects ancient paralogy (an example is given in Figure S1 in the Supplementary Material). The clusters of putative orthologs were then classified according to the representation of the three domains. Among the 919 A-E-B triplets, 147 were found to be predominantly archaeal (no more than 2 bacterial proteins); in the absence of ancient bacterial orthologs, the eukaryotic members of these clusters were tentatively assigned archaeal origin. Conversely, 173 clusters were found to contain an abundance of bacteria but only a few (<6) archaea; accordingly, the eukaryotic members of these triplets were tentatively assigned bacterial origin. These assignments rely on the assumption, akin to the parsimony principle, that the dominance of a particular gene in one domain 8
9 (e.g., archaea) reflects its origin in that domain, with the few instances seen in the other domain (bacteria) attributable to horizontal transfer. A possible caveat is that the gene in question is of bacterial origin but spread horizontally among diverse archaea, perhaps, owing to its special utility and was concomitantly lost in the majority of bacteria. This scenario seems highly unlikely, especially, given the drastic lifestyle differences between the majority of the archaea (mostly, thermophiles) and bacteria in the current genome collections; nevertheless, there is no means to rule it out other than parsimony considerations. In 22 cases, neither archaeal nor bacterial members of the clusters made the cutoff (6 and 10 species, respectively), so these clusters were classified into an unresolved category. The remaining 577 A-E-B triplets were subject to a round of preliminary phylogenetic analysis. The rationale behind choosing this and only this set of orthologous clusters for phylogenetic analysis was that only clusters with appropriate taxon sampling from each of the three domains are suitable for meaningful analysis of the likely origins of the eukaryotic genes(pollock et al. 2002; Zwickl and Hillis 2002). The assignment of archaeal or bacterial origin to eukaryotic genes is a non-trivial task except for the above cases where orthologs were detected in one of the domains, archaea or bacteria, (almost) exclusively. For the majority of the highly conserved eukaryotic genes that had numerous apparent orthologs in both archaea and bacteria, the root position in the phylogenetic tree is not known, so technically, the archaeal or bacterial origin of the eukaryotic genes cannot be determined. Therefore, to infer eukaryotic gene origin, we made an additional assumption. Considering the well-established endosymbiotic scenario of eukaryotic evolution, under which the endosymbiosis of an archaeon (or an ancestral form related to archaea) with an α-proteobacterium that led to the origin of mitochondria occurred well after the divergence of the major bacterial lineages(gray 1992; Gray, Burger, and Lang 2001), we assumed that eukaryotic genes of bacterial origin would be rooted within the bacterial subtree rather than outside the bacteria. Conversely, eukaryotic genes that branched off between the bacterial and archaeal subtrees could be considered candidates for archaeal origin. A potential problem with this assumption is the well known long branch attraction (LBA) artifact because of which eukaryotic genes of bacterial origin that underwent a period of accelerated evolution during eukaryogenesis could fall outside the bacterial subtree. Owing to the LBA problem, the resulting set of candidates for archaeal origin is expected to include some false-positives, i.e., fast-evolving proteins of bacterial origin. Hence we included 9
10 an additional filtering step in which the trees for eukaryotic proteins that, on average, showed a greater similarity to bacterial than to archaeal orthologs were inspected on a case by case basis and removed from the archaeal set unless the high similarity to bacterial orthologs could be attributed to HGT from eukaryotes to bacteria. In the first round of phylogenetic analysis, eukaryotic, archaeal, and bacterial proteins from each of the 577 A-E-B triplets were aligned (see Methods for details). For each alignment, 8 phylogenetic trees with different substitution models were constructed using the PhyML software (Guindon and Gascuel 2003). The best tree for each A-E-B triplet was chosen for further analysis according to its log-likelihood value. The similarity filter was applied after which the trees were examined case-by-case and classified into the following 3 categories (Figure 1a). Unresolved: 167 trees. Trees, in which archaea, eukaryotes, or bacteria were not monophyletic, and star-like trees; Probable bacterial origin of eukaryotic genes: 202 trees. Trees in which eukaryotes grouped within the bacterial subtree; Probable archaeal origin of eukaryotic genes: 208 trees. Trees where eukaryotes formed a clade either within the archaeal subtree or between archaea and bacteria. Altogether, after pooling those genes that had no or few bacterial orthologs with those that were marked as archaeal at the stage of preliminary phylogenetic analysis, we identified 355 ancestral eukaryotic genes of apparent archaeal descent (36% of the identified A-E orthologous pairs) (Fig. 1b). The distribution of the functional assignments among the bacterial and archaeal genes seems to support the classification of conserved eukaryotic genes by their likely origin that was derived by using phyletic patterns and preliminary tree analysis. As expected from previous studies (Rivera et al. 1998; Esser et al. 2004), the proteins of apparent archaeal origin were mostly components of information-processing systems, whereas the proteins of bacterial origin were predominantly operational, i.e., involved in various metabolic, cellular and signaling processes (Fig. 2a). Thus, we assumed that the classification of a gene as archaeal at this stage, typically, correctly reflected its origin. 10
11 The current breakdown of archaeal-eukaryotic orthologs suggests that the archaeal parent contributed at least 355 genes to the emerging eukaryotic cell (the number of present-day eukaryotic genes that are traceable to these archaeal genes is, approximately, twofold greater as a result of ancient duplications during eukaryogenesis (Makarova et al. 2005)). This hardly could be the complete list because, inevitably, some archaeo-eukaryotic orthologs escape detection owing to extreme divergence, whereas others could be missed due to the complex history of duplications and accompanying changes in the evolution rate obscured the relationships with the prokaryotic homologs such that some of the eukaryotic genes of archaeal origin might end up in the unresolved set (Figure 1a,b). Nevertheless, the set derived here seems to be a reasonable, if conservative, approximation of the archaeal contribution to eukaryogenesis. Indeed, these genes include the majority of the protein components of the archaeal translation system, cover most of the core functions involved in archaeal translation, transcription, and replication, and potentially, could approximate a minimal information processing apparatus at the outset of eukaryogenesis (Figure 2b,c). Of the 208 A-E-B clusters for which archaeal origin of the eukaryotic genes was inferred, 134 contained enough representatives of Crenarchaeota, Euryarchaeota, Eukaryota and Bacteria to detect possible euryarchaeal, crenarchaeal or deep archaeal ancestry of the eukaryotic gene family (see Detailed phylogenetic analysis below). The remaining 74 clusters were combined with the 147 clusters of archaeal origin that lacked representation of bacterial orthologs and further classified on the basis of the representation of the group members (Figure 1a,b and see below). Detailed phylogenetic analysis of 134 A-E-B clusters of orthologs For the purpose of detailed phylogenetic analysis, 134 clusters of orthologs that included eukaryotic genes of apparent archaeal origin (A-E-B clusters) were selected as described above. Among these, two clusters each encompassed two distinct eukaryotic clades (non-monophyly of eukaryotes was validated using the Approximately Unbiased (AU) test; see Methods). These clusters were analyzed twice, once with each of the eukaryotic clades, bringing the total number of analyzed orthologous sets to 136. To select representatives from each of the four major clades (Crenarchaeota, CA; Euryarchaeota, EA; Eukaryota, E and Bacteria, B), we implemented an algorithm that analyzes the midpoint-rooted PhyML tree (see Methods and Supplementary 11
12 Methods for details). For each of the groups, the most representative branch was identified using the criteria of the maximum diversity of the members of the given major clade combined with the minimum diversity of the members of the other clades. The required number of representatives was selected from this branch with the aim to maximize diversity while excluding unusually long branches. For each cluster, an unconstrained maximum likelihood (ML) tree and three constrained ML trees were constructed. Each of the constrained trees enforced the monophyly of each of the four major clades and, additionally, the tree was forced into one of the following 3 topologies: "deep", ((B),(E),((CA),(EA))): Crenarchaeota group with Euryarchaeota to the exclusion of Eukaryota and Bacteria; "crenarchaeal", ((B),(EA),((CA),(E))): Eukaryota group with Crenarchaeota to the exclusion of Euryarchaeota and Bacteria; "euryarchaeal", ((B),(CA),((EA),(E))): Eukaryota group with Euryarchaeota to the exclusion of Crenarchaeota and Bacteria; First, all clusters were tested for compatibility with the hypothesis of monophyly of the representatives of all 4 major groups. The AU test p-values for the constrained trees were compared to that of the unconstrained tree; if at least one of the three p-values was greater than the cut-off (0.05), the cluster was deemed to consist of monophyletic major groups. All 136 sets passed this test. Second, log-likelihood values, expected likelihood weight (ELW) values and AU test p- values were recorded for the comparison of the three constrained topologies that represent three distinct evolutionary scenarios for the respective eukaryotic genes (Table S1, Supplementary Material). These data were subject to further statistical analysis. Most of the analyzed clusters did not contain enough phylogenetic information to unambiguously resolve the position of the eukaryotic branch. In 9 clusters, only one of the three competing topologies passed the AU test (5 "deep" and 4 "crenarchaeal"). In another 8 clusters, one of the topologies was rejected (1 "deep", 4 "crenarchaeal" and 3 "euryarchaeal"). For the rest of the clusters, all three topologies passed the p- value threshold of 0.05, i.e., none of the topologies could be rejected. 12
13 The lack of statistical power in the analysis of most of the individual clusters does not preclude a meaningful examination of trends in the data set as a whole. When plotted on a simplex, ELW values indicate the tendency of the entire data set to resolve into each of the three competing topologies (Figure 3). Within a wide range of threshold ELW-values (0.33 to 0.85), the ratio of clusters for which the tree topology was best compatible with the "deep", "crenarchaeal" and "euryarchaeal" origins of the respective eukaryotic genes was fairly stable and close to 0.54:0.30:0.16 (33:18:10 clusters at the threshold ELW-value of 0.6; Figure 4). Log-likelihood values for each of the three topologies, summed over the 136 clusters, indicate the overall likelihood support for the corresponding evolutionary scenarios ( , , and , for the "deep", "crenarchaeal" and "euryarchaeal" topologies, respectively). Thus, the "deep" topology had, marginally, the greatest total likelihood. We performed 10,000 bootstrap resamplings of the set of 136 clusters of orthologous genes to assess the robustness of this result and found that 73% of the bootstrap samples supported the overall dominance of the "deep" topology, 27% supported the crenarchaeal scenario, and none (p<1x10⁻⁴ ) supported the euryarchaeal affinity of the eukaryotic branch. Thus, even in those trees where the euryarchaeal topology was formally preferred, the signal was weak. The principal problem with the interpretation of these results is the possibility that the deep archaeal origin of eukaryotes is an LBA artifact (Felsenstein 2004), perhaps, caused by an acceleration of evolution of genes derived from the archaeal parent during the emergence of eukaryotes, such that genes of euryarchaeal or crenarchaeal origin are placed below the base of the archaeal subtree. The ML tree methods have been shown to be less sensitive to LBA within a wide range of evolutionary rate variation than other phylogenetic methods although major differences in branch length still lead to inaccurate phylogenies (Anderson and Swofford 2004; Philippe et al. 2005). However, the fact that we found roughly the same number of crenarchaeal and euryarchaeal trees, and no obvious functional differences between genes that yielded the three subsets of trees seem to argue against a major contribution of LBA to the observed breakdown of trees. Indeed, should, e.g., the crenarchaeal topology be correct, one would expect to find two groups of trees: accurate ones, with a eukaryotic-crenarchaeal clade, and those distorted by LBA, with the eukaryotic branch positioned outside the divergence of Creanrchaeota and Euryarchaeota; the euryarchaeal trees are not predicted by this scenario. Furthermore, we found no significant 13
14 differences in the long-term evolutionary rates (relative to the respective bacterial orthologs) of the genes that showed the euryarchaeal, crenarchaeal, and deep topologies (Figure S3). This seems to be poorly compatible with acceleration of evolution being the major underlying cause behind the prevalence of the deep topology: indeed, should that be the case, one would expect significantly higher rates to be detected for the genes with the deep topology compared to those with, at least, one of the other two topologies. Shared derived characters in archaea and eukaryotes In an attempt to obtain additional evidence of eukaryotic origins, we searched the 136 A-E- B alignments for possible shared derived characters (synapomorphies) that could help resolve the phylogenetic affinities among the 4 groups. Operationally, we looked for insertions-deletions (indels) where a gap was shared between bacteria and one of the other three groups (ensuring the derived state of the insert), whereas the remaining two groups shared an apparently homologous insert. The approach is similar to that previously employed by others (Rivera and Lake 1992; Griffiths and Gupta 2001) except that special attention was given to the sequence conservation in the insert itself. The position of the gap was validated by the presence of highly conserved "anchoring" alignment positions in the vicinity of both ends of the indel (see Methods for details). Four potential synapomorphies supported the monophyly of archaea relative to bacteria and eukaryotes (inserts shared between EA and CA), which corresponds to the deep archaeal origin of the respective eukaryotic genes, whereas one synapomorphy favored grouping of eukaryotes with crenarchaea and one synapomorphy grouped eukaryotes with euryarchaea (Figure S2 in the Supplementary Material). In all 6 cases, the synapomorphies agreed with the most likely tree topology that was inferred on the basis of the highest ELW value for the respective cluster. Other eukaryotic genes of archaeal origin For 221 (147+74) clusters of orthologs that included eukaryotic genes of apparent archaeal origin, the detailed phylogenetic analysis described above was not feasible due to the low number of representatives of one or more of the major groups (CA, EA or B) (Figure 1ab). Specifically, 14
15 CA or EA were considered to be absent when a cluster included fewer than 4 crenarchaeal or 10 euryarchaeal genes (in which case no PhyML tree was built) or when CA or EA did not represent a clade group in the PhyML tree. Similarly, clusters that included no or only one bacterial representative were classified as no Bacteria without phylogenetic analysis; clusters with two or more bacterial members were classified as no Bacteria when the respective PhyML trees included no credible bacterial outgroup. Among these, 42 clusters did not include Crenarchaeota, 21 clusters did not include Euryarchaeota, whereas in 158 clusters, both Crenarchaeota and Euryarchaeota were well-represented but there was no apparent ancestral bacterial clade. For the former two categories, the crenarchaeal and euryarchaeal origin, respectively, of the eukaryotic genes could be inferred although, formally, the loss of the corresponding gene in the other archaeal branch could not be ruled out. For the remaining 158 clusters, determination of the specific archaeo-eukaryotic relationship was, generally, not feasible as there is no information on the root position in a tree of 3 clades. Therefore, trees where crenarchaea, euryarchaea and eukaryotes are monophyletic are bound to remain unresolved. However, there might be special cases where the eukaryotic clade would fall within one of the archaeal clades (Crenarchaeota or Euryarchaeota). Thus, the 144 CA-EA-E clusters (excluding 4 short alignments) were analyzed to identify such situations. For each of the data sets, two ML trees were constructed, namely, an unconstrained tree and a tree constrained for the monophyly of the three major groups (CA, EA, E). The two trees were compared using the AU test. If the constrained topology was rejected, this would indicate that one of the groups was paraphyletic with respect to another, allowing for the elucidation of the origin of the respective eukaryotic genes. All 144 trees passed the test for monophyly of each of the three groups, so the origin of the respective eukaryotic genes remains uncertain. Clearly, this result is compatible with the deep version of the archaeo-eukaryotic relationship. Discussion Ancient phylogenetic relationships are notoriously hard to decipher, and it is often argued, in some cases, with compelling demonstrations, that sequences of very distant orthologous genes, such as those from archaea and bacteria, do not carry sufficient phylogenetic signal for a meaningful tree reconstruction(penny et al. 2001; Rokas, Kruger, and Carroll 2005; Rokas and 15
16 Carroll 2006; Doolittle and Bapteste 2007). Genome-trees that strive to utilize combined information from multiple genes on the genome scale have the potential to overcome these limitations but they run into their own major difficulties, primarily, because the evolutionary histories of different genes differ, often, substantially, and not only can it be technically challenging to derive a consensus but the very legitimacy of such an exercise is dubious (Wolf et al. 2002; Bapteste et al. 2005; Snel, Huynen, and Dutilh 2005; McInerney, Cotton, and Pisani 2008). Furthermore, it has been argued that early, transitional stages in the evolution of major divisions of life might not be amenable to a description through the tree metaphor in principle(doolittle and Bapteste 2007; Koonin 2007; McInerney, Cotton, and Pisani 2008). However, all these formidable obstacles notwithstanding, the problems that are at stake when the deepest evolutionary relationships are examined are too fundamental to abandon attempts to extract the most of the modern phylogenetic approaches combined with comprehensive comparative-genomic data. The nature of the relationship between eukaryotes and archaea, arguably, is one of the most important and hardest problems in the reconstruction of the evolutionary history of life. Here we attempted to approach this problem by delineating the set of archaeo-eukaryotic orthologous genes as completely as possible and identifying the subset that is amenable to phylogenetic analysis aimed at resolution of the archaeo-eukaryotic relationships. At the first step, we identified ~1000 archaeo-eukaryotic orthologous genes sets of which ~350 were classified as being of probable archaeal origin. As expected from previous studies (Koonin et al. 1997; Rivera et al. 1998; Esser et al. 2004), this archaeal gene set was strongly enriched in genes for information-processing system components and encompassed substantial parts of the core machineries of translation, transcription, and replication, suggesting that this is a reasonable, although conservative approximation of the archaeal contribution to eukaryogenesis. Due to either poor representation of bacterial orthologs or poor tree resolution, we ended up with only 136 archaeal genes that carried enough phylogenetic information to weigh in on the specifics of the relationships of Eukaryota with Euryarcaheota and Crenarchaeota. Although this is a relatively small number, it seems unlikely that many more genes can be rescued for future phylogenetic analysis to approach this problem. Thus, detailed phylogenetic analysis of this gene set is likely to approximate the best shot on resolving the archaeo-eukaryotic relationship. 16
17 We addressed this problem by using, primarily, the constrained tree method, which is a procedure for directly comparing the likelihoods of competing phylogenetic scenarios, and buttressed this approach by analysis of putative shared derived characters. None of these approaches supported the origin of eukaryotic genes, en masse, from either Euryarchaeota or Crenarchaeota although evidence of origin from each of these major archaeal divisions was obtained for relatively small minorities of the genes, with some excess of the crenarchaeal affinity. The favored topology is one where eukaryotic genes derive from a distinct, ancient archaeal branch that lies outside the extant diversity of archaea (Fig. 5). The possibility of an LBA artifact could be a concern in the interpretation of these results. However, we found roughly the same number of crenarchaeal and euryarchaeal trees, and there was no systematic functional difference between genes that yielded the three subsets of trees, suggesting that LBA was not a major factor in the observed breakdown of trees. Furthermore, there was no significant difference in the evolutionary rates of the genes that showed the euryarchaeal, crenarchaeal, and deep topologies, an observation that, again, is poorly compatible with widespread LBA. In addition, shared derived characters that unite Euryarchaoeta and Crenarchaeota to the exclusion of eukaryotes comprise independent evidence in support of the notion that the archaeal genes of eukaryotes branch off the trunk of the archaeal tree prior to the radiation of Euryarchaoeta and Crenarcaheota.. Taken together, the results of the present analysis suggest that the archaeal genes in eukaryotes derive from an ancient, probably, extinct, and in any case, unknown archaeal lineage. There are relatively small subsets of archaeal genes for which either euryarchaeal or crenarchaeal origin appeared most likely (Figures 2b, 5). Under the hypothesis of deep archaeal roots of eukaryotic genes, these observations can be explained by HGT from Crenarchaeota and Euryarchaeota to the hypothetical eukaryotic ancestor, most likely, prior to the eukaryogenesis. However, these results are incompatible with those hypotheses that specifically derive the archaeal component of eukaryotes from one of the known branches of archaea, namely, the eocyte (crenarchaeal origin) hypothesis(lake et al. 1984; Lake 1988; Lake 1998), those versions of the hydrogen and syntrophic hypotheses that link eukaryotes to the known euryarchaeal methanogens(moreira and Lopez-Garcia 1998; Lopez-Garcia and Moreira 1999), or the syntrophic hypotheses that derive the archaeal host of the mitochondrion from Thermoplasmatales (Searcy, 17
18 Stein, and Green 1978; Margulis and Stolz 1984; Hixon and Searcy 1993; Margulis 1996; Margulis, Dolan, and Guerrero 2000; Pisani, Cotton, and McInerney 2007). The nature of the archaeo-eukaryotic relationship has implications for the scenario of eukaryotic origins. Had it been found that the archaeal genes in eukaryotes originated from within the extant archaeal diversity, the archezoan hypothesis would have been, effectively, falsified. The present finding that the majority of archaeal genes in eukaryotes appear to derive from a distinct, ancient archaeal (or archaea-related) lineage is compatible with both archaeal and archezoan origins of eukaryotes. These results do not, in themselves, lend support to the archezoan hypothesis because all genes analyzed here encode typical archaeal proteins, so there is no implication that the archaea-related parent of eukaryotes was not a bona fide archaeon. Furthermore, recent genomic and phylogenetic analyses of mesophilic Crenarchaeota and Korarchaeota indicate that, although these groups encompass typical archaea, they represent deep branches that join the archaeal tree either close to or above the point of radiation of Euryarchaeota and Crenarchaeota (Brochier-Armanet et al. 2008; Elkins et al. 2008). The choice between the deep archaeal and archezoan scenarios requires further exploration of the archaeal diversity and, perhaps, even more importantly, a thorough analysis of the origins of the proteins that comprise the signature eukaryotic cellular structures. Materials and Methods Clusters of orthologous genes The database of archaeal clusters of orthologous genes (arcogs) (Makarova et al. 2007) includes 41 archaeal genomes (13 Crenarchaeota, 27 Euryarchaeota and one Nanoarchaeon; see Table S2 in the Supplementary Material for the species names) and contains 7672 arcogs of which 3164 included proteins from at least 6 species and were used for the present analysis. Eukaryotic clusters of orthologous domains (KODs) represent a further development of the eukaryotic KOG database (Tatusov et al. 2003) and were constructed from 67 eukaryotic proteomes (Table S2). Orthologs from new genomes were added to the clusters of orthologs from 18
19 7 eukaryotes (Tatusov et al. 2003) using a modification of the COGNITOR method (Tatusov et al. 2000). New KODs, not represented in the KOG database, were created by manual analyses of species-specific BLAST hits. The current KOD database contains over 40,000 clusters of orthologous domains; this study was restricted to a subset of 5,377 ancient KODs, which were operationally (and liberally) defined as those that included at least one plant gene and at least one fungal or animal gene. Prokaryotic clusters of orthologs, representing 110 archaeal and bacterial genomes, were an extension of the 2003 version of the COG database (Tatusov et al. 2003). COGs used in this study represent the original 2003 COGs with new members added using the modified COGNITOR method (Tatusov et al. 2000). Relationships between gene clusters Multiple alignments of the protein sequences comprising the archaeal and eukaryotic clusters were constructed using MUSCLE (Edgar 2004) and used to construct PSSMs. The PSSMs were compared to custom databases consisting of individual sequences representing the target set of clusters using single-pass PSI-BLAST (Altschul et al. 1997) (see Supplementary Methods for details). Target clusters were ranked according to the mean score of member sequences. Specifically, the PSSMs for each of the 5377 eukaryotic KODs were run against the database of the archaeal sequences from the arcogs, and reciprocally, PSSMs for each of the 7672 arcogs were run against the database of the eukaryotic sequences from the KODs. A cluster pair was registered when the two clusters were, reciprocally, the top-ranked hits for each other. The archaeo-eukaryotic (A-E) clusters resulting from this step were linked to COGs. Both arcogs and KOGs have been previously assigned to COGs through a combination of automatic comparison and manual curation (Makarova et al. 2005; Makarova et al. 2007). When both members of an A-E pair were assigned to the same COG, an arcog-kod-cog triplet was formed. The archaeal and eukaryotic PSSMs from the remaining A-E pairs were compared to the database of COG sequences using single-pass PSI-BLAST. Results were examined manually and, when appropriate, a COG was linked to the A-E pair, adding to the list of arcog-kod-cog triplets. Selection of sequences and preparation of alignments for phylogenetic analysis 19
20 For the preliminary phylogenetic analysis, archaeal, eukaryotic, and bacterial sequences in each cluster of putative orthologs were clustered using BLASTCLUST with a 80%-identity threshold to avoid the appearance of nearly identical sequences in the tree, i.e., to eliminate redundancy. The sequences were aligned using MUSCLE (Edgar 2004). Poorly conserved positions, positions including greater than one-third gaps, and sequences covering less than 80% of the alignment length were removed from the alignment (see details in the Supplementary Methods). For the detailed phylogenetic analysis, for each of the groups, a branch with the best compromise between the number of members of the given group (the more the better) and the number of members of the other groups (the less the better) was identified. The representatives of Euryarchaeota, Crenarchaeota, Eukaryota, and Bacteria were selected from this branch with the aim to maximize diversity but avoid unusually long branches (see Supplementary Methods for the details of the algorithm); up to 10 representatives from each branch were chosen. Representative sequences were aligned using MUSCLE; weakly conserved positions and positions with gaps in more than one-third of the aligned sequences were removed. Phylogenetic analysis In the first round of phylogenetic analysis, ML trees were constructed using the PhyML software with the following parameters: number of relative substitution rate categories was 4; the proportion of invariable sites and alpha (gamma distribution parameter) were adjustable (estimated) (Guindon and Gascuel 2003). Eight PhyML runs were performed for each alignment, for 8 substitution models (Blosum62, Dayhoff, JTT, DCMut, RtREV, CpREV, VT, and WAG). The best tree was chosen by maximum log-likelihood of 8 trees (likelihood was used instead of AIC or BIC because all used models have the same number of parameters). For a majority of the clusters, WAG matrix was the best (69% from 672 alignments), the second matrix was Blosum62 (19%), the others RtREV (6%) and CpREV(6%), see Figure S4 in the Supplementary Materials. For detailed phylogenetic analysis, Maximum Likelihood trees were constructed using the TreeFinder program (Jobb, von Haeseler, and Strimmer 2004), with the estimated site rates heterogeneity and with the substitution model found best for a given alignment in the first-round analysis. Tree topologies were compared using the TreeFinder program according to either their expected likelihood weights (ELW (Strimmer and Rambaut 2002)) or by the Approximately Unbiased test (AU) p-value (Shimodaira 2002). Unconstrained maximum likelihood trees were 20
21 compared to three constrained topologies, which represented the "deep", "crenarchaeal" and "euryarchaeal" models of the origin of the eukaryotic genes. Availability of the data and results The list of the 980 identified A-E orthologous clusters, alignments of the respective protein sequences, and the resulting PhyML and ML trees are available at ftp://ftp.ncbi.nih.gov/pub/koonin/yutin. Acknowledgments This work was supported by the Intramural Research Program of the National Institutes of Health, National Library of Medicine. 21
22 References Altschul, S. F., T. L. Madden, A. A. Schaffer, J. Zhang, Z. Zhang, W. Miller, and D. J. Lipman Gapped BLAST and PSI-BLAST: a new generation of protein database search programs. Nucleic Acids Res 25: Anderson, F. E., and D. L. Swofford Should we be worried about long-branch attraction in real data sets? Investigations using metazoan 18S rdna. Mol Phylogenet Evol 33: Bapteste, E., E. Susko, J. Leigh, D. MacLeod, R. L. Charlebois, and W. F. Doolittle Do orthologous gene phylogenies really support tree-thinking? BMC Evol Biol 5:33. Brochier-Armanet, C., B. Boussau, S. Gribaldo, and P. Forterre Mesophilic Crenarchaeota: proposal for a third archaeal phylum, the Thaumarchaeota. Nat Rev Microbiol 6: Ciccarelli, F. D., T. Doerks, C. von Mering, C. J. Creevey, B. Snel, and P. Bork Toward automatic reconstruction of a highly resolved tree of life. Science 311: Dagan, T., and W. Martin Testing hypotheses without considering predictions. Bioessays 29: Doolittle, W. F., and E. Bapteste Pattern pluralism and the Tree of Life hypothesis. Proc Natl Acad Sci U S A 104: Edgar, R. C MUSCLE: multiple sequence alignment with high accuracy and high throughput. Nucleic Acids Res 32: Elkins, J. G., M. Podar, D. E. Graham, K. S. Makarova, Y. Wolf, L. Randau, B. P. Hedlund, C. Brochier, V. Kunin, I. Anderson, A. Lapidus, E. Goltsman, K. Berry, E. V. Koonin, P. Hugenholtz, N. Kyrpides, G. Wanner, P. Richardson, M. Keller, and K. O. Stetter A korarchaeal genome reveals new insights into the evolution of the Archaea. Proc. Natl. Acad. Sci. USA in press. Embley, T. M Multiple secondary origins of the anaerobic lifestyle in eukaryotes. Philos Trans R Soc Lond B Biol Sci 361: Embley, T. M., and W. Martin Eukaryotic evolution, changes and challenges. Nature 440: Esser, C., N. Ahmadinejad, C. Wiegand, C. Rotte, F. Sebastiani, G. Gelius-Dietrich, K. Henze, E. Kretschmann, E. Richly, D. Leister, D. Bryant, M. A. Steel, P. J. Lockhart, D. Penny, and W. Martin A genome phylogeny for mitochondria among alpha-proteobacteria and a predominantly eubacterial ancestry of yeast nuclear genes. Mol Biol Evol 21: Felsenstein, J Inferring Phylogenies. Sinauer Associates, Sunderland, MA. Fukami-Kobayashi, K., Y. Minezaki, Y. Tateno, and K. Nishikawa A tree of life based on protein domain organizations. Mol Biol Evol 24: Gogarten, J. P., W. F. Doolittle, and J. G. Lawrence Prokaryotic evolution in light of gene transfer. Mol Biol Evol 19: Gray, M. W The endosymbiont hypothesis revisited. Int Rev Cytol 141: Gray, M. W., G. Burger, and B. F. Lang The origin and early evolution of mitochondria. Genome Biol 2. Griffiths, E., and R. S. Gupta The use of signature sequences in different proteins to determine the relative branching order of bacterial divisions: evidence that Fibrobacter diverged at a similar time to Chlamydia and the Cytophaga-Flavobacterium-Bacteroides division. Microbiology 147: Guindon, S., and O. Gascuel A simple, fast, and accurate algorithm to estimate large phylogenies by maximum likelihood. Syst Biol 52:
23 Hartman, H., P. Favaretto, and T. F. Smith The archaeal origins of the eukaryotic translational system. Archaea 2:1-9. Hedges, S. B., H. Chen, S. Kumar, D. Y. Wang, A. S. Thompson, and H. Watanabe A genomic timescale for the origin of eukaryotes. BMC Evol Biol 1:4. Hixon, W. G., and D. G. Searcy Cytoskeleton in the archaebacterium Thermoplasma acidophilum? Viscosity increase in soluble extracts. Biosystems 29: Horiike, T., K. Hamada, D. Miyata, and T. Shinozawa The origin of eukaryotes is suggested as the symbiosis of pyrococcus into gamma-proteobacteria by phylogenetic tree based on gene content. J Mol Evol 59: Jobb, G., A. von Haeseler, and K. Strimmer TREEFINDER: a powerful graphical analysis environment for molecular phylogenetics. BMC Evol Biol 4:18. Karlin, S., L. Brocchieri, J. Mrazek, A. M. Campbell, and A. M. Spormann A chimeric prokaryotic ancestry of mitochondria and primitive eukaryotes. Proc Natl Acad Sci U S A 96: Koonin, E. V The Biological Big Bang model for the major transitions in evolution. Biol Direct 2:21. Koonin, E. V., A. R. Mushegian, M. Y. Galperin, and D. R. Walker Comparison of archaeal and bacterial genomes: computer analysis of protein sequences predicts novel functions and suggests a chimeric origin for the archaea. Mol Microbiol 25: Kurland, C. G., L. J. Collins, and D. Penny Genomics and the irreducible nature of eukaryote cells. Science 312: Lake, J. A Origin of the eukaryotic nucleus determined by rate-invariant analysis of rrna sequences. Nature 331: Lake, J. A Optimally recovering rate variation information from genomes and sequences: pattern filtering. Mol Biol Evol 15: Lake, J. A., E. Henderson, M. Oakes, and M. W. Clark Eocytes: a new ribosome structure indicates a kingdom with a close relationship to eukaryotes. Proc Natl Acad Sci U S A 81: Lake, J. A., and M. C. Rivera Was the nucleus the first endosymbiont? Proc Natl Acad Sci U S A 91: Leipe, D. D., L. Aravind, and E. V. Koonin Did DNA replication evolve twice independently? Nucleic Acids Res 27: Lopez-Garcia, P., and D. Moreira Selective forces for the origin of the eukaryotic nucleus. Bioessays 28: Lopez-Garcia, P., and D. Moreira Metabolic symbiosis at the origin of eukaryotes. Trends Biochem Sci 24: Makarova, K. S., A. V. Sorokin, P. S. Novichkov, Y. I. Wolf, and E. V. Koonin Clusters of orthologous genes for 41 archaeal genomes and implications for evolutionary genomics of archaea. Biol Direct 2:33. Makarova, K. S., Y. I. Wolf, S. L. Mekhedov, B. G. Mirkin, and E. V. Koonin Ancestral paralogs and pseudoparalogs and their role in the emergence of the eukaryotic cell. Nucleic Acids Res 33: Margulis, L Archaeal-eubacterial mergers in the origin of Eukarya: phylogenetic classification of life. Proc Natl Acad Sci U S A 93:
24 Margulis, L., M. F. Dolan, and R. Guerrero The chimeric eukaryote: origin of the nucleus from the karyomastigont in amitochondriate protists. Proc Natl Acad Sci U S A 97: Margulis, L., and J. F. Stolz Cell symbiosis theory: status and implications for the fossil record. Adv Space Res 4: Martin, W., and E. V. Koonin Introns and the origin of nucleus-cytosol compartmentation. Nature 440: Martin, W., and M. Muller The hydrogen hypothesis for the first eukaryote. Nature 392: McInerney, J. O., J. A. Cotton, and D. Pisani The prokaryotic tree of life: past, present...and future? Trends Ecol Evol 23: Moreira, D., and P. Lopez-Garcia Symbiosis between methanogenic archaea and deltaproteobacteria as the origin of eukaryotes: the syntrophic hypothesis. J Mol Evol 47: Penny, D., B. J. McComish, M. A. Charleston, and M. D. Hendy Mathematical elegance with biochemical realism: the covarion model of molecular evolution. J Mol Evol 53: Pereto, J., P. Lopez-Garcia, and D. Moreira Ancestral lipid biosynthesis and early membrane evolution. Trends Biochem Sci 29: Philippe, H., Y. Zhou, H. Brinkmann, N. Rodrigue, and F. Delsuc Heterotachy and longbranch attraction in phylogenetics. BMC Evol Biol 5:50. Pisani, D., J. A. Cotton, and J. O. McInerney Supertrees disentangle the chimerical origin of eukaryotic genomes. Mol Biol Evol 24: Pollock, D. D., D. J. Zwickl, J. A. McGuire, and D. M. Hillis Increased taxon sampling is advantageous for phylogenetic inference. Syst Biol 51: Poole, A., and D. Penny. 2007a. Eukaryote evolution: engulfed by speculation. Nature 447:913. Poole, A. M., and D. Penny. 2007b. Evaluating hypotheses for the origin of eukaryotes. Bioessays 29: Rivera, M. C., R. Jain, J. E. Moore, and J. A. Lake Genomic evidence for two functionally distinct gene classes. Proc Natl Acad Sci U S A 95: Rivera, M. C., and J. A. Lake The ring of life provides evidence for a genome fusion origin of eukaryotes. Nature 431: Rivera, M. C., and J. A. Lake Evidence that eukaryotes and eocyte prokaryotes are immediate relatives. Science 257: Rokas, A., and S. B. Carroll Bushes in the tree of life. PLoS Biol 4:e352. Rokas, A., D. Kruger, and S. B. Carroll Animal evolution and the molecular signature of radiations compressed in time. Science 310: Searcy, D. G., D. B. Stein, and G. R. Green Phylogenetic affinities between eukaryotic cells and a thermophilic mycoplasma. Biosystems 10: Shimodaira, H An approximately unbiased test of phylogenetic tree selection. Syst Biol 51: Snel, B., M. A. Huynen, and B. E. Dutilh Genome trees and the nature of genome evolution. Annu Rev Microbiol 59: Strimmer, K., and A. Rambaut Inferring confidence sets of possibly misspecified gene trees. Proc Biol Sci 269:
25 Tatusov, R. L., N. D. Fedorova, J. D. Jackson, A. R. Jacobs, B. Kiryutin, E. V. Koonin, D. M. Krylov, R. Mazumder, S. L. Mekhedov, A. N. Nikolskaya, B. S. Rao, S. Smirnov, A. V. Sverdlov, S. Vasudevan, Y. I. Wolf, J. J. Yin, and D. A. Natale The COG database: an updated version includes eukaryotes. BMC Bioinformatics 4:41. Tatusov, R. L., M. Y. Galperin, D. A. Natale, and E. V. Koonin The COG database: a tool for genome-scale analysis of protein functions and evolution. Nucleic Acids Res 28: Tatusov, R. L., E. V. Koonin, and D. J. Lipman A genomic perspective on protein families. Science 278: Tekaia, F., and E. Yeramian Genome trees from conservation profiles. PLoS Comput Biol 1:e75. van der Giezen, M., and J. Tovar Degenerate mitochondria. EMBO Rep 6: Vellai, T., K. Takacs, and G. Vida A new aspect to the origin and evolution of eukaryotes. J Mol Evol 46: Vishwanath, P., P. Favaretto, H. Hartman, S. C. Mohr, and T. F. Smith Ribosomal proteinsequence block structure suggests complex prokaryotic evolution with implications for the origin of eukaryotes. Mol Phylogenet Evol 33: Wolf, Y. I., I. B. Rogozin, N. V. Grishin, and E. V. Koonin Genome trees and the tree of life. Trends Genet 18: Zwickl, D. J., and D. M. Hillis Increased taxon sampling greatly reduces phylogenetic error. Syst Biol 51:
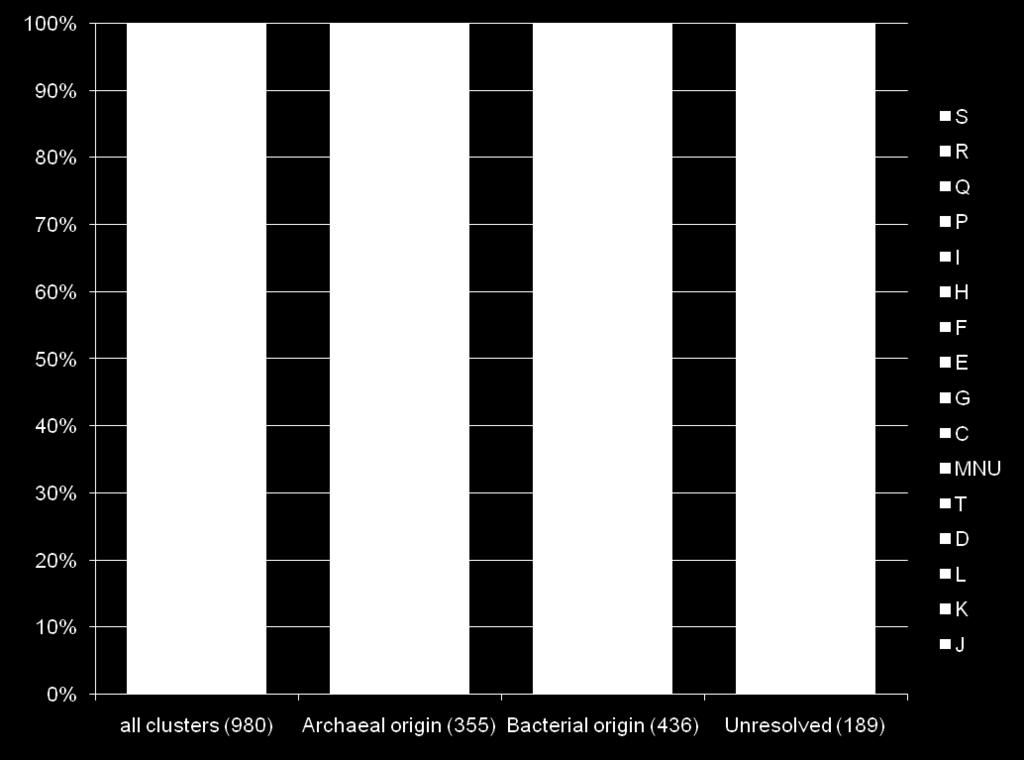
26 Figure Legends Figure 1. Phylogenetic classification of the archaeal-eukaryotic orthologs a. Flowchart of the procedure b. Breakdown of orthologous clusters by inferred origin A, archaea, B, bacteria, CA, Crenarchaeota, E, eukaryotes, EA, Euryarchaeota. For further details, see text. Figure 2 Functional classification of ancestral eukaryotic genes of different probable origins a. distribution of ancestral eukaryotic genes of different inferred origins by functional categories. The functional classes are as in the COG database: C, energy production and conversion, D, cell division, E, amino acid metabolism and transport, F, nucleotide metabolism and transport, G, carbohydrate metabolism and transport, H, coenzyme metabolism, I, lipid metabolism, J, translation, K, transcription, L, replication and repair, O, post-translational modification, protein turnover, chaperone functions, Q, secondary metabolism, T, signal transduction, U, intracellular trafficking and secretion, V, defense and resistance, R, general functional prediction only (typically, prediction of biochemical activity), S, function unknown. b. Fractions of arcogs belonging to different functional classes in the set of 1008 A-E pairs and in the set of 286 eukaryotic genes of inferred archaeal origin. 26
27 c. Log-odds ratio of the fraction of arcogs belonging to different functional classes relative to the fraction of arcogs that belong to the A-E set and the set of eukaryotic genes of inferred archaeal origin (1008/7538 and 286/7538, respectively). The log base is 2. Figure 3. The evolutionary relationship between archaea and eukaryotes assessed by phylogenetic analysis of 111 A-E-B clusters. The Expected Likelihood Weight (ELW) values are plotted on a simplex surface Figure 4. Distribution of the "deep", "crenarchaeal" and "euryarchaeal" topologies depending on the ELW value cut-off. Figure 5. A cartoon representation of the deep, crenarchaeal, and euryarchaeal inferred origins of the archaeal genes in eukaryotes. Figure S1. A PhyML phylogenetic tree of (predicted) deoxycytidine deaminases illustrating the case of an eukaryotic cluster that is closely associated with a bacterial-only COG, whereas the closest archaeal group clusters with another bacterial COG. The best matrix (Blosum62) was choosen from 8 PhyMl trees. The bootstrap support (1000 replications) for the branch separating the two orthologous clusters is shown. Figure S2. Shared derived characters (indels) in the eukaryotic families of inferred archaeal origin. Figure S3. Distribution of the median amino acid distances between bacterial and non-bacterial proteins for the eukaryotic genes that showed the deep, crenarchaeal and euryarchaeal tree topologies in the detailed phylogenetic analysis. Figure S4. Distribution of the best-performing amino acid substitution models across the 672 gene clusters. 27
28 [E-B] (173) arcog-kod-cog (919) A-[E-B] (202) arcog (7672) E (22) A-E-B (577) A-E-B (167) [CA-EA-E]-B (134) ML trees (136) arcog-kod (980) [A-E] (147) [A-E]-B (208) [CA-EA-E] (158) ML trees (144) KOD (5377) [E-B] (61) [CA-E]-X (21) [EA-E]-X (42) reciprocal PSI-BLAST, manual curation assignment to COGs analysis of COG membership preliminary phylogenetic analysis (ML trees/phyml) analysis of phyletic patterns detailed phylogenetic analysis (ML trees/treefinder) Yutin et al. Fig. 1a
29 980 A-E pairs 355 clusters of archaeal origin 136 ML trees at ELW threshold of 0.6 bacterial 436 unresolved 189 archaeal 355 CA, EA, no Bacteria 158 EA only 42 CA only 21 CA, EA, E, B 134 unresolved 76 EA 10 CA 18 deep 32 Yutin et al. Fig. 1b

30 Yutin et al. Fig. 2a
SUPPLEMENTARY INFORMATION
 Supplementary information S3 (box) Methods Methods Genome weighting The currently available collection of archaeal and bacterial genomes has a highly biased distribution of isolates across taxa. For example,
SUPPLEMENTARY INFORMATION
 Supplementary information S1 (box). Supplementary Methods description. Prokaryotic Genome Database Archaeal and bacterial genome sequences were downloaded from the NCBI FTP site (ftp://ftp.ncbi.nlm.nih.gov/genomes/all/)
Elements of Bioinformatics 14F01 TP5 -Phylogenetic analysis
 Elements of Bioinformatics 14F01 TP5 -Phylogenetic analysis 10 December 2012 - Corrections - Exercise 1 Non-vertebrate chordates generally possess 2 homologs, vertebrates 3 or more gene copies; a Drosophila
8/23/2014. Phylogeny and the Tree of Life
 Phylogeny and the Tree of Life Chapter 26 Objectives Explain the following characteristics of the Linnaean system of classification: a. binomial nomenclature b. hierarchical classification List the major
The Minimal-Gene-Set -Kapil PHY498BIO, HW 3
 The Minimal-Gene-Set -Kapil Rajaraman(rajaramn@uiuc.edu) PHY498BIO, HW 3 The number of genes in organisms varies from around 480 (for parasitic bacterium Mycoplasma genitalium) to the order of 100,000
This is a repository copy of Microbiology: Mind the gaps in cellular evolution.
 This is a repository copy of Microbiology: Mind the gaps in cellular evolution. White Rose Research Online URL for this paper: http://eprints.whiterose.ac.uk/114978/ Version: Accepted Version Article:
Microbial Taxonomy and the Evolution of Diversity
 19 Microbial Taxonomy and the Evolution of Diversity Copyright McGraw-Hill Global Education Holdings, LLC. Permission required for reproduction or display. 1 Taxonomy Introduction to Microbial Taxonomy
Chapter 26: Phylogeny and the Tree of Life Phylogenies Show Evolutionary Relationships
 Chapter 26: Phylogeny and the Tree of Life You Must Know The taxonomic categories and how they indicate relatedness. How systematics is used to develop phylogenetic trees. How to construct a phylogenetic
2 Genome evolution: gene fusion versus gene fission
 2 Genome evolution: gene fusion versus gene fission Berend Snel, Peer Bork and Martijn A. Huynen Trends in Genetics 16 (2000) 9-11 13 Chapter 2 Introduction With the advent of complete genome sequencing,
CHAPTERS 24-25: Evidence for Evolution and Phylogeny
 CHAPTERS 24-25: Evidence for Evolution and Phylogeny 1. For each of the following, indicate how it is used as evidence of evolution by natural selection or shown as an evolutionary trend: a. Paleontology
Phylogenetic relationship among S. castellii, S. cerevisiae and C. glabrata.
 Supplementary Note S2 Phylogenetic relationship among S. castellii, S. cerevisiae and C. glabrata. Phylogenetic trees reconstructed by a variety of methods from either single-copy orthologous loci (Class
Unsupervised Learning in Spectral Genome Analysis
 Unsupervised Learning in Spectral Genome Analysis Lutz Hamel 1, Neha Nahar 1, Maria S. Poptsova 2, Olga Zhaxybayeva 3, J. Peter Gogarten 2 1 Department of Computer Sciences and Statistics, University of
Computational approaches for functional genomics
 Computational approaches for functional genomics Kalin Vetsigian October 31, 2001 The rapidly increasing number of completely sequenced genomes have stimulated the development of new methods for finding
Classification and Phylogeny
 Classification and Phylogeny The diversity of life is great. To communicate about it, there must be a scheme for organization. There are many species that would be difficult to organize without a scheme
Phylogeny and systematics. Why are these disciplines important in evolutionary biology and how are they related to each other?
 Phylogeny and systematics Why are these disciplines important in evolutionary biology and how are they related to each other? Phylogeny and systematics Phylogeny: the evolutionary history of a species
Classification and Phylogeny
 Classification and Phylogeny The diversity it of life is great. To communicate about it, there must be a scheme for organization. There are many species that would be difficult to organize without a scheme
Phylogenetics. Applications of phylogenetics. Unrooted networks vs. rooted trees. Outline
 Phylogenetics Todd Vision iology 522 March 26, 2007 pplications of phylogenetics Studying organismal or biogeographic history Systematics ating events in the fossil record onservation biology Studying
Phylogenetic inference
 Phylogenetic inference Bas E. Dutilh Systems Biology: Bioinformatic Data Analysis Utrecht University, March 7 th 016 After this lecture, you can discuss (dis-) advantages of different information types
Molecular phylogeny How to infer phylogenetic trees using molecular sequences
 Molecular phylogeny How to infer phylogenetic trees using molecular sequences ore Samuelsson Nov 2009 Applications of phylogenetic methods Reconstruction of evolutionary history / Resolving taxonomy issues
Molecular phylogeny How to infer phylogenetic trees using molecular sequences
 Molecular phylogeny How to infer phylogenetic trees using molecular sequences ore Samuelsson Nov 200 Applications of phylogenetic methods Reconstruction of evolutionary history / Resolving taxonomy issues
1 Abstract. 2 Introduction. 3 Requirements. 4 Procedure
 1 Abstract None 2 Introduction The archaeal core set is used in testing the completeness of the archaeal draft genomes. The core set comprises of conserved single copy genes from 25 genomes. Coverage statistic
The minimal prokaryotic genome. The minimal prokaryotic genome. The minimal prokaryotic genome. The minimal prokaryotic genome
 Dr. Dirk Gevers 1,2 1 Laboratorium voor Microbiologie 2 Bioinformatics & Evolutionary Genomics The bacterial species in the genomic era CTACCATGAAAGACTTGTGAATCCAGGAAGAGAGACTGACTGGGCAACATGTTATTCAG GTACAAAAAGATTTGGACTGTAACTTAAAAATGATCAAATTATGTTTCCCATGCATCAGG
Archaeal ancestors of eukaryotes: not so elusive any more
 Koonin BMC Biology (2015) 13:84 DOI 10.1186/s12915-015-0194-5 OPINION Archaeal ancestors of eukaryotes: not so elusive any more Eugene V. Koonin Open Access Abstract The origin of eukaryotes is one of
Amira A. AL-Hosary PhD of infectious diseases Department of Animal Medicine (Infectious Diseases) Faculty of Veterinary Medicine Assiut
 Faculty of Veterinary Medicine Assiut") Amira A. AL-Hosary PhD of infectious diseases Department of Animal Medicine (Infectious Diseases) Faculty of Veterinary Medicine Assiut University-Egypt Phylogenetic analysis Phylogenetic Basics: Biological
Amira A. AL-Hosary PhD of infectious diseases Department of Animal Medicine (Infectious Diseases) Faculty of Veterinary Medicine Assiut University-Egypt Phylogenetic analysis Phylogenetic Basics: Biological
UoN, CAS, DBSC BIOL102 lecture notes by: Dr. Mustafa A. Mansi. The Phylogenetic Systematics (Phylogeny and Systematics)
") - Phylogeny? - Systematics? The Phylogenetic Systematics (Phylogeny and Systematics) - Phylogenetic systematics? Connection between phylogeny and classification. - Phylogenetic systematics informs the
- Phylogeny? - Systematics? The Phylogenetic Systematics (Phylogeny and Systematics) - Phylogenetic systematics? Connection between phylogeny and classification. - Phylogenetic systematics informs the
BINF6201/8201. Molecular phylogenetic methods
 BINF60/80 Molecular phylogenetic methods 0-7-06 Phylogenetics Ø According to the evolutionary theory, all life forms on this planet are related to one another by descent. Ø Traditionally, phylogenetics
Outline. Classification of Living Things
 Outline Classification of Living Things Chapter 20 Mader: Biology 8th Ed. Taxonomy Binomial System Species Identification Classification Categories Phylogenetic Trees Tracing Phylogeny Cladistic Systematics
BIOLOGICAL SCIENCE. Lecture Presentation by Cindy S. Malone, PhD, California State University Northridge. FIFTH EDITION Freeman Quillin Allison
 BIOLOGICAL SCIENCE FIFTH EDITION Freeman Quillin Allison 1 Lecture Presentation by Cindy S. Malone, PhD, California State University Northridge Roadmap 1 Key themes to structure your thinking about Biology
C3020 Molecular Evolution. Exercises #3: Phylogenetics
 C3020 Molecular Evolution Exercises #3: Phylogenetics Consider the following sequences for five taxa 1-5 and the known outgroup O, which has the ancestral states (note that sequence 3 has changed from
Biology 211 (2) Week 1 KEY!
 Week 1 KEY!") Biology 211 (2) Week 1 KEY Chapter 1 KEY FIGURES: 1.2, 1.3, 1.4, 1.5, 1.6, 1.7 VOCABULARY: Adaptation: a trait that increases the fitness Cells: a developed, system bound with a thin outer layer made of
Biology 211 (2) Week 1 KEY Chapter 1 KEY FIGURES: 1.2, 1.3, 1.4, 1.5, 1.6, 1.7 VOCABULARY: Adaptation: a trait that increases the fitness Cells: a developed, system bound with a thin outer layer made of
Dr. Amira A. AL-Hosary
 Phylogenetic analysis Amira A. AL-Hosary PhD of infectious diseases Department of Animal Medicine (Infectious Diseases) Faculty of Veterinary Medicine Assiut University-Egypt Phylogenetic Basics: Biological
InDel 3-5. InDel 8-9. InDel 3-5. InDel 8-9. InDel InDel 8-9
 Lecture 5 Alignment I. Introduction. For sequence data, the process of generating an alignment establishes positional homologies; that is, alignment provides the identification of homologous phylogenetic
Phylogenetic Analysis
 Phylogenetic Analysis Aristotle Through classification, one might discover the essence and purpose of species. Nelson & Platnick (1981) Systematics and Biogeography Carl Linnaeus Swedish botanist (1700s)
Computational methods for predicting protein-protein interactions
 Computational methods for predicting protein-protein interactions Tomi Peltola T-61.6070 Special course in bioinformatics I 3.4.2008 Outline Biological background Protein-protein interactions Computational
Biological Networks: Comparison, Conservation, and Evolution via Relative Description Length By: Tamir Tuller & Benny Chor
 Biological Networks:,, and via Relative Description Length By: Tamir Tuller & Benny Chor Presented by: Noga Grebla Content of the presentation Presenting the goals of the research Reviewing basic terms
Phylogenetic Analysis
 Phylogenetic Analysis Aristotle Through classification, one might discover the essence and purpose of species. Nelson & Platnick (1981) Systematics and Biogeography Carl Linnaeus Swedish botanist (1700s)
Phylogenetic Analysis
 Phylogenetic Analysis Aristotle Through classification, one might discover the essence and purpose of species. Nelson & Platnick (1981) Systematics and Biogeography Carl Linnaeus Swedish botanist (1700s)
Lecture 11 Friday, October 21, 2011
 Lecture 11 Friday, October 21, 2011 Phylogenetic tree (phylogeny) Darwin and classification: In the Origin, Darwin said that descent from a common ancestral species could explain why the Linnaean system
Chapter 19. Microbial Taxonomy
 Chapter 19 Microbial Taxonomy 12-17-2008 Taxonomy science of biological classification consists of three separate but interrelated parts classification arrangement of organisms into groups (taxa; s.,taxon)
Chapter 26 Phylogeny and the Tree of Life
 Chapter 26 Phylogeny and the Tree of Life Chapter focus Shifting from the process of how evolution works to the pattern evolution produces over time. Phylogeny Phylon = tribe, geny = genesis or origin
Molecular phylogeny - Using molecular sequences to infer evolutionary relationships. Tore Samuelsson Feb 2016
 Molecular phylogeny - Using molecular sequences to infer evolutionary relationships Tore Samuelsson Feb 2016 Molecular phylogeny is being used in the identification and characterization of new pathogens,
Evolution Problem Drill 09: The Tree of Life
 Evolution Problem Drill 09: The Tree of Life Question No. 1 of 10 Question 1. The age of the Earth is estimated to be about 4.0 to 4.5 billion years old. All of the following methods may be used to estimate
Inferring phylogeny. Constructing phylogenetic trees. Tõnu Margus. Bioinformatics MTAT
 Inferring phylogeny Constructing phylogenetic trees Tõnu Margus Contents What is phylogeny? How/why it is possible to infer it? Representing evolutionary relationships on trees What type questions questions
MiGA: The Microbial Genome Atlas
 December 12 th 2017 MiGA: The Microbial Genome Atlas Jim Cole Center for Microbial Ecology Dept. of Plant, Soil & Microbial Sciences Michigan State University East Lansing, Michigan U.S.A. Where I m From
Nature Genetics: doi: /ng Supplementary Figure 1. Icm/Dot secretion system region I in 41 Legionella species.
 Supplementary Figure 1 Icm/Dot secretion system region I in 41 Legionella species. Homologs of the effector-coding gene lega15 (orange) were found within Icm/Dot region I in 13 Legionella species. In four
Chapter 26 Phylogeny and the Tree of Life
 Chapter 26 Phylogeny and the Tree of Life Biologists estimate that there are about 5 to 100 million species of organisms living on Earth today. Evidence from morphological, biochemical, and gene sequence
Phylogeny & Systematics
 Phylogeny & Systematics Phylogeny & Systematics An unexpected family tree. What are the evolutionary relationships among a human, a mushroom, and a tulip? Molecular systematics has revealed that despite
Major questions of evolutionary genetics. Experimental tools of evolutionary genetics. Theoretical population genetics.
 Evolutionary Genetics (for Encyclopedia of Biodiversity) Sergey Gavrilets Departments of Ecology and Evolutionary Biology and Mathematics, University of Tennessee, Knoxville, TN 37996-6 USA Evolutionary
The indefinable term prokaryote and the polyphyletic origin of genes MASSIMO DI GIULIO
 HYPOTHESIS The indefinable term prokaryote and the polyphyletic origin of genes MASSIMO DI GIULIO Early Evolution of Life Laboratory, Institute of Biosciences and Bioresources, CNR, Via P. Castellino,
Effects of Gap Open and Gap Extension Penalties
 Brigham Young University BYU ScholarsArchive All Faculty Publications 200-10-01 Effects of Gap Open and Gap Extension Penalties Hyrum Carroll hyrumcarroll@gmail.com Mark J. Clement clement@cs.byu.edu See
Eukaryotes And Protozoa
 Eukaryotes And Protozoa 1. Phylogenomics, By Danielle Gadelle We have not rooted the trees of Fig. 5 since phylogenetic relationships between the three domains of life are still highly debated. Page 241
Supplementary Information
 Supplementary Information Supplementary Figure 1. Schematic pipeline for single-cell genome assembly, cleaning and annotation. a. The assembly process was optimized to account for multiple cells putatively
Phylogeny 9/8/2014. Evolutionary Relationships. Data Supporting Phylogeny. Chapter 26
 Phylogeny Chapter 26 Taxonomy Taxonomy: ordered division of organisms into categories based on a set of characteristics used to assess similarities and differences Carolus Linnaeus developed binomial nomenclature,
AP Biology Notes Outline Enduring Understanding 1.B. Big Idea 1: The process of evolution drives the diversity and unity of life.
 AP Biology Notes Outline Enduring Understanding 1.B Big Idea 1: The process of evolution drives the diversity and unity of life. Enduring Understanding 1.B: Organisms are linked by lines of descent from
POPULATION GENETICS Winter 2005 Lecture 17 Molecular phylogenetics
 POPULATION GENETICS Winter 2005 Lecture 17 Molecular phylogenetics - in deriving a phylogeny our goal is simply to reconstruct the historical relationships between a group of taxa. - before we review the
Interpreting the Molecular Tree of Life: What Happened in Early Evolution? Norm Pace MCD Biology University of Colorado-Boulder
 Interpreting the Molecular Tree of Life: What Happened in Early Evolution? Norm Pace MCD Biology University of Colorado-Boulder nrpace@colorado.edu Outline What is the Tree of Life? -- Historical Conceptually
ORIGIN OF CELLULARITY AND CELLULAR DIVERSITY
 ORIGIN OF CELLULARITY AND CELLULAR DIVERSITY Geological stratigraphy, together with radioactive dating, show the sequence of events in the history of the Earth. Note the entry for cyanobacteria and stromatolites
--Therefore, congruence among all postulated homologies provides a test of any single character in question [the central epistemological advance].
![--Therefore, congruence among all postulated homologies provides a test of any single character in question [the central epistemological advance].](/thumbs/86/93197257.jpg "--Therefore, congruence among all postulated homologies provides a test of any single character in question [the central epistemological advance].") Integrative Biology 200A "PRINCIPLES OF PHYLOGENETICS" Spring 2008 University of California, Berkeley B.D. Mishler Jan. 29, 2008. The Hennig Principle: Homology, Synapomorphy, Rooting issues The fundamental
Integrative Biology 200A "PRINCIPLES OF PHYLOGENETICS" Spring 2008 University of California, Berkeley B.D. Mishler Jan. 29, 2008. The Hennig Principle: Homology, Synapomorphy, Rooting issues The fundamental
The indefinable term prokaryote and the polyphyletic origin of genes
 Indian Academy of Sciences HYPOTHESIS The indefinable term prokaryote and the polyphyletic origin of genes MASSIMO DI GIULIO Early Evolution of Life Laboratory, Institute of Biosciences and Bioresources,
Phylogenetics: Building Phylogenetic Trees. COMP Fall 2010 Luay Nakhleh, Rice University
 Phylogenetics: Building Phylogenetic Trees COMP 571 - Fall 2010 Luay Nakhleh, Rice University Four Questions Need to be Answered What data should we use? Which method should we use? Which evolutionary
doi: / _25
 Boc, A., P. Legendre and V. Makarenkov. 2013. An efficient algorithm for the detection and classification of horizontal gene transfer events and identification of mosaic genes. Pp. 253-260 in: B. Lausen,
Rooting Major Cellular Radiations using Statistical Phylogenetics
 Rooting Major Cellular Radiations using Statistical Phylogenetics Svetlana Cherlin Thesis submitted for the degree of Doctor of Philosophy School of Mathematics & Statistics Institute for Cell & Molecular
CLASSIFICATION. Why Classify? 2/18/2013. History of Taxonomy Biodiversity: variety of organisms at all levels from populations to ecosystems.
 Why Classify? Classification has been around ever since people paid attention to organisms. CLASSIFICATION One primeval system was based on harmful and non-harmful organisms. Life is easier when we organize
Bio 1B Lecture Outline (please print and bring along) Fall, 2007
 Fall, 2007") Bio 1B Lecture Outline (please print and bring along) Fall, 2007 B.D. Mishler, Dept. of Integrative Biology 2-6810, bmishler@berkeley.edu Evolution lecture #5 -- Molecular genetics and molecular evolution
Bio 1B Lecture Outline (please print and bring along) Fall, 2007 B.D. Mishler, Dept. of Integrative Biology 2-6810, bmishler@berkeley.edu Evolution lecture #5 -- Molecular genetics and molecular evolution
Phylogenetics: Building Phylogenetic Trees
 1 Phylogenetics: Building Phylogenetic Trees COMP 571 Luay Nakhleh, Rice University 2 Four Questions Need to be Answered What data should we use? Which method should we use? Which evolutionary model should
Chapter 26: Phylogeny and the Tree of Life
 Chapter 26: Phylogeny and the Tree of Life 1. Key Concepts Pertaining to Phylogeny 2. Determining Phylogenies 3. Evolutionary History Revealed in Genomes 1. Key Concepts Pertaining to Phylogeny PHYLOGENY
Chapter 5. Proteomics and the analysis of protein sequence Ⅱ
 Proteomics Chapter 5. Proteomics and the analysis of protein sequence Ⅱ 1 Pairwise similarity searching (1) Figure 5.5: manual alignment One of the amino acids in the top sequence has no equivalent and
Bioinformatics tools for phylogeny and visualization. Yanbin Yin
 Bioinformatics tools for phylogeny and visualization Yanbin Yin 1 Homework assignment 5 1. Take the MAFFT alignment http://cys.bios.niu.edu/yyin/teach/pbb/purdue.cellwall.list.lignin.f a.aln as input and
METHODS FOR DETERMINING PHYLOGENY. In Chapter 11, we discovered that classifying organisms into groups was, and still is, a difficult task.
 Chapter 12 (Strikberger) Molecular Phylogenies and Evolution METHODS FOR DETERMINING PHYLOGENY In Chapter 11, we discovered that classifying organisms into groups was, and still is, a difficult task. Modern
Assessing an Unknown Evolutionary Process: Effect of Increasing Site- Specific Knowledge Through Taxon Addition
 Assessing an Unknown Evolutionary Process: Effect of Increasing Site- Specific Knowledge Through Taxon Addition David D. Pollock* and William J. Bruno* *Theoretical Biology and Biophysics, Los Alamos National
Microbial Taxonomy. Microbes usually have few distinguishing properties that relate them, so a hierarchical taxonomy mainly has not been possible.
 Microbial Taxonomy Traditional taxonomy or the classification through identification and nomenclature of microbes, both "prokaryote" and eukaryote, has been in a mess we were stuck with it for traditional
Microbiology Helmut Pospiech
 Microbiology http://researchmagazine.uga.edu/summer2002/bacteria.htm 05.04.2018 Helmut Pospiech The Species Concept in Microbiology No universally accepted concept of species for prokaryotes Current definition
I. Archaeal cell structure. (Chap 2 pg , Supplemental notes 3, 5)
") Thurs, Jan 23, 2003 I. Archaeal cell structure. (Chap 2 pg. 450-453, Supplemental notes 3, 5) The Archaea are a diverse group of prokaryotic organisms that are very different from bacteria and from eucaryotes.
Thurs, Jan 23, 2003 I. Archaeal cell structure. (Chap 2 pg. 450-453, Supplemental notes 3, 5) The Archaea are a diverse group of prokaryotic organisms that are very different from bacteria and from eucaryotes.
PHYLOGENY & THE TREE OF LIFE
 PHYLOGENY & THE TREE OF LIFE PREFACE In this powerpoint we learn how biologists distinguish and categorize the millions of species on earth. Early we looked at the process of evolution here we look at
Michael Yaffe Lecture #5 (((A,B)C)D) Database Searching & Molecular Phylogenetics A B C D B C D
C)D) Database Searching & Molecular Phylogenetics A B C D B C D") 7.91 Lecture #5 Database Searching & Molecular Phylogenetics Michael Yaffe B C D B C D (((,B)C)D) Outline Distance Matrix Methods Neighbor-Joining Method and Related Neighbor Methods Maximum Likelihood
7.91 Lecture #5 Database Searching & Molecular Phylogenetics Michael Yaffe B C D B C D (((,B)C)D) Outline Distance Matrix Methods Neighbor-Joining Method and Related Neighbor Methods Maximum Likelihood
Name: Class: Date: ID: A
 Class: _ Date: _ Ch 17 Practice test 1. A segment of DNA that stores genetic information is called a(n) a. amino acid. b. gene. c. protein. d. intron. 2. In which of the following processes does change
Chapter Chemical Uniqueness 1/23/2009. The Uses of Principles. Zoology: the Study of Animal Life. Fig. 1.1
 Fig. 1.1 Chapter 1 Life: Biological Principles and the Science of Zoology BIO 2402 General Zoology Copyright The McGraw Hill Companies, Inc. Permission required for reproduction or display. The Uses of
Comparative Bioinformatics Midterm II Fall 2004
 Comparative Bioinformatics Midterm II Fall 2004 Objective Answer, part I: For each of the following, select the single best answer or completion of the phrase. (3 points each) 1. Deinococcus radiodurans
Microbes usually have few distinguishing properties that relate them, so a hierarchical taxonomy mainly has not been possible.
 Microbial Taxonomy Traditional taxonomy or the classification through identification and nomenclature of microbes, both "prokaryote" and eukaryote, has been in a mess we were stuck with it for traditional
Microbial Taxonomy. Slowly evolving molecules (e.g., rrna) used for large-scale structure; "fast- clock" molecules for fine-structure.
 used for large-scale structure; fast- clock molecules for fine-structure.") Microbial Taxonomy Traditional taxonomy or the classification through identification and nomenclature of microbes, both "prokaryote" and eukaryote, has been in a mess we were stuck with it for traditional
Microbial Taxonomy Traditional taxonomy or the classification through identification and nomenclature of microbes, both "prokaryote" and eukaryote, has been in a mess we were stuck with it for traditional
Origins of Life. Fundamental Properties of Life. Conditions on Early Earth. Evolution of Cells. The Tree of Life
 The Tree of Life Chapter 26 Origins of Life The Earth formed as a hot mass of molten rock about 4.5 billion years ago (BYA) -As it cooled, chemically-rich oceans were formed from water condensation Life
Supplementary Materials for
 advances.sciencemag.org/cgi/content/full/1/8/e1500527/dc1 Supplementary Materials for A phylogenomic data-driven exploration of viral origins and evolution The PDF file includes: Arshan Nasir and Gustavo
A. Incorrect! In the binomial naming convention the Kingdom is not part of the name.
 Microbiology Problem Drill 08: Classification of Microorganisms No. 1 of 10 1. In the binomial system of naming which term is always written in lowercase? (A) Kingdom (B) Domain (C) Genus (D) Specific
BL1102 Essay. The Cells Behind The Cells
 BL1102 Essay The Cells Behind The Cells Matriculation Number: 120019783 19 April 2013 1 The Cells Behind The Cells For the first 3,000 million years on the early planet, bacteria were largely dominant.
Introduction to Evolutionary Concepts
 Introduction to Evolutionary Concepts and VMD/MultiSeq - Part I Zaida (Zan) Luthey-Schulten Dept. Chemistry, Beckman Institute, Biophysics, Institute of Genomics Biology, & Physics NIH Workshop 2009 VMD/MultiSeq
Classification, Phylogeny yand Evolutionary History
 Classification, Phylogeny yand Evolutionary History The diversity of life is great. To communicate about it, there must be a scheme for organization. There are many species that would be difficult to organize
Chapter 27: Evolutionary Genetics
 Chapter 27: Evolutionary Genetics Student Learning Objectives Upon completion of this chapter you should be able to: 1. Understand what the term species means to biology. 2. Recognize the various patterns
Bootstrapping and Tree reliability. Biol4230 Tues, March 13, 2018 Bill Pearson Pinn 6-057
 Bootstrapping and Tree reliability Biol4230 Tues, March 13, 2018 Bill Pearson wrp@virginia.edu 4-2818 Pinn 6-057 Rooting trees (outgroups) Bootstrapping given a set of sequences sample positions randomly,
Algorithms in Bioinformatics FOUR Pairwise Sequence Alignment. Pairwise Sequence Alignment. Convention: DNA Sequences 5. Sequence Alignment
 Algorithms in Bioinformatics FOUR Sami Khuri Department of Computer Science San José State University Pairwise Sequence Alignment Homology Similarity Global string alignment Local string alignment Dot
Eukaryotic Cells. Figure 1: A mitochondrion
 Eukaryotic Cells Figure 1: A mitochondrion How do cells accomplish all their functions in such a tiny, crowded package? Eukaryotic cells those that make up cattails and apple trees, mushrooms and dust
Chapters 25 and 26. Searching for Homology. Phylogeny
 Chapters 25 and 26 The Origin of Life as we know it. Phylogeny traces evolutionary history of taxa Systematics- analyzes relationships (modern and past) of organisms Figure 25.1 A gallery of fossils The
PLEASE SCROLL DOWN FOR ARTICLE
 This article was downloaded by: [Smithsonian Trpcl Res Inst] On: 16 January 2009 Access details: Access Details: [subscription number 790740191] Publisher Taylor & Francis Informa Ltd Registered in England
Microbial Diversity and Assessment (II) Spring, 2007 Guangyi Wang, Ph.D. POST103B
 Spring, 2007 Guangyi Wang, Ph.D. POST103B") Microbial Diversity and Assessment (II) Spring, 007 Guangyi Wang, Ph.D. POST03B guangyi@hawaii.edu http://www.soest.hawaii.edu/marinefungi/ocn403webpage.htm General introduction and overview Taxonomy [Greek
Microbial Diversity and Assessment (II) Spring, 007 Guangyi Wang, Ph.D. POST03B guangyi@hawaii.edu http://www.soest.hawaii.edu/marinefungi/ocn403webpage.htm General introduction and overview Taxonomy [Greek
Comparative Genomics II
 Comparative Genomics II Advances in Bioinformatics and Genomics GEN 240B Jason Stajich May 19 Comparative Genomics II Slide 1/31 Outline Introduction Gene Families Pairwise Methods Phylogenetic Methods
A Phylogenetic Network Construction due to Constrained Recombination
 A Phylogenetic Network Construction due to Constrained Recombination Mohd. Abdul Hai Zahid Research Scholar Research Supervisors: Dr. R.C. Joshi Dr. Ankush Mittal Department of Electronics and Computer
Anatomy of a tree. clade is group of organisms with a shared ancestor. a monophyletic group shares a single common ancestor = tapirs-rhinos-horses
 Anatomy of a tree outgroup: an early branching relative of the interest groups sister taxa: taxa derived from the same recent ancestor polytomy: >2 taxa emerge from a node Anatomy of a tree clade is group
Horizontal transfer and pathogenicity
 Horizontal transfer and pathogenicity Victoria Moiseeva Genomics, Master on Advanced Genetics UAB, Barcelona, 2014 INDEX Horizontal Transfer Horizontal gene transfer mechanisms Detection methods of HGT
Fig. 26.7a. Biodiversity. 1. Course Outline Outcomes Instructors Text Grading. 2. Course Syllabus. Fig. 26.7b Table
 Fig. 26.7a Biodiversity 1. Course Outline Outcomes Instructors Text Grading 2. Course Syllabus Fig. 26.7b Table 26.2-1 1 Table 26.2-2 Outline: Systematics and the Phylogenetic Revolution I. Naming and
PHYLOGENY AND SYSTEMATICS
 AP BIOLOGY EVOLUTION/HEREDITY UNIT Unit 1 Part 11 Chapter 26 Activity #15 NAME DATE PERIOD PHYLOGENY AND SYSTEMATICS PHYLOGENY Evolutionary history of species or group of related species SYSTEMATICS Study
Non-independence in Statistical Tests for Discrete Cross-species Data
 J. theor. Biol. (1997) 188, 507514 Non-independence in Statistical Tests for Discrete Cross-species Data ALAN GRAFEN* AND MARK RIDLEY * St. John s College, Oxford OX1 3JP, and the Department of Zoology,