Université Pierre et Marie Curie
|
|
|
- Hilary Lee
- 6 years ago
- Views:
Transcription

1 !! Université Pierre et Marie Curie Ecole doctorale Sciences de la Nature et de l Homme, Ecologie et Evolution Equipe Adaptation et Biologie des Invertébrés en Conditions Extrêmes (ABICE) Laboratoire Adaptation et Diversité en Milieu Marin UMR7144 Transcriptomic approach of the response to metals in the hydrothermal mussel Bathymodiolus azoricus Par FUENZALIDA Gonzalo Thèse de doctorat de Biologie Dirigée par Arnaud Tanguy et François Lallier Présentée et soutenue publiquement le 2 décembre 2016 Devant un jury composé de : Pr. DANGER Jean-Michel, Université du Havre, Rapporteur. Pr. SERGENT Odile, Université Rennes I, Rapporteur. Dr. PAIN DEVIN Sandrine, Université de Lorraine, Examinateur. Dr. GAGNAIRE Beatrice, Centre de Cadarache, Examinateur. Pr. CORMIER Patrick, UPMC, Examinateur. Dr. TANGUY Arnaud, UPMC, Directeur de Thèse.
2
3 Para mi hija y esposa, por todo el tiempo invertido en esto y no al estar con ustedes.
4 Acknowledgement First I want to thank Arnaud for the confidence that he put on me for the development of this work and for all the tips that he gave me in the laboratory which allowed for a better and fast laboratory experience which I appreciate, and also his help to solve my car problems a very complete PhD supervisor. Also thanks to François for all the corrections made in posters, papers, presentations and of course in this manuscript and specially thanks for helping me in the last months with the administrative things with CNRS. Second thanks to all the members of the ABICE team: Ann, Dominique, Anne Sophie, Camille, Kevin, Perrine, Bérénice, Stéphane, Didier, Jean, Jean-Yves and Alexis for the good reception and disposal to help me, making the lab a pleasant place to work. Also I say thank you to Leyla Cardenas, who trained me as a marine biologist teaching me how to work as a scientist and also helped me to come to Roscoff to begin my PhD work. Thanks also to all the french and not French people that I met in party s or playing football Remy, Kevin, Marie, Pierre, Raphael and Vanessa, Angelique, Hugo, Jaromir, Zujaila, Adriana, Cristina, Andres, Ainoa, Pinocho, Javier, Fuli, Yuna, Wanek, Misharl and all the people that I met at the Station Biologique (technician and students) in different courses and formations with which I share more than one beer. Also thanks to the members of the AJC for the organization of formation in Roscoff required by the doctoral school. To my parents, brother, cousins, nephews, uncles, aunts and Chilean friends who have always been supporting me in all my decisions (even when they have not been very good), I hope I can give back all that have helped me. Thanks also to my Chilean friend Jano and Katy for all the good moments that we share and for joining us before and after the firsts moths of my daughter birth, I hope this friendship will continue over time. Finally, thanks to my wife, which has been an important pillar in the last year and in my training as a father, a function which I will be able to devote more time.
5 Table of contents CHAPTER I 3 INTRODUCTION 1. BIOMARKERS 5 2. ECOTOXICOLOGY IN AQUATIC ECOSYSTEMS 7 3. ECOTOXICOLOGY AND METALS IN AQUATIC SYSTEMS RESPONSE TO HEAVY METALS IN MARINE INVERTEBRATES OMICS ERA IN POLLUTION RESPONSE HYDROTHERMAL ECOSYSTEMS AS NATURAL LABORATORY FOR HEAVY METAL ADAPTATION OBJECTIVES 37 CHAPTER II 39 METAL ACCUMULATION AND REGULATION OF METAL RELATED GENE EXPRESSION IN THE HYDROTHERMAL VENT MUSSEL BATHYMODIOLUS AZORICUS AS A SIGNATURE OF ENVIRONMENTAL CONTAMINATION CHAPTER III 93 DIFFERENTIAL EXPRESSION OF SUPEROXIDE DISMUTASE ISOFORMS AS INDICATOR OF OXIDATIVE STRESS IN RESPONSE TO METALS IN THE HYDROTHERMAL MUSSEL BATHYMODIOLUS AZORICUS: APPLICATION TO FIELD AND EXPERIMENTAL POPULATIONS. CHAPTER IV 141 IDENTIFICATION AND REGULATION OF FERRITINS IN THE HYDROTHERMAL VENT MUSSEL BATHYMODIOLUS AZORICUS IN NATURAL AND EXPERIMENTAL POPULATIONS CHAPTER V 171 LARGE SCALE TRANSCRIPTOMIC ANALYSIS OF BATHYMODIOLUS AZORICUS DISCUSSION, CONCLUSION, PERSPECTIVES 245 BIBLIOGRAPHY 251 ABSTRACT BACK COVER 1
6
7 Chapter I Introduction In 1962, the marine biologist and conservationist Rachel Carson published her book "A Silent Spring" in which she warned harmful effects of pesticides (DDT) in the environment mainly in birds and humans, establishing a relationship between toxicology and environment. In 1969, René Truhaut introduced the term "ecotoxicology" as the combination of two very different subjects: ecology (defined as the scientific study of interactions that determine the distribution and abundance of organisms" Krebs 1985) and toxicology (defined as the study of injurious effects of substances on living organisms). If the limit of the toxicological studies is the organisms, ecotoxicology aims to assess the impact of chemicals on a larger scale considering different levels of organization from cell to ecosystems (Truhaut, 1977). At the beginning, the study of environmental toxicology was limited to the detection of toxic residues in the environment or in individual organisms and the use of tests to estimate the toxic effects of chemicals on animals other than human. One main limitation of these approaches was the impossibility to extrapolate those experimental results obtained at an individual level to the understanding of a more complex, multivariate environment. At that point, ecotoxicology was developed in the aim to measure/quantify and predict the impact of pollutants on populations, communities and whole ecosystems rather than on individuals. The exact scope and definition of ecotoxicology still remains on debate. In 1994, Forbes and Forbes defined ecotoxicology as the field of study which integrates the ecological and toxicological effects of chemical pollutants on populations, communities and ecosystems with the fate (transport, transformation and breakdown) of such pollutants in the environment. They also identified three main objectives for ecotoxicology: 1) obtaining data for risk assessment and environmental management, 2) meeting the legal requirements for the development and release of new chemicals into the environment and 3) developing empirical or theoretical principles to improve knowledge of the behavior and effects of chemicals in living systems. To fill these objectives, different steps have to be considered like the identification of the entry, distribution and fate of pollutants within the environment, in living (biota) organisms within an ecosystem and the harmful effects of the chemical pollutants on the constituents (biotic & abiotic) of ecosystems. However, ecotoxicology is different from stress ecology which considers a broader range of natural stressors such as oxygen depletion or the effects of temperature, populations and communities that directly impact on toxicity. 3
8 There is further separation between environmental toxicology and ecotoxicology, with a tendency of ecotoxicology to focus on the level of communities and ecosystems and environmental toxicology being more focused on the level of individual organisms or cells. Ecotoxicology aims to understand the mechanisms/mode of action by which environmental contaminants modify normal biological performance in order to develop appropriate measures to prevent adverse outcomes. There are numerous contaminant effects that can compromise the ecological fitness of individuals or populations and the impact of a toxic contaminant or complex contaminant mixture depends on the relative sensitivity of a species, community or ecosystem, but also the intensity and timing of exposure. Ecotoxicology faces the challenge of predicting and assessing the effects of an increasing number of chemical stressors on aquatic species and ecosystems. With increasing ecological relevance the reproducibility, specificity and thus suitability for standardization of methods tends to diminish. A more simple definition has been proposed by Walker et al., (1996) defining ecotoxicology as "the study of the harmful effects of chemicals upon ecosystems". There are 6 main types of toxicants that are studied in a variety of species including carcinogens that cause cancer, mutagens that cause mutations in DNA, teratogens that cause birth defects, allergens that cause unnecessary immune response, neurotoxins that damage nervous system and endocrine disruptors that interfere with hormones. More, toxicity is affected by many parameters such as the sensitivity to toxicant that vary with sex, age and weight. Exposure to toxicant is defined either as acute (high exposure in short period of time) or chronic (low concentration of toxicants with a long period of time of exposure). In both cases, results of both type of exposure are used in some form of weight of evidence assessment, but without clear guidance as to how to interpret deferential responses and intensities of response. One of the main objectives of ecotoxicology is the monitoring of environmental pollution, which includes the development of bioassays or single-species tests to obtain a fast and easy access to tools of evaluation of chemicals toxicity and/or effects in both terrestrial and marine ecosystems. However, study of ecotoxicological parameters using only singlespecies, single toxic and laboratory tests do not represent the complexity of ecosystems and the diversity of responses, so it remains fundamental to understand how populations respond to these environmental changes in their natural habitats. Field studies showed that the ecosystem health mainly depends on three factors: differences in the fate and transport of the toxic substance, the complexity of systems and individual responses of organisms (Burger, 1997). 4
9 Pollutant Biochemical changes Physiological changes Whole organism responses Response time Importance Difficulty of linkage to specific chemicals Population changes Community composition Ecosystems Figure 1: Flow chart for effect of pollutants on ecosystems 1. Biomarkers During the Nato workshop in 1993, the term biomarker was defined as a biological response that can be related to an exposure to, or toxic effect of, an environmental chemical or chemicals. In the same time, Depledge (1994) defined the term biomarker as a biochemical, cellular, physiological or behavioural variation that can be measured in tissue or body fluid samples at the level of the whole organism (either individuals or populations) that provides evidence of exposure (exposure biomarkers) to and/or effects (health biomarkers) of one or more chemical pollutants. Depledge also gives some indications such as: * an ideal health biomarker is sensitive to chemical stress and is irrefutably linked to the Darwinian fitness of the organism * Darwinian fitness is the combined relative probability of survival and rate of reproduction of the individual 5
10 * an ideal exposure biomarker is both sensitive and specific to exposure by a single chemical or group of chemicals * The ideal biomarker in ecotoxicology combines the properties of both types Several definitions have been given to define what a biomarker is. Newman and McIntosh (1991) defines the term biomarkers as a cellular, tissue, body fluid, physiological or biochemical change in extant individuals that is used quantitatively during biomonitoring to either imply the presence of significant pollutant or as an early warming system of imminent effect. Walker et al (1996) defined biomarkers as a change in biological response, ranging from molecular through cellular and physiological responses to behavioral changes, which can be related to exposure to or toxic effects of environmental chemicals. The National Academy of Sciences defines a biomarker or biological marker as a xenobiotically induced alteration in cellular or biochemical components or processes, structures, or functions that is measurable in a biological system or sample (ENTOX/TIWET, 1996). Silbergeld et al (1994) defines biological markers as physiological signals that reflect exposure, early cellular response or inherent or acquired susceptibilities, which provide a new strategy for resolving some toxicological problems. Sensu stricto, we define a biomarker as a biological response to a chemical or a group of chemical agents (Walker et al., 1996) but not the presence of the agent or its metabolites within the body (internal dose). However, there is no doubt that the measurement of a xenobiotic in a biological system or sample is a bioindicator of exposure, and thus, it could be considered like a biomarker. The biomarkers have been classified into three main categories based on the effect in the organisms (Silins and Högberg, 2011). Biomarkers of exposure: these biomarkers measure the internal dose of the toxic compound or metabolite (or any product of the interaction between xenobiotic agent and a target molecule) in one, several body parts compartments of an organism or in the whole body. Bernard and Lauwerys (1986) classified the biomarkers of exposure into two main subgroups according to their selectivity test, which is based on the direct measurement of the unchanged chemicals or their metabolites in biological media. The non-selective tests are used as non-specific indicators of exposure to a group of chemicals. One example is the concentration of 1-hydroxypyrene in the urine of organisms exposed to polycyclic aromatic hydrocarbons (PAHs). PAH are a group of highly carcinogenic elements where the Benzo(a)pyrene is the most studied as a biomarker of pollution, however it is not the only one, has even been reported that other elements are much more carcinogenic, reason by why 6
11 many studies preferred report the excretion levels of 1-hydroxypyrene as a biomarker of PAH exposure (Silins and Högberg, 2011). Biomarkers of susceptibility: they are indicators of a particular sensitivity of individuals to the effect of a xenobiotic or to the effects of a group of such compounds. They correspond to indicator of inherited or acquired trait from an organism in response to exposure substance. Genetic markers are included in this group such as the polymorphisms of specific genes associated with the metabolism of toxic material in the body (Norppa, 2004), alteration in chromosomal structure. Biomarkers of effect: these biomarkers assess the biochemical, physiological or behavioral disturbance produced in an organism exposed to any toxic substance that can be associated with disease or death. Some examples are the biomarkers of cytotoxicity (Lieggi et al., 2010), levels of necrotic cells (Ward et al., 2008) or unbalance antibody levels (Whitehead and Crawford, 2006) well described in human diseases. The ideal biomarkers of effect should be early detected and be able to show adverse effects before they become irreversible. They represent the most studied biomarkers in the literature and they include different classes of parameters of blood composition, alterations of specific enzyme activities, DNA-adducts appearance, mrna expression and protein concentrations variations. One of the most emblematic example is the formation of DNA adduct as a consequence of exposure to xenobiotics. 2. Ecotoxicology in aquatic ecosystems The number of ecotoxicological studies conducted in aquatic ecosystems showed a important growth during the last twenty years principally due to the increasing pollution as a result of an indiscriminate dumping of industrial, urban and agricultural sources into natural aquatic ecosystems. The main contaminants that can be detected in aquatic ecosystems include poly aromatic hydrocarbons (HAPs), pharmaceutical substances, radionuclides and toxic metals. Once contaminants are incorporated into the ecosystem, they can be stored in the sediment, increasing their persistence, be directly incorporated into the organisms and immediately exert their toxic effect like disease, suppression of immune systems, oxidative stress, mutation on DNA or can be bio-accumulated in different tissues and consequently in the food chain. 7
12 2.1 Microorganisms The ability of microorganisms to adapt quickly to environmental changes is one of the main characteristics which has allowed them to colonize different types of ecosystems around the world. Bacteria especially have been associated with a wide variety of functions like antibiotic production, anti-biofilm activity, biodegradation of organic matter and are an important component in the biogeochemical cycle of different elements like carbon and nitrogen. Another characteristic is that they developed a metabolic potential to transform or mineralize organic contaminant into less harmful substance cleaning the contaminated environment, which has allowed the development of bioremediation technology (Dash and Mangwani, 2013). Petroleum and plastic are one of the major pollutants of anthropogenic origin which are found in large amounts in aquatic ecosystems and some bacteria are able to degrade these pollutants. They can be degraded by oil-eating microbes from different genera that use petroleum as a carbon and energy source (Sakalle and Rajkumar, 2010). Polyethylene, polystyrene and polyvinyl chloride are the main plastics reported in aquatic environments in the last decades and some studies of exposure to plastic in laboratory condition demonstrated the ability of specific bacteria isolated in deep sea ecosystems to degrade those plastics in non toxic forms (Sekiguchi et al, 2010). The biodegradation of Polyaromatic hydrocarbons (PAHs) is also carry out by aerobic and anaerobic bacteria in which the metabolic intermediates in respiratory process like NADPH + or oxidoreductases enzyme activity play a important role (Cerniglia, 1992). High levels of metal bioaccumulation in bacteria has also been reported, like in the bioluminescent bacteria Vibrio harveyi that shows a high concentration of cadmium with measured values near to 23.3 mg/g dry cell (Abd-elnaby et al., 2011). A similar tolerance has been reported in other bacteria (Enterobacter cloaceae) associated with chelation capacity in different metal as cadmium and copper, removing them from the contaminated environment by the secretion of exo-polysacacharides (Iyer et al., 2005). The molecular microbiology and genetics have been developed in the last years, which has led to the development of genetically modified microorganisms for the biodegradation of xenobiotic substances, mainly based on the introduction of vectors, which contain specific gene sequences associated to toxic tolerance that are then transformed in the marine bacteria (Dash and Mangwani, 2013) but its applicability has not been tested in field studies. 8
13 2.2 Fishes Fish also have been described as a good model for study in ecotoxicology mainly because they are primary predators in the food chain in aquatic ecosystems and also because many species are commercially exploited for human consumption. Some of the principal commonly species used are zebrafish (Danio rerio), rainbow trout (Oncorhynchus mykiss), tilapia (Oreochromis sp.), three-spined stickleback (Gasterosteus aculeatus), guppy (Poecilia reticulata), killfish (Fundulus heteroclitus). The available information on these species concern different aspects of their biology including behavior and evolutionary history, geographic distribution, genomic, transcriptomic and proteomic data, cell lines and mutants and cultivation. Dispersal is one of its main features of fishes as a response to pollution. However when there are barriers to dispersion, fishes have developed a phenotypic plasticity or evolutionary adaptations to respond to any stressor agent. Numerous studies have been conducted to better understand the molecular mechanisms involved in the response of fishes to different environmental conditions like salinity, hypoxia and temperature. Specific adaptations has been evidenced like the activation of Na +, K + ATPase, shift toward anaerobic metabolism via glycolysis during O2 tension which has is characterized by elevated concentrations of lactate in blood, differential levels of transcription in lactate dehydrogenase (LDH) related to differences in the sequence of promoter region of this gene in populations exposed to different temperature gradient (Cochran and Burnett, 1996; Evans, 2008; Schulte et al., 2000). Fishes can also tolerate high levels of toxic xenobiotic, metals and PAHs with an accumulation principally reported in gill, liver, muscle, kidney, blood. Among the mechanisms of response associated to the exposure of those compounds, case of the activation of the cytochrome P4501A1 (CYP1A1), glutathione S-transferases (GST), superoxide dismutase (SOD), metallothionein (MT), transcription factors (Nrf2) which is involved in the control of a variety of antioxidant defenses, have been reported (Giulio et al., 2015). Pollution in Antarctic area was also examined recently in notothenioids fishes which are well distributed genera in high latitudes and important species in trophic chain. The results obtained suggest different metabolic response between two species (Notothenia rossii and Notothenia coriiceps) exposed to the same toxic, principally evidenced by variations in glucose levels, differential concentrations of glycogen phosphorylase (GPase) and glucose-6-9
14 phosphatase (G6Pase) enzymes and activities of the enzymatic antioxidant defense (Rodrigues et al., 2015). 2.3 Invertebrates The invertebrates represent a great majority of the macrospecies living from estuaries to deep sea. In the intertidal environmental, it is possible to find a large diversity of invertebrates from different taxa (crustaceans, mollusks, porifera, annelidas) which are exposed to large changes in environmental parameters that also vary in predictability and intensity, given valuable models system to understand the diversity of adaptive mechanisms developed by these organisms to deal with these fluctuating environments. Bivalves are among the best studied models because they present several characteristic allowing their use in ecotoxicological studies: a diversity of species (mussels, oysters, clams, ), a worldwide distribution, a commercial importance, an easy use in laboratory experiment, and a presence in many contrasted environments. 3. Ecotoxicology and metals in aquatic systems Ecotoxicology of trace metal in aquatic systems correspond to raise the question «how does toxic and non-toxic metal vary over space and time in and between aquatic habitats and show how they affect living organisms? The term trace metal is used to characterize metals that are present at low (trace) concentrations (sometimes defined as 0.01% dry weight) in the environment, in both physical and biotic components. However, some of those metals are detected at high concentration in organisms. Heavy metals term is mainly used for metals that are above a threshold atomic weight, typically incorporating all transition metals of the periodic table. Other chemical characteristics are also considered such as the similar chemical characteristics that make them biologically relevant. These metals become toxic to biota when present in high bioavailability but many are essential to the metabolism of life, consistently across the eukaryotes with sometimes an excellent but not perfect agreement between eukaryotes and prokaryotes. Numerous biochemical pathways underlying life processes are conserved in all organisms and require the same elements to function. Based on another criteria, the term trace metal is restricted to essential metals with essential metabolic function then excluding the non-essential metals that have no metabolic function. 10
15 For the chemists, a strict definition has been proposed to characterize the term trace metal. Nieboer and Richardson (1980) proposed a chemical classification system based on the Lewis acid properties of metal ions. Metals are separated into Class A, Class B or Borderline according to their degree of hardness or softness as acids and bases. Class A metal ions are Lewis hard acids, readily form cations, and have a ligand affinity order O > N > S. Class B metal ions are Lewis soft acids, more covalent and have an affinity order S > N > O. Borderline metal ions present intermediate properties. Metals with Class B or Borderline ions also fit into the category of trace metals. For the non-chemists, the affinity of trace metals for sulphur and nitrogen promotes their binding to molecules in cells especially proteins, and makes some of them essential and all of them toxic link to their ability to bind in the wrong place at the wrong time when available in excess. There are three major categories of trace metal concentration data that are currently measured in order to compare differences in trace metal pollution in aquatic habitats over space and time: 1) trace metal concentrations in water, 2) trace metal concentrations in sediment and 3) trace metal concentrations in resident biota. Evaluation of dissolved trace metal concentration in water is very important to determine if these concentrations are close from those shown to present a toxic effect on organisms using toxicity tests. Dissolved concentrations usually vary over time, particularly for example in estuaries with differential inputs of river and sea water at different states of the tide, and differential river flow according to recent rainfall in the catchment often varying seasonally. Each measurement represents a single time point that may be very different from the dissolved concentration present at that exact location the day before or the day after 3.1 Biological significance of metals Living organisms store and transport various transition metals to provide appropriate concentrations for basic metabolism (mainly enzyme cofactors). The normal concentration range varies according to metals and is difficult to determine in biological systems. More, metal deficiencies and excesses both contribute to generate pathological changes. The complexity of cell types in multicellular organisms also participates to the dynamics of metals distribution; the storage and the transport of transition metals being not carried by all cells but specialized ones. The form of the metals remains always ionic but the oxidation state may vary based on cell biological needs. The main heavy metals in environmental monitoring studies are mercury, cadmium, lead and copper. 11
16 Mercury (Hg) is a heavy metal present under three chemical forms: elemental (Hg without any additional atoms attached to it), organic, and inorganic that are interconvertible, and can all produce systemic toxicity (Graeme and Pollack, 1998). Origin of Hg in the environment are both natural and from anthropogenic sources like mining, fossil fuels combustion, incineration, emission from smelters, fungicides and catalyst activities. Although mainly present in the atmosphere, a large part of Hg returns into the coastal sea as precipitates. Hg is also present at high concentrations in sediments of aquatic environment since both inorganic and organic Hg are linked to particles, colloids and high molecular weight organic matter (Schiff, 2000). Inorganic Hg can be converted by specific bacteria into methylmercury which represent the most toxic chemical species able to provoke deleterious effects to the central nervous system, deficiencies in the immune system and development [Harada et al., 1998). Dissolved methylmercury is easily bioavailable and can bioaccumulated and biomagnified into the marine food chains to reach very high concentrations in upper levels of the chain. Toxicity of Hg has been studied in several marine invertebrates species such as the clam Ruditapes philippinarum, (Liu et al., 2011), the crustacean Ligia italic, in which ultrastructural alterations in the hepatopancreas epithelium have been observed (Longo et al., 2013) or Scylla serrata in which modifications of several immune related parameters (total haemocyte count, lysosomal membrane stability, phenoloxidase, superoxide generation and phagocytosis) have been reported (Singaran et al., 2013). In embryos of the sea urchin Strongylocentrotus purpuratus exposed to mercury, the inhibition of specific molecular transporters increases intracellular accumulation of inorganic Hg but had no effect on accumulation of organic Hg. These results illustrated the existence of a specific elimination of inorganic Hg and a differential accumulation and potency of the two major forms of Hg found in marine environments (Bosnjak et al., 2009). Accumulation of Hg in the soft tissues of the oysters Saccostrea cucullata (Shimeshan et al., 2012) and Crassostrea angulata illustrated the interest of such organism for monitoring of Hg mercury in the aquatic system. Proteomic analysis conducted on gonads of oysters following food-chain contamination with HgCl evidenced different proteins such as protein, GTP binding protein, arginine kinase and 71 kda heat shock cognate protein) as good candidate biomarkers for environmental Hg contamination (Zhang et al., 2013). Cadmium (Cd), is a heavy metal released both from natural sources and anthropogenic activities resulting from its large utilization in some industrial and agricultural activities (e.g. pigments, nickel-cadmium batteries, smelting and refining of metals and many 12
17 other sources). Cd is a highly toxic environmental pollutant and potent cell poison which induce different types of damage including cell death. Cd toxicity is amplified in organisms as a consequence of the metal s long biological half-life which range from 15 to 30 years according to species and tissues. Cd easily penetrates the cells, via transport mechanisms normally used for other purposes, but is eliminated very slowly (Jarup et al., 1998). Since Cd is a non-essential metal which present no physiological function that is irreversibly accumulated into cells and strongly interact with various cellular components and molecular targets. Cd may enter cells via divalent ion transporters, such as zinc transporters (Kingsley and Frazier, 1979), can cross the plasma membrane as divalent ions, exerting an agonistic role against calcium ionic channels (Foulkes, 2000). Toxicity of Cd is also modulated by various abiotic factors (De Lisle and Roberts, 1988). Among Cd effects, cases of teratogenesis and carcinogenesis, due to cytotoxic concentrations of the ion, have been reported both in invertebrates and in higher organisms. Accumulated evidence has also shown that Cd increased not only cellular ROS levels, but also lipid peroxidation and alteration in glutathione (GSH) levels in various cell types, suggesting that Cd-induced apoptosis may be connected with oxidative stress (Rana, 2008). In invertebrates it up-regulates the expression of antioxidant enzymes, metallothioneins and heat shock proteins (HSPs) and down-regulates the expression of digestive enzymes, esterases and phospholipase A2. Cd also interferes with tissue organization, immune responses and cell cycles by inducing apoptosis (Sokolova et al., 2004). Due to its high level of resilience, Cd is a contaminant which accumulate in the foodchain involving that for many aquatic predators, Cd comes largely from food and the ease with which Cd penetrate tissues mainly depends on the form in which this metal is bound in prey cells (Cd present in the cytosol being more available than Cd associated with insoluble prey components (Dubois and Hare, 2009). High concentrations of Cd has been reported in aqueous organisms including invertebrates, such as sponges, mollusks, crustaceans, echinoderms with very often the existence of significant differences in Cd concentration in tissues in differently contaminated sites. Various effects of Cd have been reported in different species. For example, modifications in cell morphology and cell aggregation in Scopalina lophyropoda, by enhancing pseudopodia/filopodia formation which promotes cell movement have been described (Cebrian and Uriz, 2007). High concentrations of Cd are detected in the gills and digestive gland of the mussel Mytilus galloprovincialis associated with alteration in the physiology of respiration and feeding processes (Viarengo et al., 1994), in the digestive gland and kidney of mussel Crenomytilus grayanus (Podgurskaya and Kavun, 2006), in the renal tissue of Antarctic bivalve Laternula elliptica (Rodrigues et al., 2009) or in the 13
18 hepatopancreas of Mytilus edulis and body wall of echinoderms such as Asterias rubens.. Similar observations have been made in few species of Antarctic molluscs highlighting the importance of food in the primary pathway for Cd bio-accumulation (Nigro et al., 1997). Data on the effect of Cd on cellular and molecular defense strategies such as apoptosis, autophagy, metal detoxication and stress proteins have been obtained in Paracentrotus lividus embryos (Rochherri and Matranga, 2010). Lead (Pb) is a heavy metal naturally present in the environment that becomes highly toxic when ingested and cause severe damages to the nervous system and causing different disorders. Pb compounds exist in two main oxidation states, +2 and +4 (Nava-Ruiz et al., 2012). Pb is a bio-persistent pollutant mainly originating from human activities that accumulates at the top of the food chain. In marine invertebrates, the Pb toxicity varies according to species but also to their life stage in a dose and time dependent manner. A characterization of the cytosolic distribution of Pb was carried out in the digestive gland of Mytilus galloprovincialis, Pb is present in molecule with high molecular weight but when Pb concentrations are elevated, Pb is also present in low molecular weight biomolecules, illustrating suitability of the distribution of selected metals among different cytosolic ligands as potential indicator for metal exposure (Strizak et al., 2014). Sea urchin embryos of the sea urchin Paracentrotus lividus exposed to Pb exhibit alterations of morphology at gastrula and pluteus stages (Geraci et al., 2004) and a reduction of calcium accumulation is observed in embryos of Strongylocentrotus purpuratus (Tellis et al., 2014). In the mussel Perna viridis exposed to environmental Pb concentrations, several enzymes classically used in toxicology (catalase, reduced glutathione, glutathione S-transferase, and lipid peroxides) showed differences in activities (Hariharan et al., 2014). Copper (Cu) is a metal present in all environments and is present in aqueous solution as copper(ii) under the form [Cu(H 2 O) 6 ] 2+. Copper occurs naturally at low levels in air, soil and water but activities associated to mining and smelting of copper, industrial emissions, municipal wastes, fertilizers, and pesticides have increased copper levels in our biosphere (Eisler 2000). Atmospheric Cu originates primarily from human activities (73%) Precipitation of atmospheric copper is a significant source of Cu to the aquatic environment in mining and industrial areas and deposition patterns vary relative to prevailing winds and intensity of 14
19 industrial activity (Nriagu, 1979). Due to its biostatic properties, copper has been used as antifouling to protect against barnacles and mussels in marine paints but also in the aquaculture industry because of its antimicrobial properties. Many proteins need copper as a cofactor. Copper proteins play various roles in biological electron transport and oxygen transportation (that use the interconversion of Cu(I) and Cu(II) (Vest et al., 2013). Copper is also essential in the aerobic respiration of all eukaryotes and is present in mitochondria where the cytochrome c oxidase, (the last protein in oxidative phosphorylation) binds the O 2 between a copper and an iron. Copper is also found in many superoxide dismutases, proteins that catalyze the decomposition of superoxides by converting it to oxygen and hydrogen peroxide. Copper is also present in the major protein involved in the oxygen carrier, hemocyanins, in most mollusks and some arthropods such as the horseshoe crab (Limulus polyphemus). Copper enzymes are involved in vital processes such as the control of cellular energetics for synthetic activities, for muscular activity and heat production, for the structural organisation of basement membranes and connective tissues essential for the integrity of both skeletal and soft tissues. 3.2 Metal uptake The gills of bivalves constitute a key interface for the uptake of dissolved metal ions from water and in a less extent the mantel. To enter the cell metals first must cross the cellular membrane, this process is given by three ways: transport membrane protein of relative wide specificity, transport by intrinsic proteins which metal ions pass selectively or for endocytosis, figure 2 (Khan et al., 2015; Marigómez et al., 2002; Wang and Fisher, 1999). Transmembrane pumps then play an pivotal role, because they regulate the ionic homeostasis in the cell. Ca 2+ pump and Na + /H + antiporter exchange are the most studied mechanisms of ion homeostasis, the first regulating the calcium levels which is important in shell formation and is taken actively from the environment principally for transmembrane Ca 2+ pump, and the second is responsible of intracellular ph and cellular volume. However the presence of toxic metals can disturb the uptake by direct competition with this metal, as the reported for zinc and cadmium that have one of the higher level of assimilation between different invertebrates species and a very slowly removal rate (Ahearn et al., 2001; Machado and Lopes-Lima, 2011; Wang and Fisher, 1999). For example, cadmium may enter the gills 15
 would lead to the presence of aqueous Ag which may enter the cell via ion transport channels, such as the proton-coupled Na+")
20 Figure 2. Schematic diagram describing potential uptake pathways during waterborne exposure of Peringia ulvae to Ag NPs. Ag NP dilution in the external media (17 salinity estuarine water) would lead to the presence of aqueous Ag which may enter the cell via ion transport channels, such as the proton-coupled Na+ channels. Intact Ag NPs could be potentially internalised via endocytotic pathways; clathrin-mediated endocytosis, caveolae mediated endocytosis or macropinocytosis. Adapted from Khan et al by passive diffusion or across Ca2+-channels probably through a rapid binding to intracellular ligands that ensures removal of cytosolic Cd2+, this uptake process depending on the availability of ATP (Figure 3). Other metal such as iron, when present as insoluble particulate compounds, may be absorbed by pynocytosis. Case of endocytic vesicles in epithelial cells containing lead has been reported in the gills. Similarly, in several freshwater mussels Cd is localized in endocytic vesicles of gill epithelial cells. However metals enter the cytosol either across membrane channels or by endocytosis and can be incorporated into lysosomes or transported in vesicles across the epithelial cells to be later exocytosed basally into the blood and incorporated into circulating hemolymph/blood cells 16

21 Figure 3. Representation of the ways used by Cd ions to cross the gill cells in bivalves (modified from Carpené and George, 1981). Some differences exist between filter and grazer species. For example, in grazers, iron is not be endocytosed by gill epithelial cells and the uptake of Zn appears to be directly from water without the use of ion pumps and could be transported across the gill epithelia into the blood. More, mucus layers adhering to the gill may promote epithelial uptake by trapping and concentrating metals and may, thereby, establish a diffusion gradient to favor uptake of the metal. Mucous may also play a role in the fixation of metals ions participating to the decrease of their bio-disponibility. The mantle of molluscs is involved in the metabolism of divalent cations mainly by the active incorporation of Ca2+ and some other elements from the extracellular pallial fluid into the shell. The mantle epithelial cells of bivalves can accumulate Cd, Cu, Fe, Hg and Zn in lysosomes. The shell also serves as a storage matrix for toxic metals even concentrations remain much lower than in soft tissues. Metal ions are replacing calcium in the carbonate complex or are bind by adsorption to the organic component of the shell. Byssus also participate to metal fixation mainly iron since 30% of the Fe from ferric hydroxide can be removed by deposition in the byssal threads of mussels through the fixation of metal on diphenols or semiquinones that are able to form stable ligands with various metals. 2"2$=(+,-;)(5$)9$.15+8-$&,$68))>$;8+-.+$$ In molluscs, haemocytes (blood cells) participate to the metals transportation either associated with cytosolic proteins or within lysosomes and blood plasma proteins may bind metals in a non-specific way. In marine mussels and clams, Zn and Cd are transported primarily in blood plasma, associated with high molecular weight proteins (HMWP) and in 17
22 the flat oyster Ostrea edulis, Cu and Zn are mainly transported within haemocytes. Metals are accumulated in haemocyte lysosomes as non-digested products. Under exposure to Cd, Cu or Pb, a migration of haemocytes can be observed towards gills or digestive tract and other detoxification organs suggesting that blood cells may constitute the most relevant system for metal transport between tissues in molluscs. The presence of lysosomal vesicles of brown cells (cell having an oval or round shape, a presence of membrane fenestrations and yellowish-brown cytoplasmic granules) that can accumulate various metals has been reported in mussels, clams and oysters. 3.4 Metal accumulation The digestive gland of molluscs is the main center for metabolic regulation but is also involved in immune defense and homeostatic regulation of the internal medium (calcium, haemolymphatic ph, cell volume...), as well as in the mechanisms of xenobiotics detoxification and elimination. When bound to particulate material, metals go through the digestive gland. For example, iron enters the digestive cells via microvilli plasma and pynosomes, and then transferred to lysosomes and further to residual bodies. According to metals, different parts of the digestive gland are involved in ion transport. In the freshwater gastropod, Lymnaea truncatula, epithelial cells present in the peritentacular area and the alimentary canal participate to the binding of iron, and copper only enters through cells of the peritentacular area. Cd is heterogeneously distributed along the different regions of the digestive tract in freshwater mussels. Accumulation of metals in lysosomes of the digestive cells occurs by two different pathways: with food or from haemocytes by phagocytosis and directly incorporated in lysosomes or dissolved metals may also be incorporated from either the lumen in the bottom of the cell after having previously immobilized by cytosolic metallothioneins. Endocytic metal-protein complexes can also fuse with primary lysosomes to give heterophagolysosomes in which the biological material is hydrolyzed. At that point, ions are partially available for the cell and partially bound to the undigested material that remains in the endo-lysosomal system. Metal ion can then be later eliminated from the cell via exocytosis of residual bodies. 3.5 Excretion of metals Elimination of metals may occur by different complementary ways according to metals. Cu can be extruded with mucous secretion or released by exocytosis to the external 18
23 medium from frontal cells and Zn may be released by secretory cells in the postlateral zone or by basal exocytosis of lysosomes in the abfrontal epithelial cells. Haemocytes also participate to metal elimination, releasing ions by diapedesis across the epithelia of the mantle and digestive tract. In the freshwater bivalves, the excretory system include the pericardial gland that is involved in ultrafiltration, and under Cd exposure, Cd can be detected in the pericardial gland, bound to small plasma protein-complexes that pass throughout the ultrafiltration barrier to the primary urine. Metal detoxification from digestive gland cells may occur via feces or via basal lamina release towards haemocytes dispersed by the connective tissue of the visceral mass. 4. Response to heavy metals in marine invertebrates. Exposure to different heavy metals and bioaccumulation in natural population has been reported in many bivalves (Marigómez et al., 2002), showing the high tolerance of these species and given great potential for assess the status of chemical pollutants in aquatic ecosystems (biomarkers of toxicity). Heavy metals have been described as one of the main selective pressure acting in marine invertebrates, affecting embryonic development, stress protein induction, immune system, DNA, RNA and lipid damages with subsequent cellular apoptosis (Chiarelli and Roccheri, 2014). The degree of sensitivity of species depends on the metal type and its concentration exposure, which strongly vary between species. For example, exposure to copper in limpet (Patella vulgata), crabs (Carcinus maenas) and mussels (Mytilus edulis) reveals that at high concentration, metals interfere with different physiological parameters such as survival ability, heart rate, proteins levels in hemolymph, lysosomal stability, neurotoxic effect (acetylcholinesterase activity) and specific biomarkers of metal exposure (metallothionein) and a gradient in sensitivity is observed where limpet is more sensitive than crab and mussel (Brown et al., 2004). Bivalves species have been chosen as model organisms especially in marine environments to understand the mechanisms involved in the response of metal exposure, because they can accumulate different types of essential and non essential metals in high levels and the major models used are oysters, scallops, clams and mussels (Chandurvelan et al., 2015; Lavradas et al., 2016; Paul-Pont et al., 2012; Sakellari et al., 2013; Varotto et al., 2013; Wang et al., 2009). In bivalves used as metal bioindicators of aquatic contamination different methodologies have been developed to localize and quantify metal concentrations, from histochemistry, spectrophotometric techniques and electronic microscopy, allowing 19
24 understanding the uptake pathways from the ambient water (Sakellari et al 2013; Chandurvelan et al, 2015). Once the metal is acumulated in the organism have the potential to be incorporated in different physiological pathways (normally for the essencial metals, Cu, Zn) but when his concentration exeed the levels of tolerance or are toxic (non essencial metals, Cd, Pb, As, Hg) metals can be stored in compartimentalizated vacuoles or can be begin detoxification mechanism of manner temporaly or permanently, however both process require specific metal binding enzymes or proteins that permit the transport internally to a particular organ for be excreted from the organism (Rainbow, 1997). At molecular level different specific and non specific biomarkers of metal pollution has benn described, showing a conserved mechanis across different taxas but that vary in the level of efficiency and network complexity.?"#$c1+'5&41$)bd*1,$-;1'&1-$ecfgh$ Metals increases the production of reactive oxygen species (ROS) including superoxide anion (O - 2 ), hydrogen peroxide (H 2 O 2 ) and the highly reactive hydroxyl radical (. OH), which may interfere in many metal-related processes and generate modification of lipids, proteins and nucleic acids (Lushchak, 2011). The ROS formation occurs through the following reactions: and Metal ox + O 2 - Metal red + O 2 Metal red + H 2 O 2 OH + OH - + Metal ox with the net result O 2- + H 2 O 2 OH + OH - + O 2 In response to ROS, an antioxidant machinery as evolved in many species from bacteria to humans, including activation of different low molecular weight scavengers like superoxide dismutase (SOD), catalase (CAT) and glutathione (GSH), ascorbic acid (vitamin C) that interact in a complex network to participate for example to the reduction of the membrane lipid peroxidation (Regoli and Giuliani, 2014; Canesi 2015). ROS are also naturally produced by different cellular compartments including the mitochondria (Figure 4) 20
. Figure 4.")
25 as a product of the oxygen metabolism, the endoplasmic reticulum, peroxisomes and phagocytic vesicles that generate oxidative stress as the result of protein folding which requires oxygen as the final oxidant, H 2 O 2 production and degradation, transferring electrons across biological membranes through NADPH-oxidases activity (Donaghy et al, 2015). Figure 4. Major sites of reactive oxygen and nitrogen species generation in generalized haemocytes in marine bivalves. Abbreviations: CAT, catalase; CYP, cytochrome P-450; ETC, electron transfer chain; MPO, myeloperoxidase; NOS, nitric oxide synthase. Adapted form Donaghy et al 2015.?"!$G:;1()B&>1$>&-.:5+-1$EGFIH$ The superoxide dismutase is a dimeric enzyme present in almost all the aerobic - organism which principal function is the catalytic conversion of the O 2 to oxygen (O 2 ) and hydrogen peroxide (H 2 O 2 ) in presence of H + (Fridovich, 1995). SODs are classified in two categories according to their cellular localization, cytosolic and mitochondrial but both types require the presence of specific metals as cofactor for his activation, the specificity been indicated on the active site (figure 5). Manganese SOD (MnSOD) are found in the mitochondria, copper/zinc SODs (Cu/Zn SOD) which is the most abundant form can be found in the cytoplasm such as the iron SOD (FeSOD), usually found in prokaryotes, and the recently described nickel SOD (NiSOD) (Abreu and Cabelli, 2010). The mechanism by SOD activity involves the sequential reduction and oxidation of the metal center, with the 21

26 subsequent oxidation and reduction of superoxide radicals. Ecotoxicology studies in marine species such as Crassostrea gigas, Mytilus edulis, Mytilus galloprovincialis highlight the activation of SOD as a biomarker of oxidative stress in experimental exposure to xenobiotic agent and both activity (determined at protein level and activity) and gene expression level have been explored (Kim et al., 2015; Boutet et al., 2004; Lewis et al., 2016; Lushchak, 2011). The role of SOD in natural populations has been also studied in a context of naturally anthropogenic contaminated areas to validate the use of this specific biomarker in field context (Orbea et al., 2002; Rodriguez-Ariza et al., 1993). Figure 5. A comparison of the enzyme structures and active sites for the four SODs, (A) Streptomyces coelicolor NiSOD, (B) human CuZnSOD, (C) E. coli FeSOD and (D) MnSOD Adopted from Abreu and Cabelli, 2010.?"2$%15+88)50&),1&,-$E%=-H$ The metallothioneins (MTs) are one of the best studied stress response associated to metal exposure in invertebrates. Metallothioneins (MTs) are low molecular weight (6 to 7 kda) cytoplasmic metal-binding proteins with high cysteine content (close to 30% of their amino acid content) that give the ability of the thiol group to capture free metal ions reducing cellular damage ) are that bind essential (copper, zinc, iron, manganese) and non essential (cadmium, mercury, lead, silver) metal ions that are sequestered into a metal/sulphur cluster (Amiard et al., 2006; Isani and Carpenè, 2014; Cherian and Goyer, 1978, Kojima and Kägi 1978). Although amino acid composition is variable, the cysteine content is more conserved with characteristic motif like Cys-Cys, Cys-X-Cys and Cys-X-Y-Cys, where X and Y are 22
 which are able to")
27 amino acids other than cysteine (Paul-Pont et al., 2012)., however not all the function of the Mts as been describes, also free radical scavenger activity, Normally the cysteines are arranged in two metal thiolate cluster (figure 6) which are able to specifically bind metals that later can be exported out of the cellule. Important biological functions of MTs are 1) trace metal homeostasis, 2) protective role against excess reactive heavy metal ions, 3) free radical scavengers, 4) reservoir of essential metals that can be donated to other metalloproteins and 5) cell protection against intracellular oxidative damage (Karin, 1985; Hamer, 1986) and they have been linked to modulations of immune response, genotoxicity and carcinogenicity (Asselman et al., 2012; Nordberg et al., 2009). Several studies have shown that MTs display a specific tissue expression pattern that is correlated with development and differentiation (Banerjee et al., 1982; Chatterjee and Maiti, 1990; Nemer et al., 1991). A large number of MT isoforms have been isolated from vertebrates and invertebrates, apparently originating from events of gene duplication that may have occurred many times independently (Griffith et al. 1983, Hunziker et al. 1995). Nine MT isoforms have been characterized in the blue mussel Mytilus edulis (Barsyte et al. 1999), seven in the sea urchin Strongylocentrotus purpuratus (Nemer et al. 1984, Wilkinson & Nemer, 1987), one each in the tropical green mussel Perna viridis (Khoo & Patel 1999) and the Eastern oyster Crassostrea virginica (Unger et al. 1991), and four in the Pacific oyster Crassostrea gigas (Tanguy et al. 2001, Tanguy and Moraga 2001, David et al., 2012) and two in the flat oyster (Boutet et al., 2002). Figure 6. Metallothionein (MT) structure. Model of two binding sites of metallothionein. Red big beads are metal atoms (e.g., Zn), and small yellow beads are sulfur 23
, metal transcription factor (MTF) and zinc")

28 atoms. Adopted from Ruttkay-Nedecky et al., MT transcription is also regulated by a set of binding sites for transcription factors localized in the promoter region as metal responsive elements (MRE), metal transcription factor (MTF) and zinc finger protein (Janssens et al., 2009).?"?$/1((&5&,$E/1(H$ Ferritin which is the principal protein involved in iron storage, is a structurally complex protein formed by 24 subunits of two types of polypeptide chains giving a globular shape that can accommodate large quantity of iron in his interior (Figure 7), and is usually present in the cytosol (Lobreaux et al., 1992). The process by which iron is stored begin in the H (heavy) chain which oxidizes Fe 2+ in a specific ferroxidase site, and the L (Light) chain that performs the entry of the metal into the protein, while more metals enter the more Fe 3+ cluster are formed in the cavity of the protein (Strange et al., 1993). Figure 7. Tridimentional structure of ferritin (left) and manganese ferritin aggregate formation after exposure to manganese (right). Adopded from Chet et al 2015 The principal function of ferritin consists in the storage of free iron when his concentration exceeds the normal levels and its release when needed. In marine invertebrates the mechanism of activation of these proteins is less documented compared to other detoxification proteins but recent works showed that the transcriptionally and translational expression of this protein is positively correlated with the exposure of iron in several bivalves (Zhang et al., 2013; Zhou et al., 2014), but it has also been reported that this protein could store other types of heavy metals (Chen et al., 2015; Zapata et al., 2009). 24
29 The phytochelatin (PC) is another type of metal binding peptides which is produced from glutathione by the enzyme phytochelatin synthase (PCS) (Figure 8). It has been described primarily in plants and terrestrial invertebrates to present an equivalent function of the MTs in metal detoxification because they also are characterized by the presence of cysteine motif (Cobbett, 2000; Inouhe, 2005; Vatamaniuk et al., 2005). The general structure of PCs consists only in three amino acids Glutamic acid (Glu), Cysteine (Cys) and Glycine (Gly) where the first two are linked through a!-carboxylamide bond, forming the structure (!- Glu-Cys) n -Gly where n can vary from 2 to 5 repetitions. They are normally found in the cytosol but when they have interacted with a toxic metal, the complex PC-metal are sequestered to the vacuole (Cobbett, 2000; Rodrigo et al., 2013). Figure 8. Phytochelatin syntthesis (left) and structural conformation when interact with metals (right). Adopded from Inohue, 2005 and Merlos et al In marine invertebrates only a few sequences are reported for the phytochelatin synthase (PCS), particularly in the genome of the pacific oyster Crassostrea gigas and recently in the transcriptome of the hydrothermal mussel Bathymodiolus platifrons (Wong et al., 2015). The role of PCs could be a potential efficient mechanism in heavy metal sequestration in marine invertebrates which it has so far been less A&$/+,*(',$5,<%2270$%5,(*+<%5+*, The Omics term refers to the field of biology that includes genomic, transcriptomic and metabolomics which has considerably increased in the last years due the development of high throughput sequencing techniques as 454, Illumina, Solid and Heliscope which strongly increased the amount of DNA and RNA information, with a low error rate and cost. This opportunity to get a large amount of genomic data represented one of the most important 25

30 evolution for the study of non-model species (Pavlopoulos et al., 2013). This amount of genetic information has revolutionized areas of ecology and evolution, greatly expanded the scientific possibilities to assess the mechanisms that govern ecological interactions (Straalen and Feder, 2012). The field of genomics (the study of how an individual s entire genetic make-up, the genome, translates into biological functions) should strongly contribute to provide tools that may assist our understanding of how chemicals can impact on organisms and ecosystem health. Genomic tools can facilitate ecology and evolutionary biology studies, providing useful data to identify ecological performance-regulated gene loci; to perform functional analysis of ecological performance-related traits; evaluate individual, population, community, and ecosystem responses to the environment and examine the degree and significance of genetic variation among ecological performance-related traits (Snape et al., 2004). The term ecotoxicogenomics has been proposed to describe the integration of genomics (transcriptomics, proteomics and metabolomics) into ecotoxicology and has been defined as the study of gene and protein expression in non-target organisms that is important in responses to environmental toxicant exposures (Figure 9). Figure 9: Conceptual framework for ecotoxicogenomics The way populations can adapt to environmental toxicants also has been explored using omics techniques, where traditionally the response to any toxic agent was studied by a limited number of genes but at present, many genes can be analyzed simultaneously in term of transcript regulation and interaction, protein concentration and activities and how specific mutation can change the protein function or activity. One application of transcriptomics and 26
31 proteomics in ecotoxicology that show an increasing interest is the characterization of the mode of action (MOA) profiling of environmental toxicants, in order to identify particularly sensitive subsets of ecological populations, and discover new molecular biomarkers of interest. The use of gene (or protein) expression profiling-based MOA will allow the identification of new toxic substances based on their expression profiling comparison to already known specific toxicants MOAs. The development of this approach is one of the priority of the European program REACH (European Union regulation on Registration Evaluation and Authorization of Chemicals,) that has been established to both optimize resources and to limit the use of animals for testing purposes. The new molecular biomarkers (single gene or complex gene expression pattern) should contribute to provide an early detection of environmental stress, to infer mechanism of action and allow a more relatively efficient monitoring of the environment. But, all this biomarkers have be integrated with phenotypic end points (activities, metabolites concentration, chemical profiles) to establish robust correlations between molecular biomarkers and phenotypic end points which is one of the major criticisms on the application of transcriptomics and proteomics to ecotoxicology. Three main methods dominate transcriptomic analyses: the single gene expression study using quantitative PCR, the microarray technique that has existed since the mid-1990s and that allow the analysis of the expression of hundreds genes (Schena et al., 1995) and the RNA-seq that utilizes the power of high-throughput sequencing (HTS) for transcriptomics (Wang et al., 2009; Schirmer et al., 2010). Both methods initially use RNA and both result in a data matrix indicating relative expression levels of each transcript in each individual analyzed but both techniques require biological replications to allow robust statistical analysis (Lee et al., 2005). The microarrays use short gene sequences representing part of the DNA that are fixed to a surface and the levels of expression of the genes are estimated by hybridization with complementary DNA (cdna) transcribed from mrna transcripts previously labelled with fluorescent dye. After the hybridization, the array is scanned with lasers where the level of fluorescence detected is proportional to the number of cdna transcript that are hybridizing at particular probe. The RNA-seq use high-throughput sequencing technique to generate hundreds of thousands of fragments of a cdna library, the length, sequencing depth and quality depending on the sequencing platform used. The main differences with microarrays is that RNA-seq can detect all expressed genes (even new genes) when microarray only provide information on the genes present on the array and that RNAseq 27
32 requires a bioinformatics language for assemble and align the huge amount of transcripts generated (Alvarez et al., 2015). Bivalve genomic resources remain not well annotated or well described, with the exception of some species classically used in biomonitoring studies such as Pacific oyster, C. gigas, whose genome has been recently published (Zhang et al., 2012) or the pearl oyster, Pinctada fucata, in which genome annotation is still at the draft level (Takeshi et al., 2016). Other bivalve transcriptomes are publicly available for M. galloprovincialis (Rosani et al., 2011; Gerdol et al., 2014), Patinopecten yessoensis (Hou et al., 2011), Ruditapes philippinarum (Milan et al., 2011; Moreira et al., 2012) and Corbicula fluminea (Chen et al., 2013). Several reviews papers have been published to provide some examples on how -omic tools have been used in the study of immunity and host pathogen interactions in mollusc bivalves (Cancela et al., 2010; Gestal et al., 2008; Guo et al., 2008; Romero et al., 2012; Wang et al., 2013; Yue, 2014, Gomez-Chiarri et al., 2015). The use of large scale transcriptomics approach (ie microarray or RNAseq) to monitor pollutant effects is growing and has been mainly developed in the clam R. philippinarum in a population context (Milan et al., 2016) or in M. edulis and M. galloprovincialis in which correlation between metals concentration in tissues and gene expression profile has been reported (Venier et al., 2006; Dondero et al., 2010, 2011; Poynton et al., 2014, Varotto et al., 2013). These studies reported evidence serves to validate the use of this molecular tools in ecotoxicological studies but the major challenge still remains to get a better understand of how this molecular changes caused by toxic exposure in the organism modulate biological changes in the ecosystem (Schirmer et al., 2010). 6. Hydrothermal ecosystems as natural laboratory for heavy metal adaptation Deep-sea hydrothermal vents ecosystems are distributed among all the oceans, principally along mid-ocean ridges where new oceanic crust is generated. Vent fluid is formed by infiltration of deep-sea water into fractures of the oceanic plate and chemical transformation at high temperature deep in the crust, under the influence of the underlying magmatic chamber. The vent fluid returns to the ocean through diffuse or focused venting, with typically high temperature (up to 400 C depending on sites), loaded with heavy metals and reduced gases such as carbon dioxide (CO 2 ), sulfide (H 2 S), hydrogen (H 2 ) and methane (CH 4 ) (Figure 10). When mixing with cold deep-sea water the hydrothermal flux is diluted, its 28
. Lacroix, 2012. Figure 10.")
33 high temperature is reduced, the ph becomes more basic, some metals precipitate forming the classical chimney structures and some remain in the water column. However these characteristics are very variable for each vent site, providing a biotope with different environmental conditions (Demina and Galkin, 2016; Von Damm, 1995). Lacroix, Figure 10. Geological formation of an hydrothermal vent. Adapted from Fouquet and The initial discovery of luxuriant vent ecosystems in 1977 around the Galapagos (Corliss et al, 1979) revolutionized the understanding of life in the oceans because until that date the paradigm was that life in the deep ocean was scarce due to the absence of light, and consequently photosynthetic primary production, limiting food availability to what came from the surface layers. In the last forty years the development of new exploratory technology, principally manned submersibles and remotely operated vehicles (ROV), has enabled the discovery of many of these ecosystems across the oceans (Figure 11), revealing the occurrence of local, chemosynthetic primary production supporting very abundant communities of endemic species (Desbruyères et al. 2006), comprising arthropods, molluscs and annelids which have adapted to these ecosystems, and challenging major evolutionary, ecological, physiological hypotheses and paradigms (Danovaro et al., 2014). 29
--$501$)'1+,-\"$ L>);51>$9().")
34 /&*:(1$##"$I&-5(&6:5&),$)9$0D>()501(.+8$41,5$-&51-$+'()--$501$)'1+,-"$ L>);51>$9().$3,51(C&>*1M$41(-&),$!"#$! 30
, evidencing that active hydrothermal vents also exist on slow spreading ridge axes.")
, characterized by contrasted physicochemical characteristics associated with their depth and the composition")
35 $$N"#$OD>()501(.+8$41,5-$&,$%&>PL58+,5&'$C&>*1$E%LCH$ Ten years after the discovery of Corliss and colleague s, exploration in the MAR were performed (Rona et al., 1986), evidencing that active hydrothermal vents also exist on slow spreading ridge axes. Until now, many scientific expeditions have been devoted to the MAR where several vent fields have been described between 10º N and 40º N (Figure 12), and some more recently in the south Atlantic. The most studied are the three vent fields located near the Azores Triple Junction (ATJ), characterized by contrasted physicochemical characteristics associated with their depth and the composition of oceanic crust (Charlou et al., 2000; 2002): Menez Gwen (MG, -850m), Lucky Strike (LS; -1700m), and Rainbow (RB; -2300m). An indication of the characteristics of the vent fluid (end-member) is given in Table 1, but one must keep in mind that due to the chaotic nature of hydrothermal venting, large excursions around these values can be measured at a given date. Figure 12. Map of north MAR hydrothermal vent fields. Adapted from Charlou et al 2002.!! 31
36 Table 1. Principal physicochemical characteristics measured in the hydrothermal vent fluid (end-member) at Menez Gwen, Lucky Strike and Rainbow. Adapted from Charlou et al Menez Gwen Lucky Strike Rainbow Depth (m) Temperature (ºC) 275/ / ph 4.2/ / Cl (mm) Br (µm) Na (mm) Ca (mm) Sr (µm) Fe (µm) Mn (µm) Cu (µm) Zn (µm) H 2 S (mm) CO 2 (mm) CH 4 (mm) H 2 (mm) Ecological studies at these vent fields started in the nineties and recognized these sites as one biogeographical region separate from the southern sites, principally due to their communities composition and structure (Desbruyères et al., 2001). MG and LS have been the first deep-sea marine protected areas to be established in 2002 and an interdisciplinary deepsea observatory has been set up at LS since 2010 ( The particular trophic structure described in MAR is conformed by bacteria, arthropods, annelids and molluscs principally. Chemoautotrophic bacteria are the primary producers that can synthetize organic carbon from the energy derived from the oxidation of hydrogen sulfide (SOX bacteria) or methane (MOX bacteria) (Cavanaugh et al., 2006). Consortia of heterotrophic bacteria are typically found within bacterial mats or filamentous aggregates (Crepeau, 2011). Primary consumers are divided in two main groups, mussels and shrimps, that have mixotrophic feeding behavior switching between reliance on symbiotic bacteria and filtering or grazing activities. The next trophic level is represented by detritivorous invertebrates, principally crabs and gastropods that live between mussels beds 32
37 and shrimps, and finally the top predator are mostly bathyal species such as fishes that live close to the vent fields and occasionally make incursions into the vent sites for food supply (A. Colaço et al, 2002). 6.2 Heavy metals concentration in MAR and their accumulation in vent fauna One of the major characteristics of the hydrothermal vent fluid is the high concentration of heavy metals that emerge from the flux, where one part is precipitated to form sulfide structures and the other is mixed with seawater and dispersed with the hydrothermal plume moving hundreds of meters above the vents. However, the availability and concentration of metals depend on the intrinsic characteristics of each vent site such as spreading rate, temperature, depth, rock composition of the ocean floor and hydrothermal circulation (Elderfield 1996; Fouquet and Lacroix, 2012). For MAR fauna, a direct correlation between the concentration measured in the fluid and that in the tissues of different animals (Bathymodiolus mussels, Rimicaris shrimps and Segonzacia crabs) has been established, showing very high levels of bioaccumulation compared with anthropogenically contaminated ecosystems, where various metals (iron, copper, cadmium, manganese, magnesium, lead, zinc, silver and arsenic) are concentrated in different tissues (gill, mantle, digestive gland, foot and hemolymph fluid) according to the concentration in the environment (Demina and Galkin, 2008). This bioaccumulation represents one of the biggest challenges for species associated with these ecosystems, and endemic species must adopt physiological strategies implying mechanisms of tolerance and/or detoxification which have not been well described for hydrothermal species. The contrasted metal concentrations reported at MG, LS and RB (Table 1) raises a good environmental laboratory to understand the plasticity of species responses to metal. The concentration of metal in fishes living in surrounding hydrothermal areas has been reported higher with those compared in fishes without the influence of hydrothermal vent (Company et al., 2010; Raimundo et al., 2013), however detoxification in these species is not correlated to metallothionein (MTs) levels in tissues, arguing that this protein is not the major detoxification system for this fishes. Among endemic species, the crab Segonzacia mesatlantica accumulates high concentrations of iron, zinc, copper, manganese and lead principally in gills, gonads, muscles 33
38 (Demina and Galkin, 2008) but its detoxification systems are not well studied. Leignel et al 2008 made a characterization of MT genes in this species showing a conserved pattern compared to coastal crabs but a relative expression higher in the hydrothermal crab. High metal bioaccumulation in gill and pylorus is also reported in both shrimps species Mirocaris fortunata and Rimicaris exoculata. The bioaccumulation of metals is high in M. fortunata compared to R. exoculata although the latter lives closer to the hydrothermal flux, which would indicate a more efficient detoxification mechanism in this species (Kádár et al., 2006). (Zbinden and Cambon-Bonavita, 2003 report specific physico-chemical conditions in the gut of R. exoculata that favor the development of iron reducing Deferribacterales bacteria, suggesting that these bacteria could detoxify iron which would explain the presence of iron oxides in the gut shrimp, a mechanism that has not been well demonstrated in hydrothermal species. R. exoculata also possess mechanisms reported in other hydrothermal species and associated to metal exposure, principally the activation of MTs and antioxidant enzymatic activity (CAT, SOD, GST), which suggests that this species could be a good model to study response to metal exposure (Auguste et al., 2016). Arthropods: crabs and shrimps The decapod crustaceans are represented by the scavenging crab Segonzacia mesatlantica that is the only endemic crab described for the MAR and is well distributed within the three sites (MG, LS and RB) where it is found among mussel beds. The principal adaptation described in this species is the very high affinity of its hemocyanin for oxygen which is present at low concentration around vents (Chausson et al., 2004). A second crab species is Chaceon affinis that is not a hydrothermal species but is occasionally found near vents feeding upon mussels beds at Menez Gwen. The shrimps belonging to the endemic Alvinocarididae family are abundant at MAR vent fields, with three representative species reported: Rimicaris exoculata, R. (Chorocaris) chacei and Mirocaris fortunata. The first species is dominant at TAG, Logatchev and SnakePit sites but is also abundant at Rainbow (Desbruyères et al., 2000; Zbinden et al., 2004). It forms dense aggregates swimming close to chimneys walls. Symbiosis relationships have been described in these species with filamentous epibionts in the branchial chamber belonging to Epsilonproteobacteria and Gammaproteobacteria. however his relation with the energy supply are not well established (Petersen et al., 2010). Other specific symbiotic bacteria are found in the gut (Durand, 2010). R. (Chorocaris) chacei is found at LS where it is 34

39 less abundant and consequently less studied than R. exoculata, but it carries the same type of gill chamber symbiotic bacteria as R. exoculata although less developed (Gebruk, 2000). Mirocaris fortunata has been reported at MG and LS where its abundance is positively correlated with hydrothermal fluid flow (Sarrazin et al., 2014) suggesting that its nutritional requirements are obtained by grazing on free living bacteria. Molluscs: Bathymodiolus azoricus The mussels are represented by Bathymodiolinae species, a family that is well distributed in different hydrothermal systems across different oceans (Miyazaki et al., 2010). The systematic and phylogeny of bathymodiolin mussels have been studied in depth recently (Lorion et al., 2010, Thubaut et al., 2013) and the two species that are found at MAR vents belong to the genus Bathymodiolus sensu (Thubaut, 2013). B. puteoserpentis lives primarily around the deeper and southern vent sites Logatchev, TAG and SnakePit (Desbruyères et al., 2000). B. azoricus is abundant in the northern sites of the Atlantic, RB, LS and MG, forming large communities at the base and walls of vent chimneys (Sarrazin et al., 2014) (Figure 13). Both are mixotrophic species that obtain part of their energy through filtration but mostly rely on their symbiotic MOX and SOX bacteria located in the bacteriocytes of their gill epithelium (Le Bris and Duperron, 2010). Figure 13. Mussel bed assemblages of B. azoricus at Lucky Strike during the BioBaz cruise (Lallier, 2013) Bathymodiolus species have been the subject of many studies, with about 500 references in the Web of Science, including 200 related to B. azoricus. Among these, different aspects of the physiology of B. azoricus have been studied, revealing its adaptability to the hydrothermal vent environment and the relevance of gene expression changes affecting its physiological homeostasis. The principal aspects studied are the immune system in response 35
40 to bacteria exposure (Bettencourt et al., 2014, 2010; Martins et al., 2014, 2013), effect of postcapture acclimatization on immune genes expression (Barros et al., 2015), inter and intra site variation in symbiotic contents in gills (Guezi et al., 2014), the effect of pressure stress on symbiotic bacteria during capture (Szafranski et al., 2015), transcriptomic regulation in relation to symbiotic bacteria (Boutet et al., 2011), lysozymes activity in relation to symbiont content (Detree et al., 2016) and gill proteome differences between MG, LS and RB (Company et al., 2011). However, the eventual implication of the symbionts in heavy metals resistance or detoxification in B. azoricus have not been well studied, even knowing that some free living bacteria can show resistance to metals (Farias et al., 2015). Obviously, B. azoricus is physiologically adapted to high concentrations of different essential and non essential metals such as copper, iron, cadmium, zinc, manganese and lead, that have been found with significant concentrations in gill, mantle and digestive gland, although concentrations vary in relation to each vent site across the MAR (Cosson et al., 2008; Demina and Galkin 2008; Koschinsky et al., 2014). As has been described in other species, metals can cause oxidative stress and consequently activate the enzymatic machinery reducing this damage. In natural populations of B. azoricus differential tissue responses and also intra and inter site variations are reported for SOD and CAT activity. For example, the higher SOD activity is found in gills of Lucky Strike mussels, while CAT levels are higher in Rainbow mussels reflecting the specificity of antioxidative defense to the particular environmental condition (Bebianno et al., 2005). The specific response to certain metals has also been examined in experimental exposure to cadmium, where high levels of antioxidant enzymatic activity are present in gill compared to mantle but SOD and CAT show a significant inhibition in the first days of exposure before gradually increasing, however the levels of both enzymes were similar between control and metal exposed mussels suggesting an inhibitory effect of cadmium (Bebianno et al., 2005), evidencing that the mechanism of response to metal toxicity are not completely understood. Also the MT activity was measured the last two study, where no variation levels were detected across the contrasting environmental and additionally no variation were reported between control and cadmium exposed mussels which puts into question the role of MT in the detoxification mechanism of B. azoricus. At the molecular level the expression of genes involved in different physiological functions in B. azoricus mussels exposed to various metal cocktails simulating the gradient 36
41 found in MG, LS and RB sites suggest a shared regulation pattern between the three sites and, therefore, a global response to stress and metal exposure. Of course, some genes are regulated only in specific conditions, illustrating the plasticity of the response of this mussel (Bougerol et al., 2015). The understanding of the mechanisms of tolerance in this and other hydrothermal species remains a challenge in controlled conditions due principally to the difficulty of recreating the hydrothermal conditions in which this organism live, characterized by spatialtemporal variation that change in different orders of magnitude, which makes difficult the comparison of natural and experimental result, so a multidisciplinary approach must be developed with this species to get a better understanding of the physiological and evolutive mechanisms and adaptation to this extreme ecosystem. 7. Objectives The study of response of marine organisms exposed to different anthropogenic or natural xenobiotic agents has revealed a wide range of mechanisms that vary from molecular to physiological adaptations. Exposure to heavy metals is one of the most selective factors acting in marine aquatic ecosystems but the adaptive response of species in natural, experimental or anthropogenic contaminated areas has not been fully explained. Hydrothermal vents are widespread around the world and one of their characteristics is the high concentration of heavy metals that naturally emerge from the ocean crust. Endemic species living around vents have developed adaptive strategies to cope with these conditions, making these ecosystems a natural laboratory to study ecotoxicological responses. The Mid- Atlantic ridge (MAR) is one of the best explored areas in which several vents have been described with contrasted physico-chemical characteristics including metal content. Thus, we chose to study the response to metals of one of the most representative species living in three sites of the northern MAR, the mussel Bathymodiolus azoricus using a transcriptomic approach. To better understand how B. azoricus respond to different environmental metal concentrations, we determined the differential bioaccumulation of the most representative metals in different tissues across different natural B. azoricus populations in MAR, but also in a controlled experiment of metal exposure. 37
42 We focused on the study of specific molecular markers of response to metal exposure using a candidate gene approach to look at the quantitative expression of well described metal-related responsive genes but also potential new candidates. We conducted this analysis in different tissues and populations of B. azoricus with a particular interest for the diversity of genes families. We also perform a global gene expression study using microarrays to identify new physiological pathways involved in metal response, and consequently identify new potential molecular biomarkers that could be implemented in future ecotoxicological research. This work is divided in five chapters in which each one describes the result related to the objectives described above: Chapter I include a general introduction about ecotoxicology and hydrothermal vent ecosystems. Chapters II include the result of metal bioaccumulation in natural population of B. azoricus and the characterization and expression of metallothioneins (MTs) in these populations of MAR. Chapter III describes the metal bioaccumulation in controlled metal exposure experiment and the response of the oxidative stress, based in the expression levels of superoxide dismutase genes (SODs), in this mussels and also natural populations. Chapter IV describe the result from the expression of ferritins genes (Fer) involved in iron homeostasis across exposed metal mussels and natural populations and finally the Chapter V report the result of the gene expression profile in different tissues for natural populations, using microarrays as the molecular tool. The final pages comprise conclusion and future perspectives of this works. 38
43 Chapter II Article I: Metal accumulation and regulation of metal related gene expression in the hydrothermal vent mussel Bathymodiolus azoricus as a signature of environmental contamination. Gonzalo Fuenzalida 1,2, Francois H. Lallier 1,2, Ricardo D. Riso 3, Matthieu Waeles 3, Arnaud Tanguy 1,2 Corresponding author: atanguy@sb-roscoff.fr 1 Sorbonne Universités, UPMC Univ Paris 06, UMR 7144, Equipe ABICE, Station Biologique de Roscoff, Roscoff, France 2 CNRS, UMR 7144, Adaptation et Diversité en Milieu Marin, Station Biologique de Roscoff, Roscoff, France 3 Univ Bretagne Occidentale, IUEM, CNRS, LEMAR,UMR 6539,Grp Chim Marine, Pl N Copernic, F Plouzane, France This chapter is presented in the form of an article submitted to MARINE ENVIRONMENTAL RESEARCH 39
44 ABSTRACT Hydrothermal vent ecosystems are present throughout all the oceans, mainly in active volcanic areas. One of their main feature is the elevated concentration of metals present in the plume emerging from the earth's crust due to infiltration of seawater and sub-seafloor alteration. Despite the toxicity of heavy metals, these ecosystems are biologically highly productive. Bivalves of the genus Bathymodiolus are dominant species in most of these environments. B. azoricus, an endemic species distributed along the northern mid-atlantic ridge (MAR), has been described as highly tolerant to heavy metals with a strong accumulation in different tissues. In this work we describe the relative expression pattern of six metal-related genes in three tissues (gill, mantle and digestive gland) in seven mussel populations collected at three different hydrothermal sites on the Medio Atlantic Ridge (Menez Gwen, Lucky Strike and Rainbow), characterized by different concentrations of metals. Three of these genes correspond to classical MT sequences, two genes correspond to sequences related to putative cadmium tolerance protein and one encode a phytochelatin synthase gene. Quantification of eight essential and heavy metals was also conducted in the different tissues in order to establish putative correlation between gene expression and metal accumulation. Our results illustrate the variability of the expression of these genes at both intra- and inter-population level and the potential use of the association of the gene expression pattern with metal concentration in the different tissues as a biomarker for this species. We also evidenced that some metals concentrations are correlated with the abundance of chemosynthetic symbiotic bacteria present in the gills of B. azoricus. Keywords: hydrothermal, metal bioaccumulation, detoxication, gene expression, symbiont bacteria 1. Introduction Coastal marine mollusc species are permanently exposed to a wide variety of contaminants including pesticides, HAPs and metals that present a large range of concentrations and at both dissolved and particular states. Metal level in bivalve tissues are often considered as a good bio-indicator of the time-integrated response to bioavailable metal in food and water and are widely used in environmental monitoring programs (Langston and Spence, 1995; Boisson et al., 2003). In hydrothermal species, a huge bioaccumulation of metals is detected in different tissues such a in the clam Calyptogena magnifica (Roesijadi et al., 1985) or the mussels Bathymodiolus thermophilus (Rousse, 1999) and B. azoricus (Cosson et al., 2008) but metal 40
45 concentrations do not systematically reflect differences in the environmental parameters. It has been suggested that hydrothermal mussels may also exhibit specific adaptations to metal exposure allowing them to limit metal accumulation despite high concentrations in the fluid (Geret et al., 1998; Kádár et al., 2006a, 2006b). B. azoricus is a bivalve belonging to the Mytilidae family that is widely distributed in hydrothermal ecosystems, specifically described in Mid-Atlantic Ridge (MAR). The three main MAR vent sites (Menez Gwen, Lucky Strike and Rainbow) present contrasting physicochemical characteristics (Charlou et al., 2002; Desbruyères et al., 2001) and mussels form large communities at the base and walls of vent chimneys (Sarrazin et al., 2014). Previous works evidenced that B. azoricus accumulate essential (iron, copper, zinc) and non-essential (cadmium, mercury, lead) metals in different tissues like gills, mantle, digestive gland and foot with variations in metal bioaccumulation observed between sites in relation or not to the metal concentration present in the fluid (Cosson et al., 2008; Martins et al., 2011). B. azoricus also harbor dual symbiosis with two distinct sulphur- and methane-oxidizing bacteria located in the bacteriocytes in the gills epithelium (Duperron et al., 2005). Presence of symbionts has been described as an adaptive strategy for energy support in absence of photosynthesis but their putative role in metal content regulation by the host remains poorly documented. The cellular detoxification of metals is achieved by several molecular mechanisms in which metallothioneins (MTs) are involved. MTs are low molecular weight proteins with a high cysteine content (close to 30%) and are involved in cellular metal homeostasis and heavy metal detoxication (Kojima and Kagi, 1978; Isani and Carpenè, 2014). Although amino acid composition is variable, the cysteine content is always conserved with the presence of characteristic motif like Cys-Cys, Cys-X-Cys and Cys-X-Y-Cys, where X and Y are amino acids other than cysteine ( Kagi and Vallee, 1960; Hamer, 1986). These motifs contributes to the formation of the two structural domains α and β (Otvos et al., 1993). Apart from homeostasis of essential and non essential metals, other functions including protection against oxidative stress, free radical scavenger activity, immune response, genotoxicity and carcinogenicity have been reported (Asselman et al., 2012; Nordberg et al., 2009). Quantification of MTs in B. azoricus evidenced a specific tissue response with a higher protein concentration in gills and digestive gland compared to mantle and also revealed a very limited difference between vent sites (Bebianno et al., 2005; Martins et al., 2011) suggesting that MTs may be not the only mechanism involved in heavy metal detoxification. In other species, molecular binding peptides with similar function to MT have been described such as the phytochelatins (PCs). PCs are characterized by three amino acid forming a specific 41
46 structure (γ-glu-cys) n -Gly where n ranges from 2 to 11 repetition (Cobbett and Goldsbrough, 2002). Originally reported in plants as the major component of Cd-binding complexes (Grill et al., 1987), they have been evidenced in fungal species (Cobbett, 2000), and nematodes (Vatamaniuk et al., 2001). Existence of the PC synthase gene has been evidenced in A. californica, in the oyster C. gigas genome (Zhang et al., 2012) and in transcriptome of the hydrothermal mussel Bathymodiolus platifrons (Wong et al 20015) but his role and regulation in response to metal detoxification is not well documented. Bivalves have been described as good candidate for pollution biomonitoring mainly due to the high volume of water they filter for feeding and respiratory purposes and because of their ecological and/or commercial value (Paul-Pont et al., 2012). Due to the specificity of the hydrothermal habitat characterized by high metal concentrations, Bathymodiolin mussels could be are relevant models to investigate in more details the relationship between metal related gene expression and heavy metals toxicity in tissues. In this work we used a transcriptomic approach coupled to the quantification of metals in different tissues of several natural populations of B. azoricus living in three hydrothermal vent sites of the MAR. Our aim is to determine if both markers can be used as a proxy for metal fluxes in B. azoricus and identify specific gene regulation patterns that could be relied to metal contamination. We also addressed the question of the putative influence of symbiont content on metal concentration. 2. Materials and methods 2.1. Biological samples B. azoricus mussels were collected from Mid-Atlantic Ridge during the BIOBAZ cruise (Lallier, 2013) on the research vessel Pourquoi Pas? using the Remotely Operated Vehicle (ROV) Victor The collection was made in three different vents sites Menez Gwen (MG: N, W, 800m depth, three populations called MG2, MG3 and MG4), Lucky Strike (LS: N, W, 1700m depth, two populations called Tour Eiffel and Montsegur) and Rainbow (RB: N, W, 2300m depth, three populations called Termitière and Intermediate, Appendix A). The samples were placed in hermetic boxes then brought on board. Pieces of gills, mantle and digestive gland of each individual were immediately dissected in cold room and fixed in liquid nitrogen until further analysis. A total of 25 mussels per population was used for gene expression analysis RNA extraction, cdna sequencing, qpcr and symbiont content 42
47 The relative quantity of symbionts was estimated by real-time PCR on genomic DNA amplification according to the protocol available in Boutet et al., Total RNA of gills, mantle and gland digestive was extracted using Tri-Reagent (Sigma, St. Louis, MO) according to the manufacturer s instructions. Both quantity and quality of DNA were assessed via UV absorbance (OD260/280/230), using a Nanodrop ND-1000 spectrophotometer (Nanodrop Technologies, Delaware, USA). Two µg of total RNA were reverse transcribed using M-MLV reverse transcriptase (Promega, Madison, WI). Partial MTs and PCS sequences used in this study were obtained from Illumina sequences previously generated and deposited in Data Bank of Japan (DDBJ) Sequence Read Archive (DRA, with accession number DRA ). The MTs and Cd-bp sequences were completed using 5 -RACE and 3 -RACE in SMART TM race cdna Amplification Kit protocol (Clontech).. PCR products were gel-purified using the GeneClean III kit (Bio 101), cloned in pgem-t vector (Promega, Madison, WI), and sequenced by extension from both ends using T7 and Sp6 universal primers (T7 sequencing kit, Amersham Pharmacia Biotech, Uppsala, Sweden) using an ABI 3130xl automatic capillary sequencer at the Genomer platform (Roscoff, France). Sequences were edited using the Geneious software, version 7.1 (Kearse et al., 2012). For gene expression analysis, a volume of 2µl of each diluted reverse transcription product (1:200) was subjected to real-time PCR in a final volume of 5 µl containing 40 nm of each specific primer and 2 Lightcycler 480 SYBR Green I Master mix (Roche Diagnostics, Mannheim Germany). The amplification was carried out as follows: initial enzyme activation at 95 C for 15 min, then 45 cycles of 95 C for 10 sec and 60 C for 30 sec. A dissociation curve was generated and PCR efficiency was estimated for each primer pair. All primer pairs tested generated a single peak in the dissociation curve and a PCR efficiency of 95 to 100%. The ribosomal protein L15 gene (RpL15) was used as the internal PCR control as already used in previous studies (Guezi et al., 2014; Bougerol et al., 2015). All primers sequences used are presented in Table Metal concentrations in tissues For each population, three pools of gills, mantle and digestive gland tissues of 5 samples each were lyophilized. Sample digestions were done at 105 C in closed 15-mL Teflon screw-cap vials (Savillex, Minnetonka, USA) with 4 ml Suprapur 65 % nitric acid (Merck, Darmstadt, Germany) and 1 ml Suprapur 30% hydrogen peroxide (Merck). Measurements were then conducted on diluted mixtures (2.5% HNO 3 ) using different spectrometers operated at the Pole Spectrometry Ocean (PSO, Brest). Cu, Pb, Cd, Mn and Zn were determined using a 43
48 High-Resolution ICP (HR-ICP) mass spectrometer (Element 2, Thermo Scientific, Bremen, Germany) with a precision better than 3% (Cd, Cu, Pb) or 5% (Mn, Zn). Ca, Fe and Mg were determined with an inductively coupled plasma (ICP) optical emission spectrometer (Ultima 2, Horiba Jobin Yvon, Longjumeau, France) with a precision better than 1%. The certified reference materials used for assessment of the method accuracy were: DORM-4 (fish protein), DOLT-5 (dogfish liver) and TORT-3 (lobster hepatopancreas) from NRCC, and RM-8414 (bovine muscle) from NIST (Appendix B). All metal concentrations are expressed in µg g -1 dry weight of tissue Statistical analyses The relative expression of each gene was calculated according to the comparative Ct method using the formula RQ = ΔΔCt (with ΔCt gene X = Ct gene X Ct RpL15 and ΔΔCt= ΔCt gene X mean Ct gene X ). The first analysis was conducted to determine the inter-population effect in the variation of gene expression and the data were normalized by the mean Ct gene X of all populations for one tissue (gill, mantle or digestive gland). The second analysis was conducted to determine the intra-population effect of the expression and the data were normalized by the mean Ct gene X in the three tissues for each population. ANOVA test was used to evaluate differences in metal accumulation and relative expression considering populations and tissues as explanatory factors (R studio software). Canonical redundancy analysis (RDA) was used to evaluate the influence of metal accumulation in the variation of gene expression using the Vegan package (Oksanen et al 2016) in R environment. 3. Results 3.1. Metal concentrations in tissues Concentrations of the eight metals analyzed in the tissues are presented in Fig.1;Appen.1. Metal concentrations varied between populations and tissues but gills and digestive glands exhibited higher concentrations than mantle for several metals. Fe remain the higher enriched element (up to 9500 µg/g) followed by Zn (up to 6000 µg/g), Pb (up to 400 µg/g), Cu (up to 245 mg/ kg), then Cd (up to 30µg/g). Mg remains the most abundant element, followed by Ca and Mn. Results of statistical analysis of metal concentration between populations using ANOVA are presented in Table 2 and revealed that only calcium shows no significant differences between populations and tissues. Cadmium exhibits the highest concentration in gill especially in the two RB populations (Termitiére and Intermediate) and Tour Eiffel from LS (15,6; 21,4 and 30,5 µg/g respectively). A different picture is observed for the digestive 44
49 gland, with the highest concentrations being found in the two populations from MG (MG2 and MG3) and Tour Eiffel from LS (14,5; 16,9 and 19,2 µg/g respectively). No significant differences were found in mantle. A similar pattern is detected for copper with Tour Eiffel, Termitiére and Intermediate that exhibit the higher concentration in gills with 151,2; 187,7 and 104,4 µg/g respectively. Mussels from Termitiére populations also have the lowest levels of copper in both digestive gland and mantle compared to the other sites. For iron, no significant difference is observed in gills between populations. By contrast, in Intermediate and Termitiére populations, highest concentrations are found in digestive gland (8580 µg/g and 4400 ug/g respectively) and mantle (1920 µg/g 3580 µg/g respectively) (Fig.1). Lead concentrations vary between tissues with higher values observed in gills from LS and RB populations with a strong accumulation in Termitiére (581 µg/g). In digestive gland and in mantle, a similar pattern is observed even if concentrations remain lower compared to gills. Manganese concentrations present the same pattern for the three tissues with an increase of concentrations from MG to RB. Zinc shows significant differences between populations in gills and digestive gland but no specific hydrothermal site signature is observed. In gills, Intermediate and Tour Eiffel populations present high Zn concentration (5643 µg/g and 2400 µg/g respectively). In digestive gland, the difference observed is mainly due to the high concentration found in Tour Eiffel (1400 µg/g) and mantle do not show any significant differences between populations. Magnesium shows a significant higher concentration in the gills compared to mantle and digestive gland but no significance is found between sites. Correlation analysis made on all samples from the seven populations evidenced a strong positive correlation between some metals illustrating a conserved pattern of metal composition in the three tissues analyzed (Table 3, 4, 5). Correlation between iron and calcium and copper and manganese are close to Metal related genes characterization The alignment of the three new MT isoforms (MTa, MTb and MTc) with other bivalves MTs sequences is presented in Fig.2. The three MTs shared 50 to 90% of similarity with other bivalve species. The amino acids sequences are 64, 73 and 69 length for MTa, MTb and MTc respectively. All the sequences shared the traditional cysteine motif C-X-C and contain 21 Cys residues except MTc which contains only 20 Cys residues. The MTb isoform corresponds to the most conserved MT in regard with other bivalves MT sequences while MTa and MTc present more deletions. The two putative isoforms that could correspond to cadmium binding protein (called Cd-bp1 and Cd-bp2) according to a previous Blast result 45
50 obtained in E. granulosus are presented in Fig.3. Contrary to classical MTs, we do not observed a high content in Cys residue and a limited presence of C-X-C and C-X-X-C motifs. Although we can not assume that those genes correspond to classical MTs, we decided to keep them in our analysis. The phytochelatin synthase (PCS) gene sequence exhibits 453 amino acids of length and shares between 30% to 45% of similarity with PCS sequences from other species where a the principal similarities are reported in the first two hundreds amino acids (Fig.4) Metal related genes expression The analysis of gene expression of MTs, Cd-bp and PCS between populations and ANOVA test results are presented in Fig.5, Fig.6 and Table 6. In the three tissues, MTc showed the highest level of regulation with a low expression in the three tissues in Termitiére population, a high expression in the mantle of mussels from Montsegur and a higer expression in digestive gland of the three MG populations compared to the others populations. At a site scale, we do not identify any conserved pattern of gene regulation. We noticed that in gills, only MTb shows a lower expression in the three MG populations and a higher expression in the two RB populations. In LS, we observed an inverted pattern of expression of MTs when considering the two populations for the three tissues. In MG site, MG3 and MG4 populations present a relatively similar pattern of expression when MG2 shows an opposite regulation especially for gill and digestive gland. Details of the differences in the MTs expression between populations for each tissue are given in Appendix C, D and E. PCS expression exhibits a higher expression in gill in mussels from Intermediate population. PCS are also less expressed in the three tissues for MG4, Tour Eiffel and Termitiére populations. The relative expression of MTs, Cd-bp and PCS between tissues and ANOVA test results are presented in Fig.7, Fig.8 and Table 7. High intra population variations are reported for each population suggesting a tissue specific response of MTs and Cd-bp isoforms, but some patterns can be established. In all populations, the expression of MTa remains higher in gills compared to the two other tissues when expression of MTb remains lower for the mantle. MTb expression is higher in the digestive gland compared to mantle and gills for the three MG populations and is higher or similar in gills for the 4 other populations. For MTc, we noticed a global lower expression in the mantle, with the notable exception of the Montsegur population, and a global higher expression in gills compared to digestive gland. For Cd-bp2, the expression remains higher in the digestive gland for six of the seven populations and for Cd-bp1, we did not identify any clear pattern. A global lower expression of PCS is observed 46
51 in mantle for all populations (except MG3). No pattern conservation is detected between gill and digestive gland which exhibit opposite patterns according to populations RDA analysis The RDA analysis showed that the environmental variable metal concentration explained 21%, 14.6% and 17.4% of the variation in the expression of MTs in gills, mantle and digestive gland respectively (Fig. 9). RDA analysis showed that the eight metal analyzed have a significant influence on MT expression. In gills, the first two axes explained 15% of the variation in gene expression, mainly attributed to the correlation between MTb, Cd-bp1, Cd-bp2 with cadmium and manganese principally and MTa, and PCS with cadmium. In mantle, the first two axes explained 11% of the variation with a correlation observed between cadmium and PCS, followed by Cd-bp1, while Cd-bp2 is more correlated with the other metals. In the digestive gland, the first two axes explained 13% of the variation in the relative expression with a correlation between Cd-bp1, Cd-bp2, PCS with cadmium, MTb with iron and MTa and MTc with calcium Symbiotic content The abundance of SOX and MOX bacteria in the gills of the B. azoricus for the seven populations studied are shown in Fig.10. The SOX content did not show significant differences between populations except for Montsegur population which significantly differs from Eiffel Tower and Termitiére. The MOX content exhibited significant differences between populations characterized by an increased gradient of MOX from MG to RB (Fig.10). Correlation analyses between metal concentrations and symbiotic content revealed a number of significant relationships. Negative correlations are found for SOX and manganese (-0,15, p=0.05), copper (-0.20, p=0.01), cadmium (-0.19, p=0.01) and magnesium (-0.15, p=0.05) and positive correlations are detected for SOX and iron (0.21, p=0.01) (Fig.11). When considering MOX content, a positive correlation is observed with manganese (0.85, p=0.01), copper (0.62, p=0.01), cadmium (0.41, p=0.01), lead (0.69, p=0.01) and zinc (0.35, p=0.01) and a negative correlation with iron (-0.32, p=0.01) (Fig.12). 4. Discussion 4.1 Metal concentrations 47
52 Hydrothermal fluids contain variable concentrations of metals that exhibit strong variations according to vent sites due to various parameters including chemical composition of the basement rocks (basaltic and/or ultramafic) and intra-field dynamic characteristics including pressure (Bonatti, 1983; Charlou et al., 2002; Douville et al., 2002)). Mussels that are not living directly in contact with the fluids, are then filtering sea water containing diluted concentrations of metals which bioavailability also depend on the capacities to form precipitates with sulfide (Von Damm, 1995). For example, iron forms preferentially fine grained sulfide particles when Cu and Zn sulfides form large sized grains and more crystalline particles (Feely et al., 1987). Compared to other coastal bivalves, the available portion of soluble metal emerging from the vent and the levels are greater than those found in bivalves inhabiting coastal systems (Sakellari et al., 2013). However, combined with potential differences in storage or detoxification according to metals, the levels of metal bioaccumulation in mussels all the B. azoricus populations remain a relative good reflect of the variability of the vent fluid composition and represent the geochemical environmental signature. Differences in metal bioaccumulation between the three tissues reflect the existence of a metal organotropism in B. azoricus with a higher accumulation of Cd, Cu, Fe, Pb in gills and digestive gland compared to mantle. This is consistent with previous studies conducted on B. azoricus collected in the same area (Colaço et al., 2006; Cosson et al., 2008; Demina, 2008;) and for other hydrothermal vent species such B. puteoserpentis (Koschinsky et al., 2014; Smith and Flegal, 1989). Gills are the first permeable respiratory tissues in direct contact with the water and subsequent dissolved elements, the digestive gland is a secretory organ where the metal are transported for subsequent excretion when the mantle is mainly involved in the formation of the shell (Rainbow, 1997). Usually, in marine invertebrates, the digestive gland plays a role in the elimination of metabolic products, but in B. azoricus, the primary source of energy comes from the symbiosis with SOX and MOX symbionts (Duperron et al., 2005; Guezi et al., 2014), suggesting that the digestive gland could be mainly involved in storage and excretion of heavy metals. In gills, the mean concentrations of Cd, Cu, Pb, Mn showed an global increasing gradient from MG to RB populations (except Montsegur population at LS) in coherence with metal concentrations measured in the fluids by Charlou et al. (2002). Ca and Mg show no specific variation between populations as often observed probably due to the strong regulation in the numerous metabolic cellular processes in which they are involved (Bara et al., 1993). The low levels of iron observed in gills from RB mussels compared to mantle and digestive gland suggest the existence of a translocation process through the gills towards the other tissues and/or a subsequent excretion from gills. A 48
53 similar mechanism of organotropism has been described in other species of marine invertebrates for various heavy metals involving the presence of ligands (mainly proteins) which bind and transport the metallic ions through hemolymph to others organs (Al-Sid- Cheikh et al., 2013; Chalkiadak et al., 2014). This phenomenon is not observed in MG and LS sites, which present similar and lower iron signatures in their fluid composition. Calcium and magnesium have the highest levels of accumulation across the sites, but are less representative in the hydrothermal fluid (Charlou et al., 2002; Douville et al., 2002) so their high concentrations can be explained by their high concentration in sea water, with 1x10 4 µm and 1x10 5 µm respectively and their important physiological role in living organisms and particularly in bivalves. Magnesium is a cofactor for several enzymes whereas calcium is involved in many cellular transmembrane exchange processes (through calcium channels and Ca-ATPase pumps) (Toyoshima, 2009) and, in the case of bivalves, in the formation of the calcium carbonate shell (Li et al., 2004; Rousseau et al., 2003). Regarding lead, our results showed an increasing accumulation in gills samples from MG to RB, which is coherent with the lead concentrations in fluids. In previous studies, relatively low concentrations of lead was evidenced in samples from MG and RB (Demina, 2008). In our populations from RB (particularly Termitière), the lead concentration measured is close from those detected in gills of B. puteoserpentis collected at Snake Pit site by the same authors and at four hydrothermal vent sites on the same species (Koschinsky et al., 2014). Lead presents a clear organotropism, being mainly accumulated in gills with an increasing gradient between populations in accordance with Pb concentration in the fluids. This suggests a limited ability of mussels to regulate this metal in gills. In other bivalves species such as Dreissena polymorpha (Kraak et al., 1994), accumulation of lead has also been detected in gills. Lead and other metals are also known to be sequestrated and immobilized in lysozymes which could constitute the main storage site of metals before excretion (Nott, 1991). 4.2 Characterization and expression of MT, Cd-bp and PCS In highly variable and extreme habitats such as hydrothermal vents, the metal concentrations are higher than those found in most coastal ecosystems suggesting the existence of efficient metal detoxification or sequestration mechanisms in species inhabiting these ecosystems. In bivalves the characterization and induction of MTs after metal exposure has been widely investigated under controlled and natural conditions. In most studies, MTs expression levels increased in response to exposure (Tanguy and Moraga, 2001; Boutet et al., 2002; Dondero et al., 2005; Bourdineaud et al., 2006; Park et al., 2007; Aceto et al., 2011) but, in some cases, 49
54 no correlation is observed (Le et al., 2016). The two new specific sequences that could correspond to cadmium binding protein (Cd-bp1 and Cd-bp2) differ from classical MT structure mainly because of the limited number of cysteine motifs in the sequence. Although the specific function of this gene regarding metal sequestration has not been elucidated in marine invertebrates, our redundancy analysis showed a correlation of both genes expression and cadmium and manganese in gills, between Cd-bp1 and cadmium in mantle and between both genes and cadmium in digestive gland. Those data do not allow to conclude that these two genes are effective MTs or Cadmium binding proteins but at least, we evidenced a correlation between their expression and the metal content in some tissue. Additional analysis (i.e over-expression and functional tests) are needed to confirm or invalidate the ability of these two proteins to bind cadmium or other metals. The percentage of the total variance found in gene expression that can be explained by metal concentration range from 14 to 21% according to tissues; the remaining variance being attributed to other environmental variables such as temperature, salinity, which also affect the levels of MTs in bivalves (Le et al., 2016) and must be considered in future studies to get a better explanation about the pattern of MT expression in natural populations of B. azoricus. The diversity of MTs expression patterns observed in the three tissues at the Mid-Atlantic ridge scale strongly illustrates the effect of environmental parameters. Differences observed between populations and even inside the same vent site can reflect the different responses of B. azoricus to specific environmental variations at local scale. Few studies have measured the expression or levels of MTs in natural populations (Roesijadi, 1994; Mourgaud et al., 2002; Lavradas et al., 2016). Our RDA analysis suggests a relationship between MTs expression and heavy metal content in B. azoricus at the MAR scale with a high correlation of cadmium and manganese with MTb, Cd-bp1, Cd-bp2. Some of the gene expression patterns may be used to characterize populations such as the strong down-regulation of MTc in the three tissues of mussels from Termitiére or the global high expression levels of all MTs gene in gills samples from MG2 compared to MG3 and MG4. Involvment of PCS in mollusc species in response to metal detoxification is poorly illustrated. In a recent study, Wong et al 2016 identified a PCS gene in the hydrothermal mussel B. platifrons but do no detect any difference in expression level between gills, mantle and foot. In B. azoricus, the PCS expression shows differences between tissues according to the population suggesting environmental effect on the PCS regulation. Interestingly, difference in expression ratio between tissues remain relatively low suggesting a relative constitutive expression of this enzyme. We notice that PCS expression remains lower in 50
55 mantle for all the populations and that cadmium concentration in mantle is also lower. RDA analysis revealed a positive correlation between cadmium with PCS expression in the three tissues with different degree of correlation, which makes us confirm the implication of PCS in cadmium binding activity as demonstrated other species (Franchi et al., 2014; Vatamaniuk et al., 2005). Those results suggest that variations in MTs, Cd-bp and PCS levels and heavy metal bioaccumulation found across populations could reflect local environmental variations within a hydrothermal vent site. 4.3 Symbiont bacteria and heavy metal content The SOX and MOX symbiotic bacteria content strongly depends on the availability of substrates (i.e, sulfide and methane) and comparisons over years could reflect relative temporal fluctuations (Halary et al., 2008; Szafranski et al., 2015; Guezi et al., 2014). The low differences in SOX content observed in our populations could reflect a similar sulfide concentrations in the three vent sites and the slightly higher SOX content observed in MG populations compared to RB populations could be partly explained but the interaction between sulfides and iron at RB that may lead to a decrease of available sulfide for organisms (Le Bris and Duperron, 2010). We observed an increasing gradient of the MOX content from MG to RB as previously reported by Szafranski et al 2015 and this result is in accordance with the higher level of methane available at RB (Charlou et al, 2002). In this study, we looked for correlations between metal accumulation and symbiont content. Indeed, previous studies showed that both SOX and MOX bacteria exhibited high levels of iron, copper and zinc (Kadar et al 2006b). The ability of tolerate high concentrations of metals has also been previously evidenced for hydrothermal free-living bacteria (Silver and Phung, 1996; Wang et al., 1997). In the sponge Spongia officinalis and the hydrothermal polychaetes Alvinella pompejana and A. caudata, the high heavy metal tolerance of their isolated bacteria exposed to different metals suggested a possible contribution of these bacteria to the mechanism of metal resistance (Bauvais et al., 2015; Jeanthon and Prieur, 1990). Our results indicate that some significant correlations are observed between metal and bacteria content in gills suggesting that symbiotic bacteria may strongly contribute to metal uptake and sequestration in this species limiting the toxic effect of those metals for B. azoricus and then contributing to the accumulation of metals at least in gills. The positive correlation of MOX levels with Mn, Cu, Cd, Pb, Zn, and SOX levels with Fe, and the negative correlation of MOX with Fe and SOX with Mn, Cu, Cd and Mg, also suggest that both bacteria may have a different role in heavy metal homeostasis in the gills of B. azoricus. 51
56 In conclusion, this study make appear B. azoricus as a useful bioindicator species for hydrothermal habitats subject to metal enrichments. Indeed, both tissue metal signature and metal detoxication related gene expression pattern provided insight into the biological stress responses of mussels and allowed to distinguish vent sites. Additional analysis mainly based on MT properties have to be conducted through over-expression of all MTs isoforms and more specially the two potential Cd-MTs. 5. Acknowledgements The authors thank the crew and pilots of the Pourquoi Pas? vessel and the ROV Victor6000 for their assistance an technical support in sampling during the BIOBAZ 2013 cruise. This study was funded in part by a JST/CNRS project. G.F was supported by a Chilean phd grant (Becas Chile (CONICYT)) for the PhD grant. 6. References Aceto, S., Formisano, G., Carella, F., De Vico, G., Gaudio, L., The metallothionein genes of Mytilus galloprovincialis: genomic organization, tissue expression and evolution. Mar. Genomics. 4, Al-Sid-Cheikh, M., Rouleau, C., Pelletier, E., Tissue distribution and kinetics of dissolved and nanoparticulate silver in Iceland scallop (Chlamys islandica). Mar. Environ. Res. 86, Asselman, J., Glaholt, S.P., Smith, Z., Smagghe, G., Janssen, C.R., Colbourne, J.K., Shaw, J.R., De Schamphelaere, K.A.C., Functional characterization of four metallothionein genes in Daphnia pulex exposed to environmental stressors. Aquat. Toxicol , Bara, M., Guiet-Bara, A., Durlach, J., Regulation of sodium and potassium pathways by magnesium in cell membranes. Magnes. Res. 6, Bauvais, C., Zirah, S., Piette, L., Chaspoul, F., Domart-Coulon, I., Chapon, V., Gallice, P., Rebuffat, S., Perez, T., Bourguet-Kondracki, M.L., Sponging up metals: Bacteria associated with the marine sponge Spongia officinalis. Mar. Environ. Res. 104, Bebianno, M.J., Company, R., Serafim, A., Camus, L., Cosson, R.P., Fiala-Médoni, A.,
57 Antioxidant systems and lipid peroxidation in Bathymodiolus azoricus from Mid- Atlantic Ridge hydrothermal vent fields. Aquat. Toxicol. 75, Beinart, R. a, Sanders, J.G., Faure, B., Sylva, S.P., Lee, R.W., Becker, E.L., Gartman, A., Luther, G.W., Seewald, J.S., Fisher, C.R., Girguis, P.R., Evidence for the role of endosymbionts in regional-scale habitat partitioning by hydrothermal vent symbioses. Proc. Natl. Acad. Sci. U. S. A. 109, Boisson, F., Goudard, F., Durand, J.P., Barbot, C., Pieri, J., Amiard, J.C., Fowler, S.W., Comparative radiotracer study of Cd uptake storage, detoxication and depuration in the oyster Crassostrea gigas : potential adaptive mechanisms. Mar. Ecol. Prog. Ser. 254, Bonatti, E., Hydrothermal metal deposits from the oceanic rifts: a classification. NATO Conf. Ser. 12, Bougerol, M., Boutet, I., LeGuen, D., Jollivet, D., Tanguy, A., Transcriptomic response of the hydrothermal mussel Bathymodiolus azoricus in experimental exposure to heavy metals is modulated by the Pgm genotype and symbiont content. Mar. Genomics. 21, Bourdineaud, J.-P., Baudrimont, M., Gonzalez, P., Moreau, J.-L., Challenging the model for induction of metallothionein gene expression. Biochimie 88, Boutet, I., Ripp, R., Lecompte, O., Dossat, C., Corre, E., Tanguy, A., Lallier, F.H., Conjugating effects of symbionts and environmental factors on gene expression in deepsea hydrothermal vent mussels. BMC Genomics 12, 530. Boutet, I., Tanguy, A., Auffret, M., Riso, R., Moraga, D., Immunochemical quantification of metallothioneins in marine mollusks: characterization of a metal exposure bioindicator. Environ. Toxicol. Chem. 21, Chalkiadak, O., Dassenakis, M., Lydakis-Simantiris, N., Bioconcentration of Cd and Ni in various tissues of two marine bivalves living in different habitats and exposed to heavily polluted seawater Olga. Chem. Ecol. 30, Charlou, J.L., Donval, J.P., Fouquet, Y., Jean-Baptiste, P., Holm, N., Geochemistry of high H2 and CH4 vent fluids issuing from ultramafic rocks at the Rainbow hydrothermal field (36 14 N,MAR). Chem. Geol. 191,
58 Cobbett, C.S., Phytochelatins and their roles in heavy metal detoxication. Plant Physiology 123, Cobbett, C.S., Goldsbrough, P., Phytochelatins and metallothioneins: roles in heavy metal detoxification and homeostasis. Annu. Rev. Plant. Biol. 53, Colaço, A., Bustamante, P., Fouquet, Y., Sarradin, P.M., Serrão-Santos, R., Bioaccumulation of Hg, Cu, and Zn in the Azores triple junction hydrothermal vent fields food web. Chemosphere 65, Cosson, R.P., Thiébaut, É., Company, R., Castrec-Rouelle, M., Colaço, A., Martins, I., Sarradin, P.M., Bebianno, M.J., Spatial variation of metal bioaccumulation in the hydrothermal vent mussel Bathymodiolus azoricus. Mar. Environ. Res. 65, Demina, L.L, Galkin, S.V., On the role of abiogenic factors in the bioaccumulation of heavy metals by the hydrothermal fauna of the Mid-Atlantic Ridge. Oceanology 48, Desbruyères, D., Biscoito, M., Caprais, J.C., Colaço, A., Comtet, T., Crassous, P., Fouquet, Y., Khripounoff, A., Le Bris, N., Olu, K., Riso, R., Sarradin, P.M., Segonzac, M., Vangriesheim, A., Variations in deep-sea hydrothermal vent communities on the Mid-Atlantic Ridge near the Azores plateau. Deep. Res. Part I. Oceanogr. Res. Pap. 48, Dondero, F., Piacentini, L., Banni, M., Rebelo, M., Burlando, B., Viarengo, A., Quantitative PCR analysis of two molluscan metallothionein genes unveils differential expression and regulation. Gene 345, Douville, E., Charlou, J.L., Oelkers, E.H., Bienvenu, P., Jove Colon, C.F., Donval, J.P., Fouquet, Y., Prieur, D., Appriou, P., The rainbow vent fluids (36 14'N, MAR): The influence of ultramafic rocks and phase separation on trace metal content in Mid- Atlantic Ridge hydrothermal fluids. Chem. Geol. 184, Duperron, S., Bergin, C., Zielinski, F., Blazejak, A., Pernthaler, A., McKiness, Z.P., DeChaine, E., Cavanaugh, C.M., Dubilier, N., A dual symbiosis shared by two mussel species, Bathymodiolus azoricus and Bathymodiolus puteoserpentis (Bivalvia: Mytilidae), from hydrothermal vents along the northern Mid-Atlantic Ridge. Environ. Microbiol. 8,
59 Duperron, S., Nadalig, T., Caprais, J.C., Sibuet, M., Fiala-Médioni, A., Amann, R., Dubilier, N., Dual symbiosis in a Bathymodiolus sp. mussel from a methane seep on the Gabon Continental Margin (Southeast Atlantic): 16S rrna phylogeny and distribution of the symbionts in gills. Appl. Environ. Microbiol. 71, Feely, R.A., M. Lewison, G.J. Massoth, G. Rober-Baldo, J.W. Lavelle, R.H. Byrne, K.L. Von Damm, Curl, H.C Composition and dissolution of black smoker particulates from active vents on the Juan de Fuca Ridge. J. Geophys. Res Franchi, N., Piccinni, E., Ferro, D., Basso, G., Spolaore, B., Santovito, G., Ballarin, L., Characterization and transcription studies of a phytochelatin synthase gene from the solitary tunicate Ciona intestinalis exposed to cadmium. Aquat. Toxicol. 152, Geret, F., Rousse, N., Riso, R., Sarradin, P.M., Cosson, R.P., Metal compartimentalization and metallothionein isoforms in mussels from the Mid-Atlantic Ridge: premilary approach to the fluid-organism relationship. Cah. Biol. Mar. 39, Grill E, Winnacker EL, Zenk MH Phytochelatins, a class of heavy-metal-binding from plants, are functionally analogous to metallothioneins. Proc. Nat. Acad. Sci, USA. 84, Guezi, H., Boutet, I., Andersen, A.C., Lallier, F.H., Tanguy, A., Comparative analysis of symbiont ratios and gene expression in natural populations of two Bathymodiolus mussel species. Symbiosis 63, Hamer, D.H., Metallothionein. Ann. Rev. Biochem. 55, Halary, S., Riou, V., Gaill, F., Boudier, T., Duperron, S., D FISH for the quantification of methane- and sulphur-oxidizing endosymbionts in bacteriocytes of the hydrothermal vent mussel Bathymodiolus azoricus. The ISME Journal 2, Isani, G., Carpenè, E., Metallothioneins, unconventional proteins from unconventional animals: a long journey from nematodes to mammals. Biomolecules 4, Jeanthon, C., Prieur, D., Susceptibility to Heavy Metals and Characterization of Heterotrophic Bacteria Isolated from Two Hydrothermal Vent Polychaete Annelids, Alvinella pompejana and Alvinella caudata. Appl. Environ. Microbiol. 56(11),
60 Kádár, E., Costa, V., Santos, R.S., Powell, J.J., 2006a. Tissue partitioning of micro-essential metals in the vent bivalve Bathymodiolus azoricus and associated organisms (endosymbiont bacteria and a parasite polychaete) from geochemically distinct vents of the Mid-Atlantic Ridge. J. Sea Res. 56, Kádár, E., Santos, R.S., Powell, J.J., 2006b. Biological factors influencing tissue compartmentalization of trace metals in the deep-sea hydrothermal vent bivalve Bathymodiolus azoricus at geochemically distinct vent sites of the Mid-Atlantic Ridge. Environ. Res. 101, Kagi, J.H.R., Vallee, B.L., Metallothionein : a cadmium- and zinc-containing protein from equine renal cortex. J. Biol. Chem. 235, Kearse, M., Moir, R., Wilson, A., Stones-Havas, S., Cheung, M., Sturrock, S., Buxton, S., Cooper, A., Markowitz, S., Duran, C., Thierer, T., Ashton, B., Meintjes, P., Drummond, A., Geneious Basic: An integrated and extendable desktop software platform for the organization and analysis of sequence data. Bioinformatics 28, Kojima, Y., Kägi, J.H.R., Metallothionein. Trends Biotechnical Science, 3, Koschinsky, A., Kausch, M., Borowski, C., Metal concentrations in the tissues of the hydrothermal vent mussel Bathymodiolus: Reflection of different metal sources. Mar. Environ. Res. 95, Kraak, M., Wink, Y., Stuijfzand, S., Buck-de Jong, M., Groot, C., Admiraal, W., Chronic ecotoxicity of Zn and Pb to the zebra mussel Dreissena polymorpha. Aquat. Toxicol. 30, Langston, W.J., Spence, S.K., Biological factors involved in metal concentrations observed in aquatic organisms. Environ. Sci. Technol. 26, Lavradas, R.T., Rocha, R.C.C., Bordon, I.C.A.C., Saint Pierre, T.D., Godoy, J.M., Hauser- Davis, R.A., Differential metallothionein, reduced glutathione and metal levels in Perna perna mussels in two environmentally impacted tropical bays in southeastern Brazil. Ecotoxicol. Environ. Saf. 129, Le, T.T.Y., Zimmermann, S., Sures, B., How does the metallothionein induction in bivalves meet the criteria for biomarkers of metal exposure? Environ. Pollut. 212,
61 Le Bris, N. and Duperron, S., In: Chemosynthetic communities and biogeochemical energy pathways along the Mid-Atlantic Ridge: The case of Bathymodiolus azoricus. Am. Geophys. Union, Washington D.C. 188: 9. Li, S., Xie, L., Zhang, C., Zhang, Y., Gu, M., Zhang, R., Cloning and expression of a pivotal calcium metabolism regulator: Calmodulin involved in shell formation from pearl oyster (Pinctada fucata). Comp. Biochem. Physiol. - B Biochem. Mol. Biol. 138, Martins, I., Cosson, R.P., Riou, V., Sarradin, P.M., Sarrazin, J., Santos, R.S., Colaço, A., Relationship between metal levels in the vent mussel Bathymodiolus azoricus and local microhabitat chemical characteristics of Eiffel Tower (Lucky Strike). Deep. Res. Part I Oceanogr. Res. Pap. 58, Mourgaud, Y., Martinez, E., Geffard, A., Andral, B., Stanisiere, J.-Y., Amiard, J.-C., Metallothionein concentration in the mussel Mytilus galloprovincialis as a biomarker of response to metal contamination: validation in the field. Biomarkers 7, Nordberg, G.F., Jin, T., Wu, X., Lu, J., Chen, L., Lei, L., Hong, F., Nordberg, M., Prevalence of kidney dysfunction in humans - Relationship to cadmium dose, metallothionein, immunological and metabolic factors. Biochimie 91, Nott, J.A Cytology of pollutant metals in marine invertebrates: a review of microanalytical applications. Scan. Microsc. 5, Oksanen, J., Blanchet, F. G., Kindt, R., Legendre, P., Minchin, P. R., O Hara, R. B., Simpson, G. L., Solymos, P., Henry, M., Stevens, H., and Wagner, H., Vegan: Community Ecology Package, available at: Otvos, J.D., Liu, X., Li, H., Shen, G.,Basti, M Dynamic aspects of metallothionein structure; In Suzuki, K.T., Imura, N. and Kimura, M. (eds), Metallothionein III: biological Roles and Medical Implications. Birkhauser Verlag, Basel, Park, H., Ahn, I.Y., Choi, H.J., Pyo, S.H., Lee, H.E., Cloning, expression and characterization of metallothionein from the Antarctic clam Laternula elliptica. Protein Expr. Purif. 52, Paul-Pont, I., Gonzalez, P., Montero, N., de Montaudouin, X., Baudrimont, M., Cloning, characterization and gene expression of a metallothionein isoform in the edible 57
62 cockle Cerastoderma edule after cadmium or mercury exposure. Ecotoxicol. Environ. Saf. 75, Rainbow, P.S Trace metal accumulation in marine invertebrates: marine biology or or marine chemistry? J. Mar. Biol. Ass. 77, Roesijadi, G., Metallothionein induction as a measure of response to metal exposure in aquatic animals. Environ. Health. Perspect. 102, Roesijadi, G., Young, J.S., Crecelius, E.A., Thomas, L.E., Distribution of trace metals in the hydrothermal vent clam, Calyptogena magnifica. Bull. Biol. Soc. Washington, 6, Rousse, N., La bioaccumulation des métaux et les procédés de détoxication chez le mollusque bivalve symbiotique dépendant de la chimiosynthèse, Bathymodiolus sp. Ph.D. thesis, Université P & M. Curie, Paris. Rousseau, M., Plouguerné, E., Wan, G., Wan, R., Lopez, E., Fouchereau-Peron, M., Biomineralisation markers during a phase of active growth in Pinctada margaritifera. Comp. Biochem. Physiol. - A Mol. Integr. Physiol. 135, Sakellari, A., Karavoltsos, S., Theodorou, D., Dassenakis, M., Scoullos, M., Bioaccumulation of metals (Cd, Cu, Zn) by the marine bivalves M. galloprovincialis, P. radiata, V. verrucosa and C. chione in Mediterranean coastal microenvironments: association with metal bioavailability. Environ. Monit. Assess. 185, Sarrazin, J., Cuvelier, D., Peton, L., Legendre, P., Sarradin, P.M., High-resolution dynamics of a deep-sea hydrothermal mussel assemblage monitored by the EMSO- Açores MoMAR observatory. Deep. Res. Part I Oceanogr. Res. Pap. 90, Silver, S., Phung, L.T., Bacterial heavy metal resistance: New Surprises. Annu. Rev. Microbiol. 50, Smith, D.R., Flegal, A.R., Elemental concentrations of hydrothermal vent organisms from the Galfipagos Rift. Mar. Biol. 102, Szafranski, K.M., Piquet, B., Shillito, B., Lallier, F.H., Duperron, S., Relative abundances of methane- and sulfur-oxidizing symbionts in gills of the deep-sea hydrothermal vent mussel Bathymodiolus azoricus under pressure. Deep. Res. Part I Oceanogr. Res. Pap. 101,
63 Toyoshima, C., How Ca2+-ATPase pumps ions across the sarcoplasmic reticulum membrane. Biochim. Biophys. Acta. Mol. Cell. Res. 1793, Vatamaniuk, O.K., Bucher, E.A., Ward, J.T., Rea, P.A., A new pathway for heavy metal detoxication in animals phytochelatin synthase is required for cadmium tolerance in Caenorhabditis elegans. J. Biol. Chem. 276, Vatamaniuk, O.K., Bucher, E.A., Sundaram, M. V, Rea, P.A., CeHMT-1, a putative phytochelatin transporter, is required for cadmium tolerance in Caenorhabditis elegans. J. Biol. Chem. 280, Von Damm, K.L., Controls on the chemistry and temporal variability of seafloor hydrothermal fluids. In: Humphris S.E., Zierenberg R.A., Mullineaux L.S., Thomson R.E. (eds) Geophysical Monograph Series. American Geophysical Union, Washington, D. C., pp Wang, C.L., Michels, P.C., Dawson, S.C., Kitisakkul, S., Baross, J., Clark, D.S., Cadmium removal by a new strain of Pseudomonas aeruginosa in aerobic culture. Cadmium Removal by a New Strain of Pseudomonas aeruginosa. Aerobic Culture 63, Wong, Y.H., Sun, J., He, L.S., Chen, L.G., Qiu, J.-W., Qian, P.-Y., High-throughput transcriptome sequencing of the cold seep mussel Bathymodiolus platifrons. Sci. Rep. 5, Zhang, G., Fang, X., Guo, X., Li, L., Luo, R., Xu, F., Yang, P., Zhang, L., Wang, X., Qi, H., Xiong, Z., Que, H., Xie, Y., Holland, P.W.H., Paps, J., Zhu, Y., Wu, F., Chen, Y., Wang, J., Peng, C., Meng, J., Yang, L., Liu, J., Wen, B., Zhang, N., Huang, Z., Zhu, Q., Feng, Y., Mount, A., Hedgecock, D., Xu, Z., Liu, Y., Domazet-Lošo, T., Du, Y., Sun, X., Zhang, S., Liu, B., Cheng, P., Jiang, X., Li, J., Fan, D., Wang, W., Fu, W., Wang, T., Wang, B., Zhang, J., Peng, Z., Li, Y., Li, N., Wang, J., Chen, M., He, Y., Tan, F., Song, X., Zheng, Q., Huang, R., Yang, H., Du, X., Chen, L., Yang, M., Gaffney, P.M., Wang, S., Luo, L., She, Z., Ming, Y., Huang, W., Zhang, S., Huang, B., Zhang, Y., Qu, T., Ni, P., Miao, G., Wang, J., Wang, Q., Steinberg, C.E.W., Wang, H., Li, N., Qian, L., Zhang, G., Li, Y., Yang, H., Liu, X., Wang, J., Yin, Y., Wang, J., The oyster genome reveals stress adaptation and complexity of shell formation. Nature 490,
64 60
65 7. Figures and tables Table 1. Primers used in qpcr, RACE amplification of metal related genes and SOX and MOX bacteria content quantification. Gene name Primers sequence (5-3 ) Method MTa F: CTAGCGTATGCATCTGTGGAACTG qpcr - RACE R: CAAGAAGAAGTACATCCGACACCG MTb F: ATGTAGCGGAGAAGGTTGCC qpcr - RACE R: GGTCCAGTACATCCGACACC MTc F: AACTGCGCCGACATCTGCGGCACCGG qpcr R: CAAGAAGATGGTCCAGTACATCCG Cd-bp1 F: GCAGACCACTTTTCTAAGGCAG qpcr R: GGTACTTGCTTGTCCTGCTCT Cd-bp1 F: GTTTACAATTGTTGTTTTCAT RACE R: ACATTGTTGTATTTGTAGGACAA Cd-bp2 F: TGGAAGGCCGACAAGAAGTC qpcr R: ACATTGCATCATGGACACACC Cd-bp2 F: TGTGTCGTAAAGTAGTTCAA RACE R: GCACAGTCCTCCTGCATGTA PCS F: CGATTTATCTGTCGCTTTCATGGC qpcr R: AGTTCTTGGTCAAACTGGAGATGG MDH F: ATGGAGGAAAGAGATATGGCACTGAGCGT qpcr R: TAACATTAAACATAGCCTAGGAACCTAATG SOX (16S) F: GAGTAACGCGTAGGAATCTGC qpcr R: CGAAGGTCCTCCACTTTACTCCATAGAG MOX (16S) F: GTGCCAGCMGCCGCGGTAA qpcr R: GCTCCGCCACTAAGCCTATAAATAGACC RbL15 F: TATGGTAAACCTAAGACACAAGGAGT qpcr R: TGGAATGGATCAATCAAAATGATTTC 61
66 MG2 MG3 MG4 Montsegur Tour Eiffel Termitiére Intermediate MG2 MG3 MG4 Montsegur Tour Eiffel Termitiére Intermediate Gill Mantle Dig. glande MG2 MG3 MG4 Montsegur Tour Eiffel Termitiére Intermediate MG2 MG3 MG4 Montsegur Tour Eiffel Termitiére Intermediate Fig 1. Average concentration and standard deviation of each metal analyzed in the three tissues gill, mantle and digestivegland in the seven populations. 62
67 MG2 MG3 MG4 Montsegur Tour Eiffel Termitiére Intermediate MG2 MG3 MG4 Montsegur Tour Eiffel Termitiére Intermediate Gill Mantle Dig. glande MG2 MG3 MG4 Montsegur Tour Eiffel Termitiére Intermediate MG2 MG3 MG4 Montsegur Tour Eiffel Termitiére Intermediate Fig 1. Continued. 63
68 Table 2. Analysis of variance (Anova) between populations for each metal measured in the three tissues. Metal Tissue Df MS F p-value Cadmium Gill e-06 Mantle Digestive gland e-04 Copper Gill Mantle e-05 Digestive gland Iron Gill Mantle e-05 Digestive gland Lead Gill e-10 Mantle e-10 Digestive gland e-04 Calcium Gill Mantle Digestive gland Manganese Gill Mantle e-05 Digestive gland Zinc Gill e-05 Mantle Digestive gland e-06 Magnesium Gill Mantle e-04 Digestive gland
69 Table 3. Correlation analysis (r 2 ) between metals in gill. Manganese Copper Cadmium Lead Magnesium Calcium Iron Zinc Manganese Copper Cadmium Lead Magnesium Calcium Iron Zinc - Table 4. Correlation analysis (r 2 ) between metals in mantle. Manganese Copper Cadmium Lead Magnesium Calcium Iron Zinc Manganese Copper Cadmium Lead Magnesium Calcium Iron Zinc - Table 5. Correlation analysis (r 2 ) between metals in digestive gland. Manganese Copper Cadmium Lead Magnesium Calcium Iron Zinc Manganese Copper Cadmium Lead Magnesium Calcium Iron Zinc - 65
, B. thermophilus(mt10: CAE11860.1; MT20: Hardivillier et al 2004), B. azoricus (MT10: CAF34421.1; MT20: CAF34424.")
.")
70 Fig.2 Alignment of MTs sequences. The cysteine motifs are highlighted in grey. Accession number M. edulis (MT10: AAB ; MT20: P ), B. thermophilus(mt10: CAE ; MT20: Hardivillier et al 2004), B. azoricus (MT10: CAF ; MT20: CAF ), C. gigas (CAB ), M. galloprovincialis (AAT ) and B. platifrons (from Wong et al 2016). Fig.3 Alignment of the two putative B. azoricus cadmium binding protein sequences (E. granulosus accession number: EUB ).Conserved amino acids are highlighted in grey. 66
, H. vulgaris (XP_002156317), E. fetida (ABR13683), A. californica (XP_005110845.1) and C. gigas (EKC27807.")
71 Fig.4 Alignment of the PCS sequences. Conserved amino acids are highlighted in grey. Accession numbers: A. thaliana (Q9ZWB7), O. bimaculoides (XP_ ), H. vulgaris (XP_ ), E. fetida (ABR13683), A. californica (XP_ ) and C. gigas (EKC ). 67
72 +!!"#$%&!!"#$%'! ()*!! ()*"! ()*#! "#$#%!&'#$ ()*+,!-./0+#! 120$34'!!,!!"#$%&!!"#$%'! ()*!! ()*"! ()*#! "#$#%!&'#$! ()*+,!-./0+#! 120$34'!! 68
73 !!!"#$%&!!"#$%'! ()*!! ()*"! ()*#! "#$#%!&'#$! ()*+,!-./0+#! 120$34'!! Fig 5. Relative expression (fold change) of MTs and putative cadmium binding proteins genes between the 7 populations in A) gill, B) mantle and C) digestive gland. Gene expression is normalised by the mean deltact value of genes in all samples for each tissue.!!! 69
74 MG2 MG3 MG4 T. Eiffel Montsegur Termitiére Intermediate Fig 6. Relative expression (fold change) of PCS gene between the 7 populations in gill, mantle and digestive gland. Gene expression is normalised by the mean deltact value of genes in all samples for each tissue. Table 6. Results of the Global ANOVAanalysis between populations for MTs, putative cadmium 70
75 binding proteins and PCS relative expression in the seven populations for each tissue. Tissue Response Df MS F p-value Cd-bp Cd-bp e-05 Gill MT-a MT-b MT-c e-16 PCS e-10 Cd-bp Cd-bp Mantle MT-a e-06 MT-b MT-c e-15 PCS e-7 Cd-bp Cd-bp Dig. gland MT-a MT-b e-05 MT-c e-16 PCS e-10 71
76 Cd-bp1 Cd-bp2 MT a MT b MT c Cd-bp1 Cd-bp2 MT a MT b MT c Gill Mantle Digestive gland Gill Mantle Digestive gland Cd-bp1 Cd-bp2 MT a MT b MT c Cd-bp1 Cd-bp2 MT a MT b MT c Gill Mantle Digestive gland Gill Mantle Digestive gland Cd-bp1 Cd-bp2 MT a MT b MT c Cd-bp1 Cd-bp2 MT a MT b MT c Gill Mantle Digestive gland Gill Mantle Digestive gland Cd-bp1 Cd-bp2 MT a MT b MT c Fig. 7 Relative expression (fold change) of the three MTs and putative cadmium binding proteins genes between the three tissues in each population. Gene expression is normalized by the mean deltact value of genes in all tissues for each population. Gill Mantle Digestive gland 72
77 Table 7. Results of the Global Anova analysis conducted on the relative expression of MTs, putative cadmium binding proteins and PCS between the three tissues for each population. Population Response Df MS F p-value MG-2 Cd-bp Cd-bp MT-a e-05 MT-b MT-c e-08 PCS MG-3 Cd-bp Cd-bp MT-a MT-b e-05 MT-c PCS MG-4 Cd-bp Cd-bp MT-a MT-b e-06 MT-c e-06 PCS Tour Eiffel Cd-bp Cd-bp MT-a MT-b e-06 MT-c e-06 PCS e-6 Montsegur Cd-bp Cd-bp MT-a MT-b e-07 MT-c e-07 PCS e-5 Termitiére Cd-bp Cd-bp MT-a MT-b e-09 MT-c e-01 PCS Intermediate Cd-bp Cd-bp MT-a MT-b e-06 MT-c e-03 PCS
78 !!! Fig. 8 Relative expression (fold change) of PCS gene between the 7 populations in gill, mantle and digestive gland. Gene expression is normalized by the mean deltact value of genes in all samples for each tissue.!! 74
79 MT-a PCS MT-b Cd-bp1 Cd-bp2 MT-c Cd-bp2 MT-b MT-c MT-a Cd-bp1 PCS 75
80 MT-a MT-c Cd-bp2 MT-b Cd-bp1 PCS Fig 9. Global redundancy analysis (RDA) for metal concentration and relative gene expression in each tissue for the seven populations. The angle between arrows represents the degree of correlation between variables. 76
81 Relative quantification 1400,0 1200,0 1000,0 800,0 600,0 400,0 200,0 0,0 SOX a a b b Menez Gwen Lucky Strike Rainbow Relative quantification 100,0 80,0 60,0 40,0 20,0 0,0 a d e b f c g h MOX d g j k i l e f h i j m Menez Gwen Lucky Strike Rainbow a b c k l m Fig 10 Thiotrophic (SOX) and methanotrophic (MOX) symbiont content in the seven populations studied. Significant differences are represented by letters. For SOX: a=tour Eiffel/Montsegur and b=montsegur/termitiére. For MOX: a=mg2/intermediate, b=mg3/intermediate, c=mg4/intermediate, d=mg2/tour Eiffel, e=mg2/termitiére, f=mg3/termitiére, g=mg4/tour Eiffel, h=mg4/termitiére, i=montsegur/termitiére, j=tour Eiffel/Termitiére), k=tour Eiffel/Intermediate, l=montsegur/intermediate and m=termitiére/intermediate. 77
82 !! Fig 11. Mean concentration of thiotrophic (SOX) symbiont and mean concentration of heavy metal measured in gill for all the populations. Standard deviations is omitted for better interpretation. 78
83 Fig 12. Mean concentration of methanotrophic (MOX) symbiont and mean concentration of heavy metal measured in gill for all the populations. Standard deviations is omitted for better interpretation 79
 40-180 60-1650 8900 Zn (mg l -1 ) 0.16-0.33 0.33-3.79 10.5 Cd (mg l -1 ) 1.01-1.34 2.02-8.85 14.6 Pb (mg l -1 ) 4.4-11.6 7.2-26.9 30.6 H 2 S (mm) 1.3-1.82 0.6-3.3 1-2.")
84 Appendices MG LS RB Depth (m) Tem ( C) ph Fe (mg l -1 ) Mn (mg l -1 ) Cu (mg l -1 ) Zn (mg l -1 ) Cd (mg l -1 ) Pb (mg l -1 ) H 2 S (mm) CH 4 (mm) A. Sampling area and physico-chemical conditions at the three hydrothermal vent sites of the Mid-Atlantic Ridge : Menez Gwen (MG). Lucky Strike (LS) and Rainbow (RB). Adapted from Charlou et al
85 Ca Cd Cu Fe Mg Mn Pb Zn DORM-4 measured 2070± ± ±4 310±30 690±40 3.0± ± ±7 certified 2360± ± ± ±30 910±80 3.2± ± ±3 DOLT-5 measured 480±30 17±2 48±7 1010±60 710±50 9.2± ± ±17 certified 550± ±0.6 35±3 1070±80 940± ± ± ±6 TORT-3 measured 2280±150 55±7 670±80 153±10 900±50 18±2 0.30± ±20 certified 42±2 500±30 179±8 15.6± ± ±6 RM8414 measured 137± ± ±0.2 64±3 760± ± ± ±8 certified 145± ± ±0.5 72±10 960± ± ± ±14 B. Determined elemental concentrations (in µg g -1 ) as compared to certified values for several certified reference materials: DORM-4 (fish protein). DOLT-5 (dogfish liver) and TORT-3 (lobster hepatopancreas) and RM-8414 (bovine muscle). 81
86 82
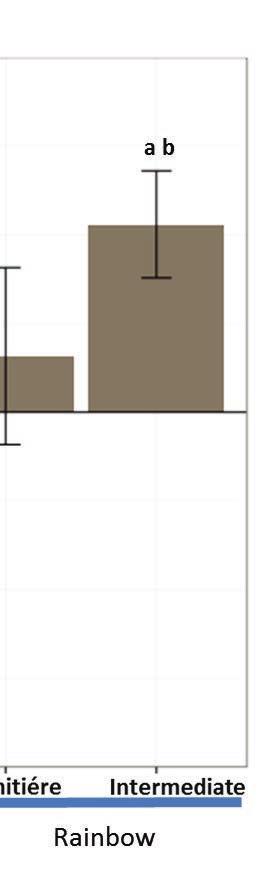
87 83
88 ! C. Relative expression of the two putative cadmium binding proteins and the three MTs in gill in the seven populations analyzed. The data are normalized by the mean deltact value of each MT isoform. Shared letters represent significant differences between populations. For Cd-bp1: a=mg2/mg3 and b=mg2/mg4. For Cd-bp2 a=mg2/mg3, b=mg3/mg4, c=mg3/montsegur and d=mg4/tour Eiffel. For MTa: a=mg2/montsegur, b=mg3/montsegur and c=tour Eiffel/Montsegur. For MTb: a=mg3/intermediate, b=mg4/intermediate. For MTc: a=mg2/termitiére, b=mg3/termitiére, c=mg4/termitiére, d=tour Eiffel/Termitiére, e=montsegur/termitiére and f=termitiére/intermediate.!!!!!! 84
89 ! 85
90 ! 86
91 !! D. Relative expression of the two putative cadmium binding proteins and the three MTs in mantle in the seven populations analyzed. The data are normalized by the mean deltact value of each MT isoform. Shared letters represent significant differences between populations. For Cdbp1: a=mg2/mg3, b=mg2/mg4, c=mg4/montsegur, d=mg4/termitiére. For Cd-bp2: a=mg4/tour Eiffel, b=tour Eiffel/Intermediate. For MTa: a=mg2/montsegur, b=mg3/montsegur, c=mg4/montsegur, d=tour Eiffel/Montsegur), e=termitiére/montsegur and f=intermediate/montsegur. For MTc: a=mg2/montsegur, b=mg3/montsegur, c=mg4/montsegur, d=termitiére/montsegur), e=intermediate/montsegur and f=termitiére/intermediate.!!! 87
92 ! 88
93 ! 89
94 ! E. Relative expression of the two putative cadmium binding proteins and the three MTs in digestive gland in the seven populations analyzed. The data are normalized by the mean deltact value of each MT isoform. Shared letters represent significant differences between populations. For Cd-bp1: a=mg4/tour Eiffel, b=tour Eiffel/Montsegur. For Cd-bp2: a=mg4/montsegur. Fpr MTa: a=mg2/montsegur, b=mg4/montsegur. For MTb: a=mg2/mg3, b=mg2/mg4, c=mg2/montsegur, d=mg2/intermediate, e=mg4/termitiére. For MTc: a:mg2/termitiére, b=mg3/termitiére, c=mg4/termitiére, d=tour Eiffel/Termitiére, e=montsegur/termitiére, f=termitiére/intermediate.!!!!!!! 90
95 Appendix 1. Measured metal concentration in gill for each population (mean ± SD) expressed in µg g -1 dry weight. Population Cadmium Copper Iron Lead Calcium Manganese Zinc Magnesium MG-2 2,23 ± 0,3 40,24 ± 3,4 152,22 ± 7,7 4,67 ± 0,8 1802,88 ± 91,3 3,55 ± 0,3 56,02 ± 18,3 6045,79 ± 489,2 MG-3 2,52 ± 0,6 54,98 ± 3,1 161,728 ± 8,5 7,36 ± 3,3 1911,87 ± 101,0 3,55 ± 0,9 147,35 ± 44,2 6305,62 ± 293,7 MG-4 6,14 ± 0,6 79,27 ± 9,7 166,67 ± 21,9 28,9 ± 3,0 1973,38 ± 258,9 6,33 ± 0,3 96,39 ± 13,2 6508,15 ± 760,4 LS-Montsegur 4,63 ± 2,2 69,63 ± 4,6 135,50 ± 1,84 100,48 ± 11,2 1605,8 ± 21,16 7,07 ± 0,7 54,17 ± 20,4 5091,95 ± 349,3 LS-Eiffel Tower 30,53 ± 6,1 151,19 ± 47,1 151,12 ± 9,60 98,75 ± 20,5 1791,64 ± 112,6 9,38 ± 2,5 2403,69 ± 980,9 5860,37 ± 354,7 Rb-Termitiére 15,59 ± 0,1 187,71 ± 68,1 243,63 ± 92,6 580,91 ±72,7 2880,15 ± 2269,7 12,56 ± 2,9 206,07 ± 127,9 5599,02 ± 92,9 Rb-Intermediate 21,39 ± 9,4 104,35 ± 42,9 116,20 ± 42,0 140,37 ± 67,7 1378,4 ± 497,7 10,42 ± 2,9 5643,62 ± 2575,4 4623,39 ± 1641,6 Measured metal concentration in mantle for each population (mean ± SD) expressed in µg g -1 dry weight. Population Cadmium Copper Iron Lead Calcium Manganese Zinc Magnesium MG-2 0,57 ± 0,08 25,47 ± 7,9 26,04 ± 12,5 1,32 ± 0, ,96 ± 61,02 3,13 ± 0,3 142,83 ± 14,2 2960,8 ± 190,1 MG-3 0,76 ± 0,2 39,37 ± 5,6 54,56 ± 10,3 1,11 ± 0, ,8 ± 5882,8 3,7 ± 0,6 192,8 ± 35,9 5085,9 ±867,4 MG-4 1,01 ± 0,2 31,31 ± 8,2 28,46 ± 12,7 2,90 ± 0, ,08 ± 2853,1 4,9 ± 1,8 136,8 ± 38,2 3026,6 ± 795,3 LS-Montsegur 1,03 ± 0,3 32,72 ± 5,7 126,14 ± 37,7 9,20 ± 0,9 1813,09 ± 84,05 9,06 ± 3,3 276,8 ± 189,9 4036,75 ± 48,6 LS-Eiffel Tower 1,14 ± 0,1 19,40 ± 1,3 81,25 ± 7,02 1,94 ± 0,3 1433,3 ± 225,2 8,69 ± 1,6 124,6 ± 4,6 3125,31 ± 548,1 Rb-Termitiére 0,73 ± 0,2 7,43 ± 2,3 3580,5 ± 1165,4 11 ± 0,8 1900,8 ± 934,8 46,66 ± 13,2 115,8 ± 31,8 2504,9 ± 496,5 Rb-Intermediate 0,72 ± 0,4 6,97 ± 3,6 1921,15 ± 1029,5 3,83 ±1, ,2 ± 353,8 17,11 ± 10,6 220,9 ± 102,8 1922,3 ± 829,12 Measured metal concentration in digestive gland for each population (mean ± SD) expressed in µg g -1 dry weight. Population Cadmium Copper Iron Lead Calcium Manganese Zinc Magnesium MG-2 14,96 ± 3,7 75,22 ± 21,7 161,42 ± 76,5 8,76 ± 2,0 2052,4 ± 1128,0 4,74 ± 0,7 290,8 ± 89,7 2340,8 ± 221,2 MG-3 16,94 ± 0,5 72,20 ± 9,2 77,39 ± 21,6 3,02 ± 0, ,08 ± 634,9 5,44 ± 1,51 301,03 ± 34,9 1976,3 ± 112,0 MG-4 10,3 ± 0,8 86,70 ± 19,6 180,9 ± 71,7 12,9 ± 0, ,8 ± 488,54 11,93 ± 9,4 375,08 ± 113,5 2342,72 ± 412,8 LS-Montsegur 8,84 ± 2,7 95,61 ± 36,9 405,49 ± 71,7 36,48 ± 14,9 1469,05 ± 90,4 14,30 ± 4,4 337,13 ± 200,1 2369,8 ± 212,9 LS-Eiffel Tower 19,16 ± 4,4 187,5 ± 50,1 483,5 ± 18,0 22,67 ± 8,2 1511,8 ± 372,65 11,74 ± 2,8 1395,5 ± 268,4 2633,8 ± 340,3 Rb-Termitiére 7,66 ± 1,8 16,44 ± 2,4 4397,0 ± 4368,02 32,99 ± 11,4 1125,8 ± 240,8 25,73 ± 20,3 142,7 ± 33,3 1793,2 ± 334,4 Rb-Intermediate 9,91 ± 2,8 68,67 ± 46,2 8581,4 ± 2501,6 13,77 ± 1,6 1701,46 ± 94,43 41,57 ± 39,9 403,5 ± 183,3 2705,9 ± 505,9 91
96 92
97 Chapter III Article II: Differential expression of Superoxide Dismutase isoforms as indicator of oxidative stress in response to metals in the hydrothermal mussel Bathymodiolus azoricus: application to field and experimental populations. Gonzalo Fuenzalida 1,2, Francois H. Lallier 1,2, Ricardo D. Riso 3, Matthieu Waeles 3, Arnaud Tanguy 1,2 Corresponding author: 1 Sorbonne Universités, UPMC Univ Paris 06, UMR 7144, Equipe ABICE, Station Biologique de Roscoff, Roscoff, France 2 CNRS, UMR 7144, Adaptation et Diversité en Milieu Marin, Station Biologique de Roscoff, Roscoff, France 3 Univ Bretagne Occidentale, IUEM, CNRS, LEMAR,UMR 6539,Grp Chim Marine, Pl N Copernic, F Plouzane, France This chapter is presented in the form of an article submitted to AQUATIC TOXICOLOGY. 93
98 ABSTRACT Hydrothermal vent ecosystems are characterized by the presence of high concentration of metals that are known to generate the production of ROS. The hydrothermal mussel Bathymodiolus azoricus, is known to present a strong tolerance to metals that are differentially accumulated in the soft tissues. The superoxide dismutase (SOD) is one of the key enzymes involved in the ROS scavenging and several isoforms are present in B. azoricus. This study aims to evaluate the responses of molecular biomarkers in the mussel providing data for potential use in environmental monitoring in the MAR. Mussels were collected at different vent sites characterized by contrasted environmental parameters to compare populations and used in laboratory experiments of metal exposure using several concentrations and sampling time. Determination of metal accumulation was also made to determine potential correlation between metal content and SOD gene expression pattern. Contrasted profiles of SOD expression were detected between the different tissues analyzed and within population without highlighting a specific vent site signature or a specific metal response after exposure to copper, cadmium or iron. However, we identified three SOD isoforms that showed a strong regulation in response to metal exposure particularly in digestive gland. Some correlations have also been detected between this SOD expression and the metal content in tissues. These results indicate possible oxidative stress effects on organisms in response to metal and the involvement of SODs in the cellular response to metal exposure. Keywords: Mid Atlantic Ridge, Metal exposure, SOD, Gene expression, hydrothermal mussel 1. Introduction Marine ecosystems are exposed to constant environmental fluctuations that vary in amplitude, duration and predictability which conduct species to elaborate different strategies to respond to these fluctuations. Marine invertebrates are characterized by a strong ability to accumulate different types of metals in different tissues at high concentrations but the physiological consequences of this are not well elucidated (Rainbow, 1997). Metals can increase the production of reactive oxygen species (ROS) including superoxide anion (O - 2 ), hydrogen peroxide (H 2 O 2 ) and the highly reactive hydroxyl radical (OH), which are the regular products of oxygen metabolism. However, the presence of excess of metals generate an imbalance in the ROS concentration which 94
99 subsequently cause lipid peroxidation, protein modifications and DNA strand cleavage (Lushchak, 2011). To respond to ROS excess, organisms activate an antioxidant machinery that include different enzymes like superoxide dismutase (SOD), catalase (CAT) and Glutathione-S-Transferase (Canesi, 2015) and non-enzymatic antioxidants, such as glutathione, vitamin E (de Zwart et al., 1999). The - main function of SOD is the conversion of O 2 to oxygen (O 2 ) and hydrogen peroxide (H 2 O 2 ) in presence of H + (Fridovich, 1995). SODs are classified into three main groups: the cytosolic copper/zinc SOD (Cu/Zn-SOD) which is the most abundant and contain a extracellular and an intracellular form, an iron SOD (Fe-SOD) usually found in prokaryotes and a manganese SOD (Mn- SOD) which can be found in the mitochondria (Abreu and Cabelli, 2010). In many marine species, SODs are used as biomarker of susceptibility to oxidative stress in response to environmental parameters (Boutet et al., 2004; Sheader et al., 2006; Lewis et al., 2016; Lushchak, 2011). Transcriptional expression of SODs exhibits differential regulation in response to metals very often associated to an increase of SOD expression in response to metal exposure (Taylor et al., 2013; Kim et al., 2013; Nicosia et al., 2015). SODs are also used as biomarkers in natural populations to characterize the effect of anthropogenic pollutants on ecosystems (Orbea et al., 2002; Rodriguez- Ariza et al., 1993). In hydrothermal vents, the physico-chemical variables such as hydrostatic pressure, temperature, low oxygen levels and ph, high concentrations of gases (methane and sulfides) and metals concentration exhibit a large range of variation (German and Von Damm, 2004; Le Bris et al., 2006). These ecosystems are biologically productive and are characterized by an endemic fauna mainly composed by bivalves, arthropods and annelids which have evolved using different adaptive strategies like symbiosis with methane and sulphur oxidizing bacteria in bacteriocytes in gills of for energy support (Kiers and West, 2015; Le Bris and Duperron, 2010), anatomic modifications (Jones, 1981) and physiological strategies (Childress et al., 1992). The high metal concentration is one of the shared characteristics between vents around the oceans that represent a physiological challenge for the organism living here. The diversity and concentration of metals that emerge from the hydrothermal flux vary in each vent according to the physicochemical condition as temperature, rock composition of the ocean crust and oceanic circulation around the vent which moderate the availability of particulate and dissolved metal that can be transported hundreds of meters by the hydrothermal plume (Von Damm, 1995) and be available for the absorption in the fauna associated to these ecosystems. In the Mid-Atlantic ridge, bivalves from the Mytilidae family are widely distributed, where Bathymodiolus azoricus is a model specie used for understand the adaptation to this extreme environmental, principally because forms large communities in the base and walls of vent chimneys, with high abundance (Sarrazin et al., 2014). Previous works showed that B. azoricus 95
100 can accumulate essential (iron, copper, zinc) and non-essential (cadmium, mercury, lead) metals in different tissues like gills, mantle, digestive gland, foot and this bioaccumulation can vary between site related or not to the concentration found in the fluid ( Colaço et al., 2006; Kadár, 2007; Kádár et al., 2007; Cosson et al., 2008; Martins et al., 2011; Koschinsky et al., 2014). However the biochemical and physiological adaptation to metals have not been well described in this species. The characterization of SODs in hydrothermal species from different vent systems has been reported such as in Alvinella pompejana (Bruneaux et al., 2013), Riftia pachyptila and Calyptogena magnifica (Blum and Fridovich, 1984), Brachyura (Marchand et al., 2009) or Paralvinella grasslei (Shin et al., 2010). In B. azoricus, experimental exposure to cadmium, copper and mercury induced an inhibition in SOD activity in the gills of B. azoricus from Menez Gwen but over long periods of exposure to cadmium, the activity increases compared to the initial levels (Company et al., 2004) and a higher SOD activity is observed in response to cadmium exposure by Company et al. (2006). The use of gene expression profile in an ecotoxicological assessment as a tool of response to stress see an increasing interest due to its high sensitivity (Huggett et al. 2005; Hellemans et al. 2007). In the case of SODs, most studies conducted in marine mollusc species only analyzed the expression of single SOD isoform and in parallel, studies based on the SOD activity are not able to distinguish the specific activity of the different isoforms with the exception of the mitochondrial versus cytosolic compartment. The goal of the present study is to investigate the pattern expression variations of seven SOD isoforms in response to metal exposure under controlled conditions and compare their regulation profiles to those obtained in natural populations. 2. Materials and methods 2.1. Biological samples, Natural population Samples of B. azoricus were collected from Mid-Atlantic Ridge in August 2013, during the BIOBAZ cruise on the research vessel Pourquoi Pas?, using the Remote Operating Vehicle (ROV) Victor The collection was made in three different vents sites Menez Gwen (37 50 N, W, 800mdepth, 3 populations called MG2, MG3 and MG4), Lucky Strike (37 17 N, W, 1700m depth, 2 populations collected at Tour Eiffel and Montsegur) and Rainbow (36 14 N, W, 2300m depth, 2 populations collected at Termitière and Intermediate) (Appendix 1). Mussels were collected in hermetic boxes then brought on board. Gills, mantle and digestive gland of each individual were immediately dissected and fixed in liquid nitrogen until further analysis. 96
101 2.2. Experimental exposure to heavy metals For this experiment, mussels were collected at Menez Gwen site (MG2) because of their ability to survive for a long time at atmospheric pressure (Kadar et al., 2005).Once on board, ten groups of 150 mussels from various size (from 12 to 80 mm) were placed in tanks containing 30 liters of filtered sea water. Then, in each tank, mussels are exposed to 0,2µM; 1µM; 4µM; 20µM of cadmium, 4µM; 25µM and 60µM of copper, 1µM, 5µM and 20µM of iron. Concentrations have been determined according to concentrations determined in the fluids composition by Charlou et al. (2002) and represent concentration detected in the fluid for copper and iron and the 0.2 and 1µM for cadmium, the 4 and 20µM of cadmium corresponding to sub-lethal levels. An additional set of 200 mussels was placed in a control tank without metal added to follow the effect of experimental design (use of surface sea water and absence of pressure and gases). After 5, 10, 15, 20 and 25 days, 10 individuals were sampled in each tank and pieces of gills and digestive gland were dissected and fixed in liquid nitrogen for further analysis Metal concentrations in tissues For each metal concentration and sampling time, we make pools of 10 individuals for gills, mantle and digestive gland then tissues were lyophilized. Sample digestions were done at 105 C in closed 15-mL Teflon screw-cap vials (Savillex, Minnetonka, USA) with 4 ml suprapur 65 % nitric acid (Merck, Darmstadt, Germany) and 1 ml suprapur 30% hydrogen peroxide (Merck). Measurements were then conducted on diluted mixtures (2.5% HNO 3 ) using different spectrometers operated at the Pole Spectrometry Ocean Brest (PSO, Brest). Cu, Pb, Cd, Mn and Zn were determined a High- Resolution ICP (HR-ICP) mass spectrometer (Element 2, Thermo Scientific, Bremen, Germany) with a precision better than 3% (Cd, Cu, Pb) or 5% (Mn, Zn). Ca, Fe and Mg were determined with an inductively coupled plasma (ICP) optical emission spectrometer (Ultima 2, Horiba Jobin Yvon, Longjumeau, France) with a precision better than 1%. The certified reference materials used for assessment of the method accuracy were: DORM-4 (fish protein), DOLT-5 (dogfish liver) and TORT-3 (lobster hepatopancreas) from NRCC and RM-8414 (bovine muscle) from NIST. All metal concentrations are expressed in µg g -1 dry weight RNA Extraction, cdna sequencing and qpcr For natural population samples, total RNA was extracted from gills, mantle and gland digestive and for experimental samples, total RNA from gills and digestive gland only was extracted using Tri-Reagent (Sigma, St. Louis, MO) according to the manufacturer s instructions. Two µg of total 97
102 RNA were reverse transcribed using M-MLV reverse transcriptase (Promega, Madison, WI). For gene expression, a volume of 2 μl of each diluted reverse transcription product (1:200) was subjected to real-time PCR in a final volume of 5μl containing 40 nm of each specific primer and 2 Lightcycler 480 SYBR Green I Master mix (Roche Diagnostics, Mannheim Germany). The amplification was carried out as follows: initial enzyme activation at 95 C for 15 min, then 45 cycles of 95 C for 10 sec and 60 C for 30 sec. A dissociation curve was generated and PCR efficiency was estimated for each primer pair. All primer pairs tested (Table 1) generated a single peak in the dissociation curve and a PCR efficiency of 95 to 100%. The ribosomal protein L15 gene (RpL15) was used as the internal PCR control as already used in previous studies (Bougerol et al., 2015; Boutet et al., 2011; Guezi et al., 2014) Statistical analyses The relative expression of each SOD isoform was calculated according the comparative Ct method using the formula RQ = ΔΔCt (with ΔCt gene X = Ct gen X Ct RiboL15 ; ΔΔCt= ΔCt gene X mean Ct gene X). The first analysis was conducted to determine the inter-population effect in the variation of MTs expression and we normalized the data by the mean deltact gene X of all populations for one tissue. The second analysis was conducted to determine the intra-population effect of the MTs expression and we normalize the data by the mean deltact gene X in the three tissues in each population. For the mussels exposed to metal we normalize the data by the mean in of each metal across the 25 days of exposure. ANOVA test was used to evaluate differences in metal accumulation and SODs expression considering population and tissues as explanatory factors (R studio software). Canonical redundancy analysis (RDA) was used to evaluate the influence of metal accumulation in the SODs expression using the Vegan package (Oksanen et al., 2016) in R environment. Test of significativity between SODs in each experimental condition in both tissues were performed using additional Student T-tests with 100 permutations and a p-value= Results 3.1. SODs characterization. The seven SODs studied correspond to 5 cytosolic Cu/ZnSOD (SOD1, SOD2, SOD3, SOD4 and SOD7; Appendix2), one mitochondrial MnSOD (SOD6; Appendix3) and one copper chaperone for superoxide dismutase (SOD5) (Appendix4). The alignment of the cytosolic B. azoricus SODs sequences and other SODs described in bivalve species and in a hydrothermal annelid A. pompejana, shows a moderate percentage of similitude indicating a relative low conservation of these proteins (Table 2). The higher similarity is reported for B. 98
103 azoricus SOD2 with the A. pompejana and M. chilensis SOD while the lowest value is found between SOD3 and SOD4 within B. azoricus sequences. The percentage of identity of the mitochondrial SOD-6 with other marine invertebrates does not exceed the 51% compared with sea urchin S. pupuratus and the brachiopod L. anatine (Table 3) and similar value are found for the copper chaperone SOD-5 with sequences of other coastal invertebrates (Table 4). 3.2 SODs expression between populations The relative expression of the seven SODs genes reveals contrasted patterns between populations (Figure 1 and Table 5) but no clear vent site effect is detected. In gills, all the SODs gene except SOD6 are significantly regulated. MG2 and MG4 populations exhibit a similar expression pattern characterized by a high expression of the cytosolic SOD1 and a low expression of SOD2. Both populations of Lucky Strike show a higher expression ratio of all isoforms except SOD1. The two populations of Rainbow exhibit an opposite expression pattern for all SODs. Surprisingly, SODs expression pattern of Termitiére and MG3 populations are very similar. In mantle, all the SODs gene except SOD1 are significantly regulated. MG2 exhibits a higher expression of all SODs except SOD5 compared to other populations. SOD2 appears more expressed in the three MG populations and SOD5 in both Rainbow populations. In the digestive gland, all the SODs are significantly regulated and no clear expression pattern can be detected between the three vent sites. MG3 and Tour Eiffel exhibit a higher expression for all SODs when Montsegur and Termitiére show the lower expression ratio Relative expression of SODs between tissues The regulation of the seven SOD genes is characterized by a global down regulation in mantle compared to other tissues across all the populations except MG2 and MontSegur (Figure 2 and Table 6). A higher expression is observed in the digestive gland compare to gills for three populations (MG3, Tour Eiffel and Intermediate) and a similar ratio is observed between both tissues for the other populations with the exception of MG2 that shows a general up-regulation in gills. At MG2 for SOD5 and at Montsegur for SOD6 only, a significant higher expression is observed in gills (Table 6). For MG3, MG4 and Tour Eiffel populations, almost all SOD isoforms are significantly regulated (p<0,01), MG3 and Tour Eiffel exhibiting the same regulation pattern. In Intermediate population, SOD1 and SOD7 99
104 when in Termitière population, SOD6 and SOD7 are significantly up-regulated in the gills and SOD4 in the digestive gland. 3.4 Redundancy analysis (RDA) The redundancy analysis showed that 16.6% of the variation in relative expression of SODs is explained by the variable metal concentration in gills, 13.5% in the mantle and 19.2% in the digestive gland (Figure 3). In gills, the SOD1 gene does not show any correlation with metals while SOD3 and SOD4 are correlated to lead and copper, SOD2 and SOD5 are with manganese and SOD6 and SOD7 with cadmium. In mantle, SOD5 shows a strong correlation with iron and manganese and in lesser extent with lead, SOD1 appears correlated to copper and the other SODs are not correlated to metals. In the digestive gland, SOD3, SOD5 and SOD6 show a weak correlation metals but SOD7 exhibit a strong correlation with cadmium, and SOD1, SOD2 and SOD4 with copper. 3.5 Mortality in metal exposure experiment After 25 days of metal exposure the highest mortalities rate are reported in cadmium exposure with a similar rate for the 1, 4 and 20µM concentrations. In iron exposure, mortality is limited and increase from 1 to 20 µm when in copper exposure, mortality rate remain comparable between concentrations (Figure 4). 3.6 Metal concentration in tissues during metal exposure The concentration of the eight metals are reported for gills (Figure 5) and digestive gland (Figure 6). The specific measurement of each metal in all metal exposure conditions are reported in the Appendix 5 and 6. In gills, cadmium concentration do not increase with time whatever the concentration of exposure. For copper, the concentration increased after 5 days and remain high and constant up to 20 days (3 to 5 times compared to control) in mussels exposed to copper with no clear effect of concentration exposure effect. We also noticed that copper is accumulated in gills from mussels exposed to cadmium at a similar level than the one observed in copper exposure. Copper levels are similar to control in mussels exposed to iron and lead. For iron, a higher and constant concentration is detected only in mussel exposed to iron from day 5 (1.5 times higher than in control and other metal exposure conditions). No change are observed for the four metal calcium, magnesium, manganese and zinc. In the digestive gland, the cadmium concentration shows a slight decrease in control with time and remain similar in all other metal conditions. For copper, the 100
105 concentration increases from day 5 to day 20 (2 to 4 times) compared to control and the other metal exposure conditions in mussels exposed to copper with no specific time exposure pattern. For iron, we only notice a global higher concentration in mussels exposed to iron after day 20 compared to control. No change is observed for the three metal magnesium, manganese and zinc. We notice a relative decrease of calcium concentration from day 10 in control mussels compared to those exposed to metal conditions. 3.7 Relative expression of SODs in metal exposure experiments In gills, the general expression pattern of SODs during the metal exposure shows strong similarities for the three metal experiments. Regarding the regulation of SODs in the control which represent a condition of depuration, we notice that some SODs show a significant regulation according to time especially SOD2 and SOD3 with a significant down-regulation of SOD2 and 3 at day 5 and 10 and an up-regulation at day 15 and 20 (Table 9). In cadmium exposure (Figure 7), ANOVA analysis reveals that all SODs except SOD5 and SOD7 are significantly regulated during the experiment (Table 7). At the 0.2 µm concentration, SODs expression differ from controls at day 10 with a significant increase of 4 SODs isoforms, and at day 20 with a significant decrease of SOD2,3 and 6. At the 1 µm concentration, SODs expression increase at day 5 compared to control especially SOD2 and 4 then remain similar at day 10 and 15 and significantly decrease at day 20 for 4 SODs. At the 4 µm concentration, SODs expression does not differ from control at day 5 and 10 except SOD2 and SOD1 and 4 decrease at day 15. At the 20 µm concentration, a global lower SODs expression is observed but very few SODs show a significant variation in expression compared to control (Table 9). In copper experiment, all SODs except SOD3 and SOD6 are significantly regulated (Table 7). At day 5, no difference in SODs regulation is observed at any concentration compared to control except for SOD2 which is up-regulated at day 5 and 10 and down-regulated at the 60µM concentration. At day 10, an induction of SOD 1 and 4 at 4 µm, SOD3 at 25µM and SOD2 at 60µM is detected. At day 15, an induction of SOD 1 at 4 µm, SOD2 at 60µM and a decrease of SOD4 at 4µM is detected when at day 20, a significant decrease of SOD2 expression is observed at the three concentrations. In iron experiment, all SODs except SOD7 are significantly regulated. At day 5, 10, 15 and 25, we mainly observed a significant expression at the three concentrations for SOD2 compared to the control and a decrease at day 20. Other SODs showed some significant difference at different sampling time but with contrasted pattern. In the digestive gland, the global expression pattern during the metal exposure shows major differences according to metals. In the control, we notice that SOD2, 3 and 6 present a downregulation at day 15 and 20 compared to the initial time T0 (Table 9 and Figure 8). In cadmium 101
106 exposure, all SODs are significantly regulated (Table 8). At day 5, we observe a contrasted regulation of SODs with a up-regulation at 4µM and a down-regulation at 1 and 20µM for 4 to 6 SODs. At day 10, SOD2 and 4 are significantly down-regulated in all cadmium concentrations. At day 15, a contrasted response is observed with a significant increase of SOD1, 2, 3 and 6 at 1µM and SOD 6 at 20µM when SOD2 is down-regulated at 20µM. At day 20, SOD2 is up-regulated at the 1, 4 and 20µM concentrations. In copper exposure, all SODs are significantly regulated except SOD6. A global down regulation of all SODs is observed at day 5 for the 4 and 25µM concentrations. At day 10, SODs expression increase in mussels exposed to 25 µm for SOD 2, 3 and 7 and at 60µM for SOD1, 4 and 5 and SOD5 is down-regulated at 4µM. At day 15, an increase of SOD1, 3, 6 and 7 expression is observed at the 4µM concentration and at day 20, a major up-regulation is detected for the SOD1, 2, 3, 4 and 7 in the three concentrations compared to the control. In iron exposure, SOD1, ANOVA showed that SOD2, SOD3, SOD4 and SOD6 are significantly regulated.at day 5, mussels exposed to 20µM show a down-regulation for SOD 3, 4, 5 and 6 compared to the control when at day 10, all mussels exposed to the three concentrations exhibit a significant down-regulation of SOD3 and 4. At day 15, few variations are observed except for SOD1 and 3 which are down-regulated SOD7 that is up-regulated at 20µM. At day 20, expression of SOD1, 2 and 3 increases in all iron concentrations and at day 25, levels of SOD expression are similar in both experimental and control mussels. 4. Discussion 4.1 SODs characterization and relative expression in natural populations The antioxidant defense has been studied in several invertebrates species from hydrothermal vent ecosystems, particularly enzymes involved in the reduction of the cellular content of superoxide and hydrogen peroxide (Blum and Fridovich, 1984; Bruneaux et al., 2013; Company et al., 2004; Genard et al., 2013). Indeed, ROS production can result from the oxidation of H 2 S (Tapley et al., 1997), radioactivity (Cherry et al., 1992), ferrous iron and other metallic compounds present in the fluid (Sung and Morgan, 1980). SOD activities can increase in H 2 S-rich environments (Morill et al., 1988; Abele-Oeschger, 1996) and during hypoxic events in order to prevent the oxidative stress due to normoxic recovery (Abele et al., 1998). In the three populations collected at the three vent sites Menez Gwen, Lucky Strike and Rainbow, Bebianno et al. (2005) evidenced a higher SOD activity in gills compared to mantle with a higher cytosolic SOD activity compared to mitochondrial SOD activity. The authors also detected a specific site pattern, the cytosolic SOD having a higher activity in LS followed by MG and RB while the mitochondrial form showed a decreasing activity from MG to LS 102
107 and RB but only for gills. A similar trend has been reported in transplanted mussels from RB to LS, however this study represent the contribution of both symbiotic and host SOD levels and a limited sample number (Company et al., 2007). None of the previous studies evidenced the existence of several isoforms that could modulate the global SOD activity. The present study intends to characterize the oxidative status in the hydrothermal vent mussel B. azoricus through the relative expression of several genes encoding SODs in both natural and experimental populations. We report the existence of several SOD isoforms in B. azoricus including new cytosolic and mitochondrial sequences. We also report for first time the existence of a specific copper SOD chaperone (SOD5) which has a similar structure to the classical SOD but which function as a metallochaperone is the incorporation of copper inside the cytosolic SOD when this metal is in low concentrations (Schmidt et al., 1999). Their relative expression revealed both specific tissues and population pattern. In all populations, a global higher level of expression is detected in gills compared to mantle which is in agreement with the higher level of SOD activity evidenced in gills (Company et al 2007). SODs expression patterns between gills and digestive gland vary according to populations highlighting the role of organotropism in ROS scavenging. In Mytilus edulis, a comparison of polluted sites versus control sites showed an induction of SOD gene expression in gills but not associated with an increase of SOD activity (Rola et al., 2012). The comparison of SODs expression in the three tissues between the seven populations exhibits significant differences between populations but no specific hydrothermal vent is detected. The strongest differences are observed in the digestive gland where a clear higher expression of all SODs is observed in MG3 (MG site) and Tour Eiffel (LS site) and a lower expression in Montsegur (LS site) and Termitiér (RB site). When considering the expression pattern of SODs in the three tissues, each population show a specific signature which could be used as a specific population signature. The three vent sites strongly differ in terms of depth, temperature, ph and metal concentrations but none of these environmental differences seems to influence the global SODs expression pattern. All those results reflect the phenotypic plasticity of B. azoricus related to different susceptibilities to oxidative stress according to each vent condition. Our RDA analysis also showed that tissue metal content only explained a part of the SODs expression pattern (range from 13 to 19% according to tissues) illustrating the fact that metal accumulation is not directly correlated with ROS level. However in gills, we noticed that SOD expression increases with metal content (except SOD1) which could be linked to the direct contact of gills with water and metals and their subsequent role in respiration and osmo-regulation (Regoli and Principato, 1995). In mantle, SODs expression globally decreases with increasing metal content and in digestive gland, SOD expression is related to copper and cadmium content for SOD1, SOD2, SOD4 and SOD7. Regarding the copper SOD chaperone, RDA analysis shows that SOD5 present a lower expression when copper concentration increase regulation in mantle and digestive gland. Part of the difference in the SODs expression 103
108 regulation between the population could also be partly explained by the fact that chronic exposure to some pollutants may affect the response to other pollutants illustrating the effect of a strong pressure selection and potential genetic adaptation in allele frequencies at specific genes (Weis et al., 1999; Bélanger-Déchêsnes et al., 2013) or epigenetic modifications that can affect gene expression (Aluru et al., 2011; Timme-Laragyet al., 2005) or altered gene expression pattern (Whitehead and Crawford, 2006; Whitehead et al., 2012). 4.2 Metal bioaccumulation in metal exposure condition Bathymodiolus azoricus is one of the species with higher biomasses in the MAR and as in other bivalves species has shown ability to accumulate different metals at higher concentrations principally in gills, mantle, foot and digestive gland (Kádár et al., 2007; Koschinsky et al., 2014). The differences in mortality detected after 25 days of exposure to copper, cadmium, iron and lead suggest a metal sensibility in B. azoricus, characterized by higher susceptibility to cadmium followed by copper and iron. The metal accumulation reveals a tissue specific bioaccumulation pattern. Cadmium do not accumulate with time in gills contrary to the digestive gland after 20 days but surprisingly, in presence of copper (without additional cadmium), we observed a strong coaccumulation of both copper and cadmium in gills and digestive gland suggesting the existence of a similar pathway of chelation for the two metals but the mechanism of metal regulation in many mollusk species remains not clear. We may assume that cadmium concentrations used in this study represent an acute stress and that mussel, as a rule, first isolate themselves from the environment by closing their valves and increasing mucus production on the gills, then limiting the entry of cadmium in organs. In case of iron, we also observed an accumulation of iron in both tissues and especially in gills but with no time effect since level of iron remains similar at all sampling time. Accumulation of iron into soft tissues of mollusc species has been reported in many species (Depledge et al., 1994, Brown and Depledge, 1998). In the bivalve Modiolus modiolus exposed to iron, an increase of iron is observed after only 10 days of exposure but not in digestive gland suggesting an active excretion of this metal (Podgurskaya and Kavun, 2012). Calcium and magnesium ion are found at high concentration in sea water so is possible that they can interact with biological membranes and facilitate other metals absorption. Calcium has been reported as a modulator in filtering behavior and also in uptake of others metals as cadmium and zinc in experimental condition in Daphnia magna (Tan and Wang, 2008). In our experiment, calcium and magnesium which are principal components in the biological pumps involved in ion homeostasis (Toyoshima, 2009) have similar trends in the two tissues and in all experiments and showed no specific pattern of regulation. The concentrations of manganese and zinc reported in our study do not evidence strong variations during 104
109 the experiment, the major levels measured in manganese being reported in the digestive gland of mussels exposed to copper. Global higher levels of zinc are reported in control mussels in both tissues especially at the end of the experiment and a slow decrease of zinc concentration is observed in gills after 20 days, as previously reported in B. azoricus (Kadar, 2007) or in oysters in natural transplanted experiment (Wallner-Kersanach et al., 2000). Manganese and zinc are essential metals that act as cofactor or activator of many enzymatic reactions but at high concentration or prolonged exposure time, they can be toxicity and cause important physiological changes (Bini et al., 2015; Oweson and Hernroth, 2009; Oweson et al., 2010). 4.3 SODs regulation in mussels exposed to metals The antioxidant protection of the superoxide dismutase has been widely studied in marine invertebrates exposed to different environmental conditions as sulphide exposure (Abele- Oeschger, 1996), hydrocarbon exposure (Boutet et al., 2004), industrial chemical and biocides (Kim et al., 2011; Kim et al., 2015) demonstrating the physiological importance of this enzymes in response to different environmental conditions. The hydrothermal vent is one of the most extreme ecosystems found in the oceans, characterized by strong environmental variation in temperature, ph, toxic gases and heavy metal, thus the role of the SOD in the maintenance of oxidative stress is of vital importance as an adaptive response in the hydrothermal species to these environmental fluctuations. In this work we report a robust experiment of metal exposure during 25 days, with a large samples size, different metals in different concentrations which shows that the exposure of metal can significantly trigger the expression of SOD in gills and digestive gland. We try to better understand the regulation of the different SODs in response to various metals at different concentrations in order to identify specific pattern of regulation and subsequently determine if SODs gene expression may be used as a tool to evaluate the effects of metal exposure. Due to the specificity of the hydrothermal mussel model, both heavy metals and laboratory conditions participate to the SODs regulation. Indeed, in hydrothermal vent environments metal-sulfide complexes buffer the concentration of bioavailable metals before physiological detoxification reactions occur (Edgecomb et al., 2004). Because of the absence of any sulfur or methane in our tanks, we suggest that metals are more bioavailable than those naturally encountered by mussels because no interaction with sulfurs is possible. Experiments were also conducted at atmospheric pressure and with seawater containing an oxygen level close to 20% versus an average concentration of 10% in situ. These differences in the laboratory environment could contribute to alter the physiological conditions of the mussel mainly by generating a global 105
110 oxidative stress. The pattern of SODs expression observed in the control condition indicates that the mussels are affected by the experimental condition metal concentrations used and the increase of SOD regulation observed after. The up-regulation observed after 15 days suggests an increase of ROS probably generated by the higher level of oxygen in the sea water compared to in situ conditions. However, the comparison of SOD expression in experimental conditions along the exposure time with the respective control showed that some SODs present strong regulations with in particular SOD2, SOD3 and SOD4. Interestingly, these three isoform showed the stronger relation between their expression and the metal concentration in tissues when considering field populations as shown in Fig.3. We also noticed that SOD regulation was more significant in the digestive gland than in the gills for the three metals tested illustrating the tissue specificity in the oxidative stress response. These results suggest that gills may rapidly eliminate or chelate metals to limit the ROS production. In bivalves, cadmium may enter the gills by passive diffusion or across Ca2+-channels then be a rapidly bind to intracellular ligands and specific proteins such as metallothioneins that ensures removal of cadmium (Carpene and Georges, 1981, Frazier and George, 1983). In Mytilus galloprovincialis exposed to nanoparticules containing metals, the gills appeared to be more susceptible to dissolved metal toxicity, while digestive gland is more sensitive to nanoparticules illustrating the differential tissue response in the uptake, accumulation and detoxification processes (McCarthy et al., 2013; Gomes et al., 2012). An absence of regulation in the transcription of a SOD gene has been observed in gills of M. gallorpincialis in response to nanoparticules exposure (Bebianno et al., 2015) and in gills and digestive gland of C. gigas exposed to silver nanoparticules or dissolved silver (Mc Carthy et al., 2013). At a proteomic level, an extra cellular Cu/Zn SOD from the digestive gland of C. gigas was also found to be down-regulated after Cu exposure associated with an elevation of the copper contain in the protein suggesting a competition between zinc and copper (Xu et al., 2014). The active site of the SOD is characterized by the presence of metal binding site, normally copper, zinc or manganese. However, due to the differences in metal affinity for the binding site, a competition between metals can cause the replacement of regular metals by others with higher affinity such as cadmium or lead, but this replacement also depends of the metal concentration (Abreu et al 2010).. Our analysis also revealed that SODs regulation is not linear and show a complex pattern according to metal and concentrations. In the hydrothermal vent mussel B. azoricus, the SOD activity has been studied in natural populations in the MAR evidencing specific population patterns together 106
111 with temporal variations (Bebianno et al., 2005; Company et al., 2010). Company et al (2006) also reported a positive increment between cadmium exposure and cytosolic SOD activities in gills after 6 days but not for the mitochondrial SOD where the activities decrease after the first day. In our study, the mitochondrial MnSOD present a stronger regulation in response to iron in both tissues and a limited regulation in response to cadmium. One interesting result of this study is that the difference in ratio of expression in experimental conditions is never very high suggesting either a strong regulation of SOD expression or a limited involvement of SODs in the metal response due to the limited ROS production associated with a rapid metal detoxification. We cannot exclude that other mechanisms or proteins than SODs could participate to counteract oxidative stress in the cells. The activities of total glutathione peroxidases and cytosolic catalases have been quantified in the two hydrothermal shrimps, Mirocaris fortunate and Rimicaris exoculata and are higher than in their costal homologs (Gonzalez-Rey et al.,2008). We may suggest that SOD expression is naturally high in B. azoricus as a response to hydrothermal environment and that the range of up-regulation of SODs genes is then limited. In the hydrothermal crabs Segonzacia mesatlantica, higher cmnsod and mmnsod mrna expressions have been detected in individuals from Rainbow compared to crabs collected at LS suggesting an impact of environmental parameters (Marchand et al., 2009). At the contrary, based on SOD activities, Morril et al (1988) suggested that thiobiotic meiofauna which avoid oxic habitats should have much lower catalase and SOD levels than their oxybiotic counterparts. 5. Conclusion These experiments of metal exposure have been generated to investigate the validate role of metals in the generation of oxidative stress in B. azoricus with the idea that SOD expression levels reported in gills and digestive gland could bring reflect the effect of metal exposure. Three SOD isoforms, SOD2, SOD3 and SOD4 could be considered as putative good biomarkers of metal exposure in B. azoricus. Additional experiments could also be conducted especially in response to hypoxia, temperature but also in presence of gases to better estimate the relative importance of the main environmental factors in the SODs regulation in this species. As a perspective, a purification of the different SOD isoforms of B. azoricus associated with the determination of their metal content could also bring useful information and the analysis of their specific activity will also contribute to understand their relative contribution in SOD activity so as the link between gene expression and protein activity. 107
112 6. Acknowledgements. We would like to thank the crew and pilots of the N/O Pourquoi Pas? and the ROV Victor6000 for their assistance an technical support in sampling during the BIOBAZ 2013 cruise. We also thank the JST/CNRS program for funding and Becas Chile (CONICYT) for the PhD grant. 7. References Abele, D., Großpietsch, H., Pörtner, H., Temporal fluctuations and spatial gradients of environmental PO2, temperature, H2O2 and H2S in its intertidal habitat trigger enzymatic antioxidant protection in the capitellid worm Heteromastus filiformis. Mar. Ecol. Prog. Ser. 163: Abele-Oeschger, D., A comparative study of superoxide dismutase activity in marine benthic invertebrates with respect to environmental sulphide exposure. J. Exp. Mar. Bio. Ecol. 197, Abreu, I.A., Cabelli, D.E., Superoxide dismutases-a review of the metal-associated mechanistic variations. Biochim. Biophys. Acta - Proteins Proteomics 1804, Aluru, N., Karchner, S.I., Hahn, M.E., Role of DNA methylation of AHR1 andahr2 promoters in differential sensitivity to PCBs in Atlantic Killifish, Fundulus heteroclitus. Aquat. Toxicol. 101, Bebianno, M. J., Gonzalez-Rey, M., Gomes, T., Mattos, J.J., Flores-Nunes, F., Bainy, A. C. D., Is gene transcription in mussel gills altered after exposure to Ag nanoparticles? Environ. Sci. Pollut. Res. 22, Bebianno, M.J., Company, R., Serafim, A., Camus, L., Cosson, R.P., Fiala-Médoni, A., Antioxidant systems and lipid peroxidation in Bathymodiolus azoricus from Mid-Atlantic Ridge hydrothermal vent fields. Aquat. Toxicol. 75, Bélanger-Déchêsnes, S., Couture, P., Campbell, P.G.C., Bernatchez, L., 2013.Evolutionary change driven by metal exposure as revealed by coding SNP genome scan in wild yellow perch (Perca flavescens). Ecotoxicology 22(5), Bini, G., Santini, G., Chelazzi, G., Pre-exposure to Cadmium or Zinc Alters the Heart Rate Response of the Crayfish Procambarus clarkii Towards Copper. Bull. Environ. Contam. Toxicol. 95,
113 Blum, J., Fridovich, I., Enzymatic defenses against oxygen toxicity in the hydrothermal vent animals Riftia pachyptila and Calyptogena magnifica. Arch. Biochem. Biophys. 228, Bougerol, M., Boutet, I., LeGuen, D., Jollivet, D., Tanguy, A., Transcriptomic response of the hydrothermal mussel Bathymodiolus azoricus in experimental exposure to heavy metals is modulated by the Pgm genotype and symbiont content. Mar. Genomics 21, Boutet, I., Ripp, R., Lecompte, O., Dossat, C., Corre, E., Tanguy, A., Lallier, F.H., Conjugating effects of symbionts and environmental factors on gene expression in deep-sea hydrothermal vent mussels. BMC Genomics 12, 530. Boutet, I., Tanguy, A., Moraga, D., Response of the Pacific oyster Crassostrea gigas to hydrocarbon contamination under experimental conditions. Gene 329, Brown, M.T., Depledge, M.H Determinants of trace metal concentrations in marine organisms. In: Langston W, Bebianno MJ, editors. Metal me-tabolism in aquatic environments. London: Chapman & Hall; Bruneaux, M., Mary, J., Verheye, M., Lecompte, O., Poch, O., Jollivet, D., Tanguy, A., Detection and characterisation of mutations responsible for allele-specific protein thermostabilities at the Mn-superoxide dismutase gene in the deep-sea hydrothermal vent polychaete alvinella pompejana. J. Mol. Evol. 76, Canesi, L., Pro-oxidant and antioxidant processes in aquatic invertebrates. Ann. N. Y. Acad. Sci. 1340, 1 7. Carpené, E., George, S.G Absorption of cadmium by gills of Mytilus edulis (L). Mol. Physiol. 1, Charlou, J.., Donval, J.., Douville, E., Jean-Baptiste, P., Radford-Knoery, J., Fouquet, Y., Dapoigny, a, Stievenard, M., Compared geochemical signatures and the evolution of Menez Gwen (37 50ʹN) and Lucky Strike (37 17ʹN) hydrothermal fluids, south of the Azores Triple Junction on the Mid-Atlantic Ridge. Chem. Geol. 171, Cherry R, Desbruyères D, Heyraud M, Nolan C (1992) High levels of natural radioactivity in hydrothermal vent polychaetes. C. R. Acad. Sci. Paris 315(3), : Childress, James; Fisher, C., The Biology of Hydrothermal Vent Animals - Physiology, Biochemistry and Autotrophic. Oceanogr. Mar. Biol. 30, Colaço, A., Bustamante, P., Fouquet, Y., Sarradin, P.M., Serrão-Santos, R., Bioaccumulation of 109
114 Hg, Cu, and Zn in the Azores triple junction hydrothermal vent fields food web. Chemosphere 65, Company, R., Felícia, H., Serafim, a., Almeida, a. J., Biscoito, M., Bebianno, M.J., Metal concentrations and metallothionein-like protein levels in deep-sea fishes captured near hydrothermal vents in the Mid-Atlantic Ridge off Azores. Deep Sea Res. Part I Oceanogr. Res. Pap. 57, Company, R., Serafim, A., Bebianno, M.J., Cosson, R., Shillito, B., Fiala-Médioni, A., Effect of cadmium, copper and mercury on antioxidant enzyme activities and lipid peroxidation in the gills of the hydrothermal vent mussel Bathymodiolus azoricus. Mar. Environ. Res. 58, Company, R., Serafim, A., Cosson, R., Fiala-Medioni, A., Dixon, D., Bebianno, M., Temporal variation in the antioxidant defence system and lipid peroxidation in the gills and mantle of hydrothermal vent mussel Bathymodiolus azoricus. Deep. Res. Part I Oceanogr. Res. Pap. 53, Company, R., Serafim, A., Cosson, R., Fiala-Médioni, A., Dixon, D.R., Bebianno, M.J., Adaptation of the antioxidant defence system in hydrothermal-vent mussels (Bathymodiolus azoricus) transplanted between two Mid-Atlantic Ridge sites. Mar. Ecol. 28, Cosson, R.P., Thiébaut, É., Company, R., Castrec-Rouelle, M., Colaço, A., Martins, I., Sarradin, P.M., Bebianno, M.J., Spatial variation of metal bioaccumulation in the hydrothermal vent mussel Bathymodiolus azoricus. Mar. Environ. Res. 65, Depledge, M.H., Weeks, J.M., Bjerregaard, P Heavy metals. In: Calow P, editor. Handbook of ecotoxicology, vol. 2. Oxford: Blackwell de Zwart, L.L., Meerman, J.H.N., Commandeur, J.N.M., Vermeulen, N.P.E., Biomarkers of free radical damage. Applications in experimental animals and in humans. Free Radicals Biol. Med. 26, Edgcomb, V.P., Molyneaux, S.J., Saito, M.A., Lloyd, K., Böer, S., Wirsen, C.O., Atkins, M.S., Teske, A Sulfide ameliorates metal toxicity for deep-sea hydrothermal vent Archaea. Appl. Environ. Microbiol. 70, Frazier, J.M., George, S.G Cd kinetics in oysters a comparative study of Crassostrea gigas and Ostrea edulis. Mar. Biol. 76, Fridovich, I., Superoxide Radical and Superoxide dismutase. Annu. Rev. Biochem Genard, B., Marie, B., Loumaye, E., Knoops, B., Legendre, P., Zal, F., Rees, J.F., Living in a hot 110
115 redox soup: Antioxidant defences of the hydrothermal worm Alvinella pompejana. Aquat. Biol. 18, German, C., Von Damm, K., Hydrothermal processes. Treatise on geochemistry Gomes, T., Pereira, C.G., Cardoso, C., Pinheiro, J.P., Cancio, I., Bebianno, M.J., Accumulation and toxicity of copper oxide nanoparticles in the digestive gland of Mytilus galloprovincialis. Aquat. Toxicol , Guezi, H., Boutet, I., Andersen, A.C., Lallier, F.H., Tanguy, A., Comparative analysis of symbiont ratios and gene expression in natural populations of two Bathymodiolus mussel species. Symbiosis 63, Hellemans, J., Mortier, G., De Paepe, A., Speleman, F., Vandesompele, J qbase relative quantification framework and software for management and automated analysis of real-time quantitative PCR data. Genome. Biol. 8: R19. Huggett, J., Dheda, K., Bustin, S., Zumla, A Real-time RT-PCR normalisation; strategies and considerations. Genes. Immun. 6: Jones, M.L., Riftia pachyptila Jones: Observations on the Vestimentiferan Worm from the Galapagos Rift. Science 213, Kadar, E., Bettencourt, R., Costa, V., Serrao Santos, R., Lobo-da-Cunha, A., Dando, P., Experimentally induced endosymbiont loss and reacquirement in the hydrothermal vent bivalve Bathymodiolus azoricus. J. Exp. Mar. Biol. Ecol. 318: Kádár, E., Postcapture depuration of essential metals in the deep sea hydrothermal mussel Bathymodiolus azoricus. Bull. Environ. Contam. Toxicol. 78, Kádár, E., Costa, V., Segonzac, M., Trophic influences of metal accumulation in natural pollution laboratories at deep-sea hydrothermal vents of the Mid-Atlantic Ridge. Sci. Total Environ. 373, Kiers, T., West, S., Endosymbiosis evolution. Science 248, Kim, B.M., Lee, J.W., Seo, J.S., Shin, K.H., Rhee, J.S., Lee, J.S., Modulated expression and enzymatic activity of the monogonont rotifer Brachionus koreanus Cu/Zn- and Mn-superoxide dismutase (SOD) in response to environmental biocides. Chemosphere 120, Kim, B.-M., Choi, B.-S., Lee, K.-W., Ki, J.S., Choi, I.Y., Rhee, J.S., Lee, J.S., 2013., Expression profile analysis of antioxidative stress and developmental pathway genes in the manganese-exposed intertidal copepod Tigriopus japonicus with 6K oligochip. Chemosphere. 92(9),
116 Kim, B.M., Rhee, J.S., Park, G.S., Lee, J., Lee, Y.M., Lee, J.S., Cu/Zn- and Mn-superoxide dismutase (SOD) from the copepod Tigriopus japonicus: molecular cloning and expression in response to environmental pollutants. Chemosphere 84, Koschinsky, A., Kausch, M., Borowski, C., Metal concentrations in the tissues of the hydrothermal vent mussel Bathymodiolus: reflection of different metal sources. Mar. Environ. Res. 95, Le Bris, N., Duperron, S., Chemosynthetic communities and biogeochemical energy pathways along the mid-atlantic ridge: the case of Bathymodiolus azoricus. Geophys. Monogr. Ser. 188, Le Bris, N., Govenar, B., Le Gall, C., Fisher, C.R., Variability of physico-chemical conditions in 9 50'N EPR diffuse flow vent habitats. Mar. Chem. 98, Lewis, C., Ellis, R.P., Vernon, E., Elliot, K., Newbatt, S., Wilson, R.W., Ocean acidification increases copper toxicity differentially in two key marine invertebrates with distinct acid-base responses. Sci. Rep. 6, Lushchak, V.I., Environmentally induced oxidative stress in aquatic animals. Aquat. Toxicol. 101, McCarthy, M.P., Carroll, D.L., Ringwood, A.H Tissue specific responses of oysters, Crassostrea virginica, to silver Nanoparticles. Aquat. Toxicol Marchand, J., Leignel, V., Moreau, B., Chenais, B., Characterization and sequence analysis of manganese superoxide dismutases from Brachyura (Crustacea: Decapoda): Hydrothermal Bythograeidae versus littoral crabs. Comp. Biochem. Physiol. - B Biochem. Mol. Biol. 153, Martins, I., Cosson, R.P., Riou, V., Sarradin, P.M., Sarrazin, J., Santos, R.S., Colaço, A., Relationship between metal levels in the vent mussel Bathymodiolus azoricus and local microhabitat chemical characteristics of Eiffel Tower (Lucky Strike). Deep. Res. Part I Oceanogr. Res. Pap. 58, Morrill A, Powell E, Bidigare R, JM (1988) Adaptations to life in the sulfide system: a comparison of oxygen detoxifying enzymes in thiobiotic and oxybiotic meiofauna (and freshwater planarians). J. Comp.Physiol. B. 3, Nicosia, A., Salamone, M., Mazzola, S., Cuttitta, A Transcriptional and Biochemical Effects of Cadmium and Manganese on the Defense System of Octopus vulgaris Paralarvae. BioMed 112
117 Research International. ID Oksanen, J., Blanchet, F. G., Kindt, R., Legendre, P., Minchin, P. R., O Hara, R. B., Simpson, G. L., Solymos, P., Henry, M., Stevens, H., and Wagner, H., Vegan: Community Ecology Package, available at: Orbea, A., Ortiz-Zarragoitia, M., Sol??, M., Porte, C., Cajaraville, M.P., Antioxidant enzymes and peroxisome proliferation in relation to contaminant body burdens of PAHs and PCBs in bivalve molluscs, crabs and fish from the Urdaibai and Plentzia estuaries (Bay of Biscay). Aquat. Toxicol. 58, Oweson, C., Hernroth, B., A comparative study on the influence of manganese on the bactericidal response of marine invertebrates. Fish Shellfish Immunol. 27, Oweson, C., Li, C., S??derh??ll, I., Hernroth, B., Effects of manganese and hypoxia on coelomocyte renewal in the echinoderm, Asterias rubens (L.). Aquat. Toxicol. 100, Parmesan, C., Ecological and Evolutionary Responses to Recent Climate Change. Annu. Ecol. Evol. Syst. 37, Podgurskaya, O.V., Kavun, V.Y Assessment of the Adaptation Capabilities of the Bivalves Modiolus modiolus (Linnaeus, 1758) and Crenomytilus grayanus (Dunker, 1853) under Increased Levels of Heavy Metals in the Environment. Russ. J. Mar. Biol. 38(2), Rainbow, P.S., Trace metal accumulation in marine invertebrates: Marine biology or marine chemistry? J. Mar. Biol. Assoc. United Kingdom 77, Regoli, F., Principato, G., Glutathione, glutathione-dependent andantioxidant enzymes in mussel, Mytilus galloprovincialis exposed to metals under metals under field and laboratory conditions:implications for the use of biochemicalbiomarkers. Aquat. Toxicol. 31, , Rodriguez-Ariza, A., Martinez-Lara, E., Pascual, P., Pedrajas, J.R., Abril, N., Dorado, G., Toribio, F., Bercena, J.A., Peinado, J., Pueyo, C., Lopez-Barea, J., Biochemical and genetic indices of marine pollution in Spanish littoral. Sci. Total Environ. 134, Rola, R.C., da Costa Monteiro, M., da Silva Reis, S.R.,Sandrini, J.Z., Molecular and biochemical biomarkers responses in the mussel Mytilus edulis collected from Southern Brazil coast. Marine Pollution Bulletin 64: Sarrazin, J., Cuvelier, D., Peton, L., Legendre, P., Sarradin, P.M., High-resolution dynamics of a deep-sea hydrothermal mussel assemblage monitored by the EMSO-Acores MoMAR observatory. Deep. Res. Part I Oceanogr. Res. Pap. 90,
118 Schmidt, P.J., Ramos-Gomez, M., Culotta, V.C., A gain of superoxide dismutase (SOD) activity obtained with CCS, the copper metallochaperone for SOD1. J. Biol. Chem. 274, Sheader, D.L., Williams, T.D., Lyons, B.P., Chipman, K., Oxidative stress response of European flounder (Platichthys flesus) to cadmium determined by a custom cdna microarray. Mar. Environ. Res. 62: Shin, D.S., DiDonato, M., Barondeau, D.P., Hura, G.L., Hitomi, C., Berglund, A.J., Getzoff, E.D., Cary, C.S., Tainer, J. a, Superoxide Dismutase Structures, Stability, Mechanism and insights into the Human Disease Amyotrophic Lateral Sclerosis from Eukariotic Thermophile Alvinella Pompejana. J. Mol. Biol. 385, Sung W, Morgan J (1980) Kinetics and product of ferrous iron oxygenation in aqueous systems. Environ. Sci. Technol. 14: Tan, Q.-G., Wang, W.-X., The influences of ambient and body calcium on cadmium and zinc accumulation in Daphnia magna. Environ. Toxicol. Chem. 27, doi: / Tapley, D.W, Buettner, G.R., Shick, J.M Free Radicals and Chemiluminescence as Products of the Spontaneous Oxidation of Sulfide in Seawater, and Their Biological Implications. Biol. Bull. 16:52. Taylor, D. A., Thompson, E. L., Nair, S. V., Raftos, D. A., Differential effects of metal contamination on the transcript expression of immune- and stress-response genes in the Sydney Rock oyster, Saccostrea glomerata. Environ. Pollut. 178, Timme-Laragy, A.R., Meyer, J.N., Waterland, R.A., Di Giulio, R.T., Analysis of CpG methylation in the killifish CYP1A promoter. Comp. Biochem. Physiol. C. Toxicol. Pharmacol. 141, Toyoshima, C., How Ca2+-ATPase pumps ions across the sarcoplasmic reticulum membrane. Biochim. Biophys. Acta - Mol. Cell Res. 1793, doi: /j.bbamcr Viarengo, A., Lowe., D., Bolognesi, C., Fabbri, E., Koehler, A The use of biomarkers in biomonitoring: a 2-tier approach assessing the level of pollutant-induced stress syndrome in sentinel organisms. Comp. Biochem. Physiol. 146: Von Damm, K.L., Controls on the Chemistry and Temporal Variability of Seafloor Hydrothermal Fluids, in: Seafloor Hydrothermal Systems: Physical, Chemical, Biological, and Geological Interactions Wallner-Kersanach, M., Theede, H., Eversberg, U., Lobo, S., Accumulation and elimination of 114
119 trace metals in a transplantation experiment with Crassostrea rhizophorae. Arch. Environ. Contam. Toxicol. 38, Weis, J.S., Mugue, N., Weis, P., Mercury tolerance, population effects, andpopulation genetics in the mummichog, Fundulus heteroclitus. In: Forbes, V.E.(Ed.), Genetics and Ecotoxicology. Taylor & Francis, Philadelphia, pp Whitehead, A., Crawford, D.L., Neutral and adaptive variation in gene expression. Proc. Natl. Acad. Sci. U. S. A. 103(14), Whitehead, A., Pilcher, W., Champlin, D., Nacci, D., Common mechanism underlies repeated evolution of extreme pollution tolerance. Proc. Biol. Sci. 279, Xu, M., Bijoux, H., Gonzalez, P., Mounicou, S., Investigating the response of cuproproteins from oysters (Crassostrea gigas) after waterborne copper exposure by metallomic and proteomic approaches. Metallomics, 6:
120 8. Figures and tables Table 1. Primers used in qpcr for SOD relative expression. Gene name Sequence GC Tm Pb Size SOD1 F: GGATCACCTACTGATAGTAAACGGC R:GTCTAGCATGTACCACTATGGACCT SOD2 F: CTCGTCAGTAAATGTAACAGGGGAG R: CTCACCTCATCAGTTGGACTACCAT SOD3 F: GACAGAGCACTACAGCTACCATAGA R: GGACTACACTGAGAAGGGTAATTTCC SOD4 F: CTGATGGTCCAGTTAATCTCGACATC R: GTTGTTCCATCTGGGTTATAGTGAGG SOD5 F: ACAGAGAGCAGTGTTACAGGGATAC R: GGAGATAAGCCATCCAATGTTCCATC SOD6 F: GATAGGGAAACAGTTACAGTGCATC R: ATTTTTCTGGAATGCTCTGTACTGC SOD7 F: GCCCACATAAGACATATCGGTGATC R: CTAATCCCATATCGTCTGGTCCAAAG RbL15 F: TATGGTAAACCTAAGACACAAGGAGT R: TGGAATGGATCAATCAAAATGATTTC 116
121 Table 2. Percentage of similitude between the cytosolic SOD sequences of B. azoricus with other marine invertebrates, M. galloprovincialis (AFQ ), C. gigas (EKC ), A.pompejana (ABY ) and M. chilensis (AEE ). SOD-1 Cu/Zn SOD-2 Cu/Zn 44.8 SOD-3 Cu/Zn SOD-4 Cu/Zn SOD-1 Cu/Zn SOD-2 Cu/Zn SOD-3 Cu/Zn SOD-4 Cu/Zn SOD-7 Cu/Zn SOD-7 Cu/Zn Cu/Zn SOD M. galloprovincialis Cu/Zn SOD C. gigas Cu/Zn SOD A.pompejana SOD M. chilensis Table 3. Percentage of similitude between the mitochondrial SOD sequence of B. azoricus with other marine invertebrates, S. purpuratus (XP_ ), L.anatina (XP_ ) and E. pallida (KXJ ). SOD-6 Mn Mn SOD S. purpuratus Mn/Fe SOD L. anatina SOD-6 Mn Mn SOD S. purpuratus 50.4 Mn/Fe SOD L. anatina Fe SOD E. pallida
122 Table 4. Percentage of similitude between the Cu-chaperone SOD sequence of B. azoricus with other marine invertebrates, S. purpuratus (XP_ ), L. anatina (XP_ ), C. gigas (XP_ ), C. intestinalis (XP_ ). SOD-5 Cu chaperone SOD SOD Cu chaperone S. purpuratus SOD Cu chaperone L. anatina SOD Cu chaperone C. gigas SOD-5 Cu chaperone SOD Cu chaperone SOD S. purpuratus 41.7 Cu chaperone SOD L. anatina Cu chaperone SOD C. gigas Cu chaperone SOD C. intestinalis
123 Table 5. Global Anova table between population for SOD relative expression in the seven populations for each tissue. Population Response Df MS F p-value Gill SOD e-7 SOD e-10 SOD e-6 SOD e-7 SOD e-6 SOD SOD e-5 Mantle SOD SOD e-8 SOD e-6 SOD e-6 SOD SOD e-5 SOD e-5 D. Gland SOD SOD e-6 SOD e-9 SOD e-13 SOD e-6 SOD e-9 SOD e-5 119
124 Table 6. Anova table for relative expression of SODs between the three tissues for each population. Population Response Df MS F p-value MG-2 SOD SOD SOD SOD SOD SOD SOD MG-3 SOD SOD SOD SOD SOD SOD SOD MG-4 SOD SOD SOD SOD SOD SOD SOD Tour Eiffel SOD SOD SOD SOD
125 SOD SOD SOD Montsegur SOD SOD SOD SOD SOD SOD SOD Termitiére SOD SOD SOD SOD SOD SOD SOD Intermediate SOD SOD SOD SOD SOD SOD SOD
126 Table 7. Anova table for relative expression of SOD in gill in mussels exposed to cadmium, copper and iron. Metal Response Df MS F p-value Cadmium SOD e-14 SOD e-16 SOD e-7 SOD SOD SOD SOD Copper SOD SOD e-16 SOD SOD SOD SOD SOD Iron SOD SOD e-16 SOD e-15 SOD SOD SOD e-5 SOD
127 Table 8. Anova table for relative expression of SOD in digestive gland in mussels exposed to cadmium, copper and iron. Metal Response Df MS F p-value Cadmium SOD e-6 SOD e-12 SOD e-8 SOD e-7 SOD e-6 SOD e-10 SOD e-5 Copper SOD e-8 SOD e-10 SOD e-07 SOD e-9 SOD e-10 SOD SOD Iron SOD SOD e-14 SOD e-13 SOD e-6 SOD SOD SOD
128 Table 9: List of SOD significantly regulated in the different metal exposure experimental conditions and in the two tissues at the different sampling times. Significant values have been obtained by the comparison between each sampling time and their respective control using a Student s t-test after 100 permutations and a p-value < Experimentation Comparison T5 T10 T15 T20 T25 T0 gill 2, 3 2, 3 1, 2, 3, 4 2, 3, 6 T0- dig gland 2 5 2, 3, 6 2, 3, 4, 6 7 Cd-gill 0.2 µm/ctr 1 1, 2, 3, 4 2, 3, 6 1µM/CTR 2, 4 2 1, 2, 3, 6 4 µm/ctr 2 2, 3 1, 4 20 µm/ctr 2, 7 3 1, 4 Cd-dig gland 0.2 µm/ctr µM/CTR 1, 2, 3, 4 2, 4 1, 2, 3, 6 2, 4 4 µm/ctr 4, 5, 6, 7 1, 2, µm/ctr 1, 2, 4, 5, 6, 7 2, 4 2, 5, 7 2 Cu-gill 4 µm/ctr 2 1, 4 1, 4 2, 3 25 µm/ctr µm/ctr 2, Cu-dig gland 4 µm/ctr 1, 2, 3, 4, 6 5 1, 3, 5, 6, 7 1, 2, 3, 4 25 µm/ctr 2, 3, 4, 6, 7 2, 3, 7 1, 2 1, 2, 3, 4, 7 60 µm/ctr 2 1, 4, 5 7 1, 2, 3, 4, 7 Fe-gill 1 µm/ctr , 6, 7 1, 2 5 µm/ctr 2, 4, 4 2, 4, 7 2, 3 2, 6 20 µm/ctr 2, , 6 Fe-dig gland 1 µm/ctr 3, 4 5 1, 2, µm/ctr 2, , 2, 3, 5, µm/ctr 3, 4, 5, 6 3 1, 3, 7 1, 2, 3, 4 124
129 !"#$%!"#$%!"#$%!"#$%!'()*+,%* &%!"#$%!"#$$$$$$$$$$$$$$!"%$$$$$$$$$$$$$!"&$$$$$$$$$$'($)*++,-$$$$$$$!./01,234$$$$$',45*0*64,$$$$7/0,45,8*90,!"#$%!"#$%!"#$%!"#$%!'()*+,%* &%!"#$%!"#$$$$$$$$$$$$$$!"%$$$$$$$$$$$$$!"&$$$$$$$$$$'($)*++,-$$$$$$$!./01,234$$$$$',45*0*64,$$$$7/0,45,8*90, 125
130 !"#$%!"#$%!"#$%!"#$%!'()*+,%* &%!"#$%!"#$$$$$$$$$$$$$$!"%$$$$$$$$$$$$$!"&$$$$$$$$$$'($)*++,-$$$$$$$!./01,234$$$$$',45*0*64,$$$$7/0,45,8*90, C+D6('! <;' 6*&%:+J*' *`B0*22+"#' ag"&,' 1;%#?*b' "G' :;*' 2*J*#' HX72' E*:_**#' :;*' 2*J*#' B"B)&%:+"#2' *`B0*22+"#'"G'*%1;'HX72'+2"G"0Z'+#':;*'2%Z*':+22)*2'+#'%&&'B"B)&%:+"#24' ' 126
131 !"##$$$$$$$$$$$$$$$$$$$$$$$$$$$$$$$$$$$$$$$$$%&'(#)$$$$$$$$$$$$$$$$$$$$$$$$$$$$$$$$*"+),("-)$+#&'.$!"##$$$$$$$$$$$$$$$$$$$$$$$$$$$$$$$$$$$$$$$$$%&'(#)$$$$$$$$$$$$$$$$$$$$$$$$$$$$$$$$*"+),("-)$+#&'.$!"##$$$$$$$$$$$$$$$$$$$$$$$$$$$$$$$$$$$$$$$$$%&'(#)$$$$$$$$$$$$$$$$$$$$$$$$$$$$$$$$*"+),("-)$+#&'.$!"##$$$$$$$$$$$$$$$$$$$$$$$$$$$$$$$$$$$$$$$$$%&'(#)$$$$$$$$$$$$$$$$$$$$$$$$$$$$$$$$*"+),("-)$+#&'.$!"##$$$$$$$$$$$$$$$$$$$$$$$$$$$$$$$$$$$$$$$$$%&'(#)$$$$$$$$$$$$$$$$$$$$$$$$$$$$$$$$*"+),("-)$+#&'.$!"##$$$$$$$$$$$$$$$$$$$$$$$$$$$$$$$$$$$$$$$$$%&'(#)$$$$$$$$$$$$$$$$$$$$$$$$$$$$$$$$*"+),("-)$+#&'.$!"##$$$$$$$$$$$$$$$$$$$$$$$$$$$$$$$$$$$$$$$$$%&'(#)$$$$$$$$$$$$$$$$$$$$$$$$$$$$$$$$*"+),("-)$+#&'.$ Figure 2. Relative expression (fold change) of the seven SODs in the three tissues gill, mantle and digestive gland analysed in the seven populations. Data are normalized using the mean expression of each SODs isoform in the three tissues within each population. 127
132 128
133 C+D6('! O;!!&"E%&' a67=b' G"0' Z*:%&' 1"#1*#:0%:+"#' %#,' 0*&%:+J*' HX72'?*#*' *`B0*22+"#' +#' :;*' :;0**' :+22)*2.'?+&&.' Z%#:&*' %#,',+?*2:+J*'?&%#,4' >;*' %#?&*' E*:_**#' %00"_2' 0*B0*2*#:2':;*',*?0**'"G'1"00*&%:+"#'E*:_**#'J%0+%E&*24' '%"! '$"! '#"! ;7:91529<*1=9,:*#-*)1<6 /*0,1)*23)242).156 '!"! &"! %"! $"! #"!!"! ()*!"# ()*' ()*$ ()*#! +,*' +,*- +,*#! (.*$ (.*#- (.*%! (738,39:19273*.; ' C+D6('! E;' L*01*#:%?*' "G' %G:*0' "G' *`B"2+:+"#' :"' :;*',+GG*0*#:' Z*:%&2' %#,' 1"#1*#:0%:+"#24' ' 129
/!&34#01(&5!6)%,! -()4,! (&4(&0&$'0!")
2.*1.8! %#44&(8! *(#$9!")
$! )$2! 0')$2)(2! 2&:*)'*#$! :)/1&0! +#(! )//!")
2! )$2! %#$'(#/! ',)'! )(&! (&4(&0&$'&2!;<!")
134 !!!"#$%&' ()! "#$%&$'()'*#$! #+! ',&! &*-,'!.&')/0!.&)01(&2!*$!-*//!21(*$-!',&!.&')/!&34#01(&5!6)%,! -()4,! (&4(&0&$'0! ',&!.&')/! %#$%&$'()'*#$!.&)01(&2! *$! ',&! ',(&&! 2*++&(&$'! &34#01(&! %#$2*'*#$0! 7%)2.*1.8! %#44&(8! *(#$9! )$2! %#$'(#/!.100&/05!"#$%&$'()'*#$!:)/1&0!%#((&04#$2!'#!',&!.&)$! )$2! 0')$2)(2! 2&:*)'*#$! :)/1&0! +#(! )//! %#$%&$'()'*#$0! #+! &)%,!.&')/! 7%)2.*1.8! %#44&(8! *(#$9! &3%&4'! +#(! /&)2! )$2! %#$'(#/! ',)'! )(&! (&4(&0&$'&2!;<!#$/<!#$&!:)/1&!! 130
$2! 21(*$-! ',&!.&')/! &34#01(&5! 6)%,!")
2.*1.8!%#44&(8!")
$!)$2!0')$2)(2!2&:*)'*#$!:)/1&0!+#(!)//!")
2! )$2! %#$'(#/! ',)'! )(&! (&4(&0&$'&2!;<!")
135 !!!!"#$%&' *)! "#$%&$'()'*#$! #+! ',&! &*-,'!.&')/0!.&)01(&2! *$! 2*-&0'*:&! -/)$2! 21(*$-! ',&!.&')/! &34#01(&5! 6)%,! -()4,! (&4(&0&$'0! ',&!.&')/! %#$%&$'()'*#$!.&)01(&2! *$! ',&! ',(&&! 2*++&(&$'! &34#01(&!%#$2*'*#$0!7%)2.*1.8!%#44&(8!*(#$9!)$2! %#$'(#/!.100&/05!"#$%&$'()'*#$!:)/1&0!%#((&04#$2! '#!',&!.&)$!)$2!0')$2)(2!2&:*)'*#$!:)/1&0!+#(!)//! %#$%&$'()'*#$0! #+! &)%,!.&')/! 7%)2.*1.8! %#44&(8! *(#$9! &3%&4'! +#(! /&)2! )$2! %#$'(#/! ',)'! )(&! (&4(&0&$'&2!;<!#$/<!#$&!:)/1&! 131
136 20 T0 5 days 10 days 15 days 20 days Control Control 0,2µM 1µM 4µM 20µM Control 0,2µM 1µM 4µM 20µM Control 0,2µM 1µM 4µM 20µM Control 0,2µM 1µM 20 T0 5 days 10 days 15 days 20 days Control Control 4µM 25µM 60µM Control 4µM 25µM 60µM Control 4µM 25µM 60µM Control 4µM 25µM 60µM 132
137 +, 3, *./012 ',./012 '*./012 +,./012 +*./012 ',, -',!"#$%"&!"#$%"& '() *() +,()!"#$%"& '() *() +,()!"#$%"& '() *() +,()!"#$%"& '() *() +,()!"#$%"& '() *()!! Figure 7. Relative expression levels in gills for the seven SODs genes during days of exposure to cadmium, copper and iron in different concentrations.!!!! 133
138 30 T0 5 days 10 days 15 days 20 days Control Control 4µM 25µM 60µM Control 4µM 25µM 60µM Control 4µM 25µM 60µM Control 4µM 25µM 60µM 5.0 T0 5 days 10 days 15 days 20 days 25 days Control Control 1µM 5µM 20µM Control 1µM 5µM 20µM Control 1µM 5µM 20µM Control 1µM 5µM 20µM Control 1µM 5µM Figure 8. Relative expression levels in digestive gland for the seven SODs genes during days of exposure to cadmium, copper and iron in different concentrations. 134
!+4!40$!40/$$!01&/240$/,+-!5$%4!)'4$)!26! 40$!")

139 "##$%&'($)!!!"#$%&'()*!*+,#-'%.!+/$+!+%&!#01)'(23(0$,'(+-!(2%&'4'2%)!+4!40$!40/$$!01&/240$/,+-!5$%4!)'4$)!26! 40$! 7'&3"4-+%4'(! 8'&.$! 9! 7$%$:! ;<$%! *4/'B$! +%&! 8+'%C2<! =8D>?! "&+#4$&! 6/2,! E0+/-2A!$4!+-!FGGF?!!!!!!!!!!!!!!!!!!!! 135
, C. gigas (EKC41617.1), A.pompejana (ABY50192.1) and M.")
140 Apendix 2. Alignment of the five cytosolic superoxide dismutase with the sequences of M. galloprovincialis (AFQ ), C. gigas (EKC ), A.pompejana (ABY ) and M. chilensis (AEE ). 136
with the sequences of S.")
141 Apendix 3. Alignment of the mitochondrial superoxide dismutase (SOD6)with the sequences of S. purpuratus (XP_ ), L.anatina (XP_ ) and E. pallida (KXJ ). 137
, L. anatina (XP_013404594.1), C. gigas (XP_011446778.1), C. intestinalis (XP_002122009.")
142 Apendix 4. Alignment of the chaperone superoxide dismutase (SOD5)with the sequences of S. purpuratus (XP_ ), L. anatina (XP_ ), C. gigas (XP_ ), C. intestinalis (XP_ ). 138
143 Apendix 5. Measured concentrations in gills and digestive gland of cadmium, copper, iron and lead across 25 exposure days for each metal concentration and control mussels, (x) represent not measured concentration due mortality. µg/g of dry weight Metal Cd Cu Fe Pb Cd Cu Fe Pb Cd Cu Fe Pb Cd Cu Fe Pb Cd Cu Fe Pb Cd 0,2 µm 3,1 93, ,5 10,6 209, ,1 3,6 141, ,2 4,5 156, ,9 x x x x Cd 1 µm 6,0 100, ,1 4,8 152, ,5 10,8 153, ,5 5,4 141, ,0 x x x x Cd 4 µm 10,7 137, ,7 4,5 241, ,4 4,1 137, ,3 4,3 163, ,8 x x x x Cd 20 µm 5,7 137, ,9 7,3 257, ,7 4,7 446, ,6 x x x x x x x x Cu 4 µm 5,9 98, ,5 3,8 231, ,3 4,5 242, ,3 4,0 225, ,9 x x x x Cu 25 µm 2,6 107, ,0 2,8 130, ,0 3,5 113, ,9 3,8 267, ,9 x x x x Cu 60 µm 3,9 222, ,5 9,5 358, ,2 4,2 311, ,7 5,5 233, ,1 x x x x Fe 1 µm 2,0 53, ,0 4,5 45, ,5 2,8 125, ,7 7,5 41, ,9 3,4 29,6 88 6,1 Fe 5 µm 3,4 48, ,1 2,3 40, ,6 7,3 38, ,6 4,6 42, ,8 2,7 29, ,5 Fe 20 µm 7,3 47, ,4 2,1 40, ,7 3,7 47, ,0 3,8 151, ,8 x x x x Controles 7,3 58, ,8 8,0 61, ,4 4,1 55, ,2 6,0 44, ,6 4,1 32, ,0 µg/g of dry weight GILLS After 5 days After 10 days After 15 days After 20 days After 25 days DIGESTIVE GLAND After 5 days After 10 days After 15 days After 20 days After 25 days Metal Cd Cu Fe Pb Cd Cu Fe Pb Cd Cu Fe Pb Cd Cu Fe Pb Cd Cu Fe Pb Cd 0,2 µm 11,0 29, ,6 20,3 48, ,6 12,7 44, ,0 8,1 33, ,7 x x x x Cd 1 µm 11,6 22, ,2 17,4 35, ,1 22,7 60, ,5 11,3 43, ,8 x x x x Cd 4 µm 21,4 44, ,9 11,6 52, ,8 20,1 52, ,3 5,8 29,6 62 2,0 x x x x Cd 20 µm 11,9 35, ,9 17,8 52, ,5 12,6 65, ,7 x x x x x x x x Cu 4 µm 11,2 26, ,0 12,4 61, ,3 10,4 76, ,3 2,6 46,4 55 1,0 x x x x Cu 25 µm 11,3 195, ,3 13,8 156, ,4 12,9 54, ,2 3,6 84,0 82 2,7 x x x x Cu 60 µm 8,8 64, ,3 22,7 55, ,2 13,2 70, ,5 2,7 432,8 34 1,3 x x x x Fe 1 µm 18,4 57, ,1 24,1 51, ,8 8,0 31, ,5 13,5 25, ,4 5,5 17, ,8 Fe 5 µm 9,2 33, ,5 8,3 24, ,7 12,5 35, ,0 9,5 28, ,7 13,1 25, ,5 Fe 20 µm 19,3 35, ,1 13,9 36, ,2 18,2 26, ,7 11,9 29, ,1 x x x x Controles 24,7 50, ,2 14,1 37, ,0 11,7 32, ,1 4,0 17,7 84 1,7 11,7 33, ,6 139
144 Apendix 6. Measured concentrations in gills and digestive gland of zinc, calcium, magnesium and manganese across 25 exposure days for each metal concentration and control mussels, (x) represent not measured concentration due mortality. µg/g of dry weight Metal Zn Ca Mg Mn Zn Ca Mg Mn Zn Ca Mg Mn Zn Ca Mg Mn Zn Ca Mg Mn Cd 0,2 µm 152, ,1 200, ,1 181, ,7 140, ,9 x x x x Cd 1 µm 130, ,4 182, ,3 187, ,1 136, ,8 x x x x Cd 4 µm 184, ,3 156, ,0 135, ,5 132, ,2 x x x x Cd 20 µm 145, ,3 146, ,1 172, ,8 x x x x x x x x Cu 4 µm 149, ,6 151, ,1 144, ,8 142, ,4 x x x x Cu 25 µm 152, ,3 162, ,9 141, ,9 154, ,4 x x x x Cu 60 µm 167, ,6 192, ,4 147, ,2 139, ,3 x x x x Fe 1 µm 117, ,9 128, ,2 128, ,3 132, ,4 96, ,1 Fe 5 µm 159, ,4 107, ,8 106, ,6 134, ,4 99, ,9 Fe 20 µm 131, ,9 106, ,7 137, ,9 126, ,4 x x x x Controles 194, ,8 211, ,4 187, ,4 188, ,9 138, ,3 µg/g of dry weight GILLS After 5 days After 10 days After 15 days After 20 days After 25 days DIGESTIVE GLAND After 5 days After 10 days After 15 days After 20 days After 25 days Metal Zn Ca Mg Mn Zn Ca Mg Mn Zn Ca Mg Mn Zn Ca Mg Mn Zn Ca Mg Mn Cd 0,2 µm 98, ,4 113, ,1 110, ,6 87, ,5 x x x x Cd 1 µm 94, ,7 108, ,3 141, ,7 181, ,9 x x x x Cd 4 µm 156, ,2 130, ,0 118, ,1 106, ,2 x x x x Cd 20 µm 106, ,4 122, ,0 110, ,1 x x x x x x x x Cu 4 µm 93, ,7 108, ,7 139, ,3 96, ,2 x x x x Cu 25 µm 93, ,2 192, ,3 116, ,0 115, ,1 x x x x Cu 60 µm 87, ,8 123, ,8 102, ,9 119, ,3 x x x x Fe 1 µm 162, ,3 131, ,0 83, ,4 93, ,2 88, ,0 Fe 5 µm 141, ,7 92, ,5 101, ,2 100, ,8 113, ,0 Fe 20 µm 107, ,6 93, ,1 98, ,4 96, ,2 x x x x Controles 174, ,2 136, ,6 106, ,2 140, ,3 146, ,9 140
145 Chapter IV Article III: Identification and regulation of ferritins the hydrothermal vent mussel Bathymodiolus azoricus in natural and experimental populations. Gonzalo Fuenzalida 1,2, Francois H. Lallier 1,2, Ricardo D. Riso 3, Matthieu Waeles 3, Arnaud Tanguy 1,2 Corresponding author: 1 Sorbonne Universités, UPMC Univ Paris 06, UMR 7144, Equipe ABICE, Station Biologique de Roscoff, Roscoff, France 2 CNRS, UMR 7144, Adaptation et Diversité en Milieu Marin, Station Biologique de Roscoff, Roscoff, France 3 Univ Bretagne Occidentale, IUEM, CNRS, LEMAR,UMR 6539,Grp Chim Marine, Pl N Copernic, F Plouzane, France In this chapter, we present the draft of a paper in preparation dedicated to the characterization of seven isoforms of ferritins identifed in B. azoricus. We addressed the question of the regulation of these isoforms in different tissues in both natural and experimental populations and try to identify correlation between transcriptomic profile and iron content in tissues. 141
146 1. Introduction In oceans, iron is an essential metal for many forms of life since it represents an micronutrient that control plankton blooms and consequently have an strong impact on biogeochemical cycles of carbon and nitrogen (Boyd et al., 2007). Iron is physiologically involved in several cellular process like electron transport, oxidative phosphorylation and DNA biosynthesis (Andrews, 2008). Depletion in iron may generate a cellular malfunction when excess can be toxic by triggering the generation of oxidative stress (Lushchak, 2011). Therefore the mechanisms involved in iron storage, metabolism and transport have critical importance for living organism. Ferritin, a conserved protein found from bacteria to humans, is the principal protein involved in iron storage (Aisen et al., 2001; Theil, 1987). Ferritins are structurally complex proteins usually present in the cytosol formed by 24 subunits of two types of polypeptide chains giving a globular shape that can accommodate large quantity of iron in his interior (Lobreaux et al., 1992). The process by which iron is stored begin in the H (heavy) chain which oxidizes Fe 2+ in a specific ferroxidase site, and the L (Light) chain perform the entry of the metal into the protein, while more metals enter the Fe 3+ cluster formed in the protein cavity(strange et al., 1993). In marine ecosystems, iron is originated from natural source or by anthropogenic contamination and is mainly present under ferrous Fe 2+ and ferric Fe 3+ forms with great redox potential. The role of ferritins in marine invertebrates is less documented compared to other detoxification proteins. Ferritins have also been shown to play a role in development (Chen et al., 2003; Levenson and Fitch, 2000), or immunity (Li et al., 2008; Zhang et al., 2006). In the clam Meretrix meretrix, ferritin is reported to be involved in larval shell development (Wang et al., 2009). The molecular characterization of ferritins genes has been reported in several species (Beck et al., 2002; Durand et al., 2004; Ren et al., 2014), but in marine species, the physiological role of ferritins has been only partly described in few organisms. Ferritins have been suspected to play a role in the immune defense in response to bacteria challenge (Chávez-Mardones et al., 2013; Núñez- Acuña et al., 2013), in the response to hypoxia/anoxia periods (Larade and Storey, 2004) or thermal stress (Salinas-Clarot et al., 2011) and it also has been reported that they could participate to the storage of other types of heavy metals acting as a detoxification mechanisms in cells and tissues (Chen et al., 2015; Zapata et al., 2009). However, the principal function of ferritins remains iron homeostasis and several studies showed that both gene transcription and protein expression are positively correlated with the exposure of iron in several bivalves species (Zhang et al., 2013; Zhou et al., 2014). The hydrothermal vent are ecosystems characterized by high concentrations of metals that emerge from the hydrothermal chimney, however the concentration and quantity of 142
147 metals vary between vents associated to the characteristics of the sea floor (Von Damm, 1995). The vents from the Mid Atlantic Ridge (MAR) and particularly the Azores triple junction, are characterized by different physico-chemical condition specially the site of Menez Gwen (MG), Lucky Strike (LS) and Rainbow (RB) where the concentration of metals widely vary between these sites and especially iron which show very high concentrations at RB (Charlou et al., 2000, 2002). In this vent one of the most abundant species is is the bivalve Bathymodiolus azoricus which form dense bed mussels with high density (Desbruyere et al., 2000; Sarrazin et al., 2015). Previous work evidence the plasticity of B. azoricus to the accumulation of essential (iron, copper, zinc) and non-essential (cadmium, mercury, lead) metals in different tissues like gills, mantle, digestive gland, foot with different concentrations related or not to the concentration found in the fluid (Demina, L.L, 2008; Kádár, 2007; Koschinsky et al., 2014). The role of ferritin is not well reported in hydrothermal species, in the case of B. azoricus, Martins et al (2015) revealed a higher relative expression in the population of Menez Gwen compared to Lucky Strike that was associated with variations in immune system. In a second study the expression of four ferritin genes was analysed in B. azoricus exposed to several cocktail of metals and strong variations in gene expression was detected for those genes according to metals cocktails, revealing a complex pattern of iron homeostasis in B. azoricus (Bougerol et al., 2015). In this work we analyzed the differential expression of seven genes encoding ferritins in natural and experimental populations in different tissues in the aim to better characterize the role of ferritins regulation in the response of B. azoricus in a naturally iron rich ecosystem. 2. Materials and methods 2.1. Biological samples Samples of B. azoricus were collected from Mid-Atlantic Ridge in August 2013, during the BIOBAZ cruise on the research vessel Pourquoi Pas?, using the Remote Operating Vehicle (ROV) Victor The collection was made in three different vents sites Menez Gwen (37 50 N, W, 800mdepth, 3 populations called MG2, MG3 and MG4), Lucky Strike (37 17 N, W, 1700m depth, 2 populations collected at Tour Eiffel and Montsegur) and Rainbow (36 14 N, W, 2300m depth, 2 populations collected at Termitière and Intermediate. The samples were collected 143
148 and placed in hermetic boxes then brought on board. Gills, mantle and digestive gland of each individual were immediately dissected and fixed in liquid nitrogen until further analysis. An additional population of mussels was collected at Menez Gwen site (MG2) and used in an experimental exposure to iron because of their ability to survive for a long time at atmospheric pressure (Kadar et al., 2005). Once on board, 4 groups of 150 mussels from various size (from 12 to 80 mm) were placed in tanks containing 30 liters of filtered sea water and kept at 7 C. Then, in three tanks, mussels were exposed to 1µM, 5µM and 20µM of iron. The control tank was not exposed to iron to follow the effect of experimental design (use of surface sea water and absence of pressure and gases). Every five days, 10 individuals were sampled in each tank and pieces of gills and digestive gland were dissected and fixed in liquid nitrogen for further analysis RNA Extraction and qpcr Total RNA of gill, mantle and gland digestive was extracted using Tri-Reagent (Sigma, St. Louis, MO) according to the manufacturer s instructions. Two µg of total RNA were reverse transcripted using M-MLV reverse transcriptase (Promega, Madison, WI). For gene expression, a volume of 2 μl of each diluted reverse transcription product (1:200) was subjected to real-time PCR in a final volume of 5 μl containing 40 nm of each specific primer and 2 Lightcycler 480 SYBR Green I Master mix (Roche Diagnostics, Mannheim Germany). The amplification was carried out as follows: initial enzyme activation at 95 C for 15 min, then 45 cycles of 95 C for 10 sec and 60 C for 30 sec. A dissociation curve was generated and PCR efficiency was estimated for each primer pair. All primer pairs tested (Table 1) generated a single peak in the dissociation curve and a PCR efficiency of 95 to 100%. The ribosomal protein L15 gene (RpL15) was used as the internal PCR control as already used in previous studies (Bougerol et al., 2015; Boutet et al., 2011; Guezi et al., 2014). All ferrtins sequences were obtained from the seqeuncing of B. azoricus transcriptome (Sequence Read Archive (DRA, accession number DRA ) 144
149 2.3. Statistical analyses The relative expression of each gene was calculated according to the comparative Ct method using the formula RQ = ΔΔCt (with ΔCt gene X = Ct gen X Ct RpL15 ; ΔΔCt= ΔCt gene X mean Ct gene X ). The first analysis was conducted to determine the inter-population effect in the variation of gene expression and we normalized the data by the mean Ct gene X of all populations for one tissue (gills, mantle or digestive gland). The second analysis was conducted to determine the intra-population effect of the expression and we normalized the data by the mean Ct gene X in the three tissues for each population. ANOVA test was used to evaluate differences in metal accumulation and relative expression considering population and tissues as explanatory factors (R studio software). For the metal exposure experiment the data was normalized by the mean Ct gene X in each gene for each iron concentration. Canonical redundancy analysis (RDA) was used to evaluate the influence of metal accumulation in the variation of gene expression using the Vegan package (Oksanen et al 2016) in R environment. Test of significativity between ferritins in each experimental condition in both tissues were performed using additional Student T-tests with 100 permutations and a p-value= Results 3.1 Ferritins characterization We report the sequences of seven ferritin in B. azoricus. Five ferritins isoforms (Fer1 to Fer5) show high levels of similarity between them and with other marine bivalves with values ranging from between 68 to 94% of identity (Fig.1). The two other ferritin sequences encoding a Soma ferritin (Sfer) and a Yolk ferritin (Yfer) have lower levels of similitude that not exceed the 30% (Fig.2) and 45% respectively (Fig.3). 3.2 Relative expression of ferritins between populations In gills, the relative expression of ferritin in the seven populations is presented in Figure 4. ANOVA analysis shows that all ferritins except S-fer are significantly regulated between populations (Table 2). (Fig. 4). No clear pattern of regulation is observed at a vent site scale and but specific population signature can be identified. MG2 population show a global higher expression for all ferritins with the exception of Sfer compared to all populations except Intermediate. MG3 and Tour Eiffel present the lowest level of expression for all ferritins and the three other populations present a relative similar pattern of regulation. 145
150 In mantle, ANOVA analysis shows that all ferritins except Y-fer and Fer4 are significantly regulated between populations (Table 2). The pattern of expression observed in mantle is similar to gills with a higher expression in MG2 and Intermediate populations when MG3, MG4 and T. Eiffel show a global down regulation for all ferritins (Fig. 4). In the digestive gland, ANOVA analysis show that ferritins Y-fer, Fer1, Fer4 and Fer45 are significantly regulated between populations (Table 2, at p<0.01). (Fig. 4), The ferritin regulation pattern in digestive gland is characterized by a global higher expression of ferritins in MG3, Tour Eiffel and Intermediate populations and a lower expression in Termitière and Montsegur. 3.3 Tissues differential expression of ferritins within the populations The results of the relative expression of ferritins between tissues in the seven populations are presented in Figure 5 and ANOVA analysis results are presented in Table 3. In all the populations, a global down regulation pattern is observed in the mantle for all the ferritins genes compared to the other tissues, while the high levels of expression are detected in the digestive gland especially for Fer3, Fer4, Sfer and YFer (the highest values being observed in both populations of Lucky Strike (Montsegur and Tour Eiffel). ANOVA analysis shows that most of the ferritins exhibit a significant difference in expression between tissues within a population. However, we notice that Fer 2 is only significantly regulated in the three MG populations. 3.4 Redundancy analysis (RDA) We use RDA analysis to test the significance of the metal concentration in the relative expression of ferritins genes in gill, mantle and digestive gland (Figure 6). In gills, metal concentration explains 17.6% of the variation and the first axis of the RDA1 explain 83.5% of the 17.6% and versus only 9.4% for the RDA2. RDA show an opposite relationship between ferritins expression and metal content except for Soma ferritin (Sfer) which appears mainly correlated with iron and calcium followed by lead and manganese and in less extend with copper. In mantle, the RDA analysis explains 14.3% of the variation with the first axis explaining 71.5% of this variation. A relationship is mainly observed for Fer2 and Fer5 with iron and manganese. In the digestive gland, the RDA analysis explains 10.3% of the total variation with the first axis explaining 75.2%. A relationship between Fer3, Fer5 and Sfer is observed mainly with calcium and cadmium and Fer1, Fer2, Fer4 and Yfer with copper and cadmium. 146
151 3.5 Relative expression of ferritins in mussels exposed to iron. We report the levels of relative expression of the seven genes in gill and digestive gland of individuals exposed for 25 days to three iron concentrations, 1µM, 5µM and 20µM concentration (Figure 7). In gills, the relative expression of almost all the ferritin genes have significant differences during the course of the experiment with the exception of Yfer (Table 4). In this tissue, the expression in control mussels do not strongly differ from T0 except at day 20 where a significant increase of Fer2, Fer3, Fer4, Fer5 (T-test, p<0.05) is observed. At day 5, no variation in ferritin expression is observed except a significant increase of Fer1 expression (T-test, p<0.05) detected at the 1 and 5µm concentrations. At day 10, a significant down-regulation is observed for Yfer at both 1 and 5µm and an up-regulation of Fer2 at 20 µm and Fer3 at 5 µm. At day 15, only Fer1 is significantly up-regulated at 1µM and a higher expression in observed for Sfer at 5 and 20µM. At day 20, a strong significant down-regulation is observed at 5µM except for Fer1 and Yfer and for Fer2 at 1 and 20 µm compared to the control. At day 25, a significant up-regulation is only observed at 1µM for Fer1 and Fer2. In the digestive gland, ANOVA results showed that a significant regulation is observed for all ferritins except Fer3 and Yfer (Table 3). The expression in control mussels no not differ from T0 except at day 25 for Fer2 (T-test, p<0.05). At day 5, no variation in ferritin expression is detected between exposed and control mussels. At day 10, Fer4 and Yfer expression is significantly decreased at 5µM. At day 15, no significant change are detected. At day 20, a significant increase of all ferritins except Fer3 is detected (T-test, p<0.05) at 20 µm, and for Fer3 Fer4, Sfer and Yfer at 1µM and Fer3 at 5µM. At day 25, only Fer3 and Fer4 are significantly up-regulated at 5µM. 4. Discussion The understanding of the mechanism of metal tolerance and detoxification in hydrothermal species remain limited compared to data reported in many other bivalve species living in coastal ecosystems despite the fact that hydrothermal vent has been described as a natural laboratory for pollution studies due to the high concentration of metals. In B. azoricus, the tolerance to heavy metals has been evidenced (Kádár, 2007; Kádár et al., 2006) and several molecular markers have been suggested to play a role in metal tolerance and detoxification (Bebianno et al., 2005; Bougerol et al., 2015; Company et al., 2010; Hardivillier et al., 2004). However, the role of ferritins is not well documented in this species neither in other hydrothermal species. 4.1 Ferritin characterization 147
152 In our work, we described seven ferritin genes in the bivalve B. azoricus where Fer1, Fer2, Fer3, Fer4 and Fer5 show the higher degree of identity with other marine mussel species ferritins as M. edulis and M. chilensis. The amino acid residues of ferroxidase center and nucleation center are conserved in B. azoricus sequences compared with the other species, those centers being strongly involved in the iron loading into the ferritin protein (Hilton et al., 2012). Stronger differences are observed in the Soma ferritin (Sfer) and Yolk ferritin (Yfer), where in the Sfer, amino acid change is observed in the nucleation center at the position 62 of B. azoricus where a Serine (S) residue replace the Glutamic acid (E) present the other bivalve sequence, and another replacement is detected at the position 140 where a Lysine (K) is found in B. azoricus instead of a Glutamine (Q) in the other mussel species. In Yfer, amino acid changes are reported for the ferroxidase center in the position 75, 78 and 82. The two sequences are structurally different to the other five ferritins genes, so their main function may not be directly related to iron detoxification processes. 4.2 Ferritin regulation in natural populations One of the characteristics of the vent from the Azores triple junction is the elevated concentration of iron that emerge from the chimney associated with large spatio-temporal fluctuations (Sarrazin et al., 2014). Based on known iron concentrations in fluids (Charlou et al., 2002), we may expect that regulation of ferritins in natural populations could be a relevant biomarkers of iron exposure. Biochemical changes in an organism are highly labile but can also be related to environmental factors or genetic differences within a population (Romeo et al., 2003) and the metal distribution among organs represent a total index which can be considered as an accurate assessment of the organism s response to increased heavy metal levels in the environment (Kavun and Shul kin, 2005). In gill, the higher levels of expression reported in MG2, MG4 and Intermediate cannot be directly associated to the iron concentrations in this tissue, the highest iron concentration being detected the Termitiere population that exhibit a lower expression of all ferritins. The same trend is observed for the mantle. In the digestive gland, the population of Intermediate also exhibits a higher gene expression but for all the six other populations, the expression pattern of ferritins is inverted compare to gill and mantle. Recently works in bivalves exposed to metals reveal that both metal uptake and the expression of methallothioneins and ferritins can be modulated by the levels of ph and CO 2 concentration (Ivanina et al., 2015). Both parameters are fluctuating in hydrothermal vent with different spatio-temporal scales, so the variation in ferritin expression reported in this work may reflect the interaction between iron present in the surrounding water and those factors. 148
153 The comparison of ferritin expression between tissues reveal a conserved pattern of expression in all the populations, the mantle showing the lower level of expression for all the genes and the digestive gland globally exhibiting the higher levels of expression. This high expression in digestive gland is in agreement with the major iron concentration measured in this tissue. Similar differences between gills and mantle has been reported for the surf clam Mesodesma donacium in natural conditions (Maldonado-Aguayo et al., 2014), however the fold change differences are lower compared to those reported in the present study work with ratio ranging from 10 to 70 times more in digestive gland that in mantle. Similar trend is reported for oysters exposed to pesticides evidencing a organ and site specific ferritin response possibly related to acclimation to pollution (Collin et al., 2010). To test the role of metal concentration in ferritin expression we chose the redundancy analysis to detect possible specificity for certain metals previously measured in tissues form the same populations and our result suggest a tissue specific response in ferritins genes but not directly related to iron concentration. Sfer remain the only gene related to metals, principally calcium, iron, lead and manganese and in mantle only Fer2 and Fer5 are related to iron and no correlation is reported in digestive gland. 4.3 Ferritin regulation in iron exposure experiment In marine bivalves the expression of ferritins in experimental metal exposure conditions is restricted to a low number of species and no long term exposure has been described in the literature leading to a difficult comparison of our results. Ferritin up-regulation has been described in response to situations of anoxia/ischemia such as in snail (Larade and Storey, 2004), and frog (Storey, 2004). In the mollusc Tegillarca granosa, a ferritin subunit similar to GF1 was found to be up-regulated after 24h of exposure to iron then down-regulated after 48h, suggesting a complex pattern of expression for ferritin (Jin et al., 2011). Typical yolk protein precursors are developmentally regulated proteins and show a tissue- and sex-specific expression (Wahli, 1988). Yolk ferritins are also able to store iron together with some phosphate (Bottke et al., 1982) and the presence of the ferroxidase center in the yolk ferritin suggests a possible ability of this protein to accelerate iron oxidation. In snails, it has been evidenced a putative role of these proteins in ion transport during the vitellogenesis production, specifically inside gametocytes for yolk ferritin (Bottke et al., 1988) and in somatic tissues for the soma ferritin (Von Darl et al., 1994). Gills constitute an interface for dissolved metal uptake, feeding and gas exchange while the digestive gland is responsible for the absorption of nutrient and is also a major site for metal accumulation (Marigómez et al., 2002) and in natural population of B. azoricus, digestive gland exhibit the higher iron concentrations. During the exposure, the relative 149
154 expression of ferritins in gills show an increase after 20 days which is partly maintained at day 25 in control mussels. In the digestive gland, less variations are observed in the ferritin regulation except for Fer3, Fer4 and Yfer especially after 20 days of exposure suggesting that this tissue may be not affected by iron in the beginning of the experiment. The iron quantification made on samples used in this experiment only shows an accumulation of iron after 20 days in the digestive gland and not in gills (Figure 8 and 9). The control can be considered as a depuration experiment in which no metal was added so the activation of ferritins expression could be interpreted as a response to the capture of the released iron stored in lysosomes and cellular ligands but also as a global response to experimental conditions. We detect a regulation of the Sfer gene expression but not in the Yfer according to time exposure Inhibition of Yfer was reported in experimental cocktail metal exposure recreating natural conditions in B. azoricus (Bougerol et al., 2015). Sfer and Yfer have been implicated in processes of vitellogenesis even this specific role remain unclear, and iron supply for embryo or protection of embryo and larva against bacterial growth have been proposed as possible functions (Schussler et al., 1995). We did not detect particular traces of reproduction in our samples so we suggest that Sfer could be involved in other iron metabolism. The use of ferritins as a proxy for transcriptomic analysis revealed stronger differences in the natural population analysis and allowed us to distinguish all our populations. The results obtained during the experimental exposure do not strongly evidence the involvement of specific ferritins in the response to iron leading to a more complex picture. Functional analysis of these isoforms could bring interesting informations about the ferritins properties in term of iron binding but also influence of other metals on the iron chelation. 5. Bibliography Aisen, P., Enns, C., Wessling-Resnick, M., Chemistry and biology of eukaryotic iron metabolism. Int. J. Biochem. Cell Biol. 33, Bebianno, M.J., Company, R., Serafim, A., Camus, L., Cosson, R.P., Fiala-Médoni, A., Antioxidant systems and lipid peroxidation in Bathymodiolus azoricus from Mid-Atlantic Ridge hydrothermal vent fields. Aquat. Toxicol. 75, Beck, G., Ellis, T.W., Habicht, G.S., Schluter, S.F., Marchalonis, J.J., Evolution of the acute phase response: Iron release by echinoderm (Asterias forbesi) coelomocytes, and cloning of an 150
155 echinoderm ferritin molecule. Dev. Comp. Immunol. 26, Bottke, W., Burschyk, M., Volmer, J., On the origin of the yolk protein ferritin in snails. Roux s Arch. Dev. Biol. 197, Bougerol, M., Boutet, I., LeGuen, D., Jollivet, D., Tanguy, A., Transcriptomic response of the hydrothermal mussel Bathymodiolus azoricus in experimental exposure to heavy metals is modulated by the Pgm genotype and symbiont content. Mar. Genomics 21, Boutet, I., Ripp, R., Lecompte, O., Dossat, C., Corre, E., Tanguy, A., Lallier, F.H., Conjugating effects of symbionts and environmental factors on gene expression in deep-sea hydrothermal vent mussels. BMC Genomics 12, 530. Boutet, I., Tanguy, A., Auffret, M., Riso, R., Moraga, D., Immunochemical quantification of metallothioneins in marine mollusks: characterization of a metal exposure bioindicator. Environ. Toxicol. Chem. 21, Boyd, P.W., Jickells, T., Law, C.S., Blain, S., Boyle, E. a, Buesseler, K.O., Coale, K.H., Cullen, J.J., de Baar, H.J.W., Follows, M., Harvey, M., Lancelot, C., Levasseur, M., Owens, N.P.J., Pollard, R., Rivkin, R.B., Sarmiento, J., Schoemann, V., Smetacek, V., Takeda, S., Tsuda, A., Turner, S., Watson, a J., Mesoscale iron enrichment experiments : synthesis and future directions. Science 315, Charlou, J., Donval, J.., Douville, E., Jean-Baptiste, P., Radford-Knoery, J., Fouquet, Y., Dapoigny, A., Stievenard, M., Compared geochemical signatures and the evolution of Menez Gwen (37 50ʹN) and Lucky Strike (37 17ʹN) hydrothermal fluids, south of the Azores Triple Junction on the Mid-Atlantic Ridge. Chem. Geol. 171, Charlou, J.L., Donval, J.P., Fouquet, Y., Jean-Baptiste, P., Holm, N., Geochemistry of high H2 and CH4 vent fluids issuing from ultramafic rocks at the Rainbow hydrothermal field (36 14ʹN,MAR). Chem. Geol. 191, doi: /s (02) Chávez-Mardones, J., Valenzuela-Muñoz, V., Núñez-Acuña, G., Maldonado-Aguayo, W., Gallardo- Escárate, C., Concholepas concholepas Ferritin H-like subunit (CcFer): Molecular characterization and single nucleotide polymorphism associated to innate immune response. Fish Shellfish Immunol. 35, Chen, L., Zhou, J., Zhang, Y., Chu, S., He, W., Li, Y., Preparation and Representation of Recombinant Mn-Ferritin Flower-Like Spherical Aggregates from Marine Invertebrates. PLoS 151
156 One 10, Collin, H., Meistertzheim, A.-L., David, E., Moraga, D., Boutet, I., Response of the Pacific oyster Crassostrea gigas, Thunberg 1793, to pesticide exposure under experimental conditions. J. Exp. Biol. 213, Company, R., Serafim, A., Cosson, R.P., Fiala-M??dioni, A., Camus, L., Serr??o-Santos, R., Jo??o Bebianno, M., Sub-lethal effects of cadmium on the antioxidant defence system of the hydrothermal vent mussel Bathymodiolus azoricus. Ecotoxicol. Environ. Saf. 73, David, E., Tanguy, A., Pichavant, K., Moraga, D., Response of the Pacific oyster Crassostrea gigas to hypoxia exposure under experimental conditions. FEBS J. 272, Desbruy, D., Sarradin, P.M., Segonzac, M., A review of the distribution of hydrothermal vent communities along the northern Mid-Atlantic Ridge : dispersal vs. environmental controls. Hydrobiologia 440, Durand, J.-P., Goudard, F., Pieri, J., Escoubas, J.-M., Schreiber, N., Cadoret, J.-P., Crassostrea gigas ferritin: cdna sequence analysis for two heavy chain type subunits and protein purification. Gene 338, Guezi, H., Boutet, I., Andersen, A.C., Lallier, F.H., Tanguy, A., Comparative analysis of symbiont ratios and gene expression in natural populations of two Bathymodiolus mussel species. Symbiosis 63, Hardivillier, Y., Leignel, V., Denis, F., Uguen, G., Cosson, R., Laulier, M., Do organisms living around hydrothermal vent sites contain specific metallothioneins? The case of the genus Bathymodiolus (Bivalvia, Mytilidae). Comp. Biochem. Physiol. C. Toxicol. Pharmacol. 139, Hilton, R.J., Andros, N.D., Watt, R.K., The ferroxidase center is essential for ferritin iron loading in the presence of phosphate and minimizes side reactions that form Fe(III)-phosphate colloids. BioMetals 25, Ivanina, A. V., Hawkins, C., Beniash, E., Sokolova, I.M., Effectsofenvironmental hypercapnia and metal (Cd and Cu) exposure on acid-base and metal homeostasis of marine bivalves. Comp. Biochem. Physiol. Part - C Toxicol. Pharmacol , Kádár, E., Postcapture depuration of essential metals in the deep sea hydrothermal mussel Bathymodiolus azoricus. Bull. Environ. Contam. Toxicol. 78,
157 Kádár, E., Costa, V., Santos, R.S., Powell, J.J., Tissue partitioning of micro-essential metals in the vent bivalve Bathymodiolus azoricus and associated organisms (endosymbiont bacteria and a parasite polychaete) from geochemically distinct vents of the Mid-Atlantic Ridge. J. Sea Res. 56, Koschinsky, A., Kausch, M., Borowski, C., Metal concentrations in the tissues of the hydrothermal vent mussel Bathymodiolus: Reflection of different metal sources. Mar. Environ. Res. 95, doi: /j.marenvres Larade, K., Storey, K.B., Accumulation and translation of ferritin heavy chain transcripts following anoxia exposure in a marine invertebrate. J. Exp. Biol. 207, Lobreaux, S., Yewdall, S.J., Briat, J.F., Harrison, P.M., Amino-acid sequence and predicted threedimensional structure of pea seed (Pisum sativum) ferritin. Biochem. J. 288(3), Lushchak, V.I., Environmentally induced oxidative stress in aquatic animals. Aquat. Toxicol. 101, Maldonado-Aguayo, W., Lafarga-De la Cruz, F., Gallardo-Escárate, C., Identification and expression of antioxidant and immune defense genes in the surf clam Mesodesma donacium challenged with Vibrio anguillarum. Mar. Genomics 19, Marigómez, I., Soto, M., Cajaraville, M.P., Angulo, E., Giamberini, L., Cellular and subcellular distribution of metals in molluscs. Microsc. Res. Tech. 56, Martins, E., Santos, R.S., Bettencourt, R., Vibrio diabolicus challenge in Bathymodiolus azoricus populations from Menez Gwen and Lucky Strike hydrothermal vent sites. Fish Shellfish Immunol. 47, doi: /j.fsi Núñez-Acuña, G., Aballay, A.E., Hégaret, H., Astuya, A.P., Gallardo-Escárate, C., Transcriptional responses of mytilus chilensis exposed in vivo to saxitoxin (STX). J. Molluscan Stud. 79, Ren, C., Chen, T., Jiang, X., Wang, Y., Hu, C., Identification and functional characterization of a novel ferritin subunit from the tropical sea cucumber, Stichopus monotuberculatus. Fish. Shellfish. Immunol. 38, Salinas-Clarot, K., Gutiérrez, A.P., Núñez-Acuña, G., Gallardo-Escárate, C., Molecular characterization and gene expression of ferritin in red abalone (Haliotis rufescens). Fish Shellfish Immunol. 30,
158 Sarrazin, J., Cuvelier, D., Peton, L., Legendre, P., Sarradin, P.M., High-resolution dynamics of a deep-sea hydrothermal mussel assemblage monitored by the EMSO-A??ores MoMAR observatory. Deep. Res. Part I Oceanogr. Res. Pap. 90, Sarrazin, J., Legendre, P., de Busserolles, F., Fabri, M.C., Guilini, K., Ivanenko, V.N., Morineaux, M., Vanreusel, A., Sarradin, P.M., Biodiversity patterns, environmental drivers and indicator species on a high-temperature hydrothermal edifice, Mid-Atlantic Ridge. Deep. Res. Part II Top. Stud. Oceanogr. 121, Schussler, P., Potters, E., Winnen, R., Bottke, W., Kunz, W., An isoform of ferritin as a component of protein yolk platelets in Schistosoma mansoni. Mol. Reprod. Dev. 41, Strange, R., Morante, S., Stefanini, S., Chiancone, E., Desideri, A., Nucleation of the iron core occurs at the three-fold channels of horse spleen apoferritin: an EXAFS study on the native and chemically-modified protein. Biochim. Biophys. Acta. Protein Struct. Mol. 1164, Theil, E.C., Ferritin: Structure, gene regulation, and cellular function in animals, plants, and microorganisms. Annu. Rev. Biochem. 56, Von Darl, M., Harrison, P.M., Bottke, W., cdna cloning and deduced amino acid sequence of two ferritins: Soma ferritin and yolk ferritin, from the snail Lymnaea stagnalis L. Eur. J. Biochem. 222, Zapata, M., Tanguy, A., David, E., Moraga, D., Riquelme, C., Transcriptomic response of Argopecten purpuratus post-larvae to copper exposure under experimental conditions. Gene 442, doi: /j.gene Zhang, L., Sun, W., Cai, W., Zhang, Z., Gu, Y., Chen, H., Ma, S., Jia, X., Differential response of two ferritin subunit genes ( VpFer1 and VpFer2 ) from Venerupis philippinarum following pathogen and heavy metals challenge. Fish. Shellfish. Immunol. 35, Zhou, Q., Zhang, Y., Peng, H., Ke, C., Huang, H., Toxicological responses of the hard clam Meretrix meretrix exposed to excess dissolved iron or challenged by Vibrio parahaemolyticus. Aquat. Toxicol. 156, Li, M, Saren G, Zhang S (2008) Identification and expression of a ferritin homolog in amphioxus Branchiostoma belcheri: evidence for its dual role in immune response and iron metabolism. Comp Biochem Physiol B BiochemMol Biol 150:
159 Zhang J, Li F, Wang Z, Zhang X, Zhou Q, et al. (2006) Cloning, expression and identification of ferritin from Chinese shrimp, Fenneropenaeus chinensis. J Biotechnol. 125: Chen T, Amons R, Clegg JS, Warner AH, MacRae TH (2003) Molecular characterization of artemin and ferritin from Artemia franciscana. Eur J Biochem 270: Levenson CW, Fitch CA (2000) Effect of altered thyroid hormone status on rat brain ferritin H and ferritin L mrna during postnatal development. Brain Res. Dev Brain Res 119: Andrews, N.C Forging a field: the golden age of iron biology. Blood 112: Wang. X., Liu, B., Xiang, J Cloning, characterization and expression of ferritin subunit from clam Meretrix meretrix in different larval stages. Comp. Biochem. Physiol. B. Biochem. Mol. Biol. 154: Romeo, M., Hoarau, P., Garello, G., Gnassia-Barelli, M., Girard, J.P., Mussel Transplantation and Biomarkers as Useful Tools for Assessing Water Quality in the NW Mediterranean. Environ. Pollut.,122, Kavun, V.Y, Shul kin, V.M., Changes in the Microelement Composition in Organs and Tissues of the Bivalve Crenomytilus grayanus Acclimated in a Biotope with Long_Term Heavy Metal Contamination. Rus. J. Mar. Biol. 31(2),
160 6. Figures and tables Table 1. Primers used in qpcr Ferritins relative expression. Gene Fer1 Sequence F: CATGAAGTACCAGAACAGAAGAGGTG R: CTTTGTGAAGATCCAAGAGAGACTGG Fer2 F: GTCAGATCAACATGGAACTCTACGC R: CACCTCTTCTGTTCTGGTACTTCATG Fer3 F: GTATGCCAGCTATGTTTACCAGTCC R: GATTCGTCCTCCTCTCTTGTTCTGA Fer4 F: CATGTCCTACTACTTCGATAGGGATG R: GGTCAGCTTTCTTGATGTCCTGAAG Fer5 F: GTCAGATCAACATGGAACTCTACGC R: CACCTCTTCTGTTCTGGTACTTCATG Sfer F: GATAGCACTTCCTGGATTCCACAAG R: CCCTTGGTTCCTTTATCCCTGTAAG Yfer F: TATCTGAATCAGAGAGGAGGAGAGG R: CAGATTCCATGACTGATCTTTGGCC 156
*#1*2'\"G'\":;*0'Z%0+#*'E+J%&J*2.")


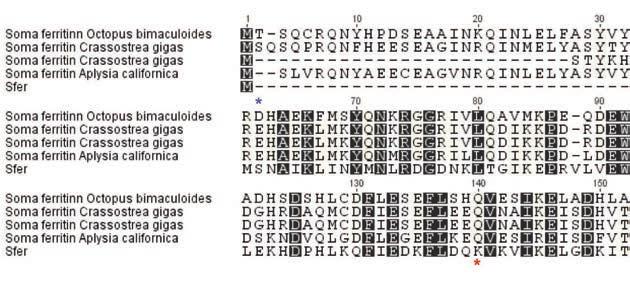
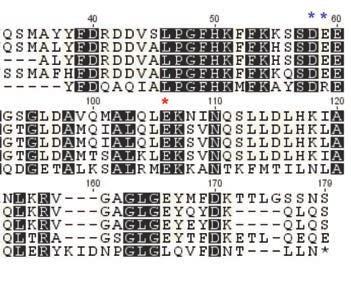
161 ' F,45('!H<'=&+?#Z*#:'"G':;*'G+J*'(*00:+:+#'[+:;'2*R)*#1*2'"G'":;*0'Z%0+#*'E+J%&J*2.'N"#2:*.(+' ^=Q98NMO/4-_.'N"#)B(.29+(+'^=QQNMUMP4-_.'="#/(/$+'^==LV8OU84-_'%#,'5"#1*'1*'$8*+'^=5iV8P/O4-_4' 6*,'%2:*0+2]2'0*B0*2*#:'0*2+,)*2':;%:'1"ZB0+2*':;*'G*00"\+,%2*'1*#:*0'%#,'E&)*'%2:*0+2]2'0*2+,)*2' G0"Z':;*'#)1&*%:+"#'1*#:*04' ' F,45('! ;<' =&+?#Z*#:' "G' :;*' H"Z%' G*00+:+#' [+:;' 2*R)*#1*2' "G' ":;*0' Z%0+#*' +#J*0:*E0%:*2.' R"# E(0$)*.&(:2+#^xL M-POOUO-/4-_.'="#/(/$+'^xL M--P8/UPO4-'%#,'xL M--PPVY/Y4-_'%#,'5"#)$.(D&'9()$' ^xl MMYMUNMPP4-_4'6*,'%2:*0+2]2'0*B0*2*#:'0*2+,)*2':;%:'1"ZB0+2*':;*'G*00"\+,%2*'1*#:*0'%#,'E&)*' %2:*0+2]2'0*2+,)*2'G0"Z':;*'#)1&*%:+"#'1*#:*04' 157
*#1*2' \"G' \":;*0' Z%0+#*' +#J*0:*E0%:*2.")
$' ^xl MMYMVU-/Y4/_4' 6*,' %2:*0+2]2' 0*B0*2*#:'")
162 ' ' F,45('! ><' =&+?#Z*#:' "G' :;*' s"&]' (*00:+:+#' [+:;' 2*R)*#1*2' "G' ":;*0' Z%0+#*' +#J*0:*E0%:*2.' ="# /(/$+' ^QmAP/UNO4-' %#,' xl M--P8VVN/4-_' %#,' 5"# )$.(D&'9()$' ^xl MMYMVU-/Y4/_4' 6*,' %2:*0+2]2' 0*B0*2*#:' 0*2+,)*2':;%:'1"ZB0+2*':;*'G*00"\+,%2*'1*#:*0'%#,'E&)*'%2:*0+2]2'0*2+,)*2'G0"Z':;*'#)1&*%:+"#'1*#:*04'! '! 158
163 :; < ; =<!"#$$$$$$$$$$$$$!"%$$$$$$$$$$$$$!"&$$$$$$$$$'($)*++,-$$$$$$$!./01,234$$$$$',45*0*64,$$$$7/0,45,8*90,! : #(: ; <#(: <:!"#$$$$$$$$$$$$$!"%$$$$$$$$$$$$$!"&$$$$$$$$$'($)*++,-$$$$$$$!./01,234$$$$$',45*0*64,$$$$7/0,45,8*90, ' F,45('!@<'T#:*0FB"B)&%:+"#'*GG*1:'"G'0*&%:+J*'*\B0*22+"#'^G"&,'1;%#?*_'"G'G*00+:+#2'+#'?+&&2'Z%#:&*'%#,',+?*2:+J*'?&%#,' G"0' :;*' 2*J*#' B"B)&%:+"#2' %#%&@$*,4'!*#*' *\B0*22+"#' +2' #"0Z%&+$*,' E@' :;*' Z*%#',*&:%A:' J%&)*' "G'?*#*2' +#' %&&' 2%ZB&*2' G"0' *%1;' :+22)*4' L"2+:+J*' J%&)*2' 0*B0*2*#:' )B' 0*?)&%:+"#' %#,' #*?%:+J*'J%&)*2'0*B0*2*#:'+#;+E+:+"#4' 159
164 Table 2. Results of the Global Anova analysis conducted on the relative expression of the seven ferritins genes between the seven populations for each tissue. Population Response Df MS F p-value Gill Fer e-14 Fer e-12 Fer e-6 Fer e-7 Fer e-5 Sfer Yfer e-7 Mantle Fer e-5 Fer e-7 Fer e-5 Fer Fer e-6 Sfer e-7 Yfer D. gland Fer Fer Fer Fer Fer e-5 Sfer Yfer e-6 160
165 Figure 5. Relative expression (fold change) of the ferritins genes between the three tissues in each population. Gene expression is normalized by the mean deltact value of genes in all tissues for each population. Positive values represent up regulation and negative values represent inhibition 161
166 Table 3. Results of the Global Anova analysis conducted on the relative expression of the seven ferritins genes in the seven populations between tissues. Population Response Df MS F p-value MG-2 Fer e-5 Fer e-5 Fer e-10 Fer e-11 Fer Sfer Yfer e-11 MG-3 Fer e-5 Fer e-5 Fer e-5 Fer e-6 Fer e-8 Sfer e-6 Yfer e-10 MG-4 Fer Fer e-5 Fer Fer e-7 Fer e-6 Sfer e-5 Yfer e-9 Tour Eiffel Fer Fer Fer e-8 Fer e-8 Fer Sfer e-6 Yfer e-8 162
167 Montsegur Fer e-5 Fer Fer ,00E-16 Fer ,00E-16 Fer e-7 Sfer e-15 Yfer e-6 Termitiére Fer Fer Fer e-10 Fer e-8 Fer e-6 Sfer Yfer e-10 Intermediate Fer e-6 Fer Fer e-5 Fer e-8 Fer e-7 Sfer e-5 Yfer e-8 163
168 9.4% of variation Sfer Fer5 Fer3 Fer4 Yfer Fer2 Fer1 83.5% of variation 16.07% of variation Fer3 Fer4 Yfer Fer1 Sfer Fer2 Fer5 71.5% of variation 164
169 12.01% of variation Fer5 Sfer Fer3 Fer4 Yfer Fer2 Fer1 75.2% of variation Figure 6. Global redundancy analysis (RDA) representing the relationship between the response variable (relative expression) and the explicative variable (metal concentration) in the gills, mantle and digestive gland, The angle between arrows represents the degree of correlation between variables 165
170 10 T0 5 days 10 days 15 days 20 days 25 days Control Control 1µM 5µM 20µM Control 1µM 5µM 20µM Control 1µM 5µM 20µM Control 1µM 5µM 20µM Control 1µM 5µM 166
171 10 T0 5 days 10 days 15 days 20 days 25 days Control 1µM 5µM 20µM Control 1µM 5µM 20µM Control 1µM 5µM 20µM Control 1µM 5µM 20µM Control 1µM 5µM Control Figure 7. Relative expression levels in gill and digestive gland for the seven ferritins genes during 25 days of iron exposure. 167
172 Table 4. Results of the Global Anova analysis conducted on the relative expression of the seven ferritins genes in gills and digestive gland of mussels exposed to iron. Tissue Response Df MS F p-value Gills Fer e-5 Fer e-5 Fer Fer Fer Sfer Yfer Digestive gland Fer e-13 Fer e-10 Fer Fer e-5 Fer e-15 Sfer e-7 Yfer
173 & 4)8+;%&<(!I(/3#/'5-'2(/!()!25(/!9#-$%5#4!2/!82&&!4%52/8!'*#!9#'-&!#67($%5#:!J-3*!85-7*!5#75#$#/'$! '*#! 9#'-&! 3(/3#/'5-'2(/! 9#-$%5#4! 2/! '*#! '*5##! 42))#5#/'! #67($%5#! 3(/42'2(/$! K3-492%9L! 3(77#5L! 25(/M! -/4! 3(/'5(&! 9%$$#&$:! I(/3#/'5-'2(/! 0-&%#$! 3(55#$7(/4! '(! '*#! 9#-/! -/4! $'-/4-54! 4#02-'2(/! 0-&%#$! )(5! -&&! 3(/3#/'5-'2(/$! ()! #-3*! 9#'-&! K3-492%9L! 3(77#5L! 25(/M! #63#7'! )(5! 3(/'5(&! '*-'! -5#! 5#75#$#/'#4!,1!(/&1!(/#!0-&%#! & 4)8+;%&=(!I(/3#/'5-'2(/!()!25(/!9#-$%5#4!2/!428#$'20#!8&-/4!4%52/8!'*#!9#'-&!#67($%5#:!J-3*!85-7*! 5#75#$#/'$!'*#!9#'-&!3(/3#/'5-'2(/!9#-$%5#4!2/!'*#!'*5##!42))#5#/'!#67($%5#!3(/42'2(/$!K3-492%9L! 3(77#5L! 25(/M! -/4! 3(/'5(&! 9%$$#&$:! I(/3#/'5-'2(/! 0-&%#$! 3(55#$7(/4! '(! '*#! 9#-/! -/4! $'-/4-54! 4#02-'2(/!0-&%#$!)(5!-&&!3(/3#/'5-'2(/$!()!#-3*!9#'-&!K3-492%9L!3(77#5L!25(/M!#63#7'!)(5!3(/'5(&!'*-'! -5#!5#75#$#/'#4!,1!(/&1!(/#!0-&%#!! 169
174
175 Chapter V Large scale transcriptomic analysis of Bathymodiolus azoricus In this chapter, we present the first results of the analysis of the transcriptomic variations in six populations sampled in the three vent sites Menez Gwen, Lucky Strike and Rainbow. This chapter contains data related to a tissue comparison within vent sites 171
176 1. Introduction In ecosystems where abiotic fluctuations are highly variable, the ability of the species to acclimatize (short term response) and evolutionary adapt (long term response) is of vital importance for determine the survival, where tolerance limits are one of the central topics to understand the maintenance of cellular homeostasis and consequently in organism and populations, but for this, biochemical systems biology and genomic studies are required to explain these responses to external perturbation (Bozinovic and Pörtner, 2015; Doney, 2010). New approaches has been then developed in the past years using omics technologies (genomics, transcriptomics and proteomics) which generate a high quantity of genetic information that has revolutionized areas as ecology and evolution by greatly expanding the scientific possibilities to asses the mechanism that govern ecological interaction principally in environmental genomics, who study the functioning of a genome of an organism and the relationship with biotic and abiotic environment (Straalen and Feder, 2012). In marine ecosystems the environmental conditions vary at a spatio-temporal scale, where temperature, oxygen concentration, reactive oxygen species (ROS), salinity and ph have been described as being the main factors that moderate stress changes that can be detected through gene and protein expression which also vary according the intensity of the abiotic factors. In this context different transcriptomic tools has enable the investigation of gene profile of thousand of genes in natural or experimental conditions (Somero, 2012) such as microarrays. The use of transcriptomic profiling has been developed in many species but the molluscs and particularly in bivalves which represent pioneer species in marine ecosystems, which are important for aquaculture resource and are described as biomonitoring species of marine pollutions with mainly Mytilus sp and Crassostrea species (Suárez-Ulloa et al., 2013; Tanguy et al., 2008). In the bivalve Mytilus californianus, a complex pattern of transcriptional changes are related to the vertical distribution in the intertidal zones, reflecting the physiological strategy used by this specie to accommodate with their fluctuating environment (Gracey et al., 2008). The exposure to pollutants of anthropogenic origin (pesticides, polycyclic aromatic compounds, heavy metals) is recognized as being one abiotic factors able to generate strong physiological response in marine invertebrates which are detected through alteration in mrna levels after exposure for genes that encode proteins involved in xenobiotic detoxification, immune system, antioxidant stress systems and specific metal detoxification pathways (Dondero et al., 2006; Ki et al., 2009; Tanguy et al., 2005). The expression of these genes remains however more difficult to interpreted in natural exposed populations due the complex environmental spatio-temporal variations. Bivalves from the Mytilidae family are widely distributed around the oceans and particularly in the hydrothermal vent of Mid-Atlantic Ridge (MAR) where the environmental fluctuations in temperature, ph, oxygen gas and metal concentration reach extreme levels. However, the mussel 172
177 Bathymodiolus azoricus dominates this area (specifically Azores triple junction, ATJ) and has been described as potential model specie to understand the adaptation to this extreme environmental. B. azoricus forms large communities in the base and walls of vent chimneys, with high abundance (Sarrazin et al., 2014) and its physiological plasticity has been characterized by the presence of symbiosis with methane and sulphur oxidizing bacteria in bacteriocytes in gill (Kiers and West, 2015; Le Bris and Duperron, 2010) as their ability to accumulate different metals in different tissues and at higher levels compared to congeners species from littoral ecosystems (Colaço et al., 2006; Enik Kádár et al., 2006; Kádár et al., 2007; Koschinsky et al., 2014a). Additionally transcriptomic and genomic data in this specie has been previously reported for this specie (Bougerol et al., 2015; Boutet et al., 2011; Tanguy et al., 2008). However, those studies are limited to the analysis of a limited number of genes. For this purpose we developed a microarrays analysis using all sequencing data available in B. azoricus, with the goal to identify differentially expressed genes in different sites of ATJ, which are characterized by a gradient in depth, concentration of toxic gases and heavy metal concentrations: Menez Gwen, Lucky Strike and Rainbow). 2. Materials and methods 2.1 Biological samples Samples of B. azoricus were collected from Mid-Atlantic Ridge in August 2013, during the BIOBAZ cruise on the research vessel Pourquoi Pas?, using the Remote Operating Vehicle (ROV) Victor The collection was made in three different vents sites Menez Gwen (37 50 N, W, 800mdepth, 2 populations called MG2 and MG4), Lucky Strike (37 17 N, W, 1700m depth, 2 populations collected at Tour Eiffel and Montsegur) and Rainbow (36 14 N, W, 2300m depth, 2 populations collected at Termitière and Intermediate. The samples were collected and placed in hermetic boxes then brought on board. Gills, mantle and digestive gland of each individual were immediately dissected and fixed in liquid nitrogen until further analysis. 2.2 Array construction We use a oligoarray format of 4x180K formed by sequences of 60pb length obtained from transcriptomic and genomic data in collaboration with the laboratory of Nori Satoh (Okinawa Institute of Science and Technology, OIST). Probes were synthetized with positive and negative controls using 4x180K- feature Agilent slide format. 2.2 RNA Extraction and labelling 173
178 Total RNA of gill, mantle and gland digestive was extracted using Tri-Reagent (Sigma, St. Louis, MO) according to the manufacturer s instructions. For each of the six populations, three pools containing an equal amount of total RNA extracted from 5 individuals for each tissue was pooled.. Labeled Cy3 and Cy5 probes were synthetized from 200ng of RNA from each pool using Agilent Low Imput Quick Amp labeling kit following manufacturer protocol. Labeled probes were then purified using Kit Illustra CyScribe GFx purification (GE HealthCare) and both quantity and quality were determined using NanoDrop spectrophotometer. For microarray hybridization 800ng of probes were firstly fragmented at 60ºC for 30 min. using fragmentation buffer (Agilent Technologies, USA) and then added to 25ul of 2X hybridization buffer (Agilent Technologies, USA). Arrays were hybridized in chambers at 65ºC for 17 h. Following hybridization the arrays were washed, twice, with wash buffer 1 containing 500ml Agilent Technologies, IncWilnington, USA and 250ml Triton 10X for 1 min, once with wash buffer 2 containing Agilent Technologies, IncWilnington, USA and 250ml Triton 10X for 1 minute to 37ºC and finally one with acetonitrile (200ml) for 10 second. Hybridized microarrays were scanned with an Agilent scanner using the Feature Extraction Software (version , Agilent Technologies, Inc). This process was repeated for all the hybridized slides with a 3um resolution mode. Data from each probe was then extracted and analyzed. 2.3 Statistical analysis The microarray data were analyzed using the statistical language R studio ( BioConductor (Gentleman et al., 2004) and Limma library (Smyth et al., 2005). The Background correction of the probe intensity was carried out using the normexp method (Ritchie et al., 2007). Technical artifacts were removed using quantile normalization and to remove intensity dependent trends, intra and inter slide lowess normalization were applied. Only probes showing an intensity signal three times superior to the background signal in more than 20% of the samples were kept for the analysis. Intensities data were then log2-transformed and replicated values of each gene were averaged. The ratio of expression of each gene was then calculated by dividing log2 signal intensity of the gene for one given sample by the mean log2 intensity of the gene in all samples in order to standardize gene expression to a mean of zero. Hierarchical clustering was performed using Tmev (Saeed et al., 2003), http// using the Euclidean distance metric and the complete linkage clustering parameters were used to identify clusters of genes that have most similarity in all samples after the number of cluster generated was determined using the FOM (Figure of merit) function to determine the optimal number of clusters and the KMC. Differential expression patterns between mussels were identified by SAM (Significant Microarray Analysis) program. Briefly, SAM computes a statistic for each gene measuring the strength of the relationship between gene expression and the response variable. We applied a permutation test (100 permutations) to better estimate false discovery rate 174
179 (FDR) which was used to estimate the proportion of false positive. Only genes with an FDR lower or equal to 5% were considered for further analysis. Among the genes showing a significant regulation, those having a functional annotation were considered in a functional enrichment analysis for Gene Ontology term using DAVID software (Database for Annotation Visualization and Integrated Discovery) (Huang et al., 2009a, 2009b). Analysis were performed for the six comparisons, MG-LS; MG-RB; LS-MG; LS-RB; RB-LS; RB- MG, for gill, mantle and digestive gland. In each comparison, we obtained a list of the most relevant (overrepresented) biological terms. In the way to simplify the long GO term list obtained, we chose only those which were significantly enriched (p-value < 0.05) after DAVID analysis and we constructed a networks of similarities between GO terms using an algorithm similar to the neighbor joining approach implemented in a web server REVIGO (Reduce Visualize Gene Ontology) (Supek et al., 2011) which reduces the functional redundancies within list of GO terms and generate a interactive graph-based visualization keeping joined similar GO terms (represented by nodes) through edges that represent the degree of similarity. 3. Results and discussion The number of significant regulated genes varies between 3800 to genes (Fig.1) across each site comparison. Gills and digestive gland record the major number of regulated genes with the exception of mantle in the comparison MG>LS, where the numbers of reported genes is higher for this tissue compared to gills an digestive gland. The comparison between RB>MG revealed the higher number of regulated genes. High number of regulated genes is reported in MG>RB where particularly the digestive gland has similar values to what is reported in RB>MG. Both hydrothermal sites has been reported to have the more contrasting environmental conditions, principally hydrostatic pressure due to the depth (-800m and -2300m respectively) and the composition of the seafloor that explain the differences in metal and gas concentration that emerge from the vent (Charlou et al., 2002). The second higher level of regulated genes is reported in LS compared to MG (LS>MG) and particularly in the digestive gland in MG site compared to RB (MG>RB), while the lowest and similar levels are reported in LS>RB and RB>LS. This difference in number of regulated genes between sites may reflect differences in physiological conditions. 175
180 ./ :;1<=01213 &#!!! &"!!! &!!!!./ %!!! $!!! #!!! (>99 "!!!! '()*+ '(),- *+)'( *+),-,-)*+,-)'( Figure 1. Total number of significantly regulated genes between each site for gills, mantle and digestive gland. The physiological difference raised above is more evident when we observed the numbers of significant enriched GO term when the sites are compared between them, differences that vary at biological function, component cellular and molecular function and which could reflect the plasticity of response in natural populations of B. azoricus. %"! '/052340,678796:;80<37:2== %!! $"! -. '/01234 $!! #"! #!! '688 "!! &'()* &'(+, )*(&' )*(+, +,()* +,(&' #!"(#
181 ( :3:21;3<<=<>4 &"! &!!./ ( %! $! #! (?<< "!! '()*+ '(),- *+)'( *+),-,-)*+,-)'( ( '6839:8;41<:=92>6= &"! &!!./ ( %! $! #! (>88 "!! '()*+ '(),- *+)'( *+),-,-)*+,-)'( Figure 2. Number of significant enriched GO terms for each tissue and site comparison for Biological process, Component cellular and Molecular function. For each site comparison, we made a GO term network that regroups terms based on their functional similarity in the different GO ontology terms, with the objective to identify the principal pathways in which the genes significantly regulated and enriched are involved. This information give us a global overview of the principal physiological status of each sites for the three different tissues, revealing interesting specific site and tissue pathways. Each one of the network described represents #!""#
182 the similarity between different GO terms, and each node represents a GO term, his color the levels of significance after enrichment analysis and width line of each edge indicate the degree of similarity. Up-regulated genes in Menez Gwen compared to Lucky Strike. This comparison (Fig.3, 4 and 5) revealed at the Biological process level a few number of regulated process in gills (Fig.3a) with essentially the reactive oxygen specie response and drug response together with ion transport. In mantle (Fig.4a), the mains process regulated include morphological and tissue formations as angiogenesis, skeletal muscle development and contraction, cell adhesion and camp signaling that are grouped in a cohesive network and additional fragmented networks with less similarity between them are represented for metabolic functions as vitamin metabolism, energy reserve and proteins transport and interestingly a node that regulate calcium ion transmembrane is represented in this tissue. In digestive gland (Fig. 5a) a very connected network bring together function related to response to stress, response to reactive oxygen species, regulation of protein kinase activity and cellular metabolism and a second network join nodes with ion regulation and transport principally for sodium, calcium. Protein and glucose metabolism are represented by singles nodes. At the Cellular component level (Fig. 3b, 4b and 5b) few nodes are represented in the three tissues, mainly plasma membrane component and component for mitosis process (Kinesin complex), integral component of membranes and transport membrane receptor. At the Molecular function levels, the copper and calcium ion binding are strongly regulated in gills (Fig. 3c) and high significant networks of nodes related to protein activity as acetyl-coa carboxylase, glutamic acid and UDP ligase activity are detected for mantle (Fig. 4c). Proteins binding activity, peptidic receptors and calcium ion binding function are also regulated in the digestive gland (Fig. 5c). The complete list of GO term used in this analysis can be found in the appendix 1. Up-regulated genes in Menez Gwen compared to Rainbow. At the Biological process level, a high activity, represented for the elevated number enriched GO term, is detected in gills (Fig. 6a), mantle (Fig. 7a) and digestive gland (Fig. 8a) when MG and RB are compared. In this three tissues, a shared response is recorded and represented by term such as response in the immune system, regulation to viral response, cellular response to exogenous RNA, Toll signaling pathways, response to gram positive bacterium, development of central nervous systems. A specific response in gills is related to DNA methylation, thermosensory regulation and hypoxia response, in mantle to morphological formation and lipid storage in digestive gland. 178
183 At the cellular component level (Fig. 6b, 7b and 8b), several pathways are shared in the three tissues such as plasma integral components, extracellular matrix and Golgi lumen. At the Molecular function level, GO term enriched in gill (Fig. 6c) include actinin, fibrinogen and collagen binding activity and calcium ion binding. In mantle (Fig. 7c), binding activity is also reported related to calcium and zinc binding, protein binding, collagen binding, receptor activity and peptidase activities. In the digestive gland (Fig.8c), a different patter is observed whit an enrichment in terms related to reproduction process as spermatogenesis, mitotic nuclear division and DNA replication. Up-regulated genes in Lucky Strike compared to Menez Gwen. Different tissue regulation process are reported at the Biological level for this site comparison where gill (Fig. 9a) is characterized by GO term linked to response immune, viral process, Toll-like receptor, necroptotic process, cell death process, protein phosphorylation, endocytosis, autophagosome, lipoprotein and lysosome transport. In mantle, different pathways are represented, principally mitochondrial translation, RNA processing, translation and process related to energy generation as Tricalboxilic acid cycle and ATP synthesis. In the digestive gland, process to energy generation are present with TCA cycle and ATP metabolism together with process related to cellular division as mitotic nuclear division, DNA replication and repair and RNA processing. In the Cellular component level, the most representative organelles are the cytoplasm, cytoskeleton, golgi apparatus, mitochondrial, nucleolus and ribosomal subunit in the three tissues (Fig. 9b, 10b, 11b). In the Molecular function level, gills are characterized by the presence of high binding proteins domains, ligase activity, and ATP binding with a second network formed by enzymatic activities as glycine ligase activity, coenzyme gamma-glutamyl ligase and carboxylase activity (Fig. 9c). In mantle (Fig. 10c, 10d), Go term enriched are dominated by transferases activity, while in digestive gland the dominant pattern is ATPase and binding activity where interestingly a sulfur cluster binding is detected as a single node (Fig. 11c). Up-regulated genes in Lucky Strike compared to Rainbow The differences in this site are represented by a low number of GO term in gill (Fig. 12a) but with higher levels of significance and the contrary is observed in mantle (Fig. 13a) with a high number of GO terms linked in a big network where the more significant node is represented by the innate immune system followed by Kappa kinase/nf-kappab signaling, and other interesting pathways are reported such as hydrogen peroxide biosynthesis, DNA methylation, regulation of calcium ion concentration, mineralization process, detection of bacterium, cell surface recognition receptor and necroptotic and apoptotic process. In digestive gland, the response in immune system and hydrogen peroxide catabolism are also present together with response to oxidative stress, regulation of 179
184 inflammatory process and DNA methylation mechanism and apoptotic process (Fig. 14a). At the Cellular component level, lower differences between tissues is reported (Fig. 12b, 13b and 14b) with principally the cytoplasm and cellular membranes being represented. For the Molecular function, a low numbers of GO terms is reported for gills (Fig. 12c) with principally the binding activity linked with ATPase activity. For mantle, the binding activity is represented by more GO terms, in a similar manner to the ligase activity terms (Fig. 13c). For digestive gland (Fig. 14c), the ligase activity is over represented like the receptor signals and peroxidase activity, calcium and zinc ion binding and NAD(P)H oxidase activity. Up-regulated genes in Rainbow compared to Menez Gwen. At the Biological process level, the three tissues present different numbers of physiological pathways regulated. In gills (Fig.15a), the most represented are related to tissue and organ development, post-translation protein modifications, intracellular protein transport, apoptotic signaling pathways, TOR signaling, detection of mechanical stimulus, response to organic substances, apoptotic signaling and DNA repair. Mantle (Fig. 16a) is characterized by the process of fatty acid oxidation, glutamate metabolism, viral response process, bicarbonate transport, RNA processing, translational and elongation process, and organ differentiation process. Digestive gland (Fig. 17a) is overrepresented in DNA repair process, RNA splicing, mitotic cellular process, response to heat, ATP synthesis related to proton transport, mitochondrial NADH electron transport. At the Cellular component level, lower differences between tissues are detected but some component are over represented as lysosomal and endosome membrane and nuclear membrane in gills (Fig. 15b), mitochondrial respiratory chain complexi, ribosome, nucleoplasma in mantle (Fig. 16b) and nucleus, nucleoplasm, methylosome, and mitochondrial membrane and respiratory chain complexi in the digestive gland (Fig. 17b). At the Molecular function level, in gill (Fig. 15c) binding and transporter activities are overrepresented with protein binding and ATP binding. In mantle, ATPase, anion transporter activity, acyl-coa dehydrogenase activity, sulfur cluster binding and gammaglutamyltransferase activity are some of the most interesting function overrepresented. In the digestive gland (Fig. 17c), RNA and DNA binding activities, ATPase activity, NADH dehydrogenase activity, 4 sulfur cluster binding are the principal pathways represented. Up-regulated genes in Rainbow compared to Lucky Strike. The principal Biological process recorded in the gills (Fig. 18a) show a major regulation in process related to innate immune response, regulation of inflammatory response, Toll like receptor signaling, ROS metabolism and hydrogen peroxide catabolism. In the mantle (Fig. 19a), the DNA repair process is related to cellular heat response, detection of temperature stimulus and ionizing radiation and also hydrogen transmembrane transport related to calcium ion transport, and a 180
185 significant representation is detected for cilium movement and Golgi vesicle transport. In the digestive gland (Fig. 20a), the more significant GO term are related to mitotic division, spermatogenesis, cilium assembly and movement, collagen organization, DNA repair, protein phosphorylation and organ formation. Like in the others site comparison, the lower representation of GO term is also reported for the Cellular component, where no major differences between tissues is reported characterized by the shared representation of membrane extracellular region, Golgi apparatus, microtubule and cytoskeleton formation (Fig. 18b, 19b and 20b). For the Molecular function, the GO term protein ligase activity, matrix protein component, sulfate transmembrane, oxalate transmembrane, succinate transmembrane, peroxidase activity, NAD(P)H oxidase and calcium, zinc binding proteins are highly represented in gills (Fig. 18c), microtubule motor activity, ATP binding, sulfotransferase, calcium ion binding and metallopeptidase activity, for mantle (Fig. 19c) and ATP binding, ATPase activity, kinase activity, calcium ion binding, sodium independent anion transmembrane activity and hemoglobin binding in digestive gland (Fig. 20c). The development of the omics technology in the study of environmental interaction and gene expression profiling in marine species has increased notably in the last decades where environmental changes has been reported to alter metabolic pathways, developmental process, reproductive conditions, behavior and disease susceptibility. Those profiles can be used as prospective biomarkers of environmental change and have been proposed as an important tool in the context global change (Somero, 2012). Our microarrays analysis developed in contrasting hydrothermal site allow us to illustrate the high physiological plasticity in the hydrothermal mussel Bathymodiolus azoricus, which is reflected principally by the differences in biological process that are over represented when site comparison is performed. This response vary between tissues. However, we can set up the specific response to some of the most characteristic environmental factors described such as the activation of reactive oxygen species response, that has been explored previously in B. azoricus in response to bacteria and metal exposure (Bebianno et al., 2005; Company et al., 2006; Martins et al., 2015, 2016). The bacterial response can also be attributed to the assimilation of the chemosynthetic thiotrophic (SOX) and methanotrophic (MOX) bacteria located in gills of B. azoricus, that use CO 2 and methane as carbon energy source. The presence of symbionts suggests the activation of physiological mechanisms involved in immune response such as Toll like receptor, response to exogenous RNA, lysozyme regulation as found in our analysis and that has explored recently in this mussels (Detree et al., 2016; Guezi et al., 2014). Bicarbonate transport was also over-represented in our study as being highly expressed in mantle when Rainbow is compared to Menez Gwen which is in agreement with the physiological importance of bicarbonate in the regulation of ph and in the formation of the shells of bivalves with also the regulation of mitochondrial activity (Haider et al., 2016). Also we report the 181
186 significant overexpression of biological process regulated to mechanical stimulus in the more deeper site which can be related to the effect of the pressure in this site or to the sampling effect when the mussels where removed from the vent. Considering the response of B. azoricus related to abiotic factor as metal concentration, we can suggest the activation of specific biological responses based in the over representation found in our analysis as metal binding proteins, iron sulfur cluster binding, hydrogen peroxide catabolism, calcium-zinc ion transmembrane transport, glutathione biosynthesis. In marine bivalves, the exposure to toxic agent, particularly metal, can cause DNA damage (Emmanouil et al., 2007; Michel and Vincent-Hubert, 2015) which has a hereditable potential to increase the susceptibility of organisms to diseases or alter their capacity of stress response, implying that organisms have to develop an effective mechanism of DNA repair. In our analyses, we detected in different sites the over representation of these mechanism so we can suggest that this response is linked to the extreme condition of hydrothermal vent that may cause DNA damage. Response to hypoxia mechanism were also represented in our study which can be attributed to the low levels of dissolved oxygen present in the hydrothermal vent. However, the mechanism of oxygen exchange has not well elucidated for hydrothermal vent even some data reported in the literature suggest morphological change in decapods gills (Decelle et al., 2010), difference in protein regulation in annelid linked to changes in oxygen concentration (Mary et al., 2010) and specificity of hemoglobin structure (Hourdez and Weber, 2005). However, in natural populations, this specific and the others physiological pathways involved in adaptation to hydrothermal vent are not well identified in B. azoicus. This work has generated a considerable amount of information about the different physiological pathways in hydrothermal vent characterized by different environmental conditions. This comparative site analysis revealed interesting differences at site and tissue level that can be interpreted as the strategy of B. azoricus in his adaptive process to the hydrothermal vent. However this information and particularly the high numbers of regulated genes challenge represent a challenge for his interpretation whereby we only focus in the significant GO terms obtained after the enrichment analysis. Additionnal analysis have to be performed especially in link with other physiological index. 4. Bibliography Bebianno, M.J., Company, R., Serafim, A., Camus, L., Cosson, R.P., Fiala-Médoni, A., Antioxidant systems and lipid peroxidation in Bathymodiolus azoricus from Mid-Atlantic Ridge hydrothermal vent fields. Aquat. Toxicol. 75, doi: /j.aquatox Bougerol, M., Boutet, I., LeGuen, D., Jollivet, D., Tanguy, A., Transcriptomic response of the 182
187 hydrothermal mussel Bathymodiolus azoricus in experimental exposure to heavy metals is modulated by the Pgm genotype and symbiont content. Mar. Genomics 21, doi: /j.margen Boutet, I., Ripp, R., Lecompte, O., Dossat, C., Corre, E., Tanguy, A., Lallier, F.H., Conjugating effects of symbionts and environmental factors on gene expression in deep-sea hydrothermal vent mussels. BMC Genomics 12, 530. Bozinovic, F., Pörtner, H.O., Physiological ecology meets climate change. Ecol. Evol. 5, doi: /ece Chaney, M.L., Gracey, A.Y., Mass mortality in Pacific oysters is associated with a specific gene expression signature. Mol. Ecol. 20, doi: /j x x Charlou, J.L., Donval, J.P., Fouquet, Y., Jean-Baptiste, P., Holm, N., Geochemistry of high H2 and CH4 vent fluids issuing from ultramafic rocks at the Rainbow hydrothermal field (36 14 N,MAR). Chem. Geol. 191, doi: /s (02) Colaço, A., Bustamante, P., Fouquet, Y., Sarradin, P.M., Serrão-Santos, R., Bioaccumulation of Hg, Cu, and Zn in the Azores triple junction hydrothermal vent fields food web. Chemosphere 65, doi: /j.chemosphere Company, R., Felícia, H., Serafim, a., Almeida, a. J., Biscoito, M., Bebianno, M.J., Metal concentrations and metallothionein-like protein levels in deep-sea fishes captured near hydrothermal vents in the Mid-Atlantic Ridge off Azores. Deep Sea Res. Part I Oceanogr. Res. Pap. 57, doi: /j.dsr Company, R., Serafim, A., Cosson, R., Camus, L., Shillito, B., Fiala-Médioni, A., Bebianno, M.J., The effect of cadmium on antioxidant responses and the susceptibility to oxidative stress in the hydrothermal vent mussel Bathymodiolus azoricus. Mar. Biol. 148, doi: /s Decelle, J., Andersen, A.C., Hourdez, S., Morphological adaptations to chronic hypoxia in deepsea decapod crustaceans from hydrothermal vents and cold seeps. Mar. Biol. 157, doi: /s Desbruyères, D., Biscoito, M., Caprais, J.C., Colaço, A., Comtet, T., Crassous, P., Fouquet, Y., Khripounoff, A., Le Bris, N., Olu, K., Riso, R., Sarradin, P.M., Segonzac, M., Vangriesheim, A., Variations in deep-sea hydrothermal vent communities on the Mid-Atlantic Ridge near the Azores plateau. Deep. Res. Part I Oceanogr. Res. Pap. 48, doi: /s (00) Detree, C., Chabenat, A., Lallier, F.H., Satoh, N., Shoguchi, E., Tanguy, A., Mary, J., Multiple I-Type Lysozymes in the Hydrothermal Vent Mussel Bathymodiolus azoricus and Their Role in 183
188 Symbiotic Plasticity. PLoS One 11, e doi: /journal.pone Dondero, F., Piacentini, L., Marsano, F., Rebelo, M., Vergani, L., Venier, P., Viarengo, A., Gene transcription profiling in pollutant exposed mussels (Mytilus spp.) using a new low-density oligonucleotide microarray. Gene 376, doi: /j.gene Doney, S.C., The growing human footprint on coastal and open-ocean biogeochemistry. Science (80-. ). 328, doi: /science Emmanouil, C., Sheehan, T.M.T., Chipman, J.K., Macromolecule oxidation and DNA repair in mussel (Mytilus edulis L.) gill following exposure to Cd and Cr(VI). Aquat. Toxicol. 82, doi: /j.aquatox Gentleman, R., Carey, V., Bates, D., Bolstad, B., Dettling, M., Dudoit, S., Ellis, B., Gautier, L., Ge, Y., Gentry, J., Hornik, K., Hothorn, T., Huber, W., Iacus, S., Irizarry, R., Leisch, F., Li, C., Maechler, M., Rossini, A., Sawitzki, G., Smith, C., Smyth, G., Tierney, L., Yang, J., Zhang, J., Bioconductor: open software development for computational biology and bioinformatics. Genome Biol. 5, R80. doi: /gb r80 Gracey, A.Y., Chaney, M.L., Boomhower, J.P., Tyburczy, W.R., Connor, K., Somero, G.N., Rhythms of Gene Expression in a Fluctuating Intertidal Environment. Curr. Biol. 18, doi: /j.cub Guezi, H., Boutet, I., Andersen, A.C., Lallier, F.H., Tanguy, A., Comparative analysis of symbiont ratios and gene expression in natural populations of two Bathymodiolus mussel species. Symbiosis 63, doi: /s Haider, F., Falfushynska, H., Ivanina, A. V., Sokolova, I.M., Effects of ph and bicarbonate on mitochondrial functions of marine bivalves. Comp. Biochem. Physiol. -Part A Mol. Integr. Physiol. 198, doi: /j.cbpa Hardivillier, Y., Leignel, V., Denis, F., Uguen, G., Cosson, R., Laulier, M., Do organisms living around hydrothermal vent sites contain specific metallothioneins? The case of the genus Bathymodiolus (Bivalvia, Mytilidae). Comp. Biochem. Physiol. - C Toxicol. Pharmacol. 139, doi: /j.cca Hourdez, S., Weber, R.E., Molecular and functional adaptations in deep-sea hemoglobins. J. Inorg. Biochem. 99, doi: /j.jinorgbio Huang, D.W., Lempicki, R. a, Sherman, B.T., 2009a. Systematic and integrative analysis of large gene lists using DAVID bioinformatics resources. Nat. Protoc. 4, doi: /nprot Huang, D.W., Sherman, B.T., Lempicki, R.A., 2009b. Bioinformatics enrichment tools: Paths toward the comprehensive functional analysis of large gene lists. Nucleic Acids Res. 37, doi: /nar/gkn
189 Kádár, E., Postcapture depuration of essential metals in the deep sea hydrothermal mussel Bathymodiolus azoricus. Bull. Environ. Contam. Toxicol. 78, doi: /s Kádár, E., Costa, V., Santos, R.S., Powell, J.J., Tissue partitioning of micro-essential metals in the vent bivalve Bathymodiolus azoricus and associated organisms (endosymbiont bacteria and a parasite polychaete) from geochemically distinct vents of the Mid-Atlantic Ridge. J. Sea Res. 56, doi: /j.seares Kádár, E., Costa, V., Segonzac, M., Trophic influences of metal accumulation in natural pollution laboratories at deep-sea hydrothermal vents of the Mid-Atlantic Ridge. Sci. Total Environ. 373, doi: /j.scitotenv Kádár, E., Santos, R.S., Powell, J.J., Biological factors influencing tissue compartmentalization of trace metals in the deep-sea hydrothermal vent bivalve Bathymodiolus azoricus at geochemically distinct vent sites of the Mid-Atlantic Ridge. Environ. Res. 101, doi: /j.envres Ki, J.S., Raisuddin, S., Lee, K.W., Hwang, D.S., Han, J., Rhee, J.S., Kim, I.C., Park, H.G., Ryu, J.C., Lee, J.S., Gene expression profiling of copper-induced responses in the intertidal copepod Tigriopus japonicus using a 6K oligochip microarray. Aquat. Toxicol. 93, doi: /j.aquatox Kiers, T., West, S., Kiers and West 2015 endosymbiosis evolution. Science (80-. ). 248, Koschinsky, A., Kausch, M., Borowski, C., 2014a. Metal concentrations in the tissues of the hydrothermal vent mussel Bathymodiolus : Re fl ection of different metal sources. Mar. Environ. Res. 95, doi: /j.marenvres Koschinsky, A., Kausch, M., Borowski, C., 2014b. Metal concentrations in the tissues of the hydrothermal vent mussel Bathymodiolus: Reflection of different metal sources. Mar. Environ. Res. 95, doi: /j.marenvres Le Bris, N., Duperron, S., Chemosynthetic communities and biogeochemical energy pathways along the mid-atlantic ridge: The case of Bathymodiolus azoricus. Geophys. Monogr. Ser. 188, doi: /2008gm Martins, E., Santos, R.S., Bettencourt, R., Vibrio diabolicus challenge in Bathymodiolus azoricus populations from Menez Gwen and Lucky Strike hydrothermal vent sites. Fish Shellfish Immunol. 47, doi: /j.fsi Martins, I., Romão, C. V., Goulart, J., Cerqueira, T., Santos, R.S., Bettencourt, R., Activity of antioxidant enzymes in response to atmospheric pressure induced physiological stress in deep- 185
190 sea hydrothermal vent mussel Bathymodiolus azoricus. Mar. Environ. Res. 114, doi: /j.marenvres Mary, J., Rogniaux, H., Rees, J.F., Zal, F., Response of Alvinella pompejana to variable oxygen stress: A proteomic approach. Proteomics 10, doi: /pmic Michel, C., Vincent-Hubert, F., DNA oxidation and DNA repair in gills of zebra mussels exposed to cadmium and benzo(a)pyrene. Ecotoxicology 24, doi: /s Ritchie, M.E., Silver, J., Oshlack, A., Holmes, M., Diyagama, D., Holloway, A., Smyth, G.K., A comparison of background correction methods for two-colour microarrays. Bioinformatics 23, doi: /bioinformatics/btm412 Saeed, A.I., Sharov, V., White, J., Li, J., Liang, W., Bhagabati, N., Braisted, J., Klapa, M., Currier, T., Thiagarajan, M., Sturn, A., Snuffin, M., Rezantsev, A., Popov, D., Ryltsov, A., Kostukovich, E., Borisovsky, I., Liu, Z., Vinsavich, A., Trush, V., Quackenbush, J., TM4: A free, opensource system for microarray data management and analysis. Biotechniques 34, doi: Sarrazin, J., Cuvelier, D., Peton, L., Legendre, P., Sarradin, P.M., High-resolution dynamics of a deep-sea hydrothermal mussel assemblage monitored by the EMSO-A??ores MoMAR observatory. Deep. Res. Part I Oceanogr. Res. Pap. 90, doi: /j.dsr Sarrazin, J., Legendre, P., de Busserolles, F., Fabri, M.C., Guilini, K., Ivanenko, V.N., Morineaux, M., Vanreusel, A., Sarradin, P.M., Biodiversity patterns, environmental drivers and indicator species on a high-temperature hydrothermal edifice, Mid-Atlantic Ridge. Deep. Res. Part II Top. Stud. Oceanogr. 121, doi: /j.dsr Shiu, S.-H., Borevitz, J.O., The next generation of microarray research: applications in evolutionary and ecological genomics. Heredity (Edinb). 100, doi: /sj.hdy Smyth, G.K., Michaud, J., Scott, H.S., Use of within-array replicate spots for assessing differential expression in microarray experiments. Bioinformatics 21, doi: /bioinformatics/bti270 Somero, G.N., The Physiology of Global Change: Linking Patterns to Mechanisms. Annu. Rev. Mar. Sci. Vol 4 4, doi:doi /annurev-marine Straalen, N.M. Van, Feder, M.E., Ecological and Evolutionary Functional Genomics How Can It 3 9. Suárez-Ulloa, V., Fernández-Tajes, J., Manfrin, C., Gerdol, M., Venier, P., Eirín-López, J.M., Bivalve omics: State of the art and potential applications for the biomonitoring of harmful 186
191 marine compounds. Mar. Drugs 11, doi: /md Supek, F., Bošnjak, M., Škunca, N., Šmuc, T., Revigo summarizes and visualizes long lists of gene ontology terms. PLoS One 6. doi: /journal.pone Tanguy, A., Bierne, N., Saavedra, C., Pina, B., Bachère, E., Kube, M., Bazin, E., Bonhomme, F., Boudry, P., Boulo, V., Boutet, I., Cancela, L., Dossat, C., Favrel, P., Huvet, A., Jarque, S., Jollivet, D., Klages, S., Lapègue, S., Leite, R., Moal, J., Moraga, D., Reinhardt, R., Samain, J.F., Zouros, E., Canario, A., Increasing genomic information in bivalves through new EST collections in four species: Development of new genetic markers for environmental studies and genome evolution. Gene 408, doi: /j.gene Tanguy, A., Boutet, I., Laroche, J., Moraga, D., Molecular identification and expression study of differentially regulated genes in the Pacific oyster Crassostrea gigas in response to pesticide exposure. FEBS J. 272, doi: /j x 187


192 BIOLOGICAL PROCESS Figure 3a. MG genes higher expressed than LS for gill in biological process. Each of the GO term is represented for a node and the degree of similarity is represented for the number and width of the edge. The color represents the degree of significance. # #!""#


193 CELLULAR COMPONENT Figure 3b. MG genes higher expressed than LS for gill cellular component. Each of the GO term is represented for a node and the degree of similarity is represented for the number and width of the edge. The color represent the degree of significance. # #!"$#


194 MOLECULAR FUNCTION Figure 3c. MG genes higher expressed than LS for gill in molecular function.. Each of the GO term is represented for a node and the degree of similarity is represented for the number and width of the edge. The color represent the degree of significance. # #!$%#


195 BIOLOGICAL PROCESS Figure 4a. MG genes higher expressed than LS for mantle in biological process. Each of the GO term is represented for a node and the degree of similarity is represented for the number and width of the edge. The color represents the degree of significance. #!$!#


196 CELLULAR COMPONENT# Figure 4b. MG genes higher expressed than LS for mantle in cellular component. Each of the GO term is represented for a node and the degree of similarity is represented for the number and width of the edge. The color represents the degree of significance. #!$&#


197 MOLECULAR FUNCTION Figure 4c. MG genes higher expressed than LS for mantle in molecular function. Each of the GO term is represented for a node and the degree of similarity is represented for the number and width of the edge. The color represents the degree of significance. #!$'#


198 BIOLOGICAL PROCESS Figure 5a. MG genes higher expressed than LS for digestive gland in biological process. Each of the GO term is represented for a node and the degree of similarity is represented for the number and width of the edge. The color represents the degree of significance. # #!$(#


199 CELLULAR COMPONENT Figure 5b. MG genes higher expressed than LS for digestive gland in cellular component. Each of the GO term is represented for a node and the degree of similarity is represented for the number and width of the edge. The color represents the degree of significance. # #!$)#


200 MOLECULAR FUNCTION Figure 5c. MG genes higher expressed than LS for digestive gland in molecular function. Each of the GO term is represented for a node and the degree of similarity is represented for the number and width of the edge. The color represents the degree of significance. # #!$*#


201 BIOLOGICAL PROCESS Figure 6a. MG genes higher expressed than RB for gill in biological process. Each of the GO term is represented for a node and the degree of similarity is represented for the number and width of the edge. The color represents the degree of significance.# #!$+#


202 CELLULAR COMPONENT # Figure 6b. MG genes higher expressed than RB for gill cellular component. Each of the GO term is represented for a node and the degree of similarity is represented for the number and width of the edge. The color represents the degree of significance. #!$"#


203 MOLECULAR FUNCTION Figure 6c. MG genes higher expressed than RB for gill in molecular function.. Each of the GO term is represented for a node and the degree of similarity is represented for the number and width of the edge. The color represent the degree of significance. # #!$$#


204 BIOLOGICAL PROCESS Figure 7a. MG genes higher expressed than RB for mantle in biological process. Each of the GO term is represented for a node and the degree of similarity is represented for the number and width of the edge. The color represents the degree of significance. # # &%%#


205 CELLULAR COMPONENT Figure 7b. MG genes higher expressed than RB for mantle in cellular component. Each of the GO term is represented for a node and the degree of similarity is represented for the number and width of the edge. The color represents the degree of significance. # # &%!#


206 MOLECULAR FUNCTION Figure 7c. MG genes higher expressed than RB for mantle in molecular function. Each of the GO term is represented for a node and the degree of similarity is represented for the number and width of the edge. The color represents the degree of significance. # &%&#


207 BIOLOGICAL PROCESS Figure 8a. MG genes higher expressed than RB for digestive gland in biological process. Each of the GO term is represented for a node and the degree of similarity is represented for the number and width of the edge. The color represents the degree of significance. # # &%'#


208 CELLULAR COMPONENT Figure 8b. MG genes higher expressed than RB for digestive gland in cellular component. Each of the GO term is represented for a node and the degree of similarity is represented for the number and width of the edge. The color represents the degree of significance. # # &%(#


209 MOLECULAR FUNCTION Figure 8c. MG genes higher expressed than RB for digestive gland in molecular function. Each of the GO term is represented for a node and the degree of similarity is represented for the number and width of the edge. The color represents the degree of significance. # # &%)#


210 BIOLOGICAL PROCESS!"#$%&'!"!#!"!$ %!"!& Figure 9a. LS genes higher expressed than MG for gill in biological process. Each of the GO term is represented for a node and the degree of similarity is represented for the number and width of the edge. The color represents the degree of significance. # &%*#


211 CELLULAR COMPONENT!"#$%&'!"!#!"!$ %!"!& Figure 9b. LS genes higher expressed than MG for gill cellular component. Each of the GO term is represented for a node and the degree of similarity is represented for the number and width of the edge. The color represents the degree of significance. # &%+#


212 MOLECULAR FUNCTION!"#$%&'!"!#!"!$ %!"!& Figure 9c. LS genes higher expressed than MG for gill in molecular function. Each of the GO term is represented for a node and the degree of similarity is represented for the number and width of the edge. The color represents the degree of significance. # &%"#


213 BIOLOGICAL PROCESS!"#$%&'!"!#!"!$ %!"!& Figure 10a. LS genes higher expressed than MG for mantle in biological process. Each of the GO term is represented for a node and the degree of similarity is represented for the number and width of the edge. The color represents the degree of significance. # &%$#


214 COMPONENT CELLULAR!"#$%&'!"!#!"!$ %!"!& Figure 10b. LS genes higher expressed than MG for mantle in cellular component. Each of the GO term is represented for a node and the degree of similarity is represented for the number and width of the edge. The color represents the degree of significance. # &!%#


215 MOLECULAR FUNCTION!"!#!"!$ %!"!& Figure 10c. LS genes higher expressed than MG for mantle in molecular function. Each of the GO term is represented for a node and the degree of similarity is represented for the number and width of the edge. The color represents the degree of significance. # &!!#


216 MOLECULAR FUNCTION!"!#!"!$ %!"!& Figure 10d. LS genes higher expressed than MG for mantle in molecular function. Each of the GO term is represented for a node and the degree of similarity is represented for the number and width of the edge. The color represents the degree of significance. # &!&#


217 !"#$%&'!"!#!"!$ %!"!& BIOLOGICAL PROCESS Figure 11a. LS genes higher expressed than MG for digestive gland in biological process. Each of the GO term is represented for a node and the degree of similarity is represented for the number and width of the edge. The color represents the degree of significance. # &!'#


218 CELLULAR COMPONENT!"!#!"!$ %!"!& Figure 11b. LS genes higher expressed than MG for digestive gland in cellular component. Each of the GO term is represented for a node and the degree of similarity is represented for the number and width of the edge. The color represents the degree of significance. # &!(#


219 MOLECULAR FUNCTION!"#$%&'!"!#!"!$ %!"!& Figure 11c. LS genes higher expressed than MG for digestive gland in molecular function. Each of the GO term is represented for a node and the degree of similarity is represented for the number and width of the edge. The color represents the degree of significance. # &!)#


220 BIOLOGICAL PROCESS!"#$%&'!"!#!"!$ %!"!& Figure 12a. LS genes higher expressed than RB for gill in biological process. Each of the GO term is represented for a node and the degree of similarity is represented for the number and width of the edge. The color represents the degree of significance. # &!*#


221 CELLULAR COMPONENT!"#$%&'!"!#!"!$ %!"!& Figure 12b. LS genes higher expressed than RB for gill cellular component. Each of the GO term is represented for a node and the degree of similarity is represented for the number and width of the edge. The color represent the degree of significance. # &!+#


222 MOLECULAR FUNCTION!"#$%&'!"!#!"!$ %!"!& Figure 12c. LS genes higher expressed than RB for gill in molecular function. Each of the GO term is represented for a node and the degree of similarity is represented for the number and width of the edge. The color represent the degree of significance. # &!"#


223 BIOLOGICAL PROCESS!"#$%&'!"!#!"!$ %!"!& Figure 13a. LS genes higher expressed than RB for mantle in biological process. Each of the GO term is represented for a node and the degree of similarity is represented for the number and width of the edge. The color represents the degree of significance. # &!$#


224 CELLULAR COMPONENT!"#$%&'!"!#!"!$ %!"!& Figure 13b. LS genes higher expressed than RB for mantle in cellular component. Each of the GO term is represented for a node and the degree of similarity is represented for the number and width of the edge. The color represents the degree of significance. # &&%#


225 !"#$%&'!"!#!"!$ %!"!& MOLECULAR FUNCTION Figure 13c. LS genes higher expressed than RB for mantle in molecular function. Each of the GO term is represented for a node and the degree of similarity is represented for the number and width of the edge. The color represents the degree of significance. # &&!#


226 BIOLOGICAL PROCESS!"#$%&'!"!#!"!$ %!"!& Figure 14a. LS genes higher expressed than RB for digestive gland in biological process. Each of the GO term is represented for a node and the degree of similarity is represented for the number and width of the edge. The color represents the degree of significance. # # &&&#


227 ,-../.01#, #!"#$%&'!"!#!"!$ %!"!& Figure 14b. LS genes higher expressed than RB for digestive gland in cellular component. Each of the GO term is represented for a node and the degree of similarity is represented for the number and width of the edge. The color represents the degree of significance. # # &&'#


228 32.-,/.01#7/5,6825#!"#$%&'!"!#!"!$ %!"!& Figure 14c. LS genes higher expressed than RB for digestive gland in molecular function. Each of the GO term is represented for a node and the degree of similarity is represented for the number and width of the edge. The color represents the degree of significance. # # &&(#


229 BIOLOGICAL PROCESS # Figure 15a. RB genes higher expressed than MG for gill in biological process. Each of the GO term is represented for a node and the degree of similarity is represented for the number and width of the edge. The color represents the degree of significance. # &&)#


230 CELLULAR COMPONENT Figure 15b. RB genes higher expressed than MG for gill cellular component. Each of the GO term is represented for a node and the degree of similarity is represented for the number and width of the edge. The color represent the degree of significance. # &&*#


231 MOLECULAR FUNCTION Figure 15c. RB genes higher expressed than MG for gill in molecular function. Each of the GO term is represented for a node and the degree of similarity is represented for the number and width of the edge. The color represent the degree of significance. # &&+#


232 BIOLOGICAL PROCESS Figure 16a. RB genes higher expressed than MG for mantle in biological process. Each of the GO term is represented for a node and the degree of similarity is represented for the number and width of the edge. The color represents the degree of significance. # &&"#


233 CELLULAR COMPONENT Figure 16b. RB genes higher expressed than MG for mantle in cellular component. Each of the GO term is represented for a node and the degree of similarity is represented for the number and width of the edge. The color represents the degree of significance. # &&$#


234 MOLECULAR FUNCTION Figure 16c. RB genes higher expressed than MG for mantle in molecular function. Each of the GO term is represented for a node and the degree of similarity is represented for the number and width of the edge. The color represents the degree of significance. # &'%#


235 BIOLOGICAL PROCESS Figure 17a. RB genes higher expressed than MG for digestive gland in biological process. Each of the GO term is represented for a node and the degree of similarity is represented for the number and width of the edge. The color represents the degree of significance. # &'!#


236 ,-../.01#, # Figure 17b. RB genes higher expressed than MG for digestive gland in cellular component. Each of the GO term is represented for a node and the degree of similarity is represented for the number and width of the edge. The color represents the degree of significance. # &'&#


237 MOLECULAR FUNCTION Figure 17c. RB genes higher expressed than MG for digestive gland in molecular function. Each of the GO term is represented for a node and the degree of similarity is represented for the number and width of the edge. The color represents the degree of significance. # &''#


238 BIOLOGICAL PROCESS Figure 18a. RB genes higher expressed than LS for gill in biological process. Each of the GO term is represented for a node and the degree of similarity is represented for the number and width of the edge. The color represents the degree of significance. # &'(#


239 CELLULAR COMPONENT Figure 18b. RB genes higher expressed than LS for gill cellular component. Each of the GO term is represented for a node and the degree of similarity is represented for the number and width of the edge. The color represent the degree of significance. # &')#


240 MOLECULAR FUNCTION Figure 18c. RB genes higher expressed than LS for gill in molecular function. Each of the GO term is represented for a node and the degree of similarity is represented for the number and width of the edge. The color represent the degree of significance. # &'*#


241 BIOLOGICAL PROCESS Figure 19a. RB genes higher expressed than LS for mantle in biological process. Each of the GO term is represented for a node and the degree of similarity is represented for the number and width of the edge. The color represents the degree of significance. # # &'+#


242 CELLULAR COMPONENT Figure 19b. RB genes higher expressed than LS for mantle in cellular component. Each of the GO term is represented for a node and the degree of similarity is represented for the number and width of the edge. The color represents the degree of significance. # # &'"#


243 MOLECULAR FUNCTION Figure 19c. RB genes higher expressed than LS for mantle in molecular function. Each of the GO term is represented for a node and the degree of similarity is represented for the number and width of the edge. The color represents the degree of significance. # # &'$#


244 982.2:8,0.#412,-;;# Figure 20a. RB genes higher expressed than LS for digestive gland in biological process. Each of the GO term is represented for a node and the degree of similarity is represented for the number and width of the edge. The color represents the degree of significance. # # &(%#


245 ,-../.01#, # Figure 20b. RB genes higher expressed than LS for digestive gland in cellular component. Each of the GO term is represented for a node and the degree of similarity is represented for the number and width of the edge. The color represents the degree of significance. # # &(!#


246 32.-,/.01#7/5,6825# Figure 20c. RB genes higher expressed than LS for digestive gland in molecular function. Each of the GO term is represented for a node and the degree of similarity is represented for the number and width of the edge. The color represents the degree of significance # # &(&#
TEST SUMMARY AND FRAMEWORK TEST SUMMARY
 Washington Educator Skills Tests Endorsements (WEST E) TEST SUMMARY AND FRAMEWORK TEST SUMMARY BIOLOGY Copyright 2014 by the Washington Professional Educator Standards Board 1 Washington Educator Skills
BIOLOGY STANDARDS BASED RUBRIC
 BIOLOGY STANDARDS BASED RUBRIC STUDENTS WILL UNDERSTAND THAT THE FUNDAMENTAL PROCESSES OF ALL LIVING THINGS DEPEND ON A VARIETY OF SPECIALIZED CELL STRUCTURES AND CHEMICAL PROCESSES. First Semester Benchmarks:
Big Idea 2: Biological systems utilize free energy and molecular building blocks to grow, to reproduce and to maintain dynamic homeostasis.
 Big Idea 2: Biological systems utilize free energy and molecular building blocks to grow, to reproduce and to maintain dynamic homeostasis. Enduring understanding 2.B: Growth, reproduction and dynamic
Text of objective. Investigate and describe the structure and functions of cells including: Cell organelles
 This document is designed to help North Carolina educators teach the s (Standard Course of Study). NCDPI staff are continually updating and improving these tools to better serve teachers. Biology 2009-to-2004
Biology EOC Review Study Questions
 Biology EOC Review Study Questions Microscopes and Characteristics of Life 1. How do you calculate total magnification on a compound light microscope? 2. What is the basic building block of all living
Components of a functional cell. Boundary-membrane Cytoplasm: Cytosol (soluble components) & particulates DNA-information Ribosomes-protein synthesis
 & particulates DNA-information Ribosomes-protein synthesis") Cell (Outline) - Components of a functional cell - Major Events in the History of Earth: abiotic and biotic phases; anaerobic and aerobic atmosphere - Prokaryotic cells impact on the biosphere - Origin
Cell (Outline) - Components of a functional cell - Major Events in the History of Earth: abiotic and biotic phases; anaerobic and aerobic atmosphere - Prokaryotic cells impact on the biosphere - Origin
Lecture 12. Metalloproteins - II
 Lecture 12 Metalloproteins - II Metalloenzymes Metalloproteins with one labile coordination site around the metal centre are known as metalloenzyme. As with all enzymes, the shape of the active site is
CHAPTER 3. Cell Structure and Genetic Control. Chapter 3 Outline
 CHAPTER 3 Cell Structure and Genetic Control Chapter 3 Outline Plasma Membrane Cytoplasm and Its Organelles Cell Nucleus and Gene Expression Protein Synthesis and Secretion DNA Synthesis and Cell Division
Bio/Life: Cell Biology
 Bio/Life: Cell Biology 1a The fundamental life processes of plants and animals depend on a variety of chemical reactions that occur in specialized areas of the organism's cells. As a basis for understanding
BIOLOGY EOC REVIEW. Concept/Question. How does energy flow in the ecosystem? How do cells maintain homeostasis of ph, salinity, temperature, etc?
 BIOLOGY EOC REVIEW Concept/Question Notes How does energy flow in the ecosystem? How do cells maintain homeostasis of ph, salinity, temperature, etc? Bonds- What are bonds? What are the different types
Range of Competencies
 BIOLOGY Content Domain Range of Competencies l. Nature of Science 0001 0003 20% ll. Biochemistry and Cell Biology 0004 0005 13% lll. Genetics and Evolution 0006 0009 27% lv. Biological Unity and Diversity
Compare and contrast the cellular structures and degrees of complexity of prokaryotic and eukaryotic organisms.
 Subject Area - 3: Science and Technology and Engineering Education Standard Area - 3.1: Biological Sciences Organizing Category - 3.1.A: Organisms and Cells Course - 3.1.B.A: BIOLOGY Standard - 3.1.B.A1:
Cell (Learning Objectives)
") Cell (Learning Objectives) 1. Understand & describe the basic components necessary for a functional cell. 2. Review the order of appearance of cells on earth and explain the endosymbiotic theory. 3. Compare
Cell (Learning Objectives) 1. Understand & describe the basic components necessary for a functional cell. 2. Review the order of appearance of cells on earth and explain the endosymbiotic theory. 3. Compare
Chemistry of Life Cells & Bioprocesses CRT Review
 Chemistry of Life Cells & Bioprocesses CRT Review Chapter 2: The Chemistry of Life macromolecules - The four types of macromolecules are carbohydrates, lipids, nucleic acids, and proteins Types of Macromolecules
Biology regimented study plan
 For each topic, write down notes, make it organized, always have a pencil and paper while studying. At the end of each section, test yourself (Answer past exam questions, practice Quizlet, watch Crash
Abiotic Stress in Crop Plants
 1 Abiotic Stress in Crop Plants Mirza Hasanuzzaman, PhD Professor Department of Agronomy Sher-e-Bangla Agricultural University E-mail: mhzsauag@yahoo.com Stress Stress is usually defined as an external
Curriculum Map. Biology, Quarter 1 Big Ideas: From Molecules to Organisms: Structures and Processes (BIO1.LS1)
") 1 Biology, Quarter 1 Big Ideas: From Molecules to Organisms: Structures and Processes (BIO1.LS1) Focus Standards BIO1.LS1.2 Evaluate comparative models of various cell types with a focus on organic molecules
1 Biology, Quarter 1 Big Ideas: From Molecules to Organisms: Structures and Processes (BIO1.LS1) Focus Standards BIO1.LS1.2 Evaluate comparative models of various cell types with a focus on organic molecules
Activity Activity Title. Chapter Title Chapter Description Lesson Title Lesson Description Introduction to Living Things
 Introduction to Living Things Students will explore the characteristics of living things, life cycles, stimuli and behavior, and how organisms maintain homeostasis. Characteristics of Living Things differentiate
Life Science FROM MOLECULES TO ORGANISMS: STRUCTURES AND PROCESSES
 FROM MOLECULES TO ORGANISMS: STRUCTURES AND PROCESSES HS-LS1-1 Construct an explanation based on evidence for how the structure of DNA determines the structure of proteins which carry out the essential
Biology Spring Final Exam Study Guide
 Name: Hour: Basic Biology Skills Graphing Know the keys to creating a graph Know how to interpret a graph Independent variable Dependent variable Biology Spring Final Exam Study Guide Levels of Organization
Next Generation Science Standards Life Science Performance Expectations
 A Correlation of Essentials of Human Anatomy and Physiology 12 th Edition, 2018 To the Life Science Performance Expectations HS-LS1 From Molecules to Organisms: Structures and Processes HS-LS1-1. Construct
Signal Transduction. Dr. Chaidir, Apt
 Signal Transduction Dr. Chaidir, Apt Background Complex unicellular organisms existed on Earth for approximately 2.5 billion years before the first multicellular organisms appeared.this long period for
Massachusetts Tests for Educator Licensure (MTEL )
") Massachusetts Tests for Educator Licensure (MTEL ) FIELD 13: BIOLOGY TEST OBJECTIVES Subarea Multiple-Choice Range of Objectives Approximate Test Weighting I. Nature of Science 01 04 10% II. Chemistry
Massachusetts Tests for Educator Licensure (MTEL ) FIELD 13: BIOLOGY TEST OBJECTIVES Subarea Multiple-Choice Range of Objectives Approximate Test Weighting I. Nature of Science 01 04 10% II. Chemistry
6 th Grade Life Science Strand 3: Characteristics and Interactions of Living Organisms
 Middle School Life Science Standards There are 15 standards that encompass the proposed middle school life science standards. The new standards are listed 4 times to match the four times life science is
Jordan University of Science & Technology. Faculty of Arts and Sciences. Department of Applied Biological Sciences
 Jordan University of Science & Technology Faculty of Arts and Sciences Department of Applied Biological Sciences Course Title Title & Instructor General Biology Course Number BIO 104 Instructor Office
Biology-Integrated Year-at-a-Glance ARKANSAS STATE SCIENCE STANDARDS
 Biology-Integrated Year-at-a-Glance ARKANSAS STATE SCIENCE STANDARDS FIRST SEMESTER FIRST/SECOND SECOND SEMESTER Unit 1 Biochemistry/Cell Division/ Specialization Unit 2 Photosynthesis/ Cellular Respiration
Growth & Development. Characteristics of Living Things. What is development? Movement. What is a cell?
 Characteristics of Living Things made of cells growth acquire and use energy reproduction movement adaptation respond to stimuli/homeostasis interdependence organization What is development? What are some
Module A Unit 1 Basic Biological Principles. Mr. Mitcheltree
 Module A Unit 1 Basic Biological Principles Mr. Mitcheltree Biochemistry Cytology Genetics Evolution Taxonomy Microbiology Mycology Botany Zoology Ecology Branches of Biology Characteristics of Life Made
Miller & Levine Biology 2010
 A Correlation of 2010 to the Pennsylvania Assessment Anchors Grades 9-12 INTRODUCTION This document demonstrates how 2010 meets the Pennsylvania Assessment Anchors, grades 9-12. Correlation page references
Anatomy and Physiology. Science Curriculum Framework
 Anatomy and Physiology Science Curriculum Framework Revised 005 Anatomy and Physiology Anatomy and Physiology should develop an understanding of the organization of the human body through studies of body
California Subject Examinations for Teachers
 California Subject Examinations for Teachers TEST GUIDE SCIENCE SUBTEST II: LIFE SCIENCES Subtest Description This document contains the Life Sciences subject matter requirements arranged according to
Biology Semester One Final Exam Review
 Biology Semester One Final Exam Review PART ONE: CHARACTERISTICS OF LIFE 1) Define Biology. (Remember to break words down into the prefix and suffix to determine the meaning if needed.) The study of life
Keystone Exams: Biology Assessment Anchors and Eligible Content. Pennsylvania Department of Education
 Assessment Anchors and Pennsylvania Department of Education www.education.state.pa.us 2010 PENNSYLVANIA DEPARTMENT OF EDUCATION General Introduction to the Keystone Exam Assessment Anchors Introduction
Toxicological Targets. Russell L. Carr Department of Basic Sciences College of Veterinary Medicine
 Toxicological Targets Russell L. Carr Department of Basic Sciences College of Veterinary Medicine Toxicology Definitions = study of poisons Poison = any agent capable of producing a deleterious response
Basic Chemistry. Chemistry Review. Bio 250: Anatomy & Physiology
 Basic Chemistry Bio 250: Anatomy & Physiology Chemistry Review It is going to be your responsibility to review the basic principles of chemistry you learned in BIO 101 This basic set of notes will help
Class Work 31. Describe the function of the Golgi apparatus? 32. How do proteins travel from the E.R. to the Golgi apparatus? 33. After proteins are m
 Eukaryotes Class Work 1. What does the word eukaryote mean? 2. What is the one major difference between eukaryotes and prokaryotes? 3. List the different kingdoms of the eukaryote domain in the order in
Academic Biology: Midterm Review
 Academic Biology: Midterm Review Quarter #1 Chapter 1: The Science of Biology Biology the study of the living world Scientific Method Step 1: Observation Step 2: Forming a Question Step 3: Form a Hypothesis
I. Molecules & Cells. A. Unit One: The Nature of Science. B. Unit Two: The Chemistry of Life. C. Unit Three: The Biology of the Cell.
 I. Molecules & Cells A. Unit One: The Nature of Science a. How is the scientific method used to solve problems? b. What is the importance of controls? c. How does Darwin s theory of evolution illustrate
Animals contain specialized cells
 What is an Animal? Kingdom Animalia Main Characteristics Members of the Animal Kingdom are: Eukaryotic Multicellular Heterotrophic Have cells with membranes BUT NO cell wall Animals contain specialized
Biochemistry: A Review and Introduction
 Biochemistry: A Review and Introduction CHAPTER 1 Chem 40/ Chem 35/ Fundamentals of 1 Outline: I. Essence of Biochemistry II. Essential Elements for Living Systems III. Classes of Organic Compounds IV.
Department Curriculum and Assessment Outline
 Department: Science Year Group: 10 Teaching, learning and assessment during the course: Combined Science 1 2 B1 Key concepts in Biology B2 Cells and control What are the structure and function of cells.
Side-by-Side Comparison of the Texas Educational Knowledge and Skills (TEKS) and Louisiana Grade Level Expectations (GLEs) SCIENCE: Biology
 and Louisiana Grade Level Expectations (GLEs) SCIENCE: Biology") Side-by-Side Comparison of the Texas Educational Knowledge and Skills (TEKS) and Louisiana Grade Level Expectations (GLEs) SCIENCE: Biology TEKS Comments Louisiana GLE (Bio.1) Scientific Processes. The
Side-by-Side Comparison of the Texas Educational Knowledge and Skills (TEKS) and Louisiana Grade Level Expectations (GLEs) SCIENCE: Biology TEKS Comments Louisiana GLE (Bio.1) Scientific Processes. The
Introduction to Animals
 Introduction to Animals Characteristics of Animals multicellular Except for sponges, animal cells are arranged into tissues. Tissues are necessary to produce organs and organ systems. Tissues, organs,
OCR Biology Checklist
 Topic 1. Cell level systems Video: Eukaryotic and prokaryotic cells Compare the structure of animal and plant cells. Label typical and atypical prokaryotic cells. Compare prokaryotic and eukaryotic cells.
Miller & Levine Biology 2014
 A Correlation of Miller & Levine Biology To the Essential Standards for Biology High School Introduction This document demonstrates how meets the North Carolina Essential Standards for Biology, grades
Philipsburg-Osceola Area School District Science Department. Standard(s )
") Philipsburg-Osceola Area School District Science Department Course Name: Biology Grade Level: 10 Timelin e Big Ideas Essential Questions Content/ Concepts Skills/ Competencies Standard(s ) Eligible Content
Philipsburg-Osceola Area School District Science Department Course Name: Biology Grade Level: 10 Timelin e Big Ideas Essential Questions Content/ Concepts Skills/ Competencies Standard(s ) Eligible Content
2. In regards to the fluid mosaic model, which of the following is TRUE?
 General Biology: Exam I Sample Questions 1. How many electrons are required to fill the valence shell of a neutral atom with an atomic number of 24? a. 0 the atom is inert b. 1 c. 2 d. 4 e. 6 2. In regards
OCR Biology Checklist
 Topic 1. Cell level systems Video: Eukaryotic and prokaryotic cells Compare the structure of animal and plant cells. Label typical and atypical prokaryotic cells. Compare prokaryotic and eukaryotic cells.
Biology II : Embedded Inquiry
 Biology II : Embedded Inquiry Conceptual Strand Understandings about scientific inquiry and the ability to conduct inquiry are essential for living in the 21 st century. Guiding Question What tools, skills,
Delivery. Delivery Processes. Delivery Processes: Distribution. Ultimate Toxicant
 Delivery Ultimate Toxicant The chemical species that reacts with the endogenous target. Toxicity depends on the concentration (dose) of the ultimate toxicant at the target site Delivery Processes Absorption
Introduction to Biology
 Introduction to Biology Course Description Introduction to Biology is an introductory course in the biological sciences. Topics included are biological macromolecules, cell biology and metabolism, DNA
I. Molecules and Cells: Cells are the structural and functional units of life; cellular processes are based on physical and chemical changes.
 I. Molecules and Cells: Cells are the structural and functional units of life; cellular processes are based on physical and chemical changes. A. Chemistry of Life B. Cells 1. Water How do the unique chemical
FINAL VERSION_ Secondary Preservice Teacher Standards -- Life Science AFK12SE/NGSS Strand Disciplinary Core Idea
 Secondary Preservice Teacher Standards -- Life Science AFK12SE/NGSS Strand Disciplinary Core Idea LS1: From Molecules to Organisms: Structures and Processes LS1.A: Structure and Function How do the structures
Name: Date: Period: Biology End of Course Vocabulary 1. This is an organism s unique role in the environment that includes the habitat, function, and
 1. This is an organism s unique role in the environment that includes the habitat, function, and activities of the organism. a. Niche 2. This is a inter-species relationship in which one species benefits
Missouri Educator Gateway Assessments
 Missouri Educator Gateway Assessments June 2014 Content Domain Range of Competencies Approximate Percentage of Test Score I. Science and Engineering Practices 0001 0003 21% II. Biochemistry and Cell Biology
Practicing Biology Questions
 Practicing Biology Questions Big Idea 2.A 1. Log onto http://www.bozemanscience.com/ap-biology/. Scroll down to Big Idea 2: Free Energy. Complete the video review activities listed below for videos #012,
Basic Biological Principles
 Basic Biological Principles Use the diagram below to answer question 1. Moth Life Cycle larva egg pupa Adult 1. Which characteristic of life is best shown by this diagram? A. DNA is the genetic code in
Name # Class Date Regents Review: Cells & Cell Transport
 Name # Class Date Regents Review: Cells & Cell Transport 1. All of the following are true regarding cells except? A) All cells have genetic material B) All cells have cell walls C) All cells have plasma
13. The diagram below shows two different kinds of substances, A and B, entering a cell.
 Name 1. In the binomial system of nomenclature, which two classification groups provide the scientific name of an organism? A) kingdom and phylum B) phylum and species C) kingdom and genus D) genus and
Regulation and signaling. Overview. Control of gene expression. Cells need to regulate the amounts of different proteins they express, depending on
 Regulation and signaling Overview Cells need to regulate the amounts of different proteins they express, depending on cell development (skin vs liver cell) cell stage environmental conditions (food, temperature,
Stockton Unified School District Instructional Guide for BIOLOGY NGSS Pilot for both 4X4 and Traditional. 1st Quarter
 1st Quarter Unit NGSS Standards Required Labs Supporting Text Content Academic Suggested Labs and Activities Biochemistry HS-LS-1-6 Ch. 1 & 2 molecules elements amino acids Carbon-based Carbon Hydrogen
Reception The target cell s detection of a signal coming from outside the cell May Occur by: Direct connect Through signal molecules
 Why Do Cells Communicate? Regulation Cells need to control cellular processes In multicellular organism, cells signaling pathways coordinate the activities within individual cells that support the function
Chetek-Weyerhaeuser Middle School
 Chetek-Weyerhaeuser Middle School Science 7 Units and s Science 7A Unit 1 Nature of Science Scientific Explanations (12 days) s 1. I can make an informed decision using a scientific decision-making model
The diagram below represents levels of organization within a cell of a multicellular organism.
 STATION 1 1. Unlike prokaryotic cells, eukaryotic cells have the capacity to a. assemble into multicellular organisms b. establish symbiotic relationships with other organisms c. obtain energy from the
CELL PRACTICE TEST
 Name: Date: 1. As a human red blood cell matures, it loses its nucleus. As a result of this loss, a mature red blood cell lacks the ability to (1) take in material from the blood (2) release hormones to
BASIC BIOLOGICAL PRINCIPLES
 BASIC BIOLOGICAL PRINCIPLES A1 A1. Basic Biological Principles 1. Describe the characteristics of life shared by all prokaryotic and eukaryotic organisms 2. Compare cellular structures and their function
2. Cellular and Molecular Biology
 2. Cellular and Molecular Biology 2.1 Cell Structure 2.2 Transport Across Cell Membranes 2.3 Cellular Metabolism 2.4 DNA Replication 2.5 Cell Division 2.6 Biosynthesis 2.1 Cell Structure What is a cell?
Area of Focus: Biology. Learning Objective 1: Describe the structure and function of organs. Pre-Learning Evaluation: Teaching Methods and Process:
 Area of Focus: Biology Learning Objective 1: Describe the structure and function of organs. Pre- Diagram and label the structure of the primary components of representative organs in plants and animals
Name: Date: Period: BIOLOGY Final Exam Study Guide. 3. List the 4 major macromolecules (biomolecules), their monomers AND their functions. a.
, their monomers AND their functions. a.") Name: Date: Period: Water and Cells BIOLOGY Final Exam Study Guide 1. Define homeostasis: 2. Match the property of water with its correct description: a. High specific heat b. High heat of vaporization
Name: Date: Period: Water and Cells BIOLOGY Final Exam Study Guide 1. Define homeostasis: 2. Match the property of water with its correct description: a. High specific heat b. High heat of vaporization
Cell Is the basic structural, functional, and biological unit of all known living organisms. Cells are the smallest unit of life and are often called
 The Cell Cell Is the basic structural, functional, and biological unit of all known living organisms. Cells are the smallest unit of life and are often called the "building blocks of life". The study of
CST and FINAL EXAM REVIEW
 Name Date Period CST and FINAL EXAM REVIEW Directions: Both your final exam and the CST (STAR) test are based on the California Standards. There are five major categories and they include: Investigation
BIOLOGY CELLS FIRST SEMESTER STUDY GUIDE. Define:
 BIOLOGY FIRST SEMESTER STUDY GUIDE CELLS * SPI 3210.1.1 and 3210.1.2 Compare the structure and function of cellular organelles in both prokaryotic and eukaryotic cells. Define: What is Biology? eukaryotic
Biological Process Term Enrichment
 Biological Process Term Enrichment cellular protein localization cellular macromolecule localization intracellular protein transport intracellular transport generation of precursor metabolites and energy
The Prokaryotic World
 The Prokaryotic World A. An overview of prokaryotic life There is no doubt that prokaryotes are everywhere. By everywhere, I mean living in every geographic region, in extremes of environmental conditions,
Marine Resources Development Foundation/MarineLab Grades: 9, 10, 11, 12 States: AP Biology Course Description Subjects: Science
 Marine Resources Development Foundation/MarineLab Grades: 9, 10, 11, 12 States: AP Biology Course Description Subjects: Science Highlighted components are included in Tallahassee Museum s 2016 program
Program Specific Outcomes: PSO of B. Sc., Zoology
 Program Specific Outcomes: PSO of B. Sc., Zoology Demonstrated a broad understood of animal diversity, including knowledge of the scientific classification and evolutionary relationships of major groups
Chapter 2 Concepts of Chemistry
 Anatomy Physiology and Disease for the Health Professions 3rd Edition Booth Test Bank Full Download: http://testbanklive.com/download/anatomy-physiology-and-disease-for-the-health-professions-3rd-edition-booth-te
ADVANCED PLACEMENT BIOLOGY
 ADVANCED PLACEMENT BIOLOGY Description Advanced Placement Biology is designed to be the equivalent of a two-semester college introductory course for Biology majors. The course meets seven periods per week
Valley Central School District 944 State Route 17K Montgomery, NY Telephone Number: (845) ext Fax Number: (845)
 ext Fax Number: (845)") Valley Central School District 944 State Route 17K Montgomery, NY 12549 Telephone Number: (845)457-2400 ext. 18121 Fax Number: (845)457-4254 Advance Placement Biology Presented to the Board of Education
Valley Central School District 944 State Route 17K Montgomery, NY 12549 Telephone Number: (845)457-2400 ext. 18121 Fax Number: (845)457-4254 Advance Placement Biology Presented to the Board of Education
02/02/ Living things are organized. Analyze the functional inter-relationship of cell structures. Learning Outcome B1
 Analyze the functional inter-relationship of cell structures Learning Outcome B1 Describe the following cell structures and their functions: Cell membrane Cell wall Chloroplast Cytoskeleton Cytoplasm Golgi
UGZY-01 Animal Diversity-I
 UGZY-01 Animal Diversity-I Block-I I Diversity of Animal Life-I (Organisation) Five Kingdom Classification The Protozoans The Metazoa- Origin and Evolution Diverstiy of Animal Life-II (Classification)
Endocrine Physiology. Introduction to Endocrine Principles
 Endocrine Physiology Introduction to Endocrine Principles There are TWO major groups of hormones Peptide and protein hormones Amine hormones Peptide and protein hormones act through cell membrane receptors
Biology Semester 1 Study Guide
 Biology Semester 1 Study Guide Part 1: Scientific Investigations You are conducting an experiment to determine if increased UV radiation from the decrease in the ozone layer is killing off frog tadpoles.
Use evidence of characteristics of life to differentiate between living and nonliving things.
 Grade Big Idea Essential Questions Concepts Competencies Vocabulary 2002 Standards All living things have a common set characteristic needs and functions that separate them from nonliving things such as:
Biology Unit Overview and Pacing Guide
 This document provides teachers with an overview of each unit in the Biology curriculum. The Curriculum Engine provides additional information including knowledge and performance learning targets, key
Which row in the chart correctly identifies the functions of structures A, B, and C? A) 1 B) 2 C) 3 D) 4
 1 B) 2 C) 3 D) 4") 1. What is a similarity between all bacteria and plants? A) They both have a nucleus B) They are both composed of cells C) They both have chloroplasts D) They both lack a cell wall 2. Which statement is
1. What is a similarity between all bacteria and plants? A) They both have a nucleus B) They are both composed of cells C) They both have chloroplasts D) They both lack a cell wall 2. Which statement is
Ohio Tutorials are designed specifically for the Ohio Learning Standards to prepare students for the Ohio State Tests and end-ofcourse
 Tutorial Outline Ohio Tutorials are designed specifically for the Ohio Learning Standards to prepare students for the Ohio State Tests and end-ofcourse exams. Biology Tutorials offer targeted instruction,
AP Biology Essential Knowledge Cards BIG IDEA 1
 AP Biology Essential Knowledge Cards BIG IDEA 1 Essential knowledge 1.A.1: Natural selection is a major mechanism of evolution. Essential knowledge 1.A.4: Biological evolution is supported by scientific
The Cell. C h a p t e r. PowerPoint Lecture Slides prepared by Jason LaPres North Harris College Houston, Texas
 C h a p t e r 2 The Cell PowerPoint Lecture Slides prepared by Jason LaPres North Harris College Houston, Texas Copyright 2009 Pearson Education, Inc., publishing as Pearson Benjamin Cummings Introduction
Biology Paper 1 1hr 15mins 70 marks
 Biology Paper 1 1hr 15mins 70 marks Cell Biology (Yr9) Cell Organisation (Yr9) Infection and Response (Yr10) Bioenergetics (Yr10) Cells Cell Organisation Competition Photosynthesis Microscopy Enzymes Abiotic
McDougal Littell Science, Cells and Heredity MAZER PDF. IL Essential Lesson. IL Extend Lesson. Program Planning Guide LP page.
 s7an-ppg-pc-il-002-012.indd 2 7/18/05 2:46:40 PM 2 McDougal Littell Science, Cells and Heredity Chapter 1: The Cell, pp. 6 37 1.1 The cell is the basic unit of living things. pp. 9 17 Explore: Activity
Biology 10 th Grade. Textbook: Biology, Miller and Levine, Pearson (2010) Prerequisite: None
 Prerequisite: None") Biology 10 th Grade SCI 401, 402 Biology 1 credit 5 days a week; 2 semesters Taught in English Biology - The Study of Life! This is a required course for all 10 th grade students in both the Mexican and/or
Biology 10 th Grade SCI 401, 402 Biology 1 credit 5 days a week; 2 semesters Taught in English Biology - The Study of Life! This is a required course for all 10 th grade students in both the Mexican and/or
AP Biology - Summer Assignment
 Lorraine Dunigan 2016-2017 School Year duniganl@calvertnet.k12.md.us AP Biology - Summer Assignment GENERAL DIRECTIONS: You may use the internet, library, previous biology course notes, and/or textbooks
CELL SIGNALLING and MEMBRANE TRANSPORT. Mark Louie D. Lopez Department of Biology College of Science Polytechnic University of the Philippines
 CELL SIGNALLING and MEMBRANE TRANSPORT Mark Louie D. Lopez Department of Biology College of Science Polytechnic University of the Philippines GENERIC SIGNALLING PATHWAY CELL RESPONSE TO SIGNALS CELL RESPONSE
Summary of changes (certificate to new GCSE)
") Summary of changes (certificate to new GCSE) This resource outlines the main changes that have been made to the assessment and subject content from our legacy Level 1/2 Certificate in Biology (8401) to
Summary of changes (certificate to new GCSE) This resource outlines the main changes that have been made to the assessment and subject content from our legacy Level 1/2 Certificate in Biology (8401) to
2. What properties or characteristics distinguish living organisms? Substance Description Example(s)
") PREIB BIOLOGY FIRST SEMESTER REVIEW (I) 2015-16 Life on Earth 1. Describe the hierarchy of life on Earth from broadest to narrowest category. 2. What properties or characteristics distinguish living organisms?
PREIB BIOLOGY FIRST SEMESTER REVIEW (I) 2015-16 Life on Earth 1. Describe the hierarchy of life on Earth from broadest to narrowest category. 2. What properties or characteristics distinguish living organisms?
SCOTCAT Credits: 20 SCQF Level 7 Semester 1 Academic year: 2018/ am, Practical classes one per week pm Mon, Tue, or Wed
 Biology (BL) modules BL1101 Biology 1 SCOTCAT Credits: 20 SCQF Level 7 Semester 1 10.00 am; Practical classes one per week 2.00-5.00 pm Mon, Tue, or Wed This module is an introduction to molecular and
Structures and Functions of Living Organisms (LS1)
") EALR 4: Big Idea: Core Content: Life Science Structures and Functions of Living Organisms (LS1) Processes Within Cells In prior grades students learned that all living systems are composed of cells which
EALR 4: Big Idea: Core Content: Life Science Structures and Functions of Living Organisms (LS1) Processes Within Cells In prior grades students learned that all living systems are composed of cells which
Please be aware that any form of plagiarism will result in penalties consistent with the CCPS Academic Dishonesty Policy.
 AP Biology Summer Assignment GENERAL DIRECTIONS: You can use e- textbook (Campbell Biology, AP Edition 9e) to find answers to the following questions. The instructions to register are already given to
Unit 5: Living beings
 Unit 5: Living beings 1. Characteristics of living beings 2. Composition of living beings 3. The cell 4. The vital functions 5. Levels of organisation Think and answer? a. What living beings can you see