Role of RanBPM in Drosophila fat body for the remote control of insulin secretion and feeding behavior. Swati Agnihotri (MSc.
|
|
|
- Gwenda Willis
- 6 years ago
- Views:
Transcription
1 Role of RanBPM in Drosophila fat body for the remote control of insulin secretion and feeding behavior Swati Agnihotri (MSc. Thesis) 1
2 Abstract RanBPM (Ran-Binding Protein in the Microtubule Organizing Center) is an evolutionarily conserved protein presumed to function as a scaffold in various signal transduction pathways. Null mutations in the Drosophila RanBPM gene cause a pleiotropic effect as seen by the late larval lethality, impaired growth, reduced CNS proliferation and disruption in feeding and response to light behaviours (Scantelbury et al., 2010). We report that RanBPM mutants display impaired expression and secretion of one of the major Drosophila insulin like peptides, DILP2. Consistent with these findings RanBPM mutants showed reduced membrane localization of the Phosphatidylinositol (3,4,5)-trisphosphate (PIP3) reporter TGPH (GFP-pleckstrin homology domain (PH) fusion regulated by the Tubulin promoter) and reduced activation of the serine threonine kinase AKT, both read outs of insulin signalling (InS). Ubiquitous overexpression of DILP2 partially rescued the reduced larval growth, CNS proliferation and feeding phenotypes caused by RanBPM mutations. Over expression of DILP6 in the glia rescued the reduced CNS proliferation but not the reduced larval growth and feeding behaviour phenotypes. Targeted expression of RanBPM in the fat body suppressed all RanBPM mutant phenotypes except for lethality. In Drosophila, the fat body acts a nutritional sensor involved in coordinating neuroblast proliferation by a TOR- dependent mechanism. Our results present evidence for the role of AKT in the fat body of the RanBPM mutants for the regulation of CNS proliferation, DILP2 secretion, overall growth and feeding 2
3 behaviour. Furthermore, my results also suggest potential roles for TOR and S6K in the fat body for the regulation of RanBPM mutant phenotypes. 3
4 Acknowledgements First, I would like to thank my supervisor, Dr. Ana Campos for providing me with the opportunity to complete my Master s program in her lab and for all her support in the recent years. I will be forever grateful for the guidance and the encouragement you provided. I will cherish our conversations and laughs for years ahead. Ana, thank you for being a great supervisor and a mentor. Thank you to Dr. Roger Jacobs and Dr. André Bédard for their insightful inputs towards my research. Special thanks to Xiao Li for making every impediment seem manageable in the lab. Words cannot justify my appreciation for the help you have been. My overall research experience working in the fly lab has been gratifying thanks to the current and past members. Lab meetings, research discussions and stories we had shared were all memorable. I am glad to have had the chance to work with you all. To the members of Dr. Jacobs, Dr. Bedard and Dr. O Donnell s lab, thanks for making fly work in the lab more entertaining through our stimulating discussions about fly genetics. Greatly appreciate your insights towards my research. Thanks to my friends, for encouragement during times of stress and for the great times we have spent together. My graduate experience would not have been the same without all of you. Finally, I would like to thank my family for believing in me every step of the way. Thanks to my parents for being my guiding light and for supporting me. Thanks to my loving grandparents for their prayers and blessings. 4
5 Contributions My thesis is a draft for a manuscript that is in the process of revision. My results will contribute to the experiments required for the completion of this manuscript. Experiments for this manuscript were designed and conceived by Dr. Ana Campos. In addition to my data, experiments performed by Xiao Li Zhao and by Dr. André Bédard comprise this manuscript. Therefore I would like to acknowledge Xiao Li s experiments highlighted in figures 3, 4, 5, 6A, 6B, 7A, 7B, 7C, section of 7D and in additional files. Western blot depicted in panel 5C was a contribution to the manuscript by Dr. Bédard. Thanks to Xiao Li and Dr. Bédard for their contributions. 5
6 Table of Contents Abstract Acknowledgements Contributions Table of Contents List of Illustrations List of Abbreviations Chapter 1: Introduction 1.1 Ran Bonding Protein in the Microtubule Organizing Center (RanBPM) 1.2 Drosophila RanBPM 1.3 Drosophila fat body organ 1.4 Insulin and Target of Rapamycin (TOR) signaling 1.5 Remote control of insulin secretion by the fat body 1.6 Thesis Objectives Chapter 2: Materials and Methods 2.1 Drosophila strains and culture 2.2 Feeding behaviour assay 2.3 Statistical Analyses 2.4 Immunohistochemistry and imaging 2.5 Western blotting analysis 2.6 Lysotracker staining and imaging 2.7 Data organization for figures Chapter 3: Results 3.1 Targeted expression of RanBPM in neurosecretory cells rescues the disruption in feeding behaviour, reduced growth and lethality of RanBPM mutants 3.2 RanBPM gene function is required for proper insulin gene expression and secretion 3.3 RanBPM mutants display reduced peripheral insulin signalling 3.4 Forced expression of DILPs suppresses the feeding, size and CNS proliferation phenotypes of RanBPM mutants 3.5 Targeted expression of RanBPM in the fat body partially rescues most of the RanBPM mutant phenotypes 3.6 Overexpression of AKT in the fat body partially rescues RanBPM
7 mutant phenotypes 3.7 Up-regulation of Target of Rapamycin (TOR) or S6K in the fat body of RanBPM mutants partially rescues the CNS proliferation phenotype of RanBPM mutants 3.8 Autophagy in RanBPM mutants 3.9 Up-regulation of insulin signaling in the fat body Chapter 4: Discussion 4.1 Impaired insulin signaling in RanBPM mutants 4.2 Expression of RanBPM in the fat body 4.3 Ins/TOR signaling in the fat body of RanBPM mutants 4.4 Conclusions
8 List of Illustrations Figure 1. Figure 2. Figure 3. Figure 4. Figure 5. Figure 6. Figure 7. Figure 8. Figure 9. Figure 10. Figure 11. Figure 12. Figure 13. Figure 14. Figure 15. Figure16. Ins/TOR signalling. Schematic representation of the proposed model for RanBPM function. Targeted expression of RanBPM in neurosecretory cells is sufficient to rescue the feeding phenotype of RanBPM mutants Impact of RanBPM mutations on subsets of neurosecretory cells. RanBPM mutant phenotypes consistent with disrupted systemic insulin signaling. Ubiquitous expression of DILP2 partially restores RanBPM mutant phenotype Targeted expression in the fat body rescues RanBPM mutant phenotype. Up- regulation of AKT in the fat body partially rescues RanBPM mutant phenotypes Targeted expression of AKT(myr) in the fat body of RanBPM mutants. Expression of InR in the fat body of RanBPM mutants. Targeted Expression of TOR in the fat body partially rescues the CNS proliferation of RanBPM mutants. Over expression of S6K in the fat body partially rescues the CNS proliferation and the size of RanBPM mutants. Targeted expression of dilps in DIMM- positive peptidergic neurons in RanBPM mutants. Examining autophagy in RanBPM K05201 mutants using LysoTracker probe. Measuring the size of lipid droplets in RanBPM K05201 mutants under fed and nutrient deprived conditions. Measure of food intake by modulating insulin signaling in the fat body
9 Additional files List of Abbreviations 4E-BP 4E binding protein AKH adipokinetic hormone AKT/PKB protein kinase B ALK anaplastic lymphoma kinase ALS acid labile subunite ATG autophagy BDNF brain derived neurotrophic factor CA constitutively active CNS central nervous system CTLH C-terminal to LisH motif dilp Drosophila Insulin-like peptide Dimm dimmed DN dominant negative FDS fat body- derived signal FMRP fragile mental retardation protein GFP green fluorescent protein IgG immunoglobulin G Imp-L2 ecdysone-inducible gene L2 InR/IGFR insulin receptor/insulin growth factor receptor InS insulin signaling IRS insulin receptor substrate Jeb jelly belly LisH lissencephaly type-1-like homology Lsp2 larval serum protein 2 MAPK mitogen-activated protein kinase MB mushroom body mnsc or IPC medial neurosecretory cells or insulin producing cells Myr myristoylated NB neuroblast NLaz neural lazarillo PDK phosphoinositide dependent kinase PH pleckstrin homology Phospho-H3 phosphorylated Histone H3 PI3K phosphatidylinositol-3-kinase PIP2and PIP3 phosphatidylinositol-4,5-p2 and phosphatidylinositol-3,4,5-p3 9
10 Ppl pumpless PTEN phosphatase and tensin homolog RanBPM ran binding protein in the microtubule organizing center RHEB RAS homologue enriched in brain S6K ribosomal S6 kinase Sb stubble SDS sodium dodecyl sulfate Slif slimfast SPRY spore lysis ryanodine Tb tubby TOR target of rapamycin TORC1/2 TOR complex1 and 2 TrK tropomyosin-related kinase TSC1/2 tumour suppressor complex 1 and 2 UAS upstream activating sequence Upd2 unpaired 2 WT wild type 10
11 Chapter 1: Introduction 11
12 Introduction 1.1 Ran Binding Protein in the Microtubule Organizing Center (RanBPM) RanBPM was first identified in a yeast two hybrid screen using Ran as bait however a function in Ran- related processes have not been reported to date (Yokoyama et al., 1995; Nishitani et al., 2001; reviewed by Murrin and Talbot, 2007). In vertebrates, RanBPM polypeptide is comprised of multiple conserved domains involved in protein protein interaction. Conserved domains of RanBPM are proline rich domain, spore lysis A and ryanodine receptor domain (SPRY), Lissencephaly type-1-like homology motif (LisH), carboxy-terminal to LisH motif (CTLH) and CT11-RanBPM (CRA motif) (reviewed by Murrin and Talbot, 2007). The structural organization of RanBPM suggests that it acts as a scaffolding protein for an array of signaling assemblies (Denti et al., 2004; Cheng et al., 2005 and Wang et al., 2002). Of interest to the current report is the role of RanBPM in regulating BDNF- triggered Trk-dependent MAPK and PI3K function (Yuan et al., 2006; Yin et al., 2010). Additionally, microarray analyses of cell lines reports that RanBPM down regulation modulates PI3K/AKT signaling (Atabakhsh et al., 2012). RanBPM has also been reported as a coordinator of signal inputs between lymphocyte functionassociated antigen-1 (LFA-1) and intracellular signalling pathways involved in regulating immune function (Denti et al., 2004). A role for RanBPM phosphorylation has also been reported in the regulation of stress signaling pathways in response to extracellular stimuli such as UV and osmotic shock (Denti et al., 2004). Taken together these studies 12
13 support the hypothesis that RanBPM acts as a scaffolding protein in various signal transduction pathways. 1.2 Drosophila RanBPM In Drosophila, RanBPM mutations cause pleiotropic phenotypes that include disruption of feeding, growth, response to light, locomotion resulting in late larval lethality (Scantelbury et al., 2010). Targeted expression of RanBPM in the nervous system, specifically in the mushroom bodies (MBs), rescues many of the phenotypes of RanBPM mutants including feeding behaviour (Scantelbury et al., 2010). Mushroom body is involved in olfactory learning and memory formation in insects e.g. honeybee, fly, cricket, grasshopper, locust, and cockroach (reviewed by McBride et al 2012). In line with these results, recent studies have shown that impairment of insulin signalling in the MB impairs feeding behaviour of the Drosophila larvae (Zhao and Campos, 2012). Studies examining the role of RanBPM in adult flies have demonstrated a requirement of RanBPM for the regulation of cell shape, size and organization of the germ line stem cell niche in the Drosophila ovary (Dansereau and Lasko, 2008). Our previous investigations have suggested a role for RanBPM protein in suppressing the neuromuscular junction overgrowth phenotype caused by mutations in FMRP gene known to be involved in the pathogenesis of fragile X syndrome (Scantelbury et al., 2010). 13
14 1.3 Drosophila fat body organ The Drosophila fat body is a specialized tissue equivalent to the vertebrate liver and the white adipose tissue. This organ plays a central role in lipid storage and utilization (reviewed by Arrese and Soulages, 2010). It stores lipids as triacylglycerol and sugar as glycogen. Fat body acts as a central site for many metabolic processes including lipid, carbohydrate, amino acid and nitrogen metabolism. It behaves as an endocrine organ by producing and secreting several antimicrobial peptides (reviewed by Lemaitre and Hoffmann, 2007). The fat body coordinates systemic growth by controlling insulinlike peptide (ILP) secretion from the medial neurosecretory cells (mnscs) upon a dietary stimulus of amino acids (Geminard et al., 2009). This occurs via a cationic amino acid transporter slimfast (slif) which mediates nutrient sensing by the fat body. Slimfast amino acid sensing in conjunction with Target of Rapamycin (TOR) signaling activate a fat body-derived signal that acts directly on the CNS to promote insulin secretion (Sousa- Nunes et al.,2011). Therefore, it is an important organ involved in integrating organism s response to various internal and external signals. 1.4 Insulin and Target of Rapamycin (TOR) signaling Insulin and TOR pathways are both closely associated signaling cascades involved in metabolism and growth of an organism. There are seven dilps that act on a single cell surface insulin receptor (InR) in Drosophila. The Drosophila InR is structurally and functionally homologous to mammalian InR/IGFR (reviewed by Oldham and Hafen, 2003). Sequence similarity between the fly and mammalian counterparts of the insulin 14
15 signaling pathway (i.e, insulin receptor and insulin receptor substrate) suggests that insulin system has multiple conserved roles (reviewed by Garofalo, 2002; Oldham and Hafen, 2003; Ullrich and Schlessinger, 1990). Ligand binding to Inr triggers an intracellular signalling cascade via the activation of phosphoinositide-3-oh kinases (PI3K) (Figure 1: Oldham and Hafen, 2003; reviewed by Grewal, 2009). Upon activation, PI3K phosphorylates inositol lipids to generate second messengers in the membrane. For example phosphatidylinositol-4,5-p 2 (PIP2) is phosphorylated to produce phosphatidylinositol-3,4,5-p 3 (PIP3) (reviewed by Rameh and Cantley, 1999). Phosphoinositide interacting domains referred to as the pleckstrin homology (PH) domains found in the cytoplasmic protein kinases such as the Drosophila homologue of Akt (also referred as protein kinase B, or PKB) and phosphoinositide-dependent protein kinase (PDK) are recruited to the plasma membrane via interaction with PIP 3 (Alessi et al.,1997; Gray et al., 1999). Recruitment to the plasma membrane and phosphorylation activates AKT (reviewed by Oldham and Hafen, 2003). Drosophila AKT has been identified as a cell- autonomous regulator of cell and organ size (Verdu et al., 1999). Activity of PI3K can be assayed using pleckstrin homology domain-green fluorescent protein (PH-GFP) fusion. PH-GFP is recruited to the cell membrane when PI3K activity is high and this localization can be visualized. Insulin/PI3K signaling in Drosophila is essential for coupling cellular metabolism with nutritional conditions (Britton et al., 2002). Cross talk exists between the insulin signalling components and the components 15
16 of Target of Rapamycin pathway (TOR) in controlling growth, ageing and autophagy (reviewed by Grewal 2009). The TOR signaling pathway does not appear to function as a conventional linear signaling system (Raught et al., 2001). Rather both TOR and PI3K signaling are required for the activation or inactivation of downstream TOR proteins (Raught et al., 2001). Activation of AKT via insulin signaling is responsible for indirectly activating TOR signaling via S6K activation. S6K is a Serine/Threonine kinase involved in the translation of ribosomal proteins and translation factors (Reviewed by Oldham and Hafen, 2003). Additionally, AKT is also involved in inhibiting tumour suppressor genes (TSC1 and TSC2) and therefore positively signaling TOR pathway (Reviewed by Oldham and Hafen, 2003). TSC inhibits the regulatory kinase target of rapamycin (TOR) activity. In Drosophila, downstream effectors of TOR include a single initiation factor-4e-binding protein (4E-BP) homolog, THOR/d4E-BP, an inhibitor of the eukaryotic initiation factor 4E (eif-4e). Together, the TOR/S6K signalling serves as an important regulator for cell and the overall growth in Drosophila (Oldham and Hafen, 2003). TOR signaling cascade is also important for the regulation of autophagy. Autophagy is a process of cytoplasmic degradation that occurs in response to starvation to generate an internal source of nutrients (Scott et al., 2004). Under nutrient rich conditions, Ins/PI3K activity stimulates the TOR complex 1 which results in the activation of the downstream effectors of TOR and hence inhibits autophagy. Together, TOR and 16
17 Insulin signalling contribute in regulating key biological processes such as growth and autophagy. 1.5 Remote control of insulin secretion by the fat body Recent studies have focused on the TOR dependent secretion of FDS for insulin secretion. Intercommunication between the fat body and DILP secretion via an unknown fat- body-derived signal (FDS) has been the central focus of questions concerning regulation of growth and neuroblast proliferation. Neuroblasts undergo a period of quiescence during the embryonic stages of development re-entering cell cycle postembryonically. FDS has been shown to act directly on the CNS to allow neuroblast reactivation (Britton and Edgar, 1998). In Drosophila, the CNS contains two functionally segregated ILP pools, one that regulates proliferation of neural stem cells and the other that secrete insulin like peptides into the circulating hemolymph to promote systemic growth (Ikeya et al., 2002; Colombani et al., 2003, Sousa-Nunes et al., 2011). ILPs secreted from the mnscs are involved in regulating systemic growth of the organism whereas ILPs, specifically dilp6, secreted from glial cells play a localized function in promoting neuroblast proliferation (Sousa-Nunes et al., 2011). IPCs along with adipokinetic hormone (AKH) producing cells (located in the ring gland) in the Drosophila brain are akin to α and β cells of the pancreas, respectively (Geminard et al., 2009). The IPCs express 4 of the 7 Drosophila insulin-like peptides (dilp 1, 2, 3 and 5). dilps are expressed in a specific spatial, temporal pattern throughout development (Brogiolo et al., 2001). Expression of insulin like peptide 6 in the glial cells has been identified to 17
18 result in precocious reactivation of neuroblast under fed conditions. Consistent with this, the TOR/PI3K signaling in the glial cells was found to be sufficient for neuroblast reactivation (Sousa-Nunes et al., 2011). Many studies have highlighted potential roles for hormones such as ALS, Imp-L2, NLaz, or Upd2 in the regulation of organismal growth (review by Hyun, 2013). Although mechanisms important for communication between fat body and CNS are not fully understood. Many important studies have unraveled the complex and integrative physiological network involved in regulating systemic growth and neuroblast cell-cycle re-entry. 1.6 Thesis objectives The objective of my research project was to understand the role of RanBPM in the fat body for non-autonomous regulation of the starvation induced food intake, size, neuroblast proliferation and dilp accumulation (Figure 2). I have addressed this by asking the following questions: Can all RanBPM mutant phenotypes be rescued by expressing RanBPM in the fat body? If so, can all RanBPM mutant phenotypes be rescued by targeted overexpression of Ins/TOR components (eg. AKT, S6K, InR, TOR) in the fat body of RanBPM mutant larvae? Additionally, is autophagy (TOR dependent process) affected in the RanBPM null mutants? I expected to detect mis-regulation of autophagy in RanBPM mutants based on the observation of impaired systemic insulin signaling. 18
19 Chapter 2: Materials and Methods 19
20 Materials and Methods 2.1 Drosophila strains and culture Synchronized early third instar foraging larvae of either sex were obtained as previously described [40] and grown at 29 o C to maximize GAL4 activity, in light /dark cycle. Standard genetic crosses were used to construct stocks that allowed for the targeted the expression of transgenes (UAS constructs) under the control of GAL4 drivers in a homozygous RanBPM mutant background. The RanBPM K05201 allele was kept over a CyO (y+) balancer in a yw background for the identification of homozygous mutants by the mouth hook phenotype. Third chromosome constructs (GAL4 drivers or UAS constructs) were mostly kept over a TM6, Tubby (Tb), Stubbled (Sb) balancer chromosome. The target genes used were: UAS-DILP2 kindly provided by Ernst Hafen, UAS-RanBPM (short isoform) stock kindly provided by Paul Lasko, UAS-DILP6 kindly provided by Michael O Connor, w[1118]; P{w[+mC]=UAS-GFP.nls}8 (Bloomington stock center (BSC# 4776), P{w[+mC]=UAS-Akt1.Exel}1, y[1] w[1118] (BSC# 8192), y[1] w[1118]; P{w[+mC]=UAS- InR.A1325D}2(BSC# 8263), y[1] w[1118]; P{w[+mC]=UAS-InR.K1409A}3 (BSC# 8253), w[1118]; P{w[+mC]=UAS-S6k.STDE}3 (BSC#6913), y[1] w[*] P{ry[+t7.2]=hsFLP}1; P{w[+mC]=UAS-Tor.WT}3 (BSC# 7012). The GAL4 drivers used were: Lsp2-Gal4 expressed in the larval fat body beginning in the early third instar, (Yang and Berggren, 2006 ; Moncalvo and Campos, 2009) (BSC#6357), C929-GAL4 reflecting the expression of the transcription factor Dimmed required for the NS cell fate (BSC# 25373) (Grewal, 2009; Teleman, 2010), DILP2-GAL4 kindly provided by Ernst Hafen (Sousa-Nunes et al., 2011) 20
21 and repo-gal4 expressed in all glia throughout embryonic and post embryonic development (BSC# 7415) (Lazareva et al., 2007; Sepp et al., 2001). 2.2 Feeding behaviour assay The assay was as described previously (Awasaki and Ito, 2004) for adult flies with some modifications. Batches of newly hatched larvae (0-60 min) were transferred to regular food plates (30 X 13 mm Fisher) and kept at 29 o C for hours. Sixty larvae were recovered from the food plate, washed and transferred onto a damp 3M filter paper placed in a Petri dish (humid chamber) and starved for 2.5 hours. Larvae were then transferred to a drop of freshly prepared yeast paste (5 g in 15 ml) containing 3.3% FD&C Blue No.1 [McCormick] and left for 1.5 hours. Control constituted matched larvae (age and genotype) fed in yeast with no dye. At the end of this period larvae were washed, homogenized and centrifuged twice (15 min X G). The supernatants were transferred to cuvettes and the absorbance was measured at 625 nm using as a blank extracts from control larvae. All larval cultures were kept at 29 o C, which is the optimum temperature for the yeast GAL4. For all genotypes a minimum of three independent assays with 60 larvae each were conducted. 2.3 Statistical Analyses All statistical tests were conducted using the MINITAB Student software package (student release version ). The statistical tests included one-way analysis of 21
22 variance (ANOVAs) and Tukey s pairwise comparisons. Normality tests on the residuals of the ANOVAs were conducted using the Shapiro-Wilk test. The level of significance in all tests was All measurements are shown as mean values and SEM and * indicates samples that are significantly different from control genotypes. 2.4 Immunohistochemistry and Imaging CNS dissected from early foraging third instar larvae staged as above were treated as described (Iijima et al., 2009). Primary antibodies used were rabbit anti-phosphorylated Histone3 (Upstate Biotechnologies 1:500), and anti-dilp2 kindly provided by Ernst Hafen (1:200). The secondary antibody used was a Alexa 488-conjugated goat anti-rabbit IgG (1:200). In the case of DILP2 immunolabelling mutant and wild type specimens were incubated in the same tube to avoid variability in antibody concentration. The genotype of the specimens was distinguished by the presence or absence of the yellow (y) marker in the mouth hooks and by the size of the dissected brain. All RanBPM mutant brains were smaller than age-matched controls. In order to estimate the relative amount of DILP2 present in the brain IPCs confocal Z stacks at 1 µm steps were obtained using identical laser power and scan settings adjusted to below saturation using the wild type samples. ImageJ software was used to measure fluorescent intensity of the cell bodies as described in (Arrese and Soulages, 2010). We used a Leica Confocal microscope SP5II. Brightness and contrast were adjusted using Adobe Photoshop. 22
23 2.5 Western blotting analysis Protein lysates were prepared typically from rd instar foraging larvae synchronized as described above, homogenized by douncing in SDS sample buffer and a cocktail of protease and phosphatase inhibitors (Fisher Scientific #PI78441). Western blotting analysis was performed as described before (Hassan et al., 2005), using commercially available antibodies for AKT (Cell Signaling #4691), Drosophila phospho- Ser505 AKT (Cell Signalling, #4054) and actin (Millipore #MAB1501R) at a 1 to 1000 dilution according to the manufacturer s protocol. 2.6 Lysotracker staining and imaging of fat body Synchronized late third instar larvae were first removed from food culture and transferred by forceps to small dishes containing 3M filter paper saturated with water for 4.5 hours to induce starvation. Alternatively, the larvae removed from the food culture were dissected to extract the fat body for subsequent staining process. LysoTracker Red DND-99 (Molecular Probes) was diluted in PBS to obtain a 50 µm solution for staining. Dissected fat body samples were incubated in 50 µm LysoTracker Red DND-99 solution for 2 minutes and then mounted on a microscope slide in 1Xs PBS solution, and covered with a coverslip for imaging. Samples were quickly examined using confocal microscopy. 23
24 2.7 Data organization for figures Figures 3 to 16 were labeled using Photoshop software. Raw data used to create graphs was first analyzed using Minitab software and then plotted using CricketGraph (graphic software for the Apple Macintosh). Graphs were labelled using Photoshop software. 24
25 Chapter 3: Results 25
26 Results 3.1 Targeted expression of RanBPM in neurosecretory cells rescues the disruption in feeding behaviour, reduced growth and lethality of RanBPM mutants In an attempt to identify the cells in which RanBPM plays a role we screened for promoters (GAL4 drivers) capable of rescuing RanBPM phenotypes when regulating the expression of RanBPM cdnas in a mutant background. We found that the C929-GAL driver reflecting the expression of the dimmed (dimm) gene, is capable to rescue all phenotypes as seen by the rescue of larval lethality and the eclosion of 83% of the expected homozygous mutant progeny (N=607). The eclosed flies were of normal size and morphology (Additional file 1). Consistent with these observations we found that the feeding behaviour phenotype was similarly restored (Figure 3). Amongst the C929- positive cells are the insulin producing cells located pars intercerebralis of the brain and the corpora cardiaca located in the ring gland expressing the adipokinetic hormone (AKH), the Drosophila Glucagon and the fat body, the Drosophila equivalent of the vertebrate liver and white adipose tissue (Park and Tagert, 2009; Park et al., 2008; reviewed by Arrese and Soulages, 2010). 26
27 3.2 RanBPM gene function is required for proper insulin gene expression and secretion Amongst the best-studied DIMM positive cells are the insulin producing cells located in the pars intercerebralis region of the brain lobes which together with the AKH producing cells of the ring gland constitute a primitive Drosophila bipartite pancreas. Therefore we sought to determine whether these cells were affected by RanBPM mutations. To that end, we used the targeted expression of Green Fluorescent Protein (GFP; UAS-GFP:LacZ.nls) under the regulation of the C929-GAL4 driver to visualize the C929 positive neurosecretory cells in RanBPM mutants and in wild type control specimens. At gross level, the overall distribution and number of C929 positive clusters were not disrupted by RanBPM mutations in spite of the reduced size of the RanBPM mutant brain (Additional file 2). We focused on the subset of C929 cells located in the pars intercerebralis, the medial neurosecretory cells (mnsc) cluster. It consists of circa 15 cells and includes the 7 insulin producing cells (Figure 5A) (Park and Tagert, 2008). The position and arrangement of this cluster in RanBPM mutant brains differed little from that found in wild type control specimens (Figure 5B). The number of cells in this subset was significantly smaller in RanBPM mutant samples (Additional file 3). In contrast, the number and arrangement of the AKH producing cells visualized by the expression of GFP under the regulation of AKH-GAL4 driver were not affected by RanBPM mutations (Figure 5C and D and Additional file 3). 27
28 The larval insulin producing cells express three (DILP 2, 3 and 5) of the 7 DILPs genes found in the Drosophila genome (Ikeya et al., 2002). Of these, DILP2 is the most abundantly expressed, estimated to comprise 80% of DILP gene expression in these cells (Buch et al., 2008). DILP2 is the first to be expressed during larval development from the first instar on and, in contrast to DILP3 and 5, the level of DILP2 RNA is not regulated by nutrient availability (Ikeya et al., 2002). In order to evaluate the requirement for RanBPM gene function for the expression of the DILP2 gene we introduced DILP2 reporter constructs (DILP2-GAL4; UAS-GFP) in RanBPM mutant larvae. We found that in foraging third instar larvae homozygous for a null mutation in the RanBPM gene, expression of DILP2-GAL4 could not be detected at the level of resolution afforded by confocal microscopy (Figure 5E and F) suggesting that at that stage in larval development the transcription of DILP2 gene requires RanBPM gene function. Starvation causes the increased accumulation DILP 2 and 5 peptides in the brain insulin producing cells to levels above that of fed larvae suggesting an inhibition of secretion (Geminard et al., 2009). Therefore, we asked whether the level of DILP2 in the insulin producing cells of the third instar larva is affected by mutations in the RanBPM gene. To that end we used a polyclonal antibody against DILP2 (kindly provided by Ernst Hafen) to immunolabel dissected CNS from wild type and RanBPM mutant foraging third instar larvae. In order to obtain confocal images that would allow us to make a semiquantitative comparison, we used wild type specimens to establish laser and scan settings below saturation to be used in all mutant specimens. Representative 28
29 photomicrographs of brains imaged in this manner and a graph depicting the relative fluorescence intensity are shown in Figure 5A and B respectively. We found that in third instar RanBPM mutant larvae in spite of the marked reduction in the expression of the DILP2-GAL4 reporter the insulin producing cells showed a 2,5 fold higher level of DILP2 peptide than that of wild type samples (Figure 5B). The number of DILP2 positive cells however did not appear to be affected in RanBPM mutants. In contrast, in the second instar larva the level of DILP2 measured as described above is comparable to that of wild type control specimens (Additional file 4). Taken together these observations demonstrate that RanBPM gene function is required for proper expression of the DILP2 gene at the level of transcription in the third instar larva inferred from the lack of expression of the DILP2-GAL4 reporter. Our results suggest that concomitant to the reduced expression of the DILP2 gene, the steady state level DILP2 peptide insulin producing cells is above the level found in wild type specimens suggesting that secretion is inhibited. Whether the apparent reduction in DILP2 secretion is a direct effect of lack of RanBPM function or an indirect consequence of starvation was not addressed by these experiments. 29
30 3.3 RanBPM mutants display reduced peripheral insulin signalling The results described above indicate that in RanBPM mutants the level of circulating insulin is reduced and that may be the cause of the reduced growth and feeding of the third instar larva. In order to test this hypothesis we analysed the phosphorylation status of dakt one of the major kinases activated upon InS. Immunoblots of phospho-akt (pakt), total AKT using whole larval extracts indicated that while the steady state level of total AKT was not affected in RanBPM mutants the level of pakt is markedly reduced in these larvae (Figure 5C and Additional file 5). To further confirm the impact of RanBPM mutation on InS we used a GFPpleckstrin homology domain (PH) fusion regulated by the Tubulin promoter (TGPH) construct as a reporter for InR/PI3K activity (Britton et al., 2002). The GPH fusion protein accumulates in the plasma membrane of various cell types when InR/PI3K signalling is activated (Britton et al., 2002). Consistent with the previous observation of an overall reduction in dakt activation, we found that in the salivary glands and fat body cells of RanBPM mutants GPH is found predominantly in the cytoplasm, in marked contrast to matched wild type control samples in which GPH labelling accumulates at the plasma membrane (Figure 5D). Taken together these observations support the notion that RanBPM function is required in the foraging third instar larva for systemic InS. 30
31 3.4 Forced expression of DILPs suppresses the feeding, size and CNS proliferation phenotypes of RanBPM mutants The results presented above suggest that the RanBPM phenotypes are due to impaired InS likely due to reduced DILP2 expression and secretion. In order to further test this hypothesis we asked whether any of the RanBPM phenotypes can be modified by over expression of DILP2 achieved through the GAL4/UAS system. To that end, we used various GAL4 drivers to activate the expression of the UAS-DILP2 transgene in a RanBPM mutant background. We chose a strong ubiquitous driver, tub-gal4 and c929- GAL4 expressed in the NS cells that include the insulin producing cells and the fat body. Recent reports established that forced expression of DILP2 or DILP6 under the regulation of repo-gal4 is sufficient to by pass the nutritional requirement for neuroblast re-entry into the cell cycle during larval development (Sousa-Nunes et al., 2011; Chell and Brand, 2010). RanBPM mutants display a marked reduction in CNS proliferation as seen by reduced immunolabelling of a phospho specific isoform of Histone 3 (phospho H3) however RanBPM expression was not detected in these cells suggesting that this is a non-autonomous phenotype (Scantelbury et al., 2010). Therefore we also used repo-gal to up-regulate DILP2 and DILP6 in the glia of RanBPM mutant larvae in order to establish whether in these mutants reduction of glia-derived insulin is the cause of the observed reduced proliferation in the CNS. 31
32 Null mutations in the RanBPM gene are strict late larval lethals (Scantelbury et al., 2010). Over expression of DILP2 under the regulation of any of the GAL4 drivers employed or DILP6 under the regulation of repo-gal4 was not sufficient to rescue the lethality of RanBPM mutants, as adults were never recovered in various experiments. However, ubiquitous over expression of DILP2 under the regulation of tub-gal4 allowed for 64% (N=160) of RanBPM mutant larvae to reach the pupal stage. We found that in RanBPM mutant larvae over expressing DILP2 dye accumulation in the gut was significantly higher than in mutant controls (Figure 6A). These larvae were in general bigger than the sibling mutant controls (Figure 6B). In contrast, forced expression of DILP2 or DILP6 under the control of the pan glial driver repo-gal4 did not increase the level of dye in the gut or the size of RanBPM mutants (Figure 6A and data not shown). Ubiquitous over expression of DILP2 in a wild type back ground did not significantly change dye accumulation suggesting that the increase observed in mutants overexpressing DILP2 under the regulation of the same promoter (tub-gal4) is due to the restoration of reduced level of systemic insulin. The reduced size and CNS proliferation phenotype of RanBPM mutants was also suppressed by the ubiquitous overexpression of DILP2 under the control of the tub-gal4 element (Figure 6C). In the RanBPM mutants the eye-antennal imaginal disc is rarely visible (Figure 6C). Over expression of DILP2 was sufficient to rescue the eye disc growth deficiency (arrowhead in Figure 6C). Expression of DILP6 under the control of repo-gal4 32
33 was sufficient to bypass the reduced CNS proliferation characteristic of RanBPM mutants but not the reduced size of the eye imaginal disc (Figure 6C), suggesting that lack of RanBPM gene function disrupt the glial derived insulin regulation of CNS proliferation. Combined these results demonstrate that InS is impaired by lack of RanBPM function and suggest that this is at least in part due to the reduced level of systemic DILP2. Moreover our observations support the hypothesis that RanBPM function contributes to the role of glia as the source of insulin required for the reactivation of quiescent neuroblasts. The results presented here do not exclude the possibility that reduced function of the other DILPs expressed by the insulin producing cells and elsewhere in the larva may be also impaired by the RanBPM mutation. 3.5 Targeted expression of RanBPM in the fat body partially rescues most of the RanBPM mutant phenotypes The fat body has emerged as a crucial organ in the coordination of growth with nutrient availability in Drosophila [e.g. (Colombani et al., 2003); see commentary in [ Rajan and Perrimon, 2011)]. Recent reports elegantly demonstrate that fat body-derived factors regulate glial DILP6 and DILP2 expression required for the reactivation of the neural stem cells in the Drosophila larval brain (Chell and Brand, 2010; Sousa Nunes et al., 2011). Similarly, DILP secretion by the brain insulin producing cells is regulated remotely by the fat body (Geminard et al., 2009). These observations together with the 33
34 finding that expression of c929-gal4 element is found in the fat body (Park et al., 2008) prompted us to ask whether targeted expression of RanBPM in this organ is sufficient to rescue any of the RanBPM mutant phenotypes. To that end we took advantage of two fat body GAL4 drivers with different onsets of expression in this organ. Pumpless (ppl)- GAL4 is expressed in the fat body throughout larval development with the expression of ppl decreasing near the end of third instar (Zinke et al., 1999). Reports have established that expression of ppl occurs in a mosaic pattern (Bi et al., 2012). While Larval serum protein 2(Lsp2)-GAL4 driver has been reported in studies to be active during the third larval stage (Reiling and Hafen, 2004; Aguila et al., 2007). Indeed, we found that the feeding behaviour and growth deficits of RanBPM mutant larvae in which expression of this gene was restored to the fat body using either one of the GAL4 drivers, were partially rescued (Figure 7 A and B and Additional file 6). These observations were confirmed by RNAi knock down of RanBPM restricted to the fat body using both GAL4 drivers significantly reduced dye accumulation in the gut and disrupted larval growth (Additional file 7). The reduced CNS proliferation phenotype is similarly suppressed by targeted expression using either GAL4 driver (Figure 7E). Finally, we did not detect the characteristic increased accumulation of DILP2 immunofluorescence in the insulin producing cells in RanBPM mutant larvae in which expression of this gene was restored to the fat body (Figure 7C). Similar results were obtained when ppl-gal4 was used to drive the expression of RanBPM cdna (Figure 7D). 34
35 This indicates that expression of RanBPM regulates insulin accumulation in the brain non-autonomously. Taken together these results support the notion that RanBPM gene function contributes to the regulated expression and secretion of DILP2 from the insulin producing cells in the brain and that this is carried out at least in part through its function in the fat body. Moreover RanBPM function in the fat body contributes to the remote regulation of CNS proliferation and feeding behaviour either directly or indirectly through regulation of insulin. 3.6 Overexpression of AKT in the fat body partially rescues RanBPM mutant phenotypes Previous observations showed an increased level of DILP2 peptide in the IPCs of the RanBPM mutants compared to wild type control specimens suggesting that secretion was inhibited (Figure 7A). Indeed a general reduction of the phosphorylated AKT and the membrane localization of tgph reporter were detected in the fat body and salivary gland of RanBPM mutants (Figure 7D). These observations suggest that circulating insulin is reduced in RanBPM mutants. Therefore we asked whether overexpression of DILP using various GAL4 drivers was sufficient to suppress RanBPM mutant phenotypes. Ubiquitous expression of DILP2 using tub-gal4 driver suppressed feeding, size and CNS proliferation phenotypes of RanBPM mutants (Figure 6). As 35
36 discussed earlier, the fat body in Drosophila has emerged as an important organ involved in coupling growth with nutrient availability. The fat body has been proposed as a regulator of DILP secretion from the IPCs (Geminard et al., 2009; Colombani et al., 2003). In conjunction to these reports, our investigations demonstrated that targeted expression of RanBPM gene exclusively in this organ was sufficient to restore the food intake, growth deficit, neuroblast proliferation and dilp accumulation phenotypes of the RanBPM mutants (Figure 7). Taken together these observations suggest that RanBPM phenotypes are the result of impaired InS likely due to the requirement of RanBPM in the fat body for the regulation of DILP2 expression and secretion from the IPCs. Inhibition of TOR signaling in the fat body and dietary restriction leads to DILP2 retention in the IPCs of the larval brain (Geminard et al., 2009). This demonstrates the requirement of a TOR dependent mechanism in the fat body for the fat body derived humoral factor in regulating insulin secretion from the IPCs. TOR kinase can be activated either directly via nutritional input or by AKT activation. Therefore, we investigated a role for AKT within the fat body of RanBPM mutants for the remote control of DILP secretion. To that end we asked whether up-regulation of AKT targeted to the fat body using Lsp2-GAL4 or ppl-gal4 drivers has an impact on various RanBPM phenotypes. I found that the targeted overexpression of AKT using Lsp2-GAL4 driver partially restored some of the RanBPM mutant phenotypes (Figure 8). Overexpression of AKT using Lsp2-GAL4 in RanBPM mutant larvae showed a significant increase of dye accumulation in the gut compared to the parental controls (RanBPM K05201 ; Lsp2-GAL4/+ 36
37 and UAS-AKT;RanBPM K05201 ) (Figure 8A). However the level of dye in the gut was not as high as the level of accumulation detected in the WT control larvae. Previous observations showed that RanBPM mutant larvae that expressed RanBPM gene in the fat body under the control of Lsp2-GAL4 was sufficient to significantly increase the level of dye in the gut compared to parental controls and that is indistinguishable from the WT control(figure 7A). When ppl-gal4 driver was used to express the RanBPM cdna in RanBPM mutant larvae the level of absorbance at 625nm was indistinguishable from the WT control despite the finding that the mean absorbance was lower compared to the mean absorbance achieved under the regulation of Lsp2-GAL4 (Figure 7A). However, when ppl-gal4 was used to drive the expression of AKT in the RanBPM mutants the level of dye in the gut was not statistically different from the parental controls (Figure 8E). Reports have established that expression of ppl decreases near the end of third instar (Zinke et al., 1999) and that expression of ppl-gal4 occurs in a mosaic pattern (Bi et al., 2012). In contrast to this, Lsp2-GAL4 driver has been reported in studies to be active during the third larval stage (Reiling and Hafen, 2004). Together, with the finding that overexpression of AKT under the control of ppl-gal4 did not rescue the feeding phenotype in the RanBPM mutants suggests that expression of AKT did not reach the required threshold to restore the feeding behaviour. The size of the larvae expressing AKT under the regulation of Lsp2-GAL4 appeared bigger compared to RanBPM mutants (Figure 8B). Most of these larvae appeared similar in size to their parental control (RanBPM K05201 ; Lsp2-GAL4/+) suggesting that the overall growth of the larvae expressing 37
38 AKT under the regulation of Lsp2-GAL4 was partially rescued. In contrast, the larvae expressing AKT under the control of ppl-gal4 did not appear bigger in size compared to the RanBPM mutants (data not shown). DILP2 immunolabeling of RanBPM mutant larval CNS expressing AKT under the control of Lsp2-GAL4 was done to determine whether increased level of dilp2 in the IPCs was ameliorated. Indeed, targeted expression of AKT in the fat body resulted in a lower level of DILP2 in the IPCs compared to RanBPM mutant control (Figure 8C and 8D). However, the level of DILP2 detected in these larval IPCs was still significantly higher than the WT control larvae. Whereas, previous observations of DILP2 immunolabeling showed that the RanBPM mutant larvae which expressed RanBPM gene under the regulation of Lsp2-GAL4 resulted in level of DIL2 accumulation that was indistinguishable from the WT control larvae (Figure 7C and 7D). AKT overexpression using either Lsp2- GAL4 or ppl-gal4 appeared to increase the number of phospho-h3 labelled cells in the brain lobes and the ventral nerve cord of RanBPM mutants (Figure 8E). The increase in the phospho-h3 labeling detected in the CNS here does not appear to be different between the two promoters used. The overall pattern of the phsopho-h3 labeling in these RanBPM mutant larvae expressing AKT under the regulation of Lsp2-GAL4 or ppl- GAL4 was similar compared to the WT control. However, in these RanBPM mutant larvae expression of AKT under the regulation of Lsp2-GAL4 or ppl-gal4 did not cause a change in the size of the CNS as compared to the RanBPM mutant control. These observations show that although the pattern of phsopho-h3 labeling was partially 38
39 rescued the CNS size of these larvae remained smaller compared to the WT control. In previous experiments when Lsp2-GAL4 or ppl-gal4 was used to drive the expression of RanBPM, these constructs were sufficient to rescue most of the RanBPM mutant phenotypes (Figure 7). However in RanBPM mutants when AKT is overexpressed under the regulation of Lsp2-GAL4, the CNS proliferation, DILP accumulation and the feeding are partially restored to the WT conditions (Figure 8). Whereas, when AKT is overexpressed under the regulation of ppl-gal4 the feeding (Figure 8A) and the larval size phenotypes (data not shown) of the RanBPM mutants were not rescued. This suggests that AKT might not be providing expression close to the threshold to induce a change in the feeding and the size phenotypes of the RanBPM mutants. The results presented above indicate that targeted expression of AKT in the fat body can partially rescue food intake, size, CNS proliferation and insulin secretion phenotypes of RanBPM mutants. Based on these results, we wanted to investigate whether components of insulin signaling pathway that are upstream of AKT such as InR can also modify any of the RanBPM mutant phenotypes. To investigate this, I used a constitutively active construct of insulin receptor (UAS-InR (CA)) under the regulation of the Lsp2-GAL4. I found that expression of this construct in RanBPM mutants did not rescue the feeding phenotype (Figure 8A) or the phospho-h3 labeling of the CNS (compare Figure 10B to 10C). Since previous observations showed that targeted expression of AKT under the regulation of Lsp2-GAL4 and ppl-gal4 had an impact on various RanBPM mutant 39
40 phenotypes, I also expressed myristoylated AKT in the fat body using the same promoters. The feeding phenotype was not rescued when AKT (myr) was expressed under the regulation of Lsp2-GAL4 or ppl-gal4 (Figure 9A). The size phenotype was not rescued in RanBPM mutants expressing AKT (myr) under the control of the ppl-gal4 (Figure 9B). Myristoylation targets the protein to the membrane rendering it unable to interact with cytosolic and nuclear proteins thus impairing its mediation of insulin receptor activation. 3.7 Up-regulation of Target of Rapamycin (TOR) or S6K in the fat body of RanBPM mutants partially rescues the CNS proliferation phenotype of RanBPM mutants Studies carried out in Drosophila indicate that TOR signaling is the major pathway in the fat cells that relays the nutritional signal to brain IPCs via the secretion of yet unidentified fat body derived factor (Geminard et al., 2009; Colombani et al., 2003). To study the role of TOR signaling in the fat body of RanBPM mutants, I up-regulated the expression of wild type TOR gene (UAS-TOR) and of a constitutive active form of the S6K (UAS-S6K (CA)) under the control of Lsp2-GAL4 and ppl-gal4 drivers. Up regulation of TOR using Lsp2-GAL4 in the RanBPM mutants showed an increase in the phospho-h3 labeling of the CNS for most of the samples visualized (Figure 11C). However, rest of the samples did not shown an increase in the phospho-h3 labeling of the CNS when TOR was up- regulated under the control of Lsp2-GAL4 in RanBPM mutants (Figure 11D). These observations suggest that CNS proliferation phenotype was only partially rescued. TOR 40
41 up-regulation in the fat body did not appear to cause an increase in the size of the CNS compared to RanBPM mutants (compare Figure 11B to 11C and 11D). Overexpression of TOR under the control of ppl-gal4 driver was not performed due to time constraints. S6K overexpression under the regulation of Lsp2-GAL4 and ppl-gal4 drivers increased the phospho-h3 labelling in the thoracic ventral cord region of the CNS (Figure 12). The overall pattern of the phsopho-h3 labelling in the RanBPM mutants expressing S6K under the control of Lsp2-GAL4 or ppl-gal4 appeared similar to the phsopho-h3 labeling of the WT CNS (compare Figure 12A to12c and 12D). Indeed the CNS size of these larvae appears bigger than the RanBPM mutant control however the size is not comparable to the CNS of the WT control. Taken together these observations suggest that the CNS proliferation and the CNS size phenotypes of third instar RanBPM mutant larvae was only partially rescued when S6K was overexpressed in the fat body (Figure 12). The overall size of the RanBPM larvae overexpressing S6K under the control of Lsp2-GAL4 was bigger in comparison to RanBPM mutants suggesting that size phenotype was partially rescued (Figure 12E). 3.8 Autophagy in RanBPM mutants Autophagy, a cellular response to starvation, is an evolutionarily conserved mechanism of bulk degradation to match the supply of nutrients with the cell s demand for energy. Scott et al, have shown that autophagy is rapidly induced in the fat body of Drosophila larvae in response to nutrient withdrawal by examining the autolysosomal 41
42 content of the fat body cells. Fluorescent dyes such as Lyso Tracker Red or transmission electron microscopy can be used to observe autolysosomal structures in the fat body(add a reference here). Autophagy is regulated by the nutrient sensing pathway, TOR (reviewed by Grewal, 2009). TOR inactivation is known to trigger autophagy despite nutrient availability in rat hepatocytes (Blommaart et al., 1995). Studies in vertebrates have also shown that starvation-induced autophagy can be suppressed by activating InR, PI3K and Akt (Petiot et al.,2000). Previous observations indicated that RanBPM phenotypes are a result of impaired insulin signaling. Consequently, restoring RanBPM gene function in the fat body suppressed RanBPM mutant phenotypes. As discussed earlier, TOR signalling plays an important role in the fat body in the control of the autophagic machinery. To determine whether autophagy is mis-regulated in RanBPM mutants, I used Lyso Tracker Red to label autophagosomal structures in the fat body of fed and starved larvae. Consistent with the literature, I found increased punctate staining in the fat body of the starved wild type (yw) larvae in comparison to fed conditions (Figure 14 A and C). I compared the level of autophagy in the RanBPM mutant fat body under starved and fed conditions. In the RanBPM mutants, lysosomes were only detected in starved conditions (Figure 14). This suggests that in RanBPM mutants, starvation triggers autophagy (Figure 14). Starvation causes a reduction in fat body cell size (Butterworth et al., 1965) and stimulates lipid mobilization which results in lipid droplet aggregation (Britton et al., 42
43 2002; Zhang et al., 2000). Lipid droplet aggregation was estimated by measuring the diameter of the unstained lipid droplets in the fat body cells. In both the WT control and the RanBPM mutants, 4.5 hours of starvation showed an increase in the diameter of the lipid droplet size (Figure 15A and 15B). The increase in the size of the lipid droplets is likely due to the result of lipid droplet aggregation. Similar to fed conditions, the lipid droplet size after starvation was smaller in RanBPM mutants compared to the wild type control. Lysotracker staining of the RanBPM mutants suggests that perhaps the cellular machinery involved in activating autophagy (ie. TOR and ATG-1) is not disrupted by RanBPM mutation. 3.9 Up-regulation of insulin signalling in the fat body Past studies have shown that overexpressing insulin receptor under the regulation of ADH-GAL4 induces larval wandering away from food (Britton et al., 2002). ADH-GAL4 is known to be expressed in the fat body, trachea, and few cells of the gut. This prompted use to ask whether up-regulation of insulin signaling in the fat body is sufficient to inhibit the starvation dependent food intake observed in third instar foraging larvae. This was achieved by driving the expression of insulin signaling components using fat body specific Lsp2-GAL4 driver. The insulin signaling components that were used included Akt (myr), S6k (CA), wild type Akt, InR(DN) and InR(CA). Feeding assays (described in the methods section below) were conducted using Drosophila late third instar larvae of the various genotypes to determine the starvation dependent food 43
44 intake response. Overexpression of the insulin signaling components using Lsp2-GAL4 did not inhibit the starvation dependent food intake (Figure 12). This can be explained by considering that perhaps the expression was not sufficient enough to reach a required threshold to induce a response in feeding. 44
45 Chapter 4: Discussion 45
46 Discussion There has been a renewed interest in research surrounding regulation of growth and size via inter-organ communication. Research in the field of metabolic regulation has been of interest in the recent years because of the growing world-wide epidemic of type 2 diabetes and obesity. Insulin and TOR signaling network pathways play a central role in regulating metabolism. Here, I report studying the role of these pathways in the regulation of growth and behavior in the model organism, Drosophila. Over the past decade, Drosophila has become an important model system to study Ins/TOR signaling mechanisms because genetic tools available in Drosophila allow researchers to conduct loss-of-function and genetic interaction experiments to gain a better understanding of genetic relationships (reviewed by Teleman, 2010). Additionally, conservation of genes and signaling pathways between mammals and Drosophila makes the latter an important model system for studying InS/ TOR signaling. Drosophila progresses through three critical developmental stages throughout its life cycle. Beginning as a developing embryo, Drosophila hatches as a larva which develops through three instar stages and undergoes metamorphosis before emerging as an adult fly. During the larval stages of development, growth increase is nutrient dependent. Larval and imaginal tissues increase in mass during this developmental period. Internal, physiological signals in addition to external cues are involved in regulating larval growth (reviewed by Mirth and Shingleton, 2012). 46
47 Drosophila insulin like peptides functions to couple growth with changes in nutritional availability by a fat body-dependent mechanism. ILPs secreted from the IPCs are released into the hemolymph and act to promote growth by activating insulin receptor systemically. The Drosophila fat body, vertebrate homolog of liver and white adipose tissue, controls insulin secretion from the IPCs in a TOR-dependent mechanism. Understanding the mechanisms involved in signaling between the Drosophila fat body and the brain will provide further insight into the regulation of growth and size. This report presents evidence for the role of RanBPM in the fat body for the proper expression and secretion of insulin (DILP2) from the brain IPCs in regulating size and feeding behaviour of Drosophila larvae. I also present evidence for the role of DILP6 from the glial cells in the RanBPM mutants for the regulation of CNS proliferation. Additionally, genetic epistasis experiments were performed to investigate the role of InS/TOR signaling in RanBPM mutant phenotypes in the fat body for the remote control of DILP secretion. 4.1 Impaired insulin signaling in RanBPM mutants Fat body- dependent remote control of insulin secretion through a TOR dependent mechanism has been previously reported (Geminard et al., 2009). Inhibition of the TOR signaling pathway in the fat body or starvation induces dilp retention in the IPCs consequently restricting larval growth (Geminard et al., 2009). We found an increased level of dilp2 in the IPCs of the RanBPM mutant larvae (Figure 5A and 5B). 47
48 This is supported by reduced membrane localization of TGPH in the fat body and salivary glands in addition to reduced AKT activation in RanBPM mutants. Reduced levels of systemic insulin signaling suggest that dilp secretion is inhibited from the IPCs. Furthermore, ubiquitously over expressing DILP2 in RanBPM mutants resulted in the rescue of the mutant phenotypes. These observations suggest the requirement of RanBPM function either upstream or downstream of insulin signaling. 4.2 Expression of RanBPM in the fat body To investigate whether targeted expression of RanBPM in the larval fat body, a central link between Ins/TOR signaling and insulin secretion from brain IPCs, is sufficient to rescue RanBPM mutant phenotypes Lsp2-GAL4 and ppl-gal4 drivers were used to restore the function of this gene. Indeed, targeted expression was sufficient to improve food intake, growth, and restore the level of DILP2 in the IPCs of RanBPM mutants. However, late third-instar lethality phenotype caused by RanBPM mutation was not rescued. In contrast, when RanBPM gene was expressed under the regulation of C929- GAL4 driver in RanBPM mutants, lethality was suppressed. Homozygous RanBPM mutants survived to adulthood and were normal in size and appearance. The expression of C929-GAL4 reflects the expression pattern of DIMMED transcription factor, which includes CNS cells and peripheral cells (ie. fat body) (Park et al., 2008). These observations suggest the requirement of RanBPM in both peptidergic neurons and the fat body to overcome lethality. 48
49 Previous studies have reported the role of glial cells as the source of ILP6 for neuroblast reactivation during the late first instar stage of the Drosophila larva (Sousa- Nunes et al., 2011). Whereas ILPs secreted into the hemolymph from medial neurosecretory cells control organismal size (Brogiolo et al., 2001; Ikeya et al., 2002). To address whether glial derived ILP6 is sufficient to rescue CNS proliferation in RanBPM mutants DILP6 was expressed in the glial cells. CNS proliferation was restored when DILP6 was overexpressed in RanBPM mutants under the control of pan glial driver, repo- GAL4. This suggests that lack of RanBPM function disrupts glial derived ILP6 regulation. Conversely, overall growth and food intake was not rescued in these larvae. This finding is consistent with the literature which demonstrate that glial derived ILPs do not control overall larval growth (Sousa-nunes et al., 2011). 4.3 Ins/TOR signaling in the fat body of RanBPM mutants To determine which components of the InS and TOR pathways are disrupted in RanBPM mutants, we asked whether overexpression of downstream effector kinases AKT and S6K is capable of modifying RanBPM mutant phenotypes. When AKT was overexpressed in RanBPM mutants using Lsp2-GAL4 dye accumulation in the gut was significantly higher than the mutant controls (Figure 8A). Additionally the CNS size and the proliferation phenotype of the RanBPM mutant larvae were partially restored when AKT was overexpressed using LSP2- GAL4. Level of DILP2 in the IPCs of the RanBPM mutants expressing AKT was found to be reduced in comparison to the mutant control. 49
50 When ppl-gal4 was used to drive UAS- AKT reporter in RanBPM mutants the expression did not reach the required threshold to induce a change in the feeding behavior. The level of accumulation in the gut observed when AKT was overexpressed under the control of ppl-gal4 versus Lsp2-GAL4 can be explained in part by the mosaic pattern of expression exhibited by ppl (Bi et al., 2012), whereas Lsp2 is expressed in all cells of the fat body. These results suggest that RanBPM phenotypes maybe due at least in part to reduced AKT function in the fat body. Overexpression of S6K in the fat body showed an increase in the labelling of the phospho-h3 in the ventral nerve cord of the CNS compared to RanBPM homozygous mutants. However, the increased level of proliferation was not comparable to the CNS of the WT larvae. S6K overexpression led to an increase in the size of the CNS in RanBPM mutants. However the growth increase of the CNS did not reach the size of WT larval brain. Additionally TOR kinase, which is known to regulate its downstream targets S6K and 4E-BP, was also up-regulated in the fat body of the RanBPM mutants to determine its effects on brain growth. Overexpression of TOR kinase partially restored the cell proliferation in the CNS. Feeding behaviour of the larvae overexpressing TOR signaling proteins remain to be observed to better understand the role of TOR/S6K signaling in RanBPM mutant phenotypes. In Drosophila, the fat body is a key organ in coupling the nutritional signal to the brain IPCs by a TOR- dependent mechanism. Studies have shown that TOR signaling is the major signaling pathway in the fat cells and not the PI3K pathway (Colombani et 50
51 al.,2003; Geminard et al., 2009). Studies from Pierre Leopold s laboratory has shown that although inhibition of InS/PI3K activity in the fat body led to a pronounced reduction of the fat body cells, it did not result in a delayed eclosion or a reduction in the overall size of the adult fly. Furthermore, inhibition of PI3K activity in fat cells was not found to influence DILP secretion from the brain (Geminard et al., 2009). In addition to these studies, Gould et al. found that removal of insulin receptor does not affect neuroblast growth or proliferation regardless of the nutrition conditions. Whereas the removal of the downstream components (ie. PI3K, Pdk1 and AKT) had profound effects on brain growth as suggested in part due to the function of Jeb/Alk signaling (Cheng et al., 2011). My own finding that up-regulation of InR in the fat body is not sufficient for starvation induced feeding behaviour is consistent with these reports suggesting that insulin signaling does not play an important role in the nutrient sensing mechanism for the non-autonomous regulation of the feeding behaviour. The larval fat body organ is an important source of nutrients that get stored during the larval feeding stages of development. The fat body is sensitive to changes in nutrient conditions and therefore prolonged period of starvation or developmental processes (ie. metamorphosis) can trigger autophagy. Autophagy is a cellular response important for mobilizing nutrients to the developing tissues. To check whether autophagy can be induced in RanBPM mutants upon starvation Lyso Tracker dye was used to label autophagosomes in the dissected fat body organ. Punctate staining of Lyso Tracker red in RanBPM mutants was observed under nutrient deprived conditions. This 51
52 suggests that the fat body of RanBPM mutants responds properly to starvation by inducing autophagy. Although Lyso Tracker is considered as a reliable marker to trace autophagy, localization of GFP-Atg8 can also be used as a more specific marker to label autophagosomal membranes. As discussed earlier, in response to starvation TOR signaling is inhibited thus inducing autophagy. Autophagy can also be triggered by directly inhibiting TOR via use of the drug, Rapamycin. Further experiments can be performed in RanBPM mutants using Rapamycin to evaluate the response of TOR signaling in the fat body. As a consequence of nutrient deprivation (ie. amino acids) the Drosophila fat body exhibits lipid aggregation as a way of remobilizing the nutrient stores. Consistently, lipid aggregation in the fat body was observed in the RanBPM mutants as a result of starvation. This finding suggest that in RanBPM mutants vesicle fusion is initiated in response to starvation indicating that the nutrient sensor mechanism of the fat body is perhaps not disrupted. 52
53 Conclusion Taken together, findings from this report suggest a complex requirement for RanBPM in non-overlapping domains of expression involved in the systemic regulation of larval homeostasis and development. Our results suggest a role for RanBPM in the fat body for the proper expression and secretion of DILP2, neural stem cell proliferation, feeding behaviour and for the growth of the organism. My findings also suggest that DILP6 secretion from the glial cells in the RanBPM mutants is sufficient to rescue the CNS proliferation phenotype. Further experiments were conducted to determine which components of the InS and TOR pathways were disrupted in RanBPM mutants. To that extent, we asked whether overexpression of downstream effector kinases (i.e AKT and S6K) are capable of modifying RanBPM mutant phenotypes. Targeted expression of AKT in the fat body of the RanBPM mutants under there regulation of Lsp2-GAL4 or ppl-gal4 partially rescued the CNS proliferation phenotype. Reduced feeding and DILP2 retention phenotypes were also rescued in these larvae when AKT was overexpressed under the regulation of Lsp2-GAL4. These observations suggest that perhaps the RanBPM phenotypes maybe due at least in part to reduced AKT function in the fat body. Overexpression of S6K in the fat body of the RanBPM mutants under the control of either Lsp2-GAL4 or ppl-gal4 showed an increase in the labelling of the phospho-h3 and the size of the CNS in comparison to RanBPM mutants. The growth deficit in these larvae was also rescued. Targeted expression of TOR in the fat body of the RanBPM mutants under the regulation 53
54 of Lsp2-GAL4 also showed an increase in the phospho-h3 labeling of the CNS in comparison to RanBPM mutants. Feeding experiments for the up regulation of TOR and S6K are yet to be performed and would provide insight into the role of TOR signaling in regulating RanBPM mutant phenotypes. Results presented in this report together with previously published studies (Zhao and Campos, 2012) suggest that dranbpm, a pleiotropic gene is required for proper insulin signaling in the Drosophila larva. Results reported here suggest a role for RanBPM in the fat body for the regulation of non-autonomous control of insulin secretion and feeding behaviour. Genetic epistasis experiments performed using InS and TOR components suggest a role of AKT in RanBPM mutant phenotypes for the fat body dependent remote control of DILP secretion. Additional studies are required to investigate the role of TOR/S6K signaling in the fat body for the regulation of feeding and DILP2 accumulation phenotypes of the RanBPM mutants. 54
55 Figure 1. Ins/TOR signalling. Drosophila insulin like peptide (DILP) binds and activates the insulin receptor (InR). Insulin signalling is mediated through the InR upon binding of the insulin receptor substrate (IRS). This leads to the activation of phosphoinositide-3- kinase (PI3K) which converts phosphatidylinositol 3,4-biphosphate 2 (PIP2) to PIP3. PIP3 stimulates PDK (phosphoinositide-dependent kinase) and activates serine/threonine 55
 complex and TSC1/TSC2 inhibits RAS homologue enriched in brain (RHEB).")
56 protein kinase Akt1 (also called PKB; protein kinase B). The phosphatase and tensin homologue (PTEN) phosphatase antagonizes the activity of PI3K by reverting PIP3 back to PIP2. PKB inhibits tuberous sclerosis 1 (TSC1/TSC2) complex and TSC1/TSC2 inhibits RAS homologue enriched in brain (RHEB). Downstream effectors of TOR include S6 kinase and initiation factor 4E-binding protein (4e-BP). TOR kinase activates S6K and inhibits the negative regulator 4E-BP to stimulate translation. In addition, TOR is involved in regulating catabolic processes such as autophagy (Reviewed by Oldham and Hafen, 2003) 56
57 Figure 2. Schematic representation of the proposed model for RanBPM function. Recent evidence has suggested a role for RanBPM in the fat body in controlling the starvation induced food intake, growth, CNS proliferation and insulin secretion. Role for RanBPM in regulating larval feeding behaviour, light and locomotion behaviour through the mushroom body (MB) function has been previously identified (Scantelbury 2010). Recent evidence suggests a role for RanBPM in the fat body for the regulation of feeding behaviour, growth, neuroblast (NBs) proliferation and insulin secretion from the neurosecretory cells (NSCs) of the CNS. Schematic also represents the reactivation of neuroblast cells via the local release of dilp6 from the glial cells of the CNS. My current work is focused on analyzing the role of Ins/TOR signalling in the fat body of Drosophila RanBPM mutants for modulating the remote control of insulin secretion and feeding behavior. 57
58 Figure 3. Targeted expression of RanBPM in neurosecretory cells is sufficient to rescue the feeding phenotype of RanBPM mutants. The graph depicts the absorbance at 625nm (A665nm) of larval extracts as a measure of the amount of food present in the 58
59 gut. Targeted expression of neurosecretory cells was achieved by using C929-GAL4 element to regulate the expression of a UAS- RanBPM construct in RanBPM mutant background (RanBPM k05201 ; C929: RanBPM k05201 ). Targeted expression of RanBPM in neurosecretory cells caused a significant increase in the food intake of RanBPM mutants (RanBPM K05201 ;C929:RanBPM ) relative to that of mutants carrying the GAL4 (RanBPM k05201 ; C929-GAL4/+) or the UAS construct alone (RanBPM k05201 ; UAS- RanBPM/+). The amount of food present in RanBPM k05201 ; C929: RanBPM k05201 is not significantly different from that of controls (y,w). All measurements are shown as mean values and +/- SEM. (N 3 (180 third instar larvae), ANOVA F(3,12) =112.8, p 0.000). 59

60 Figure 4. Impact of RanBPM mutations on subsets of neurosecretory cells. Expression of a nuclear GFP construct (UAS-GFP:LacZ.nls) regulated by the C929-GAL4 (A and B), 60
61 AKH-GAL4 (C and D) and DILP-2-GAL4 (E and F) was used to visualize the median neurosecretory cells cluster (mnsc), the AKH (adipokinetic hormone) producing cells in the ring gland and the DILP2- producing subset of the mnsc respectively in wild type (WT) and RanBPM mutants (RanBPM K0521 ).While the number and position of AKH cells did not differ in mutant and wild type specimens (C and D) the mnsc cluster was consistently smaller in RanBPM mutants (A and B see Additional file 4). In contrast, the DILP2 reporter is not expressed in RanBPM mutant brains (E and F). Scale bar in A valid for B and C. Scale bar in E valid for F. 61
 and RanBPM mutants (RanBPM K05201 )")
62 Figure 5. RanBPM mutant phenotypes consistent with disrupted systemic insulin signaling. A- Representative photomicrographs of dissected brains from wild type (WT) and RanBPM mutants (RanBPM K05201 ) immunolabeled with anti-dilp2 antibodies and 62
63 imaged by confocal microscopy using identical laser and scan settings. Images represent Z-stacks of 8-12 sections at 1µm intervals. Scale bar valid for both panels B-The graph depicts the fluorescence intensity across the insulin producing cell clusters of wild type and RanBPM mutant larvae. (N 28 for each genotype, Student s T- test *p 0.001). C- Representative Western blot showing a marked decrease in the level of activated phospho-akt (pakt) in RanBPM mutant larval extracts relative to WT control. In contrast total AKT is not affected by lack of RanBPM gene function. Actin is shown as a control for sample loading. Quantitation relative to the internal actin control is shown in Additional file 5. D- Representative confocal micrographs of larval fat bodies and salivary glands from WT and RanBPM mutants carrying the TGPH construct to detect InR/PI3K activity. The characteristic accumulation of the GPH fusion protein in the plasma membrane of either tissue is markedly reduced in the RanBPM mutant larvae. 63
64 64
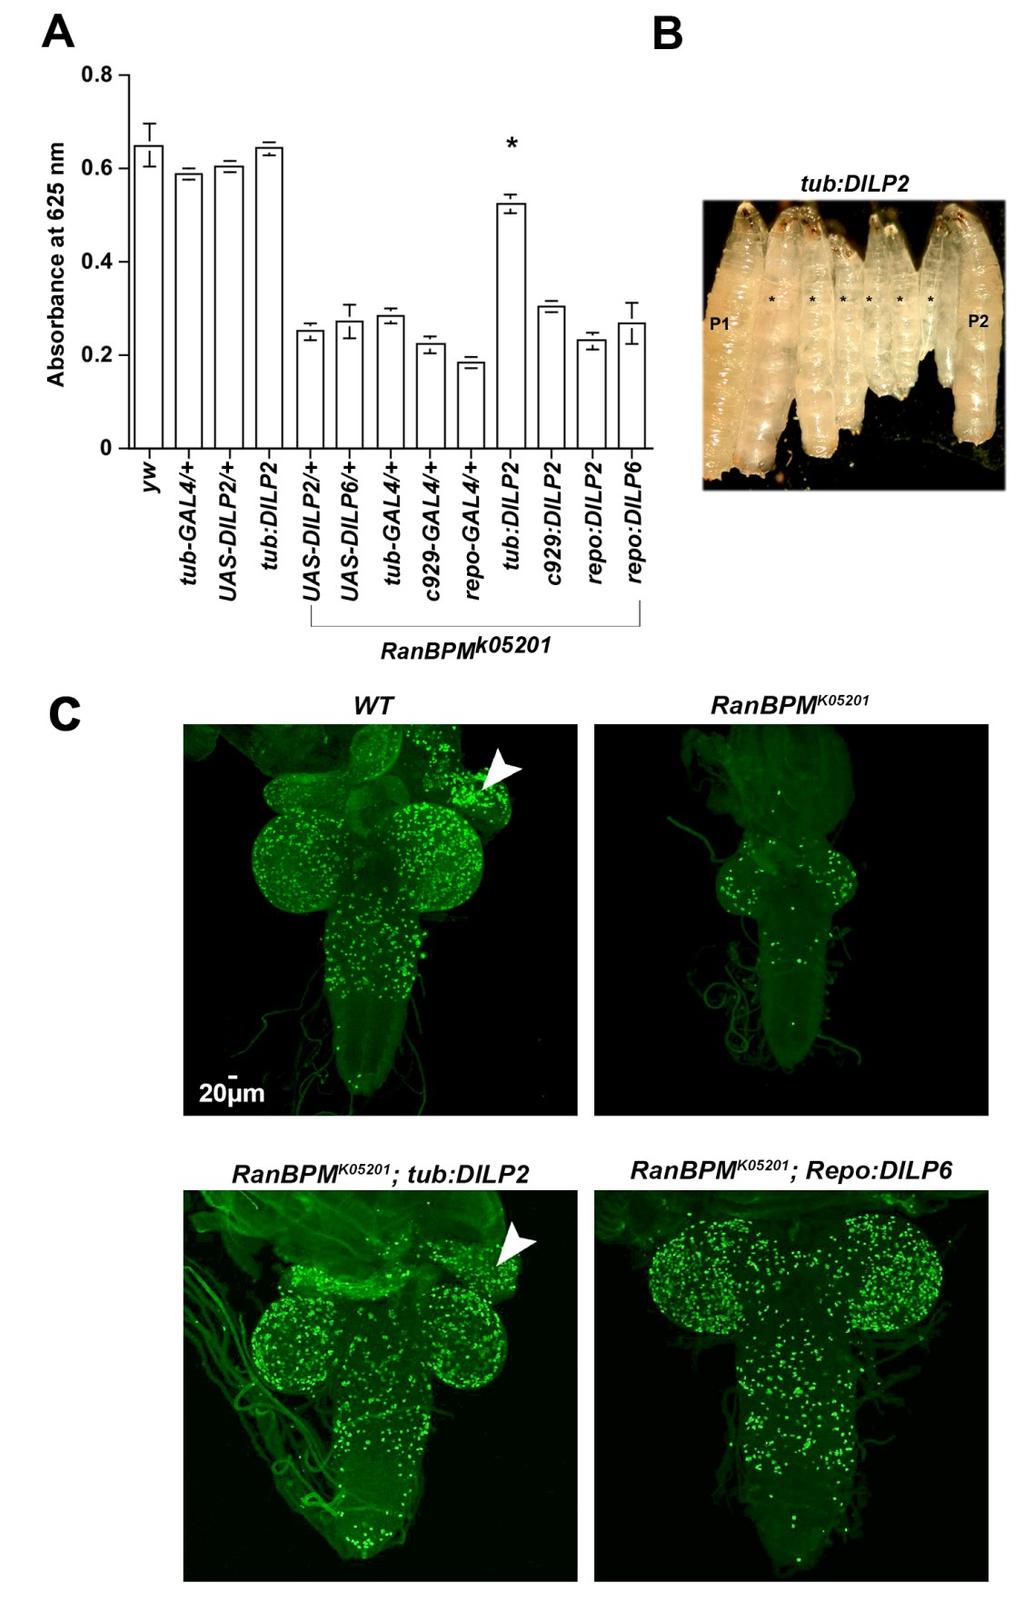
65 Figure 6. Ubiquitous expression of DILP2 partially restores RanBPM mutant phenotype A- The graph depicts the absorbance at 625nm (A625nm) of larval extracts as a measure of the amount of food present in the gut. Over expression of dilp2 under the control of the ubiquitous GAL4 driver tub-gal4 (RanBPM K05201 ; tub: dilp2) significantly increased A625nm relative to that of mutants carrying only the GAL4 (RanBPM k05201 ; tub-gal4/+) or the UAS construct (RanBPM k05201 ; UAS-RanBPM/+). Over expression of dilp2 in a wild type background (tub:dilp2) did not significantly increase A625nm of larval extracts. All measurements are shown as mean values and +/- SEM (N 3 (180 larvae, ANOVA F(12,50) = , *P 0.001). B- Representative micrographs of RanBPM K05201 ; tub: dilp2 (*) larvae flanked by parental controls (P1, RanBPM K05201 / +; tub-gal4 and P2, RanBPM K0520 / + ; UAS dilp2) and homozygous RanBPM K05201 (m). C- Representative confocal micrographs of dissected larval brains immunolabeled with anti-phospho H3 antibody to detect mitotically-active cells. Images shown are projected Z-series collected at 2 μm intervals from sections of wild type (WT), sections of homozygous RanBPM K05201, sections of RanBPM K05201 ;tub:dilp2 and sections of RanBPM K05201 ;repo:dilp6. Lack of RanBPM function markedly reduces proliferation in the CNS. The eye-antennal imaginal disc is rarely visible in the third instar RanBPM K05201 mutant specimens (arrowhead in WT). RanBPM mutant larva in which DILP2 was ubiquitously expressed under the regulation of the tubulin (tub) promoter (RanBPM K05201 ;tub:dilp2) is larger, displays increased phospho H3 labelling when compared to homozygous RanBPM K05201 mutant and is indistinguishable from WT control. The eye 65

66 antennal imaginal disc of RanBPM K05201 ;tub:dilp2 is visible and labelled by phospho H3 antibody (arrowhead). Targeted expression of DILP6 under the regulation of a pan-glial driver repo-gal4 is sufficient to restore proliferation and growth in the nervous system but not in the eye imaginal discs of RanBPM mutants (RanBPM K05201 ; repo:dilp2). Scale bar is valid for all panels in C. 66
67 Figure 7. Targeted expression in the fat body rescues RanBPM mutant phenotype. A- The graph depicts the absorbance at 625nm (A625nm) of larval extracts as a measure of the amount of food present in the gut. Expression of RanBPM in the fat body using two independent GAL4 drivers expressed in this organ significantly increased the A625nm of extracts obtained from homozygous RanBPM mutant larvae (*RanBPM K05201 ; Lsp2:RanBPM and RanBPM K05201 ; ppl:ranbpm ) above that of mutants carrying the GAL4 (RanBPM K05201 ; Lsp2 (or ppl)-gal4/+) or the UAS construct (RanBPM K0520 ; UAS- RanBPM/+) only, but it is not significantly different from that for parental control strain (y,w). All measurements are shown as mean values and +/- SEM (N 3 (180 larvae), ANOVA F(5,20) = , p 0.001). B- Representative micrographs of RanBPM K05201 ; Lsp2 (or ppl): RanBPM (*) larvae flanked by parental controls (P1, RanBPM K05201 / +; Lsp2 (or ppl)-gal4 and P2, RanBPM K0520 / + ; UAS-RanBPM) and homozygous RanBPM K05201 mutant larvae (m). C-. Representative photomicrographs of larval brains dissected from wild type (WT), RanBPM mutant (RanBPM K05201 ) and RanBPM mutants expressing RanBPM in the fat body under the regulation of the Lsp2-GAL driver (RanBPM K05201 ; Lsp2:RanBPM) immune stained with anti-dilp2 antibodies and imaged by confocal microscopy using identical laser and scan settings. Images represent Z-stacks projections of 8-14 sections at 1 µm intervals. D- The graph depicts the fluorescence intensity across the insulin producing cell clusters for the genotypes shown in C and for RanBPM K05201 ; ppl:ranbpm. (N 24 for each genotype, ANOVA F(2,80)=37.83, P 0.000). 67
68 Scale bar valid for all photomicrographs in this panel. E-Representative confocal micrographs of larval brains immunolabeled with anti-phospho H3 antibody to detect mitotically-active cells. Images shown are projected Z-series obtained from sections of wild type, sections of RanBPM K05201 ;Lsp2 (or ppl):ranbpm, and sections of RanBPM K All Z series were obtained at 2 μm intervals. Lack of RanBPM function markedly reduces proliferation in the CNS and the eye-antennal imaginal disc is rarely visible (RanBPM K05201 ). The CNS dissected from RanBPM mutant larva expressing RanBPM in the fat body is generally larger, displays increased phospho H3 labelling in the CNS and eye imaginal disc (RanBPM K05201 ;Lsp2 (or ppl):ranbpm ). Arrowhead points to eye imaginal disc. Scale bar is valid for all photomicrographs in this panel. 68
 of larval extracts as a measure")
69 Figure 8. Up- regulation of AKT in the fat body partially rescues RanBPM mutant phenotypes A- The graph depicts the absorbance at 625nm (A625nm) of larval extracts as a measure of the amount of food present in the gut. Up-regulation of AKT in the fat body using Lsp2-GAL4 significantly increased the A625nm of extracts obtained from 69
70 homozygous RanBPM mutant larvae (*AKT; RanBPM K05201 ; Lsp2) above that of mutants carrying the GAL4 (RanBPM K05201 ; Lsp2-GAL4/+) or the UAS construct (UAS-AKT; RanBPM K0520 ). Expression of AKT using ppl-gal4 was not sufficient to increase the A625nm of larval extracts (AKT;RanBPM K05201 ; ppl). Targeted expression of InR(CA) using Lsp2-GAL4 (RanBPM K05201 ; Lsp2: InR (CA)) did not increase the A625nm of the larval extracts above that of the mutants carrying the GAL4 (RanBPM K05201 ; Lsp2-GAL4/+) or the UAS constructs (RanBPM K05201 ; UAS-InR(CA)/+). All measurements are shown as mean values and +/- SEM (N 3 (180 larvae), ANOVA F(6,18) = 25.33, p 0.000). B- Representative micrographs of AKT: RanBPM K05201 ; Lsp2 (*) larvae next to the parental control (P, RanBPM K05201 / +; Lsp2) and homozygous RanBPM K05201 mutant larvae (m). C- Representative photomicrographs of larval brains dissected from wild type (WT), RanBPM mutant (RanBPM K05201 ) and RanBPM mutants expressing AKT in the fat body under the regulation of the Lsp2-GAL4 driver or ppl-gal4(akt; RanBPM K05201 ; Lsp2 or AKT; RanBPM K05201 ;ppl) immune stained with anti-dilp2 antibodies and imaged by confocal microscopy using identical laser and scan settings. Images represent Z-stacks projections of 8-14 sections at 1 µm intervals. D- The graph depicts the fluorescence intensity across the insulin producing cell clusters for the genotypes shown in C (N 15 for each genotype, ANOVA F(2,47)=17.57, P 0.000). Scale bar valid for all photomicrographs in this panel. E- Representative confocal micrographs of larval brains immunolabeled with anti-phospho H3 antibody to detect mitotically-active cells. Images shown are projected Z-series obtained from sections of wild type, sections 70
) compared to RanBPM mutant control.")
71 of AKT;RanBPM K05201 ;Lsp2 (or ppl), and sections of RanBPM K All Z series were obtained at 2 μm intervals. The CNS dissected from RanBPM mutant larva expressing AKT in the fat body display an increase in phospho H3 labelling in the CNS (AKT; RanBPM K05201 ;Lsp2 (or ppl)) compared to RanBPM mutant control. Figure 9. Targeted expression of AKT (myr) in the fat body of RanBPM mutants. A- The graph depicts the absorbance at 625nm (A625nm) of larval extracts. Up-regulation of AKT(myr) in the fat body using Lsp2-GAL4 or ppl-gal4 is not sufficient to increase the A625nm of RanBPM mutant larval extracts (RanBPM K05201 ; Lsp2: AKT(myr)) compared to the mutants carrying the GAL4 (RanBPM K05201 ; Lsp2-GAL4/+) or the UAS construct (RanBPM K05201 ; UAS-AKT(myr)). All measurements are shown as mean values and +/- 71
 (*) larvae next to parental controls (P, RanBPM K05201 / +; Lsp2) and homozygous RanBPM K05201 mutant larvae (m). Figure 10.")
72 SEM (N 2 (20 larvae), ANOVA F(5,17) = , p 0.000). B- Representative micrographs of RanBPM K05201 ; Lsp2:AKT(myr) (*) larvae next to parental controls (P, RanBPM K05201 / +; Lsp2) and homozygous RanBPM K05201 mutant larvae (m). Figure 10. Expression of InR in the fat body of RanBPM mutants. Representative confocal micrographs of larval brains immunolabeled with anti-phospho H3 antibody to detect mitotically-active cells. Images shown are projected Z-series obtained from A-18-72
73 25 sections of wild type, B sections of RanBPM K05201 C sections of RanBPM K05201 ; Lsp2-GAL4:UAS InR (CA), and D sections of RanBPM K05201 ; Lsp2- GAL4:UAS InR (DN). All Z series were obtained at 2 μm intervals. Up-regulation (RanBPM K05201 ; Lsp2-GAL4:UAS InR (CA)) or down-regulation (RanBPM K05201 ; Lsp2- GAL4:UAS InR (DN)) of insulin receptor did not increase the phospho-h3 labeling of the CNS compared to RanBPM mutant control. 73

74 Figure 11. Targeted Expression of TOR in the fat body partially rescues the CNS proliferation of RanBPM mutants. Representative confocal micrographs of larval brains immunolabeled with anti-phospho H3 antibody. Images shown are projected Z-series obtained from A sections of wild type, B sections of RanBPM K05201 and C and D sections of RanBPM K05201 ; Lsp2-GAL4:UAS TOR. All Z series were obtained 74
75 at 2 μm intervals. Overexpressing Target of Rapamycin (TOR) in the fat body under the regulation of (C) Lsp2-GAL4 in RanBPM mutants increased the phospho-h3 labeling of the CNS compared to the RanBPM mutant control. When TOR was overexpressed in the fat body under the regulation of ppl-gal4 the phospho-h3 labeling of the CNS did not increase compare to the RanBPM mutant control. The size of the CNS did not appear to increase when TOR was up-regulated under the regulation of either Lsp2-GAL4 or ppl- GAL4. 75

76 Figure 12. Over expression of S6K in the fat body partially rescues the CNS proliferation and the size of RanBPM mutants. Representative confocal micrographs of larval brains immunolabeled with anti-phospho H3 antibody. Images shown are projected Z-series obtained from A sections of wild type, B sections of RanBPM K05201 and C 76
77 and D sections of RanBPM K05201 ; Lsp2-GAL4:UAS S6K (or ppl-gal4). All Z series were obtained at 2 μm intervals. Up-regulation of S6K in the fat body under the regulation of Lsp2-GAL4 or ppl-gal4 in RanBPM mutants increased the phospho-h3 labeling of the CNS compared to the RanBPM mutant control. The size of the CNS appeared bigger than the RanBPM mutant control when S6K was up-regulated under the regulation of either Lsp2-GAL4 or ppl-gal4. E- Representative micrographs of RanBPM K05201 ; Lsp2-GAL4:UAS S6K(CA) (*) larvae next to the parental control (P, RanBPM K05201 / +; Lsp2) and homozygous RanBPM K05201 mutant larvae (m). 77

78 Figure 13. Targeted expression of dilps in DIMM- positive peptidergic neurons in RanBPM mutants. Representative confocal micrographs of larval brains immunolabeled with anti-phospho H3 antibody. Images shown are projected Z-series obtained from A sections of wild type, B sections of RanBPM K05201 C sections of C929- GAL4,RanBPM K05201 ; UASDILP2 and C sections of C929,GAL4,RanBPM K05201 ; UASDILP6. All Z series were obtained at 2 μm intervals. When either DILP2 or DILP6 78
79 were overexpressed under the regulation of C929-GAL4 phospho-h3 labeling appeared indistinguishable compared to RanBPM mutants and therefore CNS proliferation was not rescued. 79
 to detect autophagosomes.")
80 Figure 14. Examining autophagy in RanBPM K05201 mutants using LysoTracker probe. Representative confocal micrographs of larval fat body stained with LysoTracker Red DND-99 (Molecular Probes) to detect autophagosomes. Images shown are snapshots of A-wild type under fed conditions B- RanBPM K05201 mutants under fed conditions C- wild type under starved conditions and D- RanBPM K05201 mutants under starved conditions. Increased punctate staining (indicated by the arrow heads) of LysoTracker probe was 80
81 detected under starved conditions in the fat body of both the RanBPM K05201 mutants and wild type larvae. 81
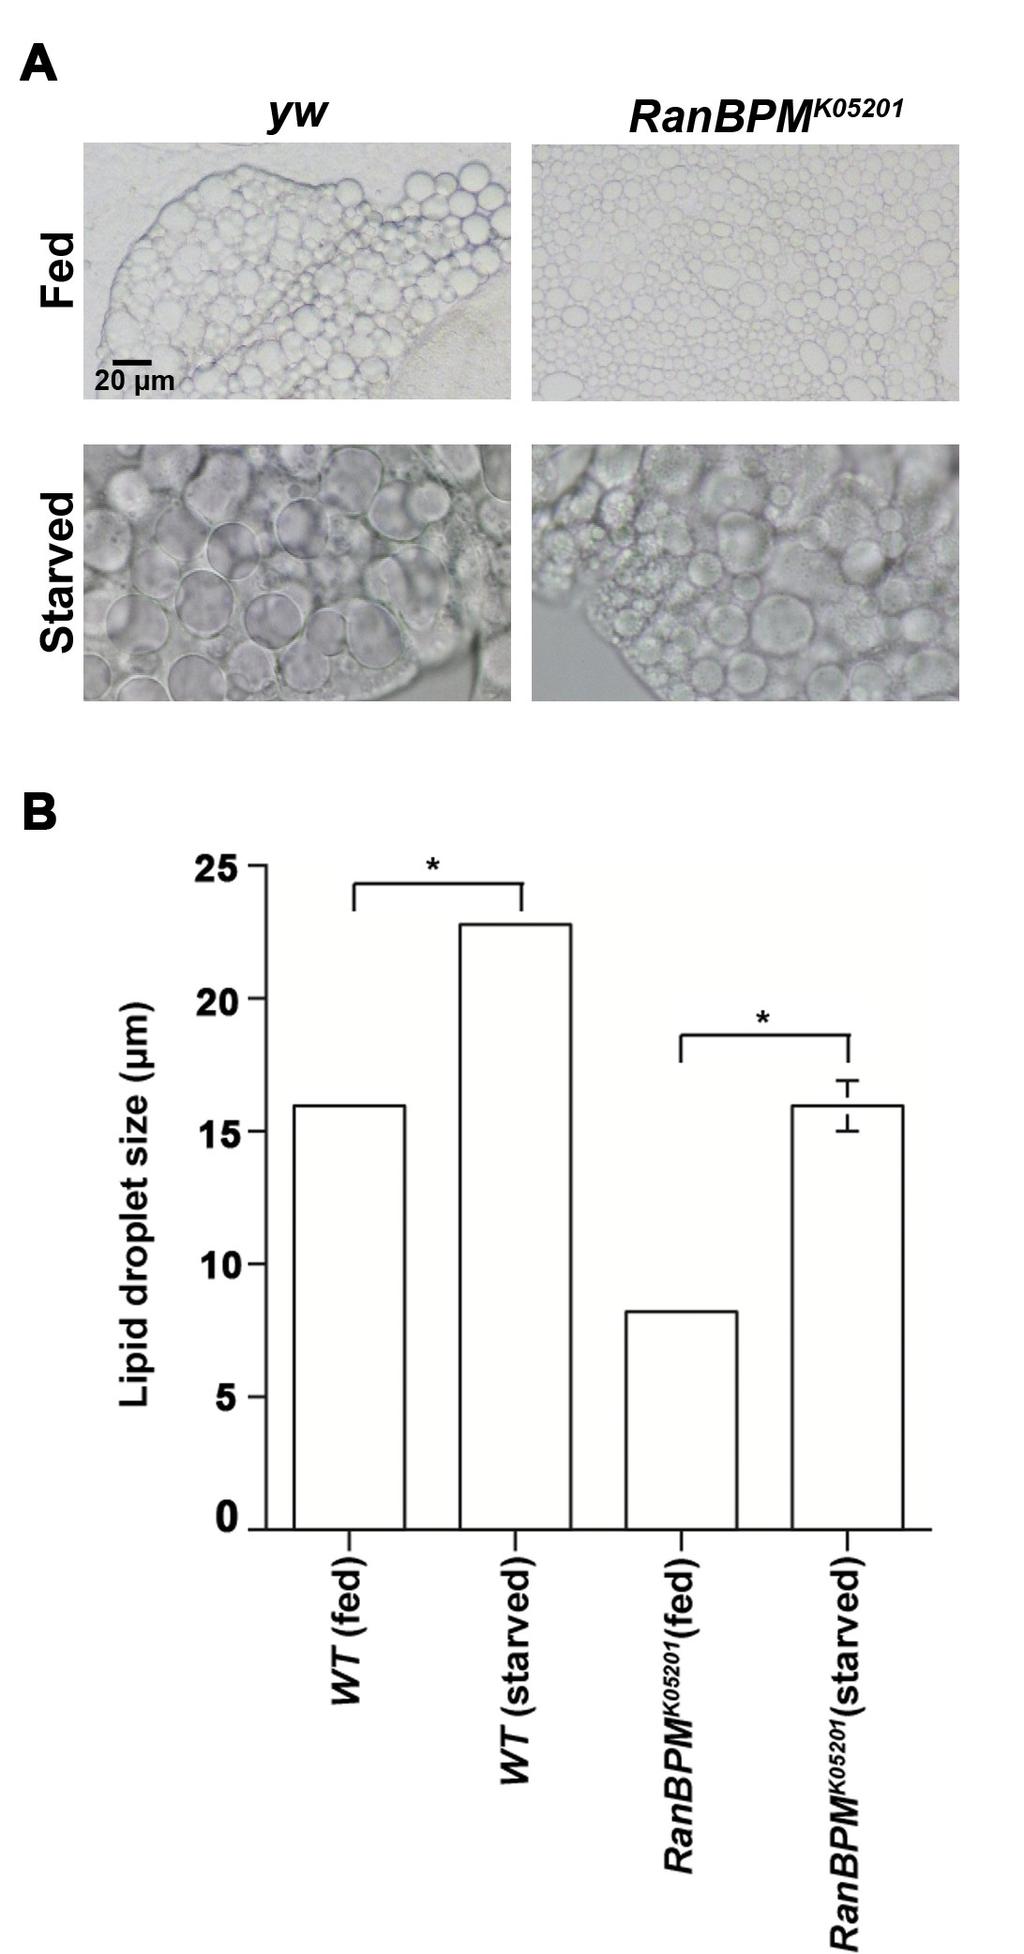
82 82
83 Figure 15. Measuring the size of lipid droplets in RanBPM K05201 mutants under fed and nutrient deprived conditions. Representative micrographs of unstained larval fat body reveal differences in the lipid droplet size as a result of changes in nutritional conditions. Images shown are snapshots taken at bright field setting of A- wild type and RanBPM K05201 mutants under fed conditions as well as wild type and RanBPM K05201 mutants under starved conditions. The graph depicts the mean diameter of the lipid droplets for the genotypes shown in A. (N > 148 for each genotype, ANOVA F(3,1314)=329.32, P 0.000). Mean and SEM values for wild type under fed conditions, wild type after starvation, RanBPM K05201 mutant under fed and RanBPM K05201 mutant after starved conditions are , , , respectively. 83
84 Figure 16. Measure of food intake by modulating insulin signaling in the fat body. The graph depicts the absorbance at 625nm (A665nm) of larval extracts as a measure of the amount of food present in the gut. Various UAS constructs of insulin signaling components were regulated under the control of Lsp2-GAL4 promoter. UAS -Akt (myr), UAS-S6k (CA), UAS-Akt, UAS-InR(DN) and UAS-InR(CA) were expressed under the control of Lsp2-GAL4. There was no difference in the A625nm of larval extracts detected in comparison to the appropriate parental controls when these constructs were expressed under the regulation of Lsp2-GAL4. All measurements are shown as mean values and +/- 84

85 SEM (N 2 (60 larvae), ANOVA F(8, 42) = 0.87). No significant difference was found using one way-anova or two sample T-test analysis. Additional files Additional file 1 Indicates homozygous mutant RanBPM adult flies in which RanBPM expression was restored in the neurosecretory cells under the regulation of C929-GAL (y, w; RanBPM K05201, C929-GAL4/ RanBPM K05201 ; UAS-RanBPM). The curly wing flies are heterozygous RanBPM mutants (y, w; RanBPM K05201, C929-GAL4/ Cy(y+). 85

86 Additional file 2 While the RanBPM mutant CNS (right panel) is smaller than wild type controls (left panel) the overall pattern of neurosecretory cell clusters as defined by the expression of GFP under the control of the C929-GAL4 driver is not different from control. 86
87 Genotype mnsc (C929-GAL4 positive) AKH (AKH-GAL4 positive) N WT 15± ± RanBPM k ±2.038* 8± Additional file 3. Counts of the number of cell in the medial neurosecretory cell (mnsc) clusters located in the pars intercerebralis as identified by the expression of C929-GAL4. Adipokinetic hormone (AKH) producing cells located in the ring gland were identified by expression of the AKH-GAL4 element. In both cases the expression of a nuclear GFP was used to visualize the cells in wild type (WT) or RanBPM mutant back ground (RanBPM K05201 ). The number of cells in the mnsc cluster is significantly smaller in RanBPM mutants (Student s T test, * p= 0.000). 87
 or RanBPM mutant (RanBPM K05201, B) second instar larval brains immunolabeled with anti-dilp2 antibodies and imaged by")
88 Additional file 4 Second instar RanBPM mutant larvae do not display increased accumulation of DILP2 peptide in the insulin producing cells of the brain. Representative photomicrographs of dissected brains from wild type (WT, A) or RanBPM mutant (RanBPM K05201, B) second instar larval brains immunolabeled with anti-dilp2 antibodies and imaged by confocal microscopy using the same laser and scan settings. Images represent Z-stacks of 8-12 sections at 1µm intervals. Scale bar in A valid for B. The graph (C) depicts the fluorescence intensity across the insulin producing cell clusters of wild type (WT) and RanBPM mutant larvae (RanBPM K05201 ). Fold changes (f.c.) is 88

89 indicated relative to the values obtained with the wild type specimens. There is no significant difference between the values measured for both genotypes (N 30, Student s T test, p= 0.174). Additional file 5 The graph depicts the relative intensity of the AKT and phospho AKT bands of the western shown in Figure 3C normalized against the actin loading control. The light band detected in the RanBPM K05201 sample with the antibody that recognizes the phospho active AKT seen in the western is below the level of detection. 89
90 Additional file 6 Targeted expression of RanBPM in the fat body under the regulation of ppl-gal4 driver partially rescues the size phenotype of RanBPM K05201 mutants. Image J was used to measure the long axis of larval images. RanBPM mutants are significantly smaller than control larvae of the same developmental stage. Restoration of RanBPM expression in the fat body of RanBPM mutants significantly increased larval size (N 3, ANOVA F(2,10) = 168,22 p < 0.01). 90
 of larval extracts as a measure of the amount of food present in the gut.")
91 Additional file 7 Fat body RNAi knock down of RanBPM gene reduces food accumulation in the gut and disrupts growth. A- The graph depicts the absorbance at 625nm (A665nm) of larval extracts as a measure of the amount of food present in the gut. Expression of dsrna construct targeting the RanBPM transcript in the fat body using two independent GAL4 drivers significantly reduced the A665nm below that of larvae carrying only one of the GAL4 drivers (Lsp2-GAL4 or ppl-gal4) or the UAS- RNAII RanBPM (N 3, ANOVA F(6,27) = 8.15, p<0.001). B- Representative micrographs of Lsp2- RNAII RanBPM and ppl- RNAII RanBPM (*) larvae flanked by parental controls carrying either one of the transgenic constructs. 91
Richik N. Ghosh, Linnette Grove, and Oleg Lapets ASSAY and Drug Development Technologies 2004, 2:
 1 3/1/2005 A Quantitative Cell-Based High-Content Screening Assay for the Epidermal Growth Factor Receptor-Specific Activation of Mitogen-Activated Protein Kinase Richik N. Ghosh, Linnette Grove, and Oleg
Supplementary Materials for
 www.sciencesignaling.org/cgi/content/full/6/301/ra98/dc1 Supplementary Materials for Regulation of Epithelial Morphogenesis by the G Protein Coupled Receptor Mist and Its Ligand Fog Alyssa J. Manning,
Chapter 4 Evaluating a potential interaction between deltex and git in Drosophila: genetic interaction, gene overexpression and cell biology assays.
 Evaluating a potential interaction between deltex and git in Drosophila: genetic interaction, gene overexpression and cell biology assays. The data described in chapter 3 presented evidence that endogenous
7.06 Problem Set #4, Spring 2005
 7.06 Problem Set #4, Spring 2005 1. You re doing a mutant hunt in S. cerevisiae (budding yeast), looking for temperaturesensitive mutants that are defective in the cell cycle. You discover a mutant strain
Regulation and signaling. Overview. Control of gene expression. Cells need to regulate the amounts of different proteins they express, depending on
 Regulation and signaling Overview Cells need to regulate the amounts of different proteins they express, depending on cell development (skin vs liver cell) cell stage environmental conditions (food, temperature,
Nature Biotechnology: doi: /nbt Supplementary Figure 1. Overexpression of YFP::GPR-1 in the germline.
 Supplementary Figure 1 Overexpression of YFP::GPR-1 in the germline. The pie-1 promoter and 3 utr were used to express yfp::gpr-1 in the germline. Expression levels from the yfp::gpr-1(cai 1.0)-expressing
SUPPLEMENTARY INFORMATION
 DOI: 10.1038/ncb3267 Supplementary Figure 1 A group of genes required for formation or orientation of annular F-actin bundles and aecm ridges: RNAi phenotypes and their validation by standard mutations.
Nature Neuroscience: doi: /nn.2662
 Supplementary Figure 1 Atlastin phylogeny and homology. (a) Maximum likelihood phylogenetic tree based on 18 Atlastin-1 sequences using the program Quicktree. Numbers at internal nodes correspond to bootstrap
with%dr.%van%buskirk%%%
 with%dr.%van%buskirk%%% How$to$do$well?$ Before$class:$read$the$corresponding$chapter$ Come$to$class$ready$to$par9cipate$in$Top$Hat$ Don t$miss$an$exam!!!!!!!!!!!!!!!!!!!!!!!!!!$ But$I m$not$good$with$science
16 The Cell Cycle. Chapter Outline The Eukaryotic Cell Cycle Regulators of Cell Cycle Progression The Events of M Phase Meiosis and Fertilization
 The Cell Cycle 16 The Cell Cycle Chapter Outline The Eukaryotic Cell Cycle Regulators of Cell Cycle Progression The Events of M Phase Meiosis and Fertilization Introduction Self-reproduction is perhaps
Supporting Information
 Supporting Information Cao et al. 10.1073/pnas.1306220110 Gram - bacteria Hemolymph Cytoplasm PGRP-LC TAK1 signalosome Imd dfadd Dredd Dnr1 Ikk signalosome P Relish Nucleus AMP and effector genes Fig.
Zool 3200: Cell Biology Exam 5 4/27/15
 Name: Trask Zool 3200: Cell Biology Exam 5 4/27/15 Answer each of the following short answer questions in the space provided, giving explanations when asked to do so. Circle the correct answer or answers
Honors Biology Reading Guide Chapter 11
 Honors Biology Reading Guide Chapter 11 v Promoter a specific nucleotide sequence in DNA located near the start of a gene that is the binding site for RNA polymerase and the place where transcription begins
Chem Lecture 10 Signal Transduction
 Chem 452 - Lecture 10 Signal Transduction 111202 Here we look at the movement of a signal from the outside of a cell to its inside, where it elicits changes within the cell. These changes are usually mediated
Biol403 - Receptor Serine/Threonine Kinases
 Biol403 - Receptor Serine/Threonine Kinases The TGFβ (transforming growth factorβ) family of growth factors TGFβ1 was first identified as a transforming factor; however, it is a member of a family of structurally
The EGF Signaling Pathway! Introduction! Introduction! Chem Lecture 10 Signal Transduction & Sensory Systems Part 3. EGF promotes cell growth
 Chem 452 - Lecture 10 Signal Transduction & Sensory Systems Part 3 Question of the Day: Who is the son of Sevenless? Introduction! Signal transduction involves the changing of a cell s metabolism or gene
Baz, Par-6 and apkc are not required for axon or dendrite specification in Drosophila
 Baz, Par-6 and apkc are not required for axon or dendrite specification in Drosophila Melissa M. Rolls and Chris Q. Doe, Inst. Neurosci and Inst. Mol. Biol., HHMI, Univ. Oregon, Eugene, Oregon 97403 Correspondence
targets. clustering show that different complex pathway
 Supplementary Figure 1. CLICR allows clustering and activation of cytoplasmic protein targets. (a, b) Upon light activation, the Cry2 (red) and LRP6c (green) components co-cluster due to the heterodimeric
Introduction. Gene expression is the combined process of :
 1 To know and explain: Regulation of Bacterial Gene Expression Constitutive ( house keeping) vs. Controllable genes OPERON structure and its role in gene regulation Regulation of Eukaryotic Gene Expression
Signal Transduction. Dr. Chaidir, Apt
 Signal Transduction Dr. Chaidir, Apt Background Complex unicellular organisms existed on Earth for approximately 2.5 billion years before the first multicellular organisms appeared.this long period for
Cells to Tissues. Peter Takizawa Department of Cell Biology
 Cells to Tissues Peter Takizawa Department of Cell Biology From one cell to ensembles of cells. Multicellular organisms require individual cells to work together in functional groups. This means cells
BIOLOGY STANDARDS BASED RUBRIC
 BIOLOGY STANDARDS BASED RUBRIC STUDENTS WILL UNDERSTAND THAT THE FUNDAMENTAL PROCESSES OF ALL LIVING THINGS DEPEND ON A VARIETY OF SPECIALIZED CELL STRUCTURES AND CHEMICAL PROCESSES. First Semester Benchmarks:
Supplemental table S7.
 Supplemental table S7. GO terms significantly enriched in significantly up-regulated genes of the microarray. K: number of genes from the input cluster in the given category. F: number of total genes in
Supplementary Information
 Supplementary Information Sung Bae Lee, Sunhong Kim, Jiwoon Lee, Jeehye Park, Gina Lee, Yongsung Kim, Jin-Man Kim, and Jongkyeong Chung This section contains: 1) Additional Information for Main Figures
Gene regulation I Biochemistry 302. Bob Kelm February 25, 2005
 Gene regulation I Biochemistry 302 Bob Kelm February 25, 2005 Principles of gene regulation (cellular versus molecular level) Extracellular signals Chemical (e.g. hormones, growth factors) Environmental
Cell Death & Trophic Factors II. Steven McLoon Department of Neuroscience University of Minnesota
 Cell Death & Trophic Factors II Steven McLoon Department of Neuroscience University of Minnesota 1 Remember? Neurotrophins are cell survival factors that neurons get from their target cells! There is a
Big Idea 3: Living systems store, retrieve, transmit and respond to information essential to life processes. Tuesday, December 27, 16
 Big Idea 3: Living systems store, retrieve, transmit and respond to information essential to life processes. Enduring understanding 3.B: Expression of genetic information involves cellular and molecular
Types of biological networks. I. Intra-cellurar networks
 Types of biological networks I. Intra-cellurar networks 1 Some intra-cellular networks: 1. Metabolic networks 2. Transcriptional regulation networks 3. Cell signalling networks 4. Protein-protein interaction
Lecture 10: Cyclins, cyclin kinases and cell division
 Chem*3560 Lecture 10: Cyclins, cyclin kinases and cell division The eukaryotic cell cycle Actively growing mammalian cells divide roughly every 24 hours, and follow a precise sequence of events know as
Domain 6: Communication
 Domain 6: Communication 6.1: Cell communication processes share common features that reflect a shared evolutionary history. (EK3.D.1) 1. Introduction to Communication Communication requires the generation,
Lecture 7. Development of the Fruit Fly Drosophila
 BIOLOGY 205/SECTION 7 DEVELOPMENT- LILJEGREN Lecture 7 Development of the Fruit Fly Drosophila 1. The fruit fly- a highly successful, specialized organism a. Quick life cycle includes three larval stages
AP Curriculum Framework with Learning Objectives
 Big Ideas Big Idea 1: The process of evolution drives the diversity and unity of life. AP Curriculum Framework with Learning Objectives Understanding 1.A: Change in the genetic makeup of a population over
Molecular Developmental Physiology and Signal Transduction
 Prof. Dr. J. Vanden Broeck (Animal Physiology and Neurobiology - Dept. of Biology - KU Leuven) Molecular Developmental Physiology and Signal Transduction My Research Team Insect species under study +
(Write your name on every page. One point will be deducted for every page without your name!)
") POPULATION GENETICS AND MICROEVOLUTIONARY THEORY FINAL EXAMINATION (Write your name on every page. One point will be deducted for every page without your name!) 1. Briefly define (5 points each): a) Average
POPULATION GENETICS AND MICROEVOLUTIONARY THEORY FINAL EXAMINATION (Write your name on every page. One point will be deducted for every page without your name!) 1. Briefly define (5 points each): a) Average
SUPPLEMENTARY INFORMATION
 Supplementary Discussion Rationale for using maternal ythdf2 -/- mutants as study subject To study the genetic basis of the embryonic developmental delay that we observed, we crossed fish with different
23-. Shoot and root development depend on ratio of IAA/CK
 Balance of Hormones regulate growth and development Environmental factors regulate hormone levels light- e.g. phototropism gravity- e.g. gravitropism temperature Mode of action of each hormone 1. Signal
Chapter 11. Development: Differentiation and Determination
 KAP Biology Dept Kenyon College Differential gene expression and development Mechanisms of cellular determination Induction Pattern formation Chapter 11. Development: Differentiation and Determination
Supplementary Information
 Supplementary Information MAP2/Hoechst Hyp.-AP ph 6.5 Hyp.-SD ph 7.2 Norm.-SD ph 7.2 Supplementary Figure 1. Mitochondrial elongation in cortical neurons by acidosis. Representative images of neuronal
Role of Mitochondrial Remodeling in Programmed Cell Death in
 Developmental Cell, Vol. 12 Supplementary Data Role of Mitochondrial Remodeling in Programmed Cell Death in Drosophila melanogaster Gaurav Goyal, Brennan Fell, Apurva Sarin, Richard J. Youle, V. Sriram.
AP Biology Unit 6 Practice Test 1. A group of cells is assayed for DNA content immediately following mitosis and is found to have an average of 8
 AP Biology Unit 6 Practice Test Name: 1. A group of cells is assayed for DNA content immediately following mitosis and is found to have an average of 8 picograms of DNA per nucleus. How many picograms
Supplementary Figure 1. Real time in vivo imaging of SG secretion. (a) SGs from Drosophila third instar larvae that express Sgs3-GFP (green) and
 SGs from Drosophila third instar larvae that express Sgs3-GFP (green) and") Supplementary Figure 1. Real time in vivo imaging of SG secretion. (a) SGs from Drosophila third instar larvae that express Sgs3-GFP (green) and Lifeact-Ruby (red) were imaged in vivo to visualize secretion
Supplementary Figure 1. Real time in vivo imaging of SG secretion. (a) SGs from Drosophila third instar larvae that express Sgs3-GFP (green) and Lifeact-Ruby (red) were imaged in vivo to visualize secretion
COMPUTER SIMULATION OF DIFFERENTIAL KINETICS OF MAPK ACTIVATION UPON EGF RECEPTOR OVEREXPRESSION
 COMPUTER SIMULATION OF DIFFERENTIAL KINETICS OF MAPK ACTIVATION UPON EGF RECEPTOR OVEREXPRESSION I. Aksan 1, M. Sen 2, M. K. Araz 3, and M. L. Kurnaz 3 1 School of Biological Sciences, University of Manchester,
Supplementary Materials for
 www.sciencemag.org/cgi/content/full/science.1244624/dc1 Supplementary Materials for Cytoneme-Mediated Contact-Dependent Transport of the Drosophila Decapentaplegic Signaling Protein Sougata Roy, Hai Huang,
The majority of cells in the nervous system arise during the embryonic and early post
 Introduction Introduction The majority of cells in the nervous system arise during the embryonic and early post natal period. These cells are derived from population of neural stem cells first shown by
Photoreceptor Regulation of Constans Protein in Photoperiodic Flowering
 Photoreceptor Regulation of Constans Protein in Photoperiodic Flowering by Valverde et. Al Published in Science 2004 Presented by Boyana Grigorova CBMG 688R Feb. 12, 2007 Circadian Rhythms: The Clock Within
Big Idea 1: The process of evolution drives the diversity and unity of life.
 Big Idea 1: The process of evolution drives the diversity and unity of life. understanding 1.A: Change in the genetic makeup of a population over time is evolution. 1.A.1: Natural selection is a major
Bypass and interaction suppressors; pathway analysis
 Bypass and interaction suppressors; pathway analysis The isolation of extragenic suppressors is a powerful tool for identifying genes that encode proteins that function in the same process as a gene of
 DOI: 10.1038/ncb2819 Gαi3 / Actin / Acetylated Tubulin Gαi3 / Actin / Acetylated Tubulin a a Gαi3 a Actin Gαi3 WT Gαi3 WT Gαi3 WT b b Gαi3 b Actin Gαi3 KO Gαi3 KO Gαi3 KO # # Figure S1 Loss of protein
Cells. Steven McLoon Department of Neuroscience University of Minnesota
 Cells Steven McLoon Department of Neuroscience University of Minnesota 1 Microscopy Methods of histology: Treat the tissue with a preservative (e.g. formaldehyde). Dissect the region of interest. Embed
4) Please cite Dagda et al J Biol Chem 284: , for any publications or presentations resulting from use or modification of the macro.
 Please cite Dagda et al J Biol Chem 284: , for any publications or presentations resulting from use or modification of the macro.") Supplement Figure S1. Algorithmic quantification of mitochondrial morphology in SH- SY5Y cells treated with known fission/fusion mediators. Parental SH-SY5Y cells were transiently transfected with an empty
Supplement Figure S1. Algorithmic quantification of mitochondrial morphology in SH- SY5Y cells treated with known fission/fusion mediators. Parental SH-SY5Y cells were transiently transfected with an empty
Reception The target cell s detection of a signal coming from outside the cell May Occur by: Direct connect Through signal molecules
 Why Do Cells Communicate? Regulation Cells need to control cellular processes In multicellular organism, cells signaling pathways coordinate the activities within individual cells that support the function
Optimization of Immunoblot Protocol for Use with a Yeast Strain Containing the CDC7 Gene Tagged with myc
 OPTIMIZATION OF IMMUNOBLOT PROTOCOL 121 Optimization of Immunoblot Protocol for Use with a Yeast Strain Containing the CDC7 Gene Tagged with myc Jacqueline Bjornton and John Wheeler Faculty Sponsor: Anne
!"#$%&'%()*%+*,,%-&,./*%01%02%/*/3452*%3&.26%&4752*,,*1%%
*%+*,,%-&,./*%01%02%/*/3452*%3&.26%&4752*,,*1%%") !"#$%&'%()*%+*,,%-&,./*%01%02%/*/3452*%3&.26%&4752*,,*1%% !"#$%&'(")*++*%,*'-&'./%/,*#01#%-2)#3&)/% 4'(")*++*% % %5"0)%-2)#3&) %%% %67'2#72'*%%%%%%%%%%%%%%%%%%%%%%%4'(")0/./% % 8$+&'&,+"/7 % %,$&7&/9)7$*/0/%%%%%%%%%%
!"#$%&'%()*%+*,,%-&,./*%01%02%/*/3452*%3&.26%&4752*,,*1%% !"#$%&'(")*++*%,*'-&'./%/,*#01#%-2)#3&)/% 4'(")*++*% % %5"0)%-2)#3&) %%% %67'2#72'*%%%%%%%%%%%%%%%%%%%%%%%4'(")0/./% % 8$+&'&,+"/7 % %,$&7&/9)7$*/0/%%%%%%%%%%
13-3. Synthesis-Secretory pathway: Sort lumenal proteins, Secrete proteins, Sort membrane proteins
 13-3. Synthesis-Secretory pathway: Sort lumenal proteins, Secrete proteins, Sort membrane proteins Molecular sorting: specific budding, vesicular transport, fusion 1. Why is this important? A. Form and
S1 Gene ontology (GO) analysis of the network alignment results
 analysis of the network alignment results") 1 Supplementary Material for Effective comparative analysis of protein-protein interaction networks by measuring the steady-state network flow using a Markov model Hyundoo Jeong 1, Xiaoning Qian 1 and
1 Supplementary Material for Effective comparative analysis of protein-protein interaction networks by measuring the steady-state network flow using a Markov model Hyundoo Jeong 1, Xiaoning Qian 1 and
7.06 Cell Biology EXAM #3 April 21, 2005
 7.06 Cell Biology EXAM #3 April 21, 2005 This is an open book exam, and you are allowed access to books, a calculator, and notes but not computers or any other types of electronic devices. Please write
Enduring understanding 1.A: Change in the genetic makeup of a population over time is evolution.
 The AP Biology course is designed to enable you to develop advanced inquiry and reasoning skills, such as designing a plan for collecting data, analyzing data, applying mathematical routines, and connecting
Introduction Principles of Signaling and Organization p. 3 Signaling in Simple Neuronal Circuits p. 4 Organization of the Retina p.
 Introduction Principles of Signaling and Organization p. 3 Signaling in Simple Neuronal Circuits p. 4 Organization of the Retina p. 5 Signaling in Nerve Cells p. 9 Cellular and Molecular Biology of Neurons
Supplementary Figures
 Supplementary Figures Supplementary Fig. S1: Normal development and organization of the embryonic ventral nerve cord in Platynereis. (A) Life cycle of Platynereis dumerilii. (B-F) Axonal scaffolds and
Student Learning Outcomes: Nucleus distinguishes Eukaryotes from Prokaryotes
 9 The Nucleus Student Learning Outcomes: Nucleus distinguishes Eukaryotes from Prokaryotes Explain general structures of Nuclear Envelope, Nuclear Lamina, Nuclear Pore Complex Explain movement of proteins
PAT-related amino acid transporters regulate growth via a novel mechanism that does not require bulk transport of amino acids
 Research article 2365 PAT-related amino acid transporters regulate growth via a novel mechanism that does not require bulk transport of amino acids Deborah C. I. Goberdhan*, David Meredith, C. A. Richard
SUPPLEMENTARY INFORMATION
 SUPPLEMENTARY INFORMATION doi:10.1038/nature12791 Supplementary Figure 1 (1/3) WWW.NATURE.COM/NATURE 1 RESEARCH SUPPLEMENTARY INFORMATION Supplementary Figure 1 (2/3) 2 WWW.NATURE.COM/NATURE SUPPLEMENTARY
camp Direct Immunoassay Kit
 camp Direct Immunoassay Kit Catalog Number KA0886 100 assays Version: 05 Intended for research use only www.abnova.com Table of Contents Introduction... 3 Background... 3 General Information... 4 Materials
A A A A B B1
 LEARNING OBJECTIVES FOR EACH BIG IDEA WITH ASSOCIATED SCIENCE PRACTICES AND ESSENTIAL KNOWLEDGE Learning Objectives will be the target for AP Biology exam questions Learning Objectives Sci Prac Es Knowl
I. Specialization. II. Autonomous signals
 Multicellularity Up to this point in the class we have been discussing individual cells, or, at most, populations of individual cells. But some interesting life forms (for example, humans) consist not
Nature Genetics: doi: /ng Supplementary Figure 1. The phenotypes of PI , BR121, and Harosoy under short-day conditions.
 Supplementary Figure 1 The phenotypes of PI 159925, BR121, and Harosoy under short-day conditions. (a) Plant height. (b) Number of branches. (c) Average internode length. (d) Number of nodes. (e) Pods
Three different fusions led to three basic ideas: 1) If one fuses a cell in mitosis with a cell in any other stage of the cell cycle, the chromosomes
 If one fuses a cell in mitosis with a cell in any other stage of the cell cycle, the chromosomes") Section Notes The cell division cycle presents an interesting system to study because growth and division must be carefully coordinated. For many cells it is important that it reaches the correct size
Section Notes The cell division cycle presents an interesting system to study because growth and division must be carefully coordinated. For many cells it is important that it reaches the correct size
Written Exam 15 December Course name: Introduction to Systems Biology Course no
 Technical University of Denmark Written Exam 15 December 2008 Course name: Introduction to Systems Biology Course no. 27041 Aids allowed: Open book exam Provide your answers and calculations on separate
Lipniacki 2004 Ground Truth
 Abstract Lipniacki 2004 Ground Truth The two-feedback-loop regulatory module of nuclear factor kb (NF-kB) signaling pathway is modeled by means of ordinary differential equations. signaling pathway: https://en.wikipedia.org/wiki/signaling_pathway
Dr. Dina A. A. Hassan Associate Professor, Pharmacology
 Cytology Dr. Dina A. A. Hassan Associate Professor, Pharmacology Email: da.hassan@psau.edu.sa Cells All living things are made up of cells Basic building blocks of life It is the smallest functional and
Supplemental Information. Sex Peptide Receptor and Neuronal. TOR/S6K Signaling Modulate. Nutrient Balancing in Drosophila
 Current Biology, Volume 20 Supplemental Information Sex Peptide Receptor and Neuronal TOR/S6K Signaling Modulate Nutrient Balancing in Drosophila Carlos Ribeiro and Barry J. Dickson Table S1. Data for
Bio/Life: Cell Biology
 Bio/Life: Cell Biology 1a The fundamental life processes of plants and animals depend on a variety of chemical reactions that occur in specialized areas of the organism's cells. As a basis for understanding
IMPL2 REPRESSES INSULIN SIGNALING IN RESPONSE TO HYPOXIA
 IMPL2 REPRESSES INSULIN SIGNALING IN RESPONSE TO HYPOXIA by JOHN PAUL ALLEE A DISSERTATION Presented to the Department of Biology and the Graduate School of the University of Oregon in partial fulfillment
The foraging locus: behavioral tests for normal muscle movement in rover and sitter Drosophila melanogaster larvae
 Genetica 85: 205-209, 1992. 0 1992 Kluwer Acadernic Publishers. Primed in the Nerhrrlands. The foraging locus: behavioral tests for normal muscle movement in rover and sitter Drosophila melanogaster larvae
Molecular Cell Biology 5068 In Class Exam 2 November 8, 2016
 Molecular Cell Biology 5068 In Class Exam 2 November 8, 2016 Exam Number: Please print your name: Instructions: Please write only on these pages, in the spaces allotted and not on the back. Write your
Thesis literature part. Regulation of quiescence in the Drosophila neuroblast
 Thesis literature part. Regulation of quiescence in the Drosophila neuroblast 01-07-2011 Regulation of quiescence in the Drosophila neuroblast By Sander Lambo Supported by Suzanne Ruijtenberg Bachelor
The diagram below represents levels of organization within a cell of a multicellular organism.
 STATION 1 1. Unlike prokaryotic cells, eukaryotic cells have the capacity to a. assemble into multicellular organisms b. establish symbiotic relationships with other organisms c. obtain energy from the
Conclusions. The experimental studies presented in this thesis provide the first molecular insights
 C h a p t e r 5 Conclusions 5.1 Summary The experimental studies presented in this thesis provide the first molecular insights into the cellular processes of assembly, and aggregation of neural crest and
Behavior of DNA-lacking mitochondria in Entamoeba histolytica revealed by organelle transplant
 9 10 11 Behavior of DNA-lacking mitochondria in Entamoeba histolytica revealed by organelle transplant Makoto Kazama 1 *, Sanae Ogiwara, Takashi Makiuchi 1, Kazuhiro Yoshida 1, Kumiko Nakada-Tsukui, Tomoyoshi
SUPPLEMENTARY INFORMATION
 doi:10.1038/nature10923 Supplementary Figure 1 Ten-a and Ten-m antibody and cell type specificities. a c, Representative single confocal sections of a Drosophila NMJ stained with antibodies to Ten-a (red),
downstream (0.8 kb) homologous sequences to the genomic locus of DIC. A DIC mutant strain (ro- 6
 homologous sequences to the genomic locus of DIC. A DIC mutant strain (ro- 6") A B C D ts Figure S1 Generation of DIC- mcherry expressing N.crassa strain. A. N. crassa colony morphology. When a cot1 (top, left panel) strain is grown at permissive temperature (25 C), it exhibits straight
A B C D ts Figure S1 Generation of DIC- mcherry expressing N.crassa strain. A. N. crassa colony morphology. When a cot1 (top, left panel) strain is grown at permissive temperature (25 C), it exhibits straight
Chapter 48 Neurons, Synapses, and Signaling
 Chapter 48 Neurons, Synapses, and Signaling Concept 48.1 Neuron organization and structure reflect function in information transfer Neurons are nerve cells that transfer information within the body Neurons
56:198:582 Biological Networks Lecture 11
 56:198:582 Biological Networks Lecture 11 Network Motifs in Signal Transduction Networks Signal transduction networks Signal transduction networks are composed of interactions between signaling proteins.
BIOH111. o Cell Biology Module o Tissue Module o Integumentary system o Skeletal system o Muscle system o Nervous system o Endocrine system
 BIOH111 o Cell Biology Module o Tissue Module o Integumentary system o Skeletal system o Muscle system o Nervous system o Endocrine system Endeavour College of Natural Health endeavour.edu.au 1 Textbook
Exam 1 ID#: October 4, 2007
 Biology 4361 Name: KEY Exam 1 ID#: October 4, 2007 Multiple choice (one point each) (1-25) 1. The process of cells forming tissues and organs is called a. morphogenesis. b. differentiation. c. allometry.
Nature Genetics: doi: /ng Supplementary Figure 1. Icm/Dot secretion system region I in 41 Legionella species.
 Supplementary Figure 1 Icm/Dot secretion system region I in 41 Legionella species. Homologs of the effector-coding gene lega15 (orange) were found within Icm/Dot region I in 13 Legionella species. In four
Curriculum Map. Biology, Quarter 1 Big Ideas: From Molecules to Organisms: Structures and Processes (BIO1.LS1)
") 1 Biology, Quarter 1 Big Ideas: From Molecules to Organisms: Structures and Processes (BIO1.LS1) Focus Standards BIO1.LS1.2 Evaluate comparative models of various cell types with a focus on organic molecules
1 Biology, Quarter 1 Big Ideas: From Molecules to Organisms: Structures and Processes (BIO1.LS1) Focus Standards BIO1.LS1.2 Evaluate comparative models of various cell types with a focus on organic molecules
Geert Geeven. April 14, 2010
 iction of Gene Regulatory Interactions NDNS+ Workshop April 14, 2010 Today s talk - Outline Outline Biological Background Construction of Predictors The main aim of my project is to better understand the
SUPPLEMENTARY INFORMATION
 GP2 Type I-piliated bacteria FAE M cell M cell pocket idc T cell mdc Generation of antigenspecific T cells Induction of antigen-specific mucosal immune response Supplementary Figure 1 Schematic diagram
Ribosome readthrough
 Ribosome readthrough Starting from the base PROTEIN SYNTHESIS Eukaryotic translation can be divided into four stages: Initiation, Elongation, Termination and Recycling During translation, the ribosome
Adam J. Schindler, L. Ryan Baugh, David R. Sherwood* Abstract. Introduction
 Identification of Late Larval Stage Developmental Checkpoints in Caenorhabditis elegans Regulated by Insulin/IGF and Steroid Hormone Signaling Pathways Adam J. Schindler, L. Ryan Baugh, David R. Sherwood*
Translational Initiation
 Translational Initiation Lecture Outline 1. Process of Initiation. Alternative mechanisms of Initiation 3. Key Experiments on Initiation 4. Regulation of Initiation Translation is a process with three
7.06 Cell Biology EXAM #3 KEY
 7.06 Cell Biology EXAM #3 KEY May 2, 2006 This is an OPEN BOOK exam, and you are allowed access to books, a calculator, and notes BUT NOT computers or any other types of electronic devices. Please write
Candidate Gustatory Interneurons Modulating Feeding Behavior in the Drosophila Brain
 Candidate Gustatory Interneurons Modulating Feeding Behavior in the Drosophila Brain Christoph Melcher, Michael J. Pankratz * Institut für Genetik, Forschungszentrum Karlsruhe, Karlsruhe, Germany Open
Segment boundary formation in Drosophila embryos
 Segment boundary formation in Drosophila embryos Development 130, August 2003 Camilla W. Larsen, Elizabeth Hirst, Cyrille Alexandre and Jean Paul Vincent 1. Introduction: - Segment boundary formation:
1. Draw, label and describe the structure of DNA and RNA including bonding mechanisms.
 Practicing Biology BIG IDEA 3.A 1. Draw, label and describe the structure of DNA and RNA including bonding mechanisms. 2. Using at least 2 well-known experiments, describe which features of DNA and RNA
CHAPTER 13 PROKARYOTE GENES: E. COLI LAC OPERON
 PROKARYOTE GENES: E. COLI LAC OPERON CHAPTER 13 CHAPTER 13 PROKARYOTE GENES: E. COLI LAC OPERON Figure 1. Electron micrograph of growing E. coli. Some show the constriction at the location where daughter
CAPE Biology Unit 1 Scheme of Work
 CAPE Biology Unit 1 Scheme of Work 2011-2012 Term 1 DATE SYLLABUS OBJECTIVES TEXT PAGES ASSIGNMENTS COMMENTS Orientation Introduction to CAPE Biology syllabus content and structure of the exam Week 05-09
RNA Synthesis and Processing
 RNA Synthesis and Processing Introduction Regulation of gene expression allows cells to adapt to environmental changes and is responsible for the distinct activities of the differentiated cell types that
Nature Neuroscience: doi: /nn.2717
 Supplementary Fig. 1. Dendrite length is not secondary to body length. Dendrite growth proceeds independently of the rate of body growth and decreases in rate in adults. n 20 on dendrite measurement, n