Analysis of Rho GTPase Signalling Pathways Regulating Epithelial Morphogenesis. Sean Wallace UCL
|
|
|
- Lindsey Austin
- 6 years ago
- Views:
Transcription
1 Analysis of Rho GTPase Signalling Pathways Regulating Epithelial Morphogenesis Sean Wallace UCL A thesis submitted for the degree of Doctor of Philosophy (PhD)
2 Declaration I, Sean Wallace, confirm that the work presented in this thesis is my own. Where information has been derived from other sources, I confirm that this has been indicated in the thesis. 2
3 Abstract Rho GTPases are molecular switches controlling many aspects of cell behaviour, including cell cycle progression, cell division, migration and morphology. The activity of Rho proteins is regulated by conformational changes induced by binding of guanine nucleotides, with GTP-bound Rho being active and GDP-bound Rho inactive. Families of regulatory proteins have evolved to catalyse cycling between these states. Guanine nucleotide exchange factors (GEFs) catalyse nucleotide exchange, allowing GDP to dissociate and GTP to bind to Rho, thus activating it. GTPase activating proteins (GAPs) enhance the intrinsic GTPase activity of Rho, leading to GTP hydrolysis and inactivation of Rho. Active GTP-bound Rho can interact with and regulate a number of effector proteins, through which cellular responses are elicited. Epithelial cells are a specialized cell type that form selectively permeable barriers between different compartments of a multicellular organism, and thus play an important role in tissue organization and homeostasis. The formation of cell-cell junctions, including tight junctions and adherens junctions, is critical for this function. Experiments carried out in model organisms and in cell culture have shown that Rho GTPases are important regulators of epithelial morphogenesis. I sought to identify components of the signalling pathways through which Rho GTPases regulate junction formation. RNAi screens were carried out with sirna libraries targeting Rho GEFs, GAPs and effectors, using tight junction formation in the human bronchial epithelial cell line 16HBE as readout. This approach led to the identification of three Rho effector proteins required for junction formation, namely PRK2, PAK4 and PAR6B. 3
4 Table of Contents Declaration Abstract...3 Table of Contents... 4 Table of Figures..7 Table of Tables CHAPTER 1 Introduction Overview Molecular regulation of Rho GTPases The Rho family of small GTPases Guanine nucleotide exchange factors for Rho GTPases (Rho GEFs) GTPase activating proteins for Rho GTPases (Rho GAPs) Regulation of Rho GAP and Rho GEF signalling Rho GTPase effector proteins Regulation of Rho effector proteins Organization of Rho GTPase signalling pathways Basic functions of Rho GTPases Regulation of the actin cytoskeleton a Actin polymerization b Actin filament bundling and contraction Regulation of the microtubule cytoskeleton Regulation of membrane trafficking Regulation of gene expression Epithelial morphogenesis and apical junctions The apical junctional complex (AJC) Adherens junctions Tight junctions Assembly of apical junctions Regulation of apical junctions Rho GTPases and apical junctions.60 4
5 1.5.1 Rho GTPases and the assembly of apical junctions Rho GTPases and the maintenance of apical junctions Experimental plan...65 CHAPTER 2 Materials and Methods Molecular biology DNA constructs DNA agarose gel electrophoresis Polymerase chain reaction (PCR) Restriction digests and ligations Site-directed mutagenesis Preparation of CaCl 2 -competent E.coli Transformation of CaCl 2 -competent E.coli Purification of plasmid DNA Cell culture and transfection Cell lines and culture conditions a 16HBE14o- cells b HEK293T cells Transfection of 16HBE cells with plasmid DNA Transfection of 16HBE cells with sirna Sequential transfection of 16HBE cells with plasmid DNA and sirna Transfection of HEK293T cells with plasmid DNA Sequential transfection of HEK293T cells with sirna and plasmid DNA Infection of 16HBE cells with retrovirus Calcium-switch in 16HBE cells Protein biochemistry Preparation of cell lysates SDS Polyacrylamide Gel Electrophoresis (SDS-PAGE) Western blot analysis Immunofluorescence microscopy Preparation of coverslips
6 2.4.2 Fixing and immunostaining Immunofluorescence microscopy Quantification of tight junction formation 80 CHAPTER 3 - RNAi Screens to Identify Rho GEFs, GAPs and Effector Proteins Required for Tight Junction Formation Overview HBE cells as a model for tight junction formation RhoA and Cdc42 are required for tight junction formation Screening of Rho GEFs and GAPs Screening of Rho effector proteins Discussion 110 CHAPTER 4 - Regulation of Epithelial Junctions by RhoA and its Effector PRK RhoA and RhoC can act redundantly to control tight junction formation Expression of mouse PRK2 rescues the tight junction defect caused by transfection of PRK2 sirna Multiple Rho effector proteins are likely to contribute to tight junction formation downstream of RhoA RhoA and PRK2 are required for the formation of mature adherens junctions and the organization of junctional F-actin PRK2 colocalizes with ZO-1 at tight junctions Discussion 135 CHAPTER 5 - Regulation of Epithelial Junctions by Cdc42 and its Effectors PAK4 and Par6B Expression of RNAi-resistant PAK4 rescues the tight junction defect caused by transfection of PAK4 sirna Expression of mouse Par6B does not rescue the tight junction defect caused by transfection of Par6B sirna Cdc42, PAK4 and Par6B are required for the formation of mature adherens 6
7 junctions and the organization of junctional F-actin PAK4 and Par6B colocalize with ZO-1 at tight junctions Discussion 158 CHAPTER 6 Final Discussion Thesis overview Identification of effector proteins acting downstream of RhoA and Cdc42 to regulate apical junction formation Mechanisms through which Rho effector proteins regulate apical junction formation Final summary..174 Acknowledgements.175 Bibliography
8 Table of Figures Figure 1.1 Rho GTPases control fundamental cellular behaviours 12 Figure 1.2 Rho GTPases are regulated by the GTPase cycle.14 Figure 1.3 Basic organization of epithelial apical junctions..45 Figure 1.4 Dynamics of junctional components during apical junction assembly.54 Figure HBE cells can be transfected with sirna with high efficiency...83 Figure 3.2 Transfection of 16HBE cells with control sirna duplexes does not affect tight junction formation...84 Figure 3.3 Transfection of SMARTpool sirna targeting RhoA or Cdc42 prevents tight junction formation Figure 3.4 RhoA is required for tight junction formation..87 Figure 3.5 Cdc42 is required for tight junction formation.88 Figure 3.6 Rho GEF and GAP RNAi screen results..93 Figure 3.7 Tight junction defect caused by Asef sirna is likely to be non-specific 95 Figure 3.8 Tight junction defect caused by ARHGEF10 sirna is likely to be non-specific..96 Figure 3.9 Tight junction defect caused by ITSN2 sirna is likely to be non-specific.98 Figure 3.10a Rho effector RNAi screen results Figure 3.10b Rho effector RNAi screen results Figure 3.11 Par6B is required for tight junction formation..106 Figure 3.12 PRK2 is required for tight junction formation..108 Figure 3.13 PAK4 is required for tight junction formation..109 Figure 3.14 Potential Rho GTPase signalling pathways regulating tight junction Formation Figure 4.1 Transfection of sirna targeting RhoB or RhoC does not affect tight junction formation..116 Figure 4.2 RhoA, RhoB and RhoC are expressed in 16HBE cells and are efficiently downregulated by sirna..117 Figure 4.3 (part 1) Expression of RhoA or RhoC rescues the tight junction defect caused by RhoA knockdown
9 Figure 4.3 (part 2) Expression of RhoA or RhoC rescues the tight junction defect caused by RhoA knockdown Figure 4.4 (part 1) Expression of mouse PRK2 rescues the tight junction defect caused by PRK2 sirna Figure 4.4 (part 2) Expression of mouse PRK2 rescues the tight junction defect caused by PRK2 sirna.124 Figure 4.5 Overexpression of RhoA effector mutants prevents tight junction formation Figure 4.6 E-cadherin localization is affected by knockdown of RhoA or PRK Figure 4.7 Junctional F-actin is disorganized in cells depleted of RhoA or PRK Figure 4.8 Early cell-cell contact formation in 16HBE cells Figure 4.9 PRK2 colocalizes with ZO-1 at tight junctions in 16HBE cells.134 Figure 4.10 Domain organization of PRK Figure 5.1 Stable expression of RNAi-resistant PAK4 in 16HBE cells..142 Figure 5.2 Expression of RNAi-resistant PAK4 rescues the tight junction defect caused by PAK4 sirna.143 Figure 5.3 Stable expression of RNAi-resistant mouse Par6B in 16HBE cells Figure 5.4 (part 1) Expression of mouse Par6B protein does not rescue the tight junction defect caused by transfection of Par6B sirna 146 Figure 5.4 (part 2) Expression of mouse Par6B protein does not rescue the tight junction defect caused by transfection of Par6B sirna 147 Figure 5.5 E-cadherin localization is affected by knockdown of Cdc42 or PAK Figure 5.6 E-cadherin localization is affected by knockdown of Par6B..152 Figure 5.7 Junctional F-actin is disorganized in cells depleted of Cdc42 or PAK4.153 Figure 5.8 Junctional F-actin is disorganized in cells depleted of Par6B 154 Figure 5.9 Endogenous PAK4 colocalizes with ZO-1 in 16HBE cells 155 Figure 5.10 Localization of overexpressed PAK4 in 16HBE cells..157 Figure 5.11 Endogenous Par6B colocalizes with ZO-1 in 16HBE cells..158 Figure 5.12 Domain organization of Par6B.159 Figure 5.13 Domain organization of PAK4.162 Figure 6.1 Further analysis will be required to elucidate the mechanisms through which PAK4 and PRK2 regulate apical junction formation
10 Table of Tables Table 1.1 Components of epithelial apical junctions.45 Table 2.1 DNA constructs used in this study.68 Table 2.2 sirna duplexes used in this study.73 Table 2.3 Antibodies used in this study.78 Table 3.1 Rho GEF genes targeted with sirna 89 Table 3.2 Rho GAP genes targeted with sirna 91 Table 3.3 Rho effector genes targeted with sirna..100 Table 3.4 Combinations of Rho effector genes targeted with sirna
11 CHAPTER 1 Introduction 1.1 Overview Rho GTPases are signalling proteins that belong to the Ras superfamily of small GTPases. They can exist in two structurally distinct conformations, a GTP-bound active conformation and a GDP-bound inactive conformation. Cycling between these two states is controlled by two families of regulatory proteins. Guanine nucleotide exchange factors (GEFs) catalyse nucleotide exchange, during which GDP dissociates and GTP associates with the GTPase, resulting in its conformational activation. GTPase activating proteins (GAPs) enhance the intrinsic GTPase activity of GTPases, resulting in hydrolysis of GTP and conformational inactivation of the GTPase. Rho GTPases thus act as molecular switches, cycling between active and inactive states in a regulated manner. Active Rho GTPases can interact with a number of effector proteins. Binding of Rho GTPases to their effector proteins regulates the activity of these proteins. Rho GEFs and GAPs are regulated by a wide range of extracellular and intracellular signals, and the interactions between components of Rho GTPase signalling pathways are highly specific, allowing Rho GTPase signalling pathways to couple a wide range of upstream signals to diverse downstream responses in a tightly controlled manner. A large number of Rho effector proteins have been identified, including kinases, phosphatases, lipases, adaptors and scaffolds. Rho GTPases can therefore regulate a number of basic processes in the cell, such as the organization of the actin and microtubule cytoskeletons, membrane trafficking events and gene expression. Through the regulation of these basic processes, Rho GTPases control many complex cellular behaviours, including cell cycle progression, cell division, migration, adhesion, differentiation and morphogenesis (Figure 1.1). Epithelial cells are a specialized cell type that act as selective barriers between different compartments of multicellular organisms. Epithelial cells are characterized by the 11


12 presence of intercellular junctions, which play essential roles in cell-cell adhesion and epithelial barrier function. Epithelial junctions are dynamic structures, whose assembly, maintenance and disassembly is tightly controlled during the morphogenesis of tissues and organs, and which become misregulated in diseases such as cancer. A number of signalling pathways have been found to regulate epithelial junctions, including Rho GTPase-dependent signalling pathways. 12
13 1.2 Molecular regulation of Rho GTPases The Rho family of small GTPases Rho GTPases belong to the Ras superfamily of small GTPases, which comprises over 150 members in mammals (Wennerberg et al., 2005). These proteins contain a conserved G domain of approximately 150 amino acids, which is responsible for guanine nucleotide binding. The Ras superfamily is typically divided in to 5 subfamilies based on sequence similarities. Members of the Rho family contain a small 12 amino acid insert region in the G domain, which forms an additional α-helical structure. 22 proteins were assigned to the Rho family. However, Miro-1 and Miro-2 have since been reassigned to their own atypical family, leaving 20 Rho family members. Of these, RhoA, Rac1 and Cdc42 are by far the best characterized. Rho GTPases are signalling proteins that regulate a number of important cellular processes. They act as molecular switches, and exist in two structurally distinct conformations. The active conformation is bound to GTP, and is able to interact with a number of effector proteins to regulate their activity. The inactive conformation is bound to GDP, and is not able to interact with effector proteins. Rho GTPases are activated at cell membranes by nucleotide exchange, during which GDP dissociates and is replaced by GTP. Nucleotide exchange requires catalysis by a group of proteins called guanine nucleotide exchange factors (GEFs). Most Rho GTPases possess intrinsic GTPase activity and hydrolyse GTP, leaving the GTPase GDP-bound and inactive. The GTPase activity of Rho GTPases is poor, and can be enhanced by GTPase activating proteins (GAPs). GEFs and GAPs thus regulate the activity of Rho GTPases by controlling their guanine nucleotide binding status, which in turn determines the conformation of the GTPase and its ability to interact with effector proteins (Figure 1.2). A third group of Rho GTPase regulatory proteins are the Rho GDIs (guanine nucleotide dissociation inhibitors), which are thought to sequester inactive GDP-bound GTPases in the cytosol and prevent their activation by GEFs. However, compared to GEFs and GAPs, Rho GDIs have not been well studied and little is known about their function. Rho GEFs and GAPs are themselves regulated by a wide 13


14 range of extracellular and intracellular signals, and this enables signals to be transduced through Rho GTPases to Rho effector proteins and ultimately to the cellular machinery. 14
15 1.2.2 Guanine nucleotide exchange factors for Rho GTPases (Rho GEFs) Guanine nucleotide exchange factors (GEFs) activate small GTPases by promoting nucleotide exchange. Rho GEFs are regulated by extracellular and intracellular signals, and this is essential for Rho-dependent cellular processes to be properly controlled. Rho GEFs show specificity in terms of which GTPase(s) they activate, which allows tight control of signal transduction pathways, linking upstream signals to the activation of specific Rho GTPases. Approximately 80 Rho GEFs exist in humans, falling in to two structurally unrelated families, the Dbl family and the DOCK family. Dbl family GEFs - The first Rho GEF to be identified was Dbl, isolated from diffuse B-cell lymphoma by its ability to transform fibroblasts. Dbl has a region homologous to Cdc24, a GEF for Cdc42 in Saccharomyces cerevisiae involved in cell polarity, and directly activates Cdc42 by promoting nucleotide exchange (Hart et al., 1991). This conserved Dbl-homology (DH) domain has subsequently been found in a large number of proteins (approximately 70 in humans), which constitute the Dbl family of Rho GEFs. Like Dbl, many of these Rho GEFs act as oncogenes in transformation assays in fibroblasts, which has been a useful way of identifying them (Rossman et al., 2005). They invariably contain a PH (pleckstrin homology) domain adjacent to the DH domain, which is essential for GEF activity in vivo (see below). The DH domain, approximately 200 amino acids, is the minimal domain required for nucleotide exchange activity in vitro. DH domains of different Rho GEFs typically show low sequence homology, but structural studies of a number of them, including Dbl, Dbs, Tiam1, Vav1 and Sos1, have revealed conserved structures. The DH domain is composed of a number of α-helices and helices that form a helical bundle. Crystal structures of DH domains bound to GTPases have been used to elucidate the mechanism of nucleotide exchange. Extensive contacts exist between the DH domain and the GTPase, including residues that are very varied amongst different GEF:GTPase complexes, and so are important for determining specificity. Binding of the GEF DH domain causes structural rearrangements in the switch I and switch II regions of the GTPase, resulting in disorganization of the nucleotide-binding site such that the 15
16 nucleotide and the associated magnesium cofactor dissociate. This leaves the GTPase with its nucleotide-binding site exposed, and GTP binds as it is more abundant in the cell than GDP. Binding of GTP causes dissociation of the GEF, leaving the GTPase in its active conformation capable of interacting with effector proteins (Rossman et al., 2005). This mechanism of nucleotide exchange is different than that catalysed by the unrelated DOCK family of Rho GEFs (discussed below), which insert residues in to the nucleotide-binding site of the GTPase to directly disrupt magnesium ion binding (Yang et al., 2009). There are some similarities in the mechanism of nucleotide exchange exchange catalysed by DH family GEFs and GEFs for other Ras superfamily GTPases. Binding of the GEF Sos to Ras, for example, induces similar structural changes in switch II of the GTPase, resulting in exclusion of nucleotide and magnesium ion. However, in contrast to DH family GEFs, Ras GEFs also insert residues directly in to the nucleotide-binding site of the GTPase, and these residues are directly involved in displacement of the nucleotide and magnesium ion (Boriack-Sjodin et al., 1998). PH (pleckstrin homology) domains are invariably found adjacent to DH domains in Dbl family GEFs. Deletion analysis of a number of Rho GEFs has revealed an essential role for PH domains for GEF activity in the cell. However no clear general role for PH domains in regulating GEF activity has been discerned, and it seems the PH domain plays different roles in different GEFs. The PH domain of Dbs makes direct contact with Cdc42 and residues in the PH domain contribute to nucleotide exchange (Rossman et al., 2003). However, in crystal structures of other Rho GEFs the PH domains are positioned differently relative to the DH domain, and are not directly involved in GTPase binding, so direct regulation of GEF activity is not a general mechanism for PH domain function. PH domains have been found to regulate GEF activity through binding to phosphoinositides, but different mechanisms have been proposed. In some cases, such as P-Rex1 (PtdIns(3,4,5)P 3 - and Gβγ- activated Rac GEF), addition of soluble PtdInsP 3 in vitro stimulates the GEF activity, presumably by an allosteric mechanism (Welch et al., 2002). However other GEFs are either not activated or are inhibited by soluble phosphoinositides (Rossman et al., 2005). 16
17 Rho GEFs are normally activated at membranes, and the PH domain has been proposed to play a role in membrane targeting through its phospholipid interactions. Lfc, for example, transforms fibroblasts and this depends on the presence of a functional PH domain. Addition of a general isoprenylation signal to target Lfc to the plasma membrane was able to compensate for loss of the PH domain, suggesting the role of the PH domain is simply to target the GEF to the membrane (Whitehead et al., 1995). However several GEFs are known to target to the membrane in the absence of functional PH domains (Rossman et al., 2003), showing additional mechanism for membrane targeting must exist. Another possible mechanism that has been proposed for the regulation of GEF activity by phosphoinositides is not membrane recruitment per se, but orientation of membranebound GEFs correctly to facilitate activation of their cognate GTPases. Consistent with this idea, specific point mutations have been made in the PH domain of Dbs which block phospholipid binding without affecting GEF activity in vitro (Rossman et al., 2003). This mutant is inactive in cellular transformation assays, despite being localized properly at the plasma membrane, suggesting phosphoinositide binding is required to activate the GEF downstream of membrane localization. PH domains can interact with proteins in addition to lipids, and in some cases this is important for regulating GEF activity. Trio, for example, interacts with the actinbinding protein filamin via its DH-associated PH domain, and this interaction is necessary for localization of Trio to actin filaments to promote membrane ruffles (Bellanger et al., 2000). Whatever the mechanism of regulation, the fact that Dbl family proteins invariably contain a PH domain adjacent to their DH domain suggests it plays an important role in GEF function. DOCK family GEFs - The second family of Rho GEFs are the DOCK180-related family, also called CZH proteins (CDM and zizimin homologous, where CDM stands for ced-5-dock180-myoblast city) (Meller et al., 2005). DOCK180, the founding member of this family in mammals, was originally identified as a binding partner for Crk, an adaptor protein involved in receptor tyrosine kinase signalling, and was 17
18 subsequently shown to directly catalyse nucleotide exchange on Rac (Brugnera et al., 2002). 11 mammalian DOCK proteins have been identified. These proteins lack the characteristic DH-PH module found in classical Dbl family GEFs. Instead they have two conserved DOCK homology regions (DHR). The DHR2 domain is responsible for nucleotide exchange activity, and is sufficient to catalyse nucleotide exchange in vitro (Brugnera et al., 2002). In contrast to DH family GEFs, the structure and catalytic mechanism of DOCK family GEFs have not been studied extensively. However a catalytic mechanism for DOCK family GEFs has been proposed based on a recent crystal structure of DOCK9 in complex with Cdc42 (Yang et al., 2009). Residues within the DHR2 domain insert in to the nucleotide-binding pocket of Cdc42 and interfere with magnesium-binding. In particular, a highly conserved valine residue blocks the magnesium-binding site. Magnesium ion is an essential cofactor for binding of nucleotides to GTPases, as it neutralizes the negative charge on the nucleotide. Nucleotide-binding is further perturbed by conformational changes in switch I of the GTPase, which result in disorganization of the nucleotide-binding site. In contrast to DH family GEFs (discussed above), binding of DOCK9 to Cdc42 does not affect the structure of switch II. The DHR1 domain of DOCK family GEFs binds phosphoinositides. This domain is not necessary for GTPase activation in vitro, but is necessary for membrane targeting of DOCK180 and GTPase activation in vivo (Cote et al., 2005). The DHR1 domain therefore seems to play an analogous role to the PH domain in Dbl family GEFs, at least some of which require their PH domain for membrane targeting (see above) GTPase activating proteins for Rho GTPases (Rho GAPs) GTPase activating proteins (GAPs) bind to GTP-bound forms of GTPases and enhance their GTPase activity. This results in inactivation of GTPase signalling pathways. The first Rho GAP to be identified was Bcr (breakpoint cluster region) (Diekmann et al., 1991), and since then a large family of related Rho GAPs has been identified (approximately 70 in humans) (Tcherkezian and Lamarche-Vane, 2007). Rho GAPs contain a conserved 150 amino acid Rho GAP domain that is sufficient to promote GTP 18
19 hydrolysis on Rho GTPases. Structural studies have shown Rho GAP domains are related to other Ras family GAPs, despite low sequence homology (Moon and Zheng, 2003). The Rho GAP domain comprises 9 α-helices and contains a highly conserved arginine residue in a loop region. Mutational analysis has shown this residue is essential for GAP activity, and structural studies have shown this residue forms part of the catalytic active site, the co-called arginine-finger, promoting GTP hydrolysis by directly contacting and stabilizing the transition state intermediate of the GTP hydrolysis reaction (Moon and Zheng, 2003). The GAP domain makes contacts with the conserved switch I and switch II regions of the GTPase, regions that become restructured upon GTP-binding. Like Rho GEFs, Rho GAPs show specificity for GTPase substrates, and contacts between the GAP and non-conserved regions of the GTPase contribute to this Regulation of Rho GEF and Rho GAP signalling The activity of Rho GTPases needs to be tightly regulated in the cell, both temporally and spatially. Initially it was thought that Rho GEFs are the major sites of regulation for Rho GTPase signalling pathways, but it is now clear that Rho GAPs play an important role too. In addition to conserved catalytic domains (DH, DHR2 and GAP), Rho GEFs and GAPs contain a huge variety of other functional domains, which are important for regulating GEF and GAP activity in the cell and for coordinating Rho GTPase signalling pathways (Rossman et al., 2005; Tcherkezian and Lamarche-Vane, 2007). This variety in domain organization means GEFs and GAPs are regulated in a variety of ways. These can broadly be grouped in to two types of regulation: direct regulation of catalytic activity, and regulation of signalling output by controlling Rho GEF and GAP localization and interaction with other components of signalling pathways. GEF and GAP catalytic activity can be directly regulated by post-translational modifications and protein-protein interactions. In some cases activation involves relief of autoinhibition. A number of Rho GEFs can be activated experimentally by 19
20 truncations, normally of the N-terminus, which suggests these GEFs are autoinhibited. The clearest example of relief of autoinhibiton as a regulatory mechanism is provided by Vav1. Vav1 is phosphorylated downstream of activated receptors by Src family kinases (SFKs), and this phosphorylation is necessary for activation. Structural studies show that the N-terminus of Vav1 contains an autoinhibitory domain that binds to the DH domain (Aghazadeh et al., 2000). Phosphorylation of tyrosine 174 in the autoinhibitory domain causes it to become unstructured, which disrupts the interaction with the DH domain and activates the GEF. α-chimaerin, a GAP for Rac, also seems be regulated by an autoinhibitory mechanism. Deletion of the N-terminus activates the GAP activity of α-chimaerin in vitro. This region contains a C1 domain, which binds lipids and phorbol esters. α-chimaerin is activated by binding of phosphatidylserine and phorbol esters, which might act by relieving N-terminal autoinhibition (Ahmed et al., 1993). A number of other GEFs and GAPs are regulated by phosphorylation. For example, CdGAP activity is inhibited in vitro by phosphorylation downstream of ERK (Tcherkezian et al., 2005), while RICS is inhibited by CaMKII (calcium/calmodulindependent kinase II) (Okabe et al., 2003). The GEF activity of Ras-GRF1 towards Rac is enhanced by Src phosphorylation (Kiyono et al., 2000). In these cases the structural details of how GEF and GAP activity are regulated by phosphorylation are not known. RGS (Regulator of G-protein signalling) domain-containing GEFs are activated by protein-protein interactions. These GEFs bind to heterotrimeric Gα subunits via their RGS domains and act as GAPs to turn off G protein signalling. Binding of Gα 13 to p115-rhogef enhances the GEF activity of p115-rhogef in vitro (Hart et al., 1998). This is not thought to involve relief of autoinhibition, because deletion of the RGS domain does not lead to constitutive activation of the GEF, which would be the case if the RGS domain had an autoinhibitory function (Wells et al., 2001). Instead Gα 13 might be playing a direct role in stimulating nucleotide exchange, as it binds to the DH- PH module in addition to the RGS domain (Wells et al., 2002). The Rho GAP ARAP3 is activated in vitro by GTP-bound Rap. Rap is a member of the Ras family of small GTPases and binds to a Ras-binding domain located adjacent to the GAP domain of 20
21 ARAP3, however it is not clear how Rap binding stimulates GAP activity (Krugmann et al., 2004). In the above examples the catalytic activity of the GEF and GAP domain is directly regulated. Another commonly used mechanism for regulating GEF and GAP activity in the cell is controlling the localization of GEF and GAP proteins and their interactions with other signalling molecules. GTPases normally function at membranes, and as describe above PH domains and DHR1 domains of GEFs can in some cases regulate the activity of GEFs in the cell by recruiting them to membranes. While Rho GAPs in general do not contain conserved lipid-binding domains, some do have lipid-binding domains, such as the C1 domain in chimaerins, which binds to diacylglycerol and targets chimaerins to cellular membranes (Caloca et al., 2001). Domains outside the conserved GEF and GAP catalytic domains can mediate a wide range of molecular interactions to control localization of Rho GEF and Rho GAP proteins. For example the Rho GEFs Ect2 and Net1 both contain nuclear localization signals that target them to the nucleus, where they are not able to access their substrate RhoA (Schmidt and Hall, 2002). Ect2 regulates cytokinesis, and its nuclear localization signal keeps it inactive during interphase. During mitosis, the nuclear envelope breaks down and Ect2 is released, and localizes to the cortex where the cleavage furrow forms. Activation of RhoA by Ect2 is necessary for cleavage furrow ingression and cell division (Kim et al., 2005; Yuce et al., 2005). The Rac GEF Tiam1 is required for tight junction formation in keratinocytes, during which Rac activation at nascent cell-cell contacts is thought to activate apkc. Tiam1 localizes to cell-cell contacts through its interaction with the scaffold protein Par3, which interacts with the N-terminal region of Tiam1, and this interaction restricts Rac activation to cell-cell contacts (Mertens et al., 2005). Failure to restrict Tiam1 activity to these sites, as occurs when Par3 is knocked down, results in inappropriate activation of Rac and tight junctions do not form properly (Chen and Macara, 2005). The Cdc42 GAP Rich1 is required for tight junction maintenance in epithelial cells, as Rich1 knockdown results in loss of epithelial barrier function (Wells et al., 2006). The function of Rich1 is dependent on its GAP activity, as expression of a GAP-defective mutant of Rich1 acts in a dominant-negative fashion 21
22 and also results in loss of barrier function. Overexpression of constitutively active Cdc42 also disrupts epithelial junctions (Kroschewski et al., 1999; Rojas et al., 2001), and Rich1 is thought to function by limiting the levels of GTP-Cdc42 at tight junctions. Rich1 is localized to tight junctions by an interaction with the scaffold protein Amot, involving a coiled-coil heterodimerization between Amot and the BAR domain of Rich1. The multidomain nature of Rho GEFs and Rho GAPs allows them to bind to multiple proteins simultaneously. Formation of large protein complexes can control which signalling pathways are regulated downstream of Rho GEFs and GAPs, and therefore regulate cellular activity. There are an increasing number of examples of Rho GEFs and GAPs in complexes with Rho effectors, either through interactions with scaffold proteins or by acting as scaffolds themselves (see section below) Rho GTPase effector proteins Rho GTPases regulate signalling pathways by binding to and regulating the cellular activities of effector proteins. A Rho effector protein is defined as a protein that interacts preferentially with the GTP-bound form of a Rho GTPase. A large number of Rho effectors have been identified (at least 90 in humans), including kinases, phosphatases, lipases, adaptors and scaffolds. Specificity exists between effectors and GTPases, such that particular GTPases interact with only a subset of effector proteins. Effector proteins thus need to distinguish between GTP- and GDP-bound forms of the GTPase, and between different Rho family members. Structural studies of GTPases bound to GDP and GTP have shown that conformational changes upon GTP-binding are limited to two short (about 15 amino acid) stretches on the surface of the protein, called switch regions (Ihara et al., 1998). Given the specificity of effectors for GTP-bound forms of the GTPase, these regions must be involved in effector binding, and structural studies have shown this to be the case (Bishop and Hall, 2000; Zhao and Manser, 2005). While switch II is almost identical between different Rho family members, switch I shows some significant amino acid 22
23 substitutions between Rho family members, and therefore contributes to the specificity seen between different GTPase:effector pairs. Indeed mutations in switch I, also called the effector loop, can interfere with specific effector interactions while leaving others unchanged (Sahai et al., 1998). GTPase-binding domains (GBDs) have been defined for some Rho effector proteins through mutational analysis. Conserved GBDs are present in some Rho effectors, and structural studies have shown how selective GTPase binding occurs (Bishop and Hall, 2000; Zhao and Manser, 2005). Several Cdc42 and Rac effectors contain a conserved CRIB motif (Cdc42 and Rac interactive binding), including PAK (p21-activated kinase), ACK (activated Cdc42-associated kinase) and WASP (Wiskott-Aldrich syndrome protein). The CRIB motif is a short stretch of 15 amino acids found within a larger GBD, which is typically about 50 amino acids in length. Structural studies of the GBDs of WASP, ACK and PAK bound to active Cdc42 have revealed a similar mode of interaction (Abdul-Manan et al., 1999; Morreale et al., 2000; Mott et al., 1999). Conserved residues in the CRIB motif form an intermolecular β-sheet with residues in the Switch I region of the GTPase. Residues within the GBD but outside the CRIB motif make extensive contacts with the switch regions and also non-switch regions of the GTPase. These contacts between the GBD and non-switch regions of the GTPase involve non-conserved residues, which explains the selectivity of GTPases for effector proteins, even amongst those containing CRIB domains. WASP and ACK, for example, bind specifically to Cdc42 but not to Rac, and make hydrophobic contacts with leucine 174 of Cdc42, which is not conserved in Rac. PAK1 binds to both Cdc42 and Rac, and does not make hydrophobic contacts with leucine 174 of Cdc42, but instead contacts other residues that are conserved between Cdc42 and Rac (Zhao and Manser, 2005). The RhoA effector PRK (PKC-related kinase, also called PKN, protein kinase novel) shows a completely different mode of GTPase interaction. The N-terminus of PRK contains three antiparallel coiled-coil repeats, named HR1a-c, which mediate GTPasebinding. The crystal structure of the HR1a domain from PRK1 in complex with RhoA shows it forms an antiparallel coiled-coil dimer, making contacts with both switch 23
24 regions of RhoA as well as non-switch regions, using a hydrophobic patch and also a number of charged residues (Maesaki et al., 1999). Importantly, the switch I residues making direct contacts with the PRK antiparallel coiled-coil are different from those making direct contact to CRIB motifs, and the contacting residues outside of the switch regions are not conserved between RhoA and Cdc42, explaining the observed specificity of binding. Conserved HR1 domains have also been found in other Rho effector proteins, including rhotekin and rhophilin (Bishop and Hall, 2000; Zhao and Manser, 2005). Rho kinase (ROK), also called ROCK (Rho coiled-coil kinase), is another Rho effector that has been studied structurally. ROCK binds to and is activated by RhoA, B and C but not Rac1 or Cdc42 (Zhao and Manser, 2005). ROCK, and the related Rho effector citron kinase, contain a coiled-coil region that mediates dimerization and contains a Rho-binding domain. Structural studies have shown this coiled-coil Rho-binding region forms contacts with RhoA using a similar hydrophobic patch to that observed with PRK (Dvorsky et al., 2004), although it should be noted that there is no sequence similarity between the coiled-coil regions of PRK and ROCK. Again ROCK makes a number of contacts with residues in RhoA that are not conserved in other GTPases such as Rac and Cdc42, which can account for the binding specificity. These structural studies highlight some general principles of how active Rho GTPases interact with their effector proteins. The switch regions of the GTPase, which become restructured when the GTPase is activated, make contacts with the GTPase-binding domain of the effector, allowing selectivity for the GTP-bound form of the GTPase, while interactions between non-conserved residues in the GTPase and the effector allow for selectivity between different GTPases and effectors. These general principles are likely to apply to other GTPase:effector interactions. However it should be noted that many effectors do not contain Rho-binding domains that can be recognized by sequence analysis, and identification of Rho effector proteins in general requires a biochemical approach. This is in contrast to Rho GEFs and GAPs, which can be identified on the basis of conserved GEF (DH and DHR2) and GAP domains. 24
25 1.2.6 Regulation of Rho effector proteins For an effector protein to relay signals from an active Rho GTPase to the cellular machinery its activity must be regulated by binding to the GTPase. Effector proteins are a diverse group of proteins with diverse functions and modes of regulation, but some general principles can be discerned. Many effector proteins are enzymes, including kinases, phosphatases and lipases, and their catalytic activity can be directly regulated by binding to the GTPase. Other effector proteins, such as adaptors and scaffolds, are regulated in the cell by changes in their localization or protein-protein interactions. PAK (p21-activated kinase) was the first kinase to be identified as an effector protein for Rho GTPases. PAKs are highly conserved in evolution. Genetic analysis in yeast has shown PAK plays important roles in regulating the actin cytoskeleton and MAPK signalling, and these functions are conserved in mammals (Hofmann et al., 2004). A total of 6 mammalian PAK proteins have been identified. These fall in to two subfamilies based on sequence homology and mode of regulation: class I PAKs (PAK1-3) and class II PAKs (PAK4-6) (Arias-Romero and Chernoff, 2008). PAK2 and PAK4 are ubiquitously expressed, while the other PAKs show more tissue specific expression profiles. All PAK proteins contain a C-terminal kinase domain and an N-terminal GTPase-binding domain (GBD). Outside of these domains class I and class II PAKs show no sequence homology. Class I PAKs bind to GTP-bound Rac1 and Cdc42. PAK1 also binds the related Rho GTPases Rac2, Rac3, TC10 and Wrch-1 (Zhao and Manser, 2005). The N-terminal GBD of PAK contains a conserved CRIB motif, described above. Binding of the GTPase enhances the kinase activity of class I PAKs. Mutational analysis suggested that the C-terminal GBD acts in an autoinhibitory fashion and defined an autoinhibitory region that overlapped with the GBD (Zhao et al., 1998). This was confirmed by structural studies of the autoinhibitory region bound to the kinase domain of PAK1 (Lei et al., 2000). This regulatory region, also called the inhibitory switch (IS), makes extensive contacts with the kinase domain, and blocks the kinase catalytic site. Binding 25
26 of active GTPase is predicted to alter the conformation of the IS region, resulting in dissociation from the kinase domain and relief of inhibition. Activated PAK autophosphorylates on a conserved threonine residue in the kinase domain (in the activation loop) to further activate the kinase domain, and also autophosphorylates residues in the autoinhibitory domain, which blocks binding to the kinase domain (Gatti et al., 1999). The catalytic activity of some other kinases, including ROCK and PRK, is also enhanced by GTPase-binding, and relief of autoinhibition seems to be a common mechanism of activation. Rho-kinase (ROCK) was the first kinase to be identified as an effector for RhoA. Two ubiquitously expressed mammalian ROCKs (ROCK1 and 2) are activated by RhoA, B and C but not by Rac1 or Cdc42 (Leung et al., 1996). ROCK activates myosin II by inhibiting myosin light chain (MLC) phosphatase and directly phosphorylating myosin light chain (MLC) (see section 1.3.1, below), and regulates cellular processes requiring actomyosin contraction, such as cytokinesis, migration and morphogenesis. ROCK proteins contain an N-terminal kinase domain, a central coiledcoil homodimerization domain, and C-terminal PH domain. The Rho-binding domain has been mapped to the C-terminal end of the coiled-coil region. Deletion of the C- terminus of ROCK1, including the Rho-binding domain, increases the activity of the N- terminal kinase domain, while expression of the C-terminal fragment inhibits activation of ROCK (Amano et al., 1999), suggesting an autoinhibitory mechanism. Binding of Rho to the Rho-binding domain is presumed to relieve this autoinhibition, but structural details are not known. Relief of autoinhibition is used to activate other non-kinase effectors, including the WASP (Wiskott-Aldrich syndrome) proteins. WASP, and the related N-WASP, are adaptor proteins linking Rho GTPases to the Arp2/3 actin nucleation complex (Millard et al., 2004). WASP proteins bind to the Arp2/3 complex, which results in activation of Arp2/3-dependent actin polymerization. WASP and N-WASP are effector proteins for Cdc42, and contain a CRIB motif in their N-terminus (Aspenstrom et al., 1996; Symons et al., 1996). In vitro, activation of the Arp2/3 complex by N-WASP is dependent on GTP-bound Cdc42 and PtdInsP 2, which bind cooperatively to N-WASP and relieve an 26
27 autoinhibitory interaction between its N-terminal regulatory domain and its C-terminal WCA region (which activates the Arp2/3 complex, see section below) (Prehoda et al., 2000; Rohatgi et al., 1999). In the autoinhibited state, the CRIB domain makes contacts with the C (central) domain of the WCA region, resulting in a closed inactive conformation. GTP-bound Cdc42 binds to the CRIB domain of N-WASP, while PtdInsP 2 binds to the adjacent basic region, resulting in conformational activation of the Arp2/3 complex. This autoinhibition model is supported by the observation that the C- terminal WCA region of N-WASP, lacking the N-terminal regulatory domain, is a much stronger activator of the Arp2/3 complex than full length N-WASP, and indeed does so in a Cdc42-independent manner. Biochemical purification and characterization of the haematopoietic-specific WASP revealed a similar cooperative regulation by GTP- Cdc42 and PtdInsP 2, and the crystal structure of WASP confirmed that the CRIB motif binds to the C-terminal WCA domain. (Higgs and Pollard, 2000). Another mechanism used to regulate the activity of Rho effector proteins is dimerization. MLKs (mixed-lineage kinases) are serine/threonine kinases activated by Cdc42 and Rac (Zhao and Manser, 2005). They are MAP kinase kinase kinases (MAPKKKs) and act upstream of MAPK cascades. Like PAK they contain a conserved CRIB motif in their GTPase-binding domain, which is required for binding to Cdc42 and Rac, but in contrast to PAK and the other kinases discussed above, activation is not thought to involve relief of autoinhibition. These kinases dimerize through their leucine zipper domains, and GTPase-binding activates the kinase by promoting dimerization, but the structural details are not known (Leung and Lassam, 1998). A number of Rho effectors are not activated by GTPase-binding, but instead are regulated by changes in localization and protein-protein interactions induced by GTPase-binding. The class II PAKs, PAK4-6, are regulated very differently than class I PAKs discussed above. They bind to active Cdc42, but only very weakly to active Rac (Abo et al., 1998; Dan et al., 2002). This difference in specificity is likely to result from sequence differences in the GTPase-binding domains of class I and class II PAKs, which show low homology outside of the conserved CRIB motif. In contrast to class I PAKs, class II PAKs are not autoinhibited and their kinase activity is not enhanced by 27
28 GTPase binding. GTPase binding is thought to regulate the activity of class I PAKs in the cell by regulating their localization. PAK4, for example, is recruited to the Golgi by active Cdc42 where it regulates actin structures (Abo et al., 1998). IRSp53 and PIR121 are adaptor proteins and Rac effectors that link Rac activation to Arp2/3-dependent actin assembly through the WAVE proteins (see section below). IRSp53 binds via its SH3 domain to the proline rich region of WAVE, and activates WAVE in in vitro Arp2/3-dependent actin polymerization assays. However this activation is not enhanced by addition of GTP-bound Rac1, and in vivo Rac is thought to regulate IRSp53 by controlling its localization. In agreement with this IRSp53 localizes to Rac-dependent lamellipodia in fibroblasts (Miki et al., 2000). PIR121 is another Rac effector that forms a complex with WAVE proteins, but there is some controversy as to how this complex is regulated. One group found that WAVE2 in a complex including PIR121 is active in terms of Arp2/3-dependent actin polymerization, and addition of GTP-Rac did not enhance this activity, again suggesting Rac is regulating the PIR121-WAVE2 complex by controlling its localization (Innocenti et al., 2004). Another group found WAVE1 to be in a similar complex including PIR121, but in this study the complex was inactive. Binding of GTP-Rac to PIR121 disrupted the complex, resulting in activation of WAVE1 (Eden et al., 2002). In this case the effector protein is being regulated by changes in protein-protein interactions induced by GTPase-binding Organization of Rho GTPase signalling pathways Signal transduction pathways need to be tightly controlled to ensure the cell responds appropriately to signals. This is particularly true in the case of Rho GTPases, as they have the potential to regulate a large number of effector proteins to control a variety of responses. Coupling upstream signals with the correct downstream effector protein allows for signalling specificity. Scaffold proteins are multidomain proteins that can simultaneously bind to multiple proteins, and so can coordinate signal transduction pathways by biasing upstream signals to specific downstream responses. There are an increasing number of examples of Rho GEFs and Rho GAPs in biochemical complexes 28
29 with Rho effector proteins, which allows regulation of Rho activity to be tightly coupled to specific effector pathways. Rho GEFs and GAPs are themselves multidomain proteins with the potential to act as scaffolds. The large number of Rho GEFs (approximately in 80 humans) and Rho GAPs (approximately 70 in humans) identified compared to Rho GTPases (20 in humans) is consistent with them playing a role in determining signalling specificity, as different upstream regulators could potentially couple the same GTPase to different downstream targets under different conditions. The Cdc42 GEF intersectin binds to the Cdc42 effector protein N-WASP (Hussain et al., 2001). Intersectin regulates clathrin-dependent endocytosis and localizes to clathrin-coated vesicles. N-WASP activates the Arp2/3 complex downstream of Cdc42 to promote actin polymerization, which is required for transport of endocytic vesicles. Active Cdc42 generated by intersectin is therefore coupled specifically to the N-WASP effector pathway to regulate endocytosis. Interestingly CdGAP, a GAP for Cdc42, also interacts with intersectin, and this might be important for tightly regulating the activity of N-WASP (Jenna et al., 2002). During leukocyte chemotaxis Cdc42 activates its effector PAK1. PAK1 is in a complex with the Cdc42 GEF α-pix, which allows Cdc42 activation to be coupled to PAK1 activation (Li et al., 2003). The Rac specific GEF Tiam1 binds to the scaffold protein Par3, which is found in a complex with the Rac (and Cdc42) effector protein Par6 (Mertens et al., 2005). Rac activation by Tiam1 in keratinocytes is required to regulate Par6 and promote tight junction formation (see section below), and the interaction between Tiam1 and Par3 couples Rac activation to Par6. Activation of RhoA by its GEF p115rhogef leads to activation of the JNK MAPK pathway, which requires MLK2 (a MAPKKK) and MKK7 (a MAPKK). p115rhogef, MLK2 and MKK7 are all found in a complex with the scaffold protein CNK1, although in this case the direct effector protein for RhoA in this pathway is not known (Jaffe et al., 2005). 29
30 The above examples illustrate how protein complexes involving scaffold proteins, Rho GEFs, Rho GAPs and Rho effectors can impart specificity on Rho GTPase signalling pathways to activate appropriate responses. 1.3 Basic functions of Rho GTPases Rho GTPases control a number of basic cellular processes, including the organization of the actin and microtubule cytoskeletons, membrane trafficking events and gene transcription (see Figure 1.1 in section 1.1). The ability of Rho GTPases to regulate these processes is dependent on their regulation of effector proteins, as discussed in section (above) Regulation of the actin cytoskeleton Early experiments in fibroblasts showed that the three best characterized Rho family members, RhoA, Rac1 and Cdc42, regulate the formation of distinct actin structures, namely stress fibres, lamellipodia and filopodia respectively (Nobes and Hall, 1995; Ridley and Hall, 1992; Ridley et al., 1992). Stress fibres are bundles of actin and myosin II filaments, which exert tension on the cell when anchored to the extracellular matrix via integrin-dependent focal adhesions, and can contract when cell-matrix interactions are released. Lamellipodia and filopodia are distinct types of actin-rich membrane protrusions formed as a result of actin polymerization. Lamellipodia are broad membrane protrusions formed by a branched actin filament network beneath the plasma membrane. When lamellipodia detach from the underlying substrate they can move across the cell surface, and are known as membrane ruffles. Filopodia are long finger-like membrane protrusions containing linear bundles of polymerized actin. Since these observations were made, the Rho family GTPases have emerged as key regulators actin polymerization and organization, and therefore control a number of cellular processes such as migration, division and morphogenesis. The actin cytoskeleton is 30
31 regulated by Rho GTPases in two principle ways: they can stimulate actin polymerization or induce actin filament bundling and contraction a Actin polymerization There are two main ways in which actin polymerization can be stimulated: nucleation of new filaments or elongation of existing filaments. Nucleation of new actin filaments from actin monomers is thermodynamically unfavourable, as actin dimers are unstable. Two major actin nucleators exist in cells to stimulate new filament assembly, the Arp2/3 complex and the formins. Actin filaments have an intrinsic polarity, with a barbed end and a pointed end, named after their appearance in EM studies. Actin monomers, if above critical concentration, will spontaneously assemble at the barbed end of an existing filament in vitro, but in the cell barbed ends are normally capped by capping proteins. Free barbed ends can be generated by uncapping or severing of actin filaments. The Arp2/3 complex - The Arp2/3 complex is a 7-protein complex that initiates nucleation of new actin filaments on the side of existing filaments, leading to branched actin networks (Millard et al., 2004). Two of the proteins from this complex, Arp2 and Arp3, are actin-related proteins. Actin dimers are unstable, and the rate-limiting step in actin filament nucleation is the formation of actin trimers. The Arp2/3 complex stimulates actin filament nucleation by mimicking an actin trimer, with its two Arp subunits binding an actin monomer. The complex was first isolated biochemically from Acanthamoeba (Machesky et al., 1994). The human Arp2/3 complex was subsequently isolated from platelets as a complex capable of initiating actin comet formation on the pathogenic bacterium Listeria monocytogenes (Welch et al., 1997). Bacteria are transported in host cells by stimulating actin polymerization at the surface of their membrane. The Arp2/3 complex is found localized to these actin tails of cells infected with pathogenic bacteria and to lamellipodia of fibroblasts. A clear role for the Arp2/3 complex in lamellipodia formation was first demonstrated using blocking antibodies to block Arp2/3 activity, which prevented EGF-induced lamellipodia formation (Bailly et al., 2001). 31
32 The Arp2/3 complex alone has low actin polymerizing activity and needs to be activated. One family of proteins that activates the Arp2/3 complex, and does so downstream of Rho GTPases, is the WASP (Wiskott-Aldrich syndrome protein) family. Wiskott-Aldrich syndrome (WAS) is an immune disease characterized by recurrent infections as a result of defects in T and B cell function. Cytoskeletal and chemotactic defects are found in haematopoietic cells from WAS patients. Various loss of function mutations were found in the WASP gene in WAS patients (Derry et al., 1994). WASP is expressed exclusively in haematopoietic cells, but a homolog N-WASP was later found in neurons, and is ubiquitously expressed. Three more genes in the WASP family have since been discovered, WAVE -1,-2 and -3 (WASP family verprolin homologous, also called Scar), making 5 WASP family members in total in mammals (Millard et al., 2004). WAVE2 is expressed ubiquitously, whereas WAVE1 and 3 are found mostly in brain. WASP proteins are characterized by the presence of a conserved C-terminal module that activates the Arp2/3 complex. This region contains three domains, the WH2 domain, the central domain, and the acidic domain, and so together is referred to as the WCA domain. The WH2 domain (WASP homology 2) binds to profilin-actin. The central domain is involved in autoinhibition, by binding to the N-terminal CRIB domains of WASP and N-WASP (see section 1.2.6), and might also be involved in activation of the Arp2/3 complex. The acidic domain is responsible for binding to the Arp2/3 complex. WASP and N-WASP differ from WAVE proteins in their N- terminus. WASP and N-WASP have a conserved WH1 (WASP homology 1) domain, which is involved in regulatory protein-protein interactions (this domain binds to the inhibitor WIP, WASP interacting protein, see below); a CRIB motif (Symons et al., 1996); and an adjacent basic region which binds to PtdInsP 2 (Prehoda et al., 2000). WAVE proteins have at their N-terminus a SHD (Scar homology domain) and a basic region of unknown function. Importantly, WAVE proteins do not contain a CRIB motif, and unlike WASP and N-WASP are not Rho GTPase effector proteins, although they are regulated downstream of Rho GTPases (see below). 32
33 As described earlier (section 1.2.6) WASP is an effector protein for Cdc42, and binding of active Cdc42 can activate WASP by relieving an autoinhibitory interaction. N- WASP can also be activated by another Cdc42 effector protein, Toca-1 (transducer of Cdc42-dependent actin assembly) (Ho et al., 2004). In the cell N-WASP is found in an inactive complex with an inhibitory protein, WIP (WASP-interacting protein), and Toca-1, acting downstream of Cdc42, is required to activate N-WASP and stimulate the Arp2/3 complex, although the details are not known. N-WASP was proposed to be the effector protein linking Cdc42 to filopodia formation, because dominant negative N-WASP or blocking antibodies against N-WASP inhibit Cdc42 dependent filopodia formation (Miki et al., 1998a). Similar results were found with TC10 and TCL, which induce filopodia formation that was blocked by dominant negative N-WASP (Abe et al., 2003). However N-WASP null fibroblasts (which also lack WASP) can still form filopodia in response to growth factors, suggesting WASP activity is not essential for filopodia formation (Snapper et al., 2001). N-WASP also does not seem to play a major role in lamellipodia formation, as N-WASP null fibroblasts or HeLa cells depleted of N-WASP by RNAi both form lamelipodia and membrane ruffles normally when stimulated by growth factors (Innocenti et al., 2005). N-WASP has been localized to lamellipodial protrusions though, where it might contribute to lamellipodia formation indirectly through membrane trafficking (see section below) (Ridley, 2006). Scar/WAVE proteins also bind to and activate the Arp2/3 complex, via their conserved C-terminal VPA domain. In contrast to WASP, purified WAVE is active in in vitro Arp2/3-dependent actin polymerization assays (Machesky et al., 1999). This is because WAVE lacks the N-terminal autoregulatory domain and is not autoinhibited. In vivo, WAVE is found in a multi-protein complex containing Abi (Abl-interacting protein), Nap1 (sometimes called Nap125, Nck-associated protein) and PIR121, and sometimes HSPC300. PIR121 is an effector protein for Rac, which provides a potential mechanism for WAVE-Arp2/3-dependent actin assembly to be regulated by Rac. As described earlier (section 1.2.6), there is some disagreement in how Rac-binding to PIR121 results in activation of WAVE. In one model, Rac recruits the PIR121-WAVE 33
34 complex to sites of actin polymerization, such as lamellipodia (Innocenti et al., 2004), while in another model the PIR121-WAVE complex is inactive and Rac-binding to PIR121 disrupts the complex to release active WAVE (Eden et al., 2002). A second Rac effector that can mediate activation of WAVE downstream of Rac is IRSp53. Rac recruits the IRSp53 to sites of actin polymerization ((Miki et al., 2000). WAVE proteins have a clear role in Rac-dependent lamellipodia formation and membrane ruffling. WAVE proteins have been localized to membrane protrusions, where Rac is known to be active. Expression of a WAVE mutant lacking the WH2 domain, expected to act as a dominant negative, blocks Rac-dependent ruffling (Miki et al., 1998b). Depletion of WAVE2 from HeLa cells prevents Rac-dependent membrane protrusions (Innocenti et al., 2004). Finally WAVE2-null fibroblasts have severe defects in Rac-dependent membrane ruffling and lamellipodia formation, with inhibition of PDGF-induced migration (Yan et al., 2003). Diaphonous-related formins - The second main way in which new actin filaments are assembled is through the formins, which dimerize and promote nucleation of unbranched filaments. All formins contain a conserved FH2 domain, essential for actin filament nucleation, flanked by a conserved proline-rich FH1 domain which binds profilin-actin and facilitates actin polymerization (Kovar, 2006). Once a filament has been nucleated, the formin dimer remains attached to the growing barbed end, preventing it form being capped by capping proteins and allowing the formation of long actin filaments. This mode of elongation is called processive. A subset of formins, the diaphonous-related formins (DRFs), are regulated by Rho GTPases (Wallar and Alberts, 2003). There are three mammalian DRFs, DRF1-3. These proteins are named after the Drosophila protein Diaphonous, mutation of which gives rise to polyploid germ cells as a result of defective cytokinesis. The mammalian Diaphonous proteins are also referred to as Dia1, Dia2 and Dia3. Confusingly, mdia2 is the mouse homologue of human Dia3 (both of which are DRF3), while mdia3 is the mouse homologue of human Dia2 (both of which are DRF2). 34
35 DRFs contain N-terminal GTPase-binding domains (GBDs) that interact with a number of Rho family members in a GTP-dependent manner, including RhoA, RhoD, Cdc42 and Rif (Alberts, 2001; Gasman et al., 2003; Pellegrin and Mellor, 2005; Watanabe et al., 1997). GTPase-binding is thought to activate DRFs by relieving an inhibitory intramolecular interaction between the GBD and a C-terminal domain called the DAD (Dia autoregulatory domain), which holds the protein in a closed inactive conformation (Alberts, 2001). DRFs mediate the formation of filopodia downstream of Rho GTPases. Cdc42-induced filopodia are blocked by microinjection of DRF3 blocking antibodies or expression of dominant-negative DRF3 (Peng et al., 2003). Similarly Rif induces filopodia in HeLa cells, and this is blocked by expression of dominant-negative mdia2 (Pellegrin and Mellor, 2005). DRFs have also been implicated in lamellipodia formation and membrane ruffling downstream of RhoA. FRET-based probes have been used to localize active RhoA in migrating cells, and surprisingly some activity was found at the front of the cells in association with membrane protrusions, in addition to the rear of the cell where it plays an established role in tail retraction (Kurokawa and Matsuda, 2005). RhoA at these membrane protrusion is thought to be acting through DRFs, where mdia1 has been localized. However it is not clear if the role of mdia1 at the leading edge is to assemble F-actin, and it is likely to be playing an additional role in microtubule stabilization (see section below). Another role for DRF-dependent actin polymerization is in stress fibre formation downstream of Rho. Rho-induced stress fibre formation was initially thought to involve bundling of existing filaments rather than polymerization (Machesky and Hall, 1997). However live imaging studies have shown that some stress fibres do form by actin polymerization (Hotulainen and Lappalainen, 2006), and this is blocked by mdia1 knockdown. Cofilin/ADF - Actin polymerization can also be stimulated by the severing of existing actin filaments, which generates new barbed ends. Actin monomers will spontaneously assemble on the barbed end of an actin filament until the filament becomes capped by a capping protein. Cofilin is a small (19kD) actin-binding protein that binds to and severs actin filaments leading to barbed end elongation (Desmarais et al., 2005). Cofilin also 35
36 stimulates pointed end depolymerization and is also called ADF (actin depolymerizing factor). Cofilin regulates membrane protrusion at the leading edge of migrating cells by stimulating actin assembly, while also stimulating actin recycling by depolymerizing the pointed ends of filaments behind the leading edge (Chan et al., 2000). Cofilin cooperates with the Arp2/3 complex to generate membrane protrusions (Bailly et al., 2001). Phosphorylated cofilin (which is inactive) is excluded from lamellipodia in fibroblasts (Dawe et al., 2003), and expression of active LIMK to phosphorylate and inactivate endogenous cofilin caused defects in polarized migration. A clear role for cofilin in actin assembly at the leading edge was shown using photoactivatable mutant of cofilin. Activation of cofilin locally at the cortex lead to the generation of barbed ends, actin polymerization, and lamellipodia formation and determined the direction of cell migration (Ghosh et al., 2004). Cofilin can be negatively regulated by phosphorylation of serine3 downstream of LIMK1/2, which in turn can be phosphorylated and activated by PAKs (p21-activated kinases) and ROCK, downstream of active Rac/Cdc42 and Rho respectively (Burridge and Wennerberg, 2004; Dan et al., 2001). Furthermore, cofilin can be activated by dephosphorylation of serine3 by slingshot phosphatases (SHH), and PAK4 can phosphorylate and inhibit SHH1 (Soosairajah et al., 2005). Active forms of PAK proteins induce similar effects on the actin cytoskeleton to active Rac and Cdc42, for example filopodia, membrane ruffling, and loss of stress fibres and focal adhesions (Dan et al., 2001; Manser et al., 1997; Qu et al., 2001; Sells et al., 1997). However it is not clear what role, if any, signaling through PAK-LIMK-cofilin plays downstream of Rho GTPases in these processes. Some of the effects of active PAK4 are blocked by kinase-dead LIMK, such as formation of cytoplasmic F-actin clusters, but whether filopodia formation requires the LIMK-cofilin pathway has not been tested. PAK1- induced ruffling does not require kinase activity, so presumably is not acting through LIMK, and in any case cofilin needs to be activated at the leading edge to promote membrane protrusion, not inhibited as would happen if it was being regulated by PAK. Inhibition of cofilin downstream of Rho-ROCK-LIMK might be important in SF formation; inhibition of the deploymerizing activity of cofilin could help stabilize actin filaments (see section 1.3.1b below) (Burridge and Wennerberg, 2004). 36
37 1.3.1b Actin filament bundling and contraction The second major way in which Rho GTPases regulate the actin cytoskeleton is by controlling filament bundling and contraction, exemplified by Rho-dependent stress fibre formation. Stress fibres are thick bundles of actin filaments and myosin II motor protein that can be linked to the ECM to provide adhesion and tension, and can control cell shape and contraction during migration and division. The major pathway involved in regulating bundling and contraction of actin filaments downstream of Rho is the ROCK pathway. ROCK (Rho coiled-coil kinase) is activated by GTP-bound RhoA, and this leads to phosphorylation and activation of myosin light chain (MLC) through direct ROCK-dependent phosphorylation, and ROCK-dependent phosphorylation and inhibition of MLC phosphatase. Activated myosin binds to and bundles actin filaments, and through its ATPase-dependent motor activity causes bundled filaments to contract if they are not anchored via integrins to the extracellular matrix. ROCK also phosphorylates and activates LIMK, which inhibits the actin severing and deploymerizing protein cofilin and might contribute to formation of stable stress fibres (Burridge and Wennerberg, 2004). Another Rho effector that stimulates actomyosin contractility through phosphorylation of MLC is the kinase citron. The kinase domain of citron kinase is homologous to that of ROCK, and outside of the kinase domain citron has a similar domain organization to ROCK, including a coiled-coil region with a GTPase-binding domain for RhoA. Citron seems to function primarily in cytokinesis, a process that depends heavily on actomyosin contraction (Madaule et al., 1998) Regulation of the microtubule cytoskeleton The microtubule cytoskeleton organizes the interior of cells by controlling the movement of vesicles and organelles, and in interphase cells has important roles in controlling polarization and migration. In mitotic cells the microtubule cytoskeleton forms the mitotic spindle and is essential for chromosome segregation. Microtubules 37
38 are polymers of α- and β-tubulin heterodimers. Microtubule polymers show an intrinsic polarity, with a stable minus end normally anchored at the centrosome, and a highly dynamic plus end capable of rapidly switching between polymerization and depolymerization. Microtubule dynamics can be regulated by a large family of MAPs (microtubule-associated proteins) (Akhmanova and Steinmetz, 2008). These proteins regulate microtubule dynamics in a number of ways, including binding to soluble tubulin heterodimers and controlling their availability for microtubule elongation (eg. Stathmin and CRMP-2), binding to microtubule plus ends and regulating plus end polymerization, depolymerization, or stabilization (eg. EB1, CLIP170 and APC), and finally binding to the microtubule array in general and controlling its stability (eg. Tau). A subset of MAPs are motor proteins, such as the kinesins and dyneins, which move along microtubules towards the plus and minus ends respectively, and play important roles in trafficking of associated cargo. Rho GTPases have been implicated in the regulation of microtubule polymerization and microtubule stabilization by binding to a number of MAPs, including tubulin dimer binding proteins and microtubule plus end binding proteins. Microtubule polymerization - CRMP-2 (collapsin response mediator protein) binds to microtubules and to tubulin dimers and enhances the rate of tubulin polymerization in vitro. In cells CRMP-2 becomes incorporated in to microtubules, and is thought to promote plus end elongation by binding to growing plus ends and enhancing polymerization (Fukata et al., 2002b). The Rho effector protein ROCK phosphorylates CRMP-2, resulting in MT disassembly and growth cone collapse in neurons, which can also be induced by LPA in a Rho-ROCK-dependent manner (Arimura et al., 2000). Stathmin also binds to microtubule plus ends and to tubulin dimers, but in contrast to CRMP-2 it depolymerizes microtubules and prevents incorporation of tubulin in to microtubules. Stathmin activity can be inhibited by phosphorylation on a number of residues, including serine 16. Phosphorylation of this residue occurs downstream of active Rac and Cdc42, and is likely to be mediated through PAK (Daub et al., 2001). Microtubule stabilization - Dynamic microtubules can be stabilized at the cell periphery by the action of capping proteins, and this is also regulated by Rho GTPases. 38
39 Active Rho promotes microtubule stabilization in fibroblasts through its effector mdia1 (Palazzo et al., 2001). Stabilization of microtubules requires the plus end binding proteins EB1 and APC. EB1 binds to the plus end of dynamic microtubules and stimulates their elongation, while the plus ends of stable microtubules are found to contain both EB1 and APC. EB1 and APC interact with each other, and also interact with mdia1, which colocalizes with EB1 and APC at the tips of stable microtubules in polarized fibroblasts (Wen et al., 2004). RhoA is known to be active at the leading edge of migrating cells, and its role there might be to activate mdia1 and stabilize microtubules in a polarized manner through EB1 and APC (Kurokawa and Matsuda, 2005). Rac and Cdc42 have also been implicated in the stabilization of microtubules at the cell cortex, through their effector proteins IQGAP and Par6. IQGAP1 binds to CLIP170, another microtubule plus end-binding protein, and this interaction is enhanced by binding of GTP-Rac or Cdc42 to IQGAP1 (Fukata et al., 2002a). IQGAP1 localizes to the leading edge of migrating fibroblasts, and is thought to stabilize microtubules there through its interaction with CLIP170 and cortical actin filaments. IQGAP1 also binds to APC, and both APC and IQGAP1 are required for stabilization of CLIP170-positive microtubule plus ends at the leading edge of fibroblasts, and for directed cell migration (Watanabe et al., 2004). Par6, with its associated kinase apck, is recruited to the leading edge of astrocytes in response to Cdc42 activation, and this results in localized inhibition of GSK3-β (Etienne-Manneville and Hall, 2003). This localized inhibition is required for the association of APC, a known substrate of GSK3-β, with EB1 at the plus ends of microtubules Regulation of membrane trafficking Rho GTPases regulate various aspects of membrane trafficking, including the transport of vesicles between different organelles in both the secretory and endocytic pathways, and the membrane fusion and fission events occurring during exocytosis and endocytosis (Ridley, 2006). 39
40 Vesicle trafficking - Cdc42 is partly localized at the Golgi in many cells, and has been implicated in vesicle trafficking between the ER and Golgi, in both the anterograde (ie. ER to Golgi) (Wu et al., 2000) and retrograde (ie. Golgi to ER directions) (Luna et al., 2002). Transport vesicles between the ER and Golgi are coated with the COPI complex (coat protein complex I), including Arf1 and coatomer proteins. γ-coatomer is an effector protein for Cdc42, as it interacts specifically with GTP-bound Cdc42. Cdc42 has been localized to COPI vesicles associated with the Golgi complex, and might play a role in regulating COPI-coated vesicle formation (Wu et al., 2000). Cdc42 is also required for the trafficking of vesicles between other membrane compartments, such as the Golgi to the basolateral membrane of MDCK cells (Musch et al., 2001) and in the movement of secretory vesicles to the plasma membrane in PC12 cells (Gasman et al., 2004). Cdc42 can regulate the movement of vesicles by stimulating Arp2/3-dependent actin polymerization on the membrane surface of the vesicle. This phenomenon of actin-driven vesicle movement was first seen in cells infected with pathogenic bacteria such as Listeria monocytogenes, which directly activate the Arp2/3 complex at their membrane resulting in the formation of an actin comet, which transports the bacterium inside the host cell (Welch et al., 1997). Cdc42 can activate the Arp2/3 complex indirectly, through the WASP family of adaptor proteins (see section above). N-WASP, like the Arp2/3 complex, has been implicated in vesicle trafficking (Gasman et al., 2004; Luna et al., 2002). Endocytosis - Both Rac1 and RhoA negatively regulate clathrin-dependent endocytosis, as expression of constitutively active mutants prevented internalization of the EGF receptor (Kaneko et al., 2005; Malecz et al., 2000). In the case of Rac, inhibition of endocytosis occurs through its effector synaptojanin2, a PI-5 phosphatase that dephosphorylates PtdIns(4,5)P 2. PtdIns(4,5)P 2 stimulates endocytosis as it binds to the adaptor protein AP2 to enhance its interaction with clathrin, and also binds to and activates the GTPase dynamin, which is required for vesicle fission (Jost et al., 1998). Active Rac1 can therefore inhibit endocytosis by activating synaptojanin2 at the plasma membrane, which in turn results in decreased levels of PtdIns(4,5)P 2. In the case of RhoA, inhibition of clathrin-dependent endocytosis might occur through its effector 40
41 protein ROCK (Kaneko et al., 2005). ROCK phosphorylates endophilin, an endocytic accessory protein that binds to lipid bilayers to regulate clathrin-coated pit formation and also binds to dynamin to regulate vesicle fission. Exocytosis - The exocyst complex is a conserved protein complex that regulates vesicle docking and fusion at the plasma membrane. In yeast, GTPases including Cdc42 regulate the localization and activity of the exocyst complex at the plasma membrane, which is important for establishing membrane polarity (Wu et al., 2008). In mammals Cdc42 and the closely related Rho family member TC10 stimulate exocytosis (Gasman et al., 2004; Inoue et al., 2003), and in the case of TC10 this has been shown to involve recruitment of the exocyst complex component Exo70 to the plasma membrane. The role of Rho GTPases is regulating exocyst complex-dependent exocytosis therefore seems to be conserved in mammals Regulation of gene expression Rho GTPases regulate gene expression through a number of different signalling pathways, including MAP kinase pathways and the serum response factor (SRF). MAP kinase pathways - MAPK (mitogen-activated protein kinase) signalling pathways convey cellular signals to regulate nuclear transcription factors and gene expression, and control proliferation, differentiation and survival (Turjanski et al., 2007). MAPK signalling cassettes consist of a MAPK kinase kinase (MAPKKK), a MAPK kinase (MAPKK) and a MAPK, which are evolutionarily conserved protein kinases that phosphorylate and activate each other in a sequential manner. Activated MAPKs phosphorylate and activate transcription factors, including TCF (ternary complex factor), c-myc, c-jun and c-fos. There are three main MAPK families, the ERK family (extracellular signal-regulated kinase, ERK1 and ERK2), the JNK family (c-jun N-terminal kinase, JNK1-3, also called SAPK, stress-activated protein kinase), and the p38 family (p38-α,-β,-γ,-δ). Rho, Rac and Cdc42 have all been found to activate the JNK pathway under various conditions (Coso et al., 1995; Jaffe et al., 2005; Minden et al., 1995), while Rac and Cdc42 also activate the p38 pathway (Bagrodia et 41
42 al., 1995; Frost et al., 1997). A number of MAPKKKs are direct effector proteins for Rho-family GTPases, and this is a potential mechanism for Rho GTPases to regulate MAPK pathways. MLK2 and MLK3, for example, bind to active Rac and Cdc42, and are activated by GTPase-dependent dimerization (Leung and Lassam, 1998; Zhao and Manser, 2005). MEKK1 and MEKK4 also bind to active Rac and Cdc42, and Rac/Cdc42-dependent JNK activation is blocked by expression of kinase-dead MEKK1 or MEKK4 (Fanger et al., 1997). MEKK1 is also activated by GTP-bound RhoA, which could provide a mechanism for Rho to activate the JNK pathway (Gallagher et al., 2004). While Rho GTPases do not in general activate the ERK pathway, they have been found to cooperate with the Ras-Raf pathway to activate ERK in some cases. The Rac and Cdc42 effector PAK1 phosphorylates MEK1, the MAPKK in the pathway, and while this does not affect the kinase activity of MEK1 towards ERK1, it does increase the affinity of MEK1 for Raf, the MAPKKK in the pathway (Frost et al., 1997). Serum response factor - A number of genes whose expression is regulated by growth factors or serum contain serum response elements (SRE) in their promoters, including c-fos and actin (Miralles et al., 2003). Transcription of these genes is stimulated by Rho acting through the serum response factor (SRF), which binds directly to the SRE. This regulation is thought to be mediated, at least in part, through actin polymerization. SRF is active when in a complex with its coactivator, MAL, which also binds to G- actin. Nuclear localization of MAL is regulated by cytoplasmic levels of G-actin, such that when actin polymerization is stimulated by Rho and G-actin levels decrease, MAL translocates to the nucleus. It should be noted, however, that additional regulatory mechanisms must be involved, as actin polymerization does not always lead to SRF activation. Rac and Cdc42, for example, are weak activators of SRF even though they strongly stimulate actin polymerization (Jaffe and Hall, 2005). 42
43 1.4 Epithelial morphogenesis and apical junctions The term epithelial morphogenesis refers to the complex series of events leading to the formation of a mature epithelial structure. During the development of a multicellular organism the proliferation, differentiation, migration and adhesion of epithelial cells are coordinately regulated to form adult tissues and organs. During disease states, such as cancer, these processes are misregulated, leading to disorganization of epithelial structures and tumour formation. Epithelial cells are a specialized cell type that form selectively permeable barriers between different compartments of a multicellular organism. Simple epithelia consist of a single layer of epithelial cells that play essential roles in homeostasis by regulating adsorption and secretion of molecules in to and out of organs. The ability of epithelial cells to form selectively permeable barriers is dependent on the formation of cell-cell junctions and the establishment of cell polarity. Cell-cell junctions, including adherens junctions and tight junctions, are formed by the interaction of integral plasma membrane proteins between neighbouring cells. Adherens junctions are principally involved in cell-cell adhesion, while tight junctions provide the barrier function by preventing the diffusion of molecules through the paracellular space between cells. Tight junctions form charge- and size-selective pores, allowing movement of ions across epithelia in a regulated manner. Cells within an epithelium are polarized, with an apical surface facing a fluid-filled lumen or the exterior, and a basolateral surface making cell-cell and cell-matrix contacts. Differential localization of channels and transporters on the apical and basolateral surfaces allows epithelial cells to control adsorption and secretion The apical junctional complex (AJC) Epithelial junctions consist of transmembrane cell adhesion molecules that interact with cell adhesion molecules on neighbouring cells via their extracellular domains, and interact with soluble cytoplasmic proteins and the cytoskeleton via their cytoplasmic 43
44 domains. Epithelial junctions were first observed in EM studies of a number of epithelia, which were found to have a common series of electron dense structures arranged along the cell-cell contact region (Farquhar and Palade, 1963). The zonula occludens, or tight junction, is charactrized by the complete obliteration of the intracellular space, as membranes from neighbouring cells form a tight seal. Tight junctions are located at the apical end of the lateral membrane, at the boundary between the apical and basolateral plasma membrane domains, and form a continuous ring in the apex of the cell. The zonula adherens, or adherens junction, forms just basal to the tight junction at the lateral membrane. Plasma membranes of neighbouring cells are aligned along the length of an adherens junction but membranes do not completely seal, and a small paracellular space remains. In most, but not all, epithelia adherens junctions form a continuous ring around the cell. Adherens junctions and tight junctions together are referred to as the apical junctional complex, as they are found at the apical end of the lateral membrane (Figure 1.3). A third type of intercellular junction typically found in epithelia is the desmosome. Desmosomes are more varied between different epithelia, and can be located in discrete spots all over the basolateral membrane. Desmosomes are not generally considered to be part of the apical junctional complex. 44

45 Protein Type Junction Function E-cadherin TM Adherens Cell-cell adhesion β-catenin adaptor Adherens Links cadherin complex to α-catenin γ-catenin adaptor Adherens/ desmosome Normally found in desmosomes. Can substitute for β-catenin in adherens junctions. α-catenin adaptor Adherens Actin filament binding Regulation of actin dynamics p120-catenin adaptor Adherens Stabilization of E-cadherin at plasma membrane Nectin TM Adherens Cell-cell adhesion Afadin adaptor Adherens Actin filament binding Links nectin and cadherin complexes through α-catenin Claudin TM Tight Tight junction strand formation Selective barrier functions Occludin TM Tight Not clear ZO-1/2 ZO-3 scaffold Tight Facilitate claudin clustering (see text) Recrutiment of polarity proteins JAM-A TM Tight Cell-cell adhesion Recruitment of polarity complexes Tricellulin TM Tight Stabilization of tricellular junctions Table 1.1 Components of epithelial apical junctions. Principal components of adherens junctions and tight junctions are listed, with a brief description of their function. See text for more details. Note that many junctional proteins have additional functions, not discussed, for example as components of cellular signalling pathways. TM - transmembrane. 45
46 1.4.2 Adherens junctions Two main types of transmembrane cell-cell adhesion proteins are found in adherens junctions, the cadherins and the nectins (see Table 1.1). Cadherins are a large family of transmembrane glycoproteins that have essential roles in cell adhesion and sorting and tissue formation and maintenance. Cadherins are characterized by the presence of conserved extracellular (EC) domains, which mediate calcium-dependent cell-cell adhesion (Nagafuchi et al., 1987). Classical cadherins, including the epithelial adherens junction protein E-cadherin, contain five tandem repeats of the EC domain. EC1, the furthest EC repeat from the plasma membrane, mediates trans-dimerization of E- cadherin, which explains why a gap of approximately 25 nm is observed between opposing membranes at adherens junctions. Crystal structures of a number of cadherin extracellular domains have revealed that calcium-binding is essential for stabilizing the structure of the extracellular domain and for trans-dimerization of EC1 domains (Nagar et al., 1996; Pokutta and Weis, 2007; Shapiro et al., 1995). The first crystal structures of cadherin EC1 domains suggested two modes of dimerization were possible, leading to models in which cis-dimerization of cadherins on the same membrane facilitated subsequent trans-dimerization of cadherins on opposing membranes. However whether cis-dimerization plays a role in cadherin adhesion is still uncertain (Pokutta and Weis, 2007). The highly conserved cytoplasmic domain of E-cadherin is also essential for cell-cell adhesion (Nagafuchi and Takeichi, 1988). This cytoplasmic domain binds to the catenin family of adaptor proteins, which functionally link cadherins to the actin cytoskeleton. Catenins bind via their conserved armadillo repeats to the cytoplasmic tail of E-cadherin. β-catenin binds to the membrane-distal region of the E-cadherin cytoplasmic tail, while p120-catenin binds to the membrane-proximal region. γ-catenin (plakoglobin) is normally found in desmosomes, but can substitute for β-catenin in adherens junctions. α-catenin is also found in E-cadherin complexes, but does not bind directly to E-cadherin. Instead α-catenin is recruited to the E-cadherin complex by interaction with β-catenin. (Jou et al., 1995). α-catenin has regions of homology to the 46
47 actin binding protein vinculin, and α-catenin binds to and bundles F-actin via its C- terminus (Rimm et al., 1995). α-catenin was therefore assumed to physically link the cadherin-catenin complex to the underlying actin cytoskeleton. However recent work has shown that α-catenin can not simultaneously bind actin filaments and β-catenin (Yamada et al., 2005). A number of α-catenin-binding proteins can also bind to F- actin, including vinculin and α-actinin, but none have been shown to bind α-catenin and F-actin simultaneously, so it is now unclear whether the cadherin-catenin complex interacts physically with F-actin at cell-cell contacts. Indeed FRAP and FLIP experiments have shown that junctional F-actin is surprisingly dynamic, whereas E- cadherin, β-catenin and α-catenin are more stable at cell-cell contacts. Instead of providing a mechanical link between cadherin complexes and the actin cytoskeleton, α- catenin plays an important role in regulating cytoskeletal dynamics during junction formation, as it recruits formin-1 and Mena/VASP to junctions and inhibits the Arp2/3 complex (Drees et al., 2005; Kobielak et al., 2004; Vasioukhin et al., 2000) (see section below). In addition to its role in recruiting α-catenin to the cadherin complex, β-catenin is also important for stabilization and trafficking of E-cadherin to the basolateral membrane. The E-cadherin cytoplasmic domain is structurally disordered, but becomes ordered when β-catenin binds. β-catenin associates with the cytoplasmic domain of E-cadherin very early in the secretory pathway, while E-cadherin is still in the ER (Hinck et al., 1994). Mutation of the β-catenin binding domain of E-cadherin causes E-cadherin to accumulate in the ER and ultimately leads to its degradation. The small amount of E- cadherin that does leave the ER through the secretory pathway does not get sorted properly to the basolateral membrane but is distributed randomly over both apical and basolateral plasma membrane domains (Chen et al., 1999). p120-catenin regulates E-cadherin stability at the plasma membrane. Loss of p120- catenin leads to decreased expression of E-cadherin, and this reflects increased degradation rather than decreased synthesis (Davis et al., 2003). E-cadherin is trafficked to the plasma membrane normally in p120-catenin-knockdown cells, but is 47
48 not retained there and is internalized and degraded. p120-catenin has therefore been proposed to stabilize E-cadherin at the plasma membrane by inhibiting its endocytosis. A second class of transmembrane protein found in adherens junctions is the nectin family (Takahashi et al., 1999). Nectins are immunoglobin-like single-span cell adhesion molecules, with three extracellular immunoglobin-like loops, a transmembrane domain and a cytoplasmic tail. Four mammalian nectin genes have been identified, each having several splice variants. Nectins form cis-dimers, and this dimerization is essential for their trans-interactions, which can occur in homo- and heterophilic manners (Ebnet, 2008). The cytoplasmic tail of nectins contains a C-terminal PDZ binding motif that interacts with the adaptor protein afadin. Nectin and afadin colocalize with E-cadherin in nascent spot-like adherens junctions and mature belt-like adherens junctions (Asakura et al., 1999). Afadin can interact with F-actin, and might provide a link between adherens junctions and the actin cytoskeleton. Afadin also interacts with α-catenin and might provide a link between the cadherin-catenin and nectin-afadin adhesion systems. Evidence for a role for nectins in adherens junction formation has come from studies in cells expressing exogenous nectin, which show calcium-independent aggregation and recruitment of E-cadherin to trans-interacting nectins at cell-cell contacts (Tachibana et al., 2000; Takahashi et al., 1999). Nectin ligation leads to activation of the small GTPases Cdc42 and Rac1, through Src family kinases and the GEFs FRG and Vav2, and this might contribute to adherens junction formation by promoting filopodia and lamellipodia formation (see section below) (Fukuhara et al., 2004; Kawakatsu et al., 2005; Kawakatsu et al., 2002). However, all functional studies on nectins have been performed in cells expressing exogenous nectin, and clear evidence for a role for endogenous nectins in AJ formation is lacking. In contrast to afadin, which is essential for viability and epithelial junction formation in mouse embryonic ectoderm (Ikeda et al., 1999), knockout of individual nectin genes does not impair epithelial junction formation (Inagaki et al., 2006; Inagaki et al., 2005). 48
49 1.4.3 Tight junctions Tight junctions, or zonula occludens, are areas where the plasma membranes of neighbouring cells are completely sealed (Farquhar and Palade, 1963). Freeze-fracture EM has shown these junctions are made of networks of paired tight junction strands, running along the plane of the plasma membrane and sealing cells together. These strands were originally speculated to be made of lipids, but are now known to be made of proteins polymers of the tetraspan transmembrane proteins claudin, occludin, and in some cases tricellulin (see Table 1.1), although a role for lipids has not been ruled out (Furuse et al., 1993; Furuse et al., 1998; Ikenouchi et al., 2005). These proteins have similar topologies, consisting of four transmembrane domains linked by two extracellular loops, and N- and C- terminal cytoplasmic tails mediating a number of protein-protein interactions. However while occludin and tricellulin are homologous in their C-terminal tails, the claudins are unrelated to occludin and tricellulin. The claudin family contains 24 members, with tissue specific expression profiles. Claudins are the main protein components of tight junction strands, and expression of single claudin proteins is sufficient for tight junction strand formation in fibroblasts (Furuse et al., 1998). Claudins regulate selective permeability to ions, and the wide range of selectivity exhibited by different epithelia is thought to result from expression of different claudin proteins. Cell culture experiments have shown that manipulation of claudin type changes ion permeability, and this idea has been validated by mouse knockout studies and naturally occurring claudin mutations in human disease, which result in defects in epithelial barrier function in specific tissues (Aijaz et al., 2006). The claudin extracellular loops are highly charged and show least sequence homology between different family members, and are thought to form charge- and size-selective pores, but the structural details of these pores have not been examined. Occludin was the first integral membrane protein to be discovered at tight junctions (Furuse et al., 1993), but its function remains unclear. Occludin is incorporated in to claudin-positive tight junction strands, but its expression is not sufficient, or even necessary, for tight junction strand formation. Functional studies in cultured cells 49
50 suggested occludin plays a regulatory role in tight junction function. For example, exogenous expression of occludin in MDCK cells caused an increase in transepithelial resistance (TER), reflecting decreased permeability to ions, but also an increased permeability to fluorescent markers, without affecting tight junction structure (Balda et al., 1996). Knockout studies of occludin however have not revealed any general defects in tight junctions, either structurally or functionally. Occludin-deficient embryonic stem cells develop in to normal embryoid bodies in culture, with a structurally and functionally intact visceral endoderm (epithelial) layer (Saitou et al., 1998). Occludindeficient mice develop normally, with only subtle developmental defects, including histological abnormalities in the gastric gland and salivary glands that seem to result from misregulation of differentiation (Saitou et al., 2000). Occludin therefore seems to play more of a signalling role rather than being involved in regulation of tight junctions, and indeed it is becoming increasingly evident that tight junctions are signalling hotspots controlling many aspects of cell behaviour (Matter and Balda, 2003b). Another tetraspan transmembrane protein identified at tight junctions is tricellulin. This protein is homologous to occludin in its C-terminal cytoplasmic tail, which binds the adaptor protein ZO-1. In contrast to occludin and claudins, tricellulin is enriched at the junction between three cells, the tricellular junction. Freeze-fracture EM analysis of tight junctions has revealed these to be weak points in the TJ strand organization. Knockdown experiments have shown tricellulin is required to fully seal membranes at these points and maintain epithelial barrier function (Ikenouchi et al., 2005). Members of the CTX family of immunoglobin-like single span transmembrane proteins also localize to tight junctions, including the JAM (junctional adhesion molecule) proteins (Ebnet, 2008). Of these JAM-A is the best characterized as far as epithelial tight junctions are concerned. Ectopic expression of JAM-A in fibroblasts results in the formation of cell-cell contacts, showing JAM-A mediates homophilic cell-cell adhesion. JAM-A does not form tight junction strands, but is closely associated with tight junction strands formed by claudin expression in fibroblasts (Itoh et al., 2001). During junction formation, JAM-A is one of the first tight junction proteins to be recruited and is likely to play a role in recruiting other tight junction proteins as junctions mature (see section 50
51 1.4.4 below). Expression of JAM-A mutants or RNAi-mediated knockdown of JAM-A delays tight junction formation and results in reduced TER and increased dextran permeability in monolayers (Ebnet et al., 2001; Mandell et al., 2005). A general feature of tight junction transmembrane proteins is their ability to bind to cytoplasmic adaptor proteins, such as the ZO (zonula occludens) family of MAGUK (membrane associated guanylate kinase) proteins, via their C-terminal tails. Three mammalian ZO proteins share conserved domain organization, consisting of three PDZ domains in their N-terminus and a SH3 and GUK domain in their C-terminus (Ebnet, 2008). ZO proteins bind via their PDZ domains to the C-terminal PDZ-binding motif of claudins. Epithelial cells depleted of ZO-1 and ZO-2 isoforms fail to form tight junctions, and rescue experiments showed this function depends on the ability of ZO proteins to bind to claudins and to dimerize at sites of cell-cell contact (Umeda et al., 2006). Based on these experiments it has been proposed that ZO-1 and ZO-2 proteins regulate tight junction formation by promoting claudin recruitment and clustering at sites of cell-cell contact. However it is not clear if ZO proteins directly regulate claudin clustering at sites of cell-cell contact. ZO proteins can also bind to actin filaments, and might provide a direct link between tight junctions and the actin cytoskeleton, which could provide an alternative explanation for the failure to form tight junctions in ZOdepleted cells Assembly of apical junctions Initiation of cell-cell contact - The assembly of adherens junctions and tight junctions has been extensively studied in cultured cells, which can be induced to form junctions synchronously by manipulation of extracellular calcium levels (the so-called calciumswitch ). These studies have shown that apical junctions form in a stepwise manner. Initial cell-cell contact leads to the recruitment of E-cadherin complexes, followed by sequential recruitment of tight junction proteins and changes in cell shape and the organization of the actin cytoskeleton, resulting in the formation of polarized cells with mature apical junctions. Remarkably, the sequential recruitment of junctional proteins seen in cultured cells mimics the formation of the first epithelial structure in the mouse 51
52 pre-implantation embryo, the trophectoderm. This epithelium forms as a result of the sequential recruitment of adherens junction and tight junction proteins to cell-cell contacts, starting with E-cadherin activation during compaction of the 8-cell embryo, and ending with the assembly of claudins in to mature tight junctions in the 32-cell blastocyst (Eckert and Fleming, 2008). Cell-cell adhesion is initiated when neighbouring cells in culture make contact as a result of membrane protrusions. Different cells use different mechanisms to initiate cell-cell contact. MDCK cells for example use transient lamellipodia to initiate cell-cell contact, whereas keratinocytes use filopodial protrusions (Adams et al., 1998; Vasioukhin et al., 2000). E-cadherin puncta are formed at the sites of initial contact, referred to as spot-like or primordial adherens junctions (Figure 1.4). These puncta have been observed in a number of different epithelial cell types during junction formation, and contain many of the proteins found in mature adherens junctions, including catenins, nectin and afadin (Adams et al., 1998; Asakura et al., 1999; Vasioukhin et al., 2000). Live imaging studies in MDCK cells have shown that E- cadherin expressed at the cell surface becomes stabilized at sites of initial cell-cell contact (Ehrlich et al., 2002). These puncta are stabilized by association with actin filaments and act as landmarks for the recruitment of additional cadherin complexes as cell-cell contacts extend. Dramatic changes in the actin cytoskeleton are observed as junctions form. During the early stages of cell-cell contact, fine actin filaments are observed emanating from the cortical actin ring, terminating in E-cadherin spot-like junctions (Figure 1.4). A number of actin regulatory proteins localize to these nascent junctions, which are known to be sites of actin polymerization. This actin polymerization provides the mechanical force to seal membranes together as cell-cell contacts extend (Ehrlich et al., 2002; Vasioukhin et al., 2000). Treatment of cells with drugs such as cytochalasin or latrunculin to inhibit actin polymerization prevents junction formation, highlighting the importance of actin polymerization in this process (Adams et al., 1998; Ivanov et al., 2005a). Both the Arp2/3 complex and the formins, the two principal actin nucleators found in eukaryotic 52
53 cells (see section above), as well as a number of other actin regulatory proteins, have important roles in junction formation. The Arp2/3 complex is recruited by E-cadherin to sites of cell-cell contact during adherens junction formation. As cell-cell contacts extend, it is predominantly localized at the margins of extending contacts where it promotes lamellipodial activity required to bring opposing membranes together. (Kovacs et al., 2002). Inhibition of Arp2/3 function prevents E-cadherin cell-cell contact formation (Verma et al., 2004). Cortactin, an activator of the Arp2/3 complex, is also recruited to cell-cell contacts by E-cadherin, and knockdown of cortactin prevents adherens junction formation (Helwani et al., 2004). Members of the Mena/VASP family of actin regulators are also recruited to nascent cell-cell contacts, probably through indirect interaction with α-catenin mediated by vinculin (Scott et al., 2006; Vasioukhin et al., 2000). Interference with VASP activity prevents adherens junction formation in keratinocytes and mouse epidermis. The role of Mena/VASP family proteins in regulating actin is not completely clear, but they are often found enriched in lamellipodia and might cooperate with the Arp2/3 complex and facilitate actin polymerization by preventing actin capping proteins binding to the barbed end of actin filaments (Bear et al., 2002). The Arp2/3 complex can be inhibited by α-catenin, and this might be important for limiting Arp2/3 activity to newly contacting membranes, while allowing older contacts to develop unbranched actin filaments found in mature junctions (Drees et al., 2005). Formin1 is recruited to nascent cell-cell contacts by interaction with α-catenin, where it promotes stabilization and association of cadherin puncta with actin filaments (Kobielak et al., 2004). Inhibition of formin-1 function blocks adherens junction formation, while expression of an active mutant of formin-1 rescues the defect in adherens junction formation seen in α-catenin-null keratinocytes, showing regulation of formin-1 activity is an important aspect of α-catenin function. mdia1, a diaphanous-related formin (DRF), is also required for adherens junction formation (Ryu et al., 2009). 53
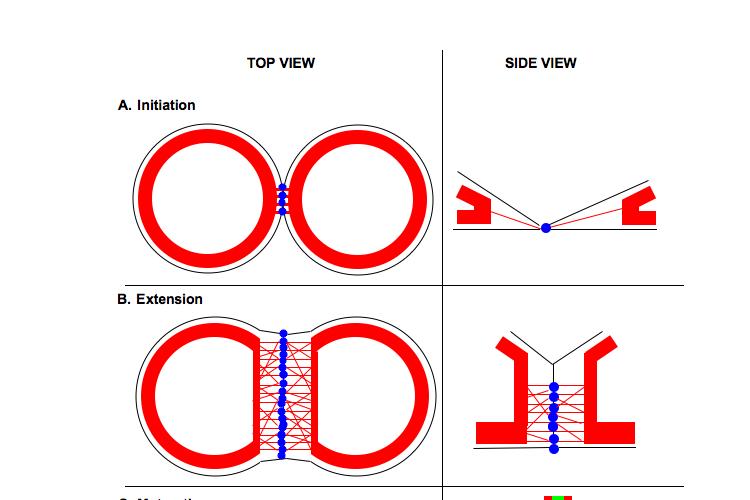
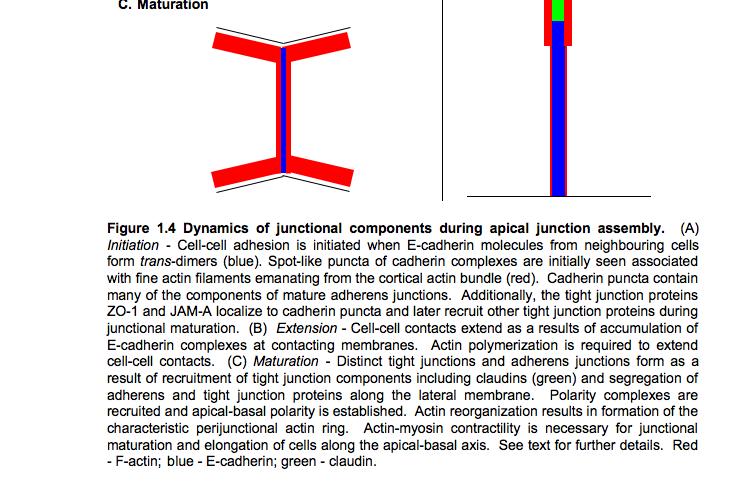
54 54
55 Maturation of apical junctions - As junctions mature, cells elongate along the apicalbasal axis and generate distinct zonula occludens, containing polymerized claudin proteins, and zonula adherens (Figure 1.4). ZO-1 and JAM-A are the first tight junction proteins to be recruited to cell-cell contacts, where they colocalize with E-cadherin at spot-like primordial junctions. Additional tight junction proteins, including polarity complexes, which establish apical-basal polarity, and the transmembrane proteins that from tight junction strands (claudins and occludin), are recruited later, possibly through interactions with ZO proteins and JAM-A. Based on the observation that tight junctions do not form in epithelial cells depleted of ZO proteins, it has been proposed that recruitment of claudins in to tight junctions is dependent on ZO proteins, which bind directly to the claudin cytoplasmic tail (Umeda et al., 2006). ZO-1 and ZO-2 seem to act redundantly in tight junction formation, as expression of either protein is sufficient to rescue the tight junction defect in ZOdepleted cells. The ability of ZO-1 to promote tight junction formation depends on the presence of its PDZ domains, which bind to claudins, and its SH3 and GUK domains, which mediate dimerization and bind to adherens junction proteins. Based on these observations, it has been proposed that ZO-1 regulates tight junction formation by recruiting and clustering claudins at cell-cell contacts (Umeda et al., 2006). However it is not clear if the failure to form tight junctions in ZO-depleted cells reflects a direct role for ZO proteins in claudin clustering. It should be noted that expression of claudin proteins alone is sufficient to form tight junction strands in fibroblasts (Furuse et al., 1998), and that ZO proteins can have alternative functions in the cell, such as linking tight junctions to junctional actin, which might explain their involvement in tight junction formation. The Par3 (partitioning-defective 3)/Par6/aPKC (atypical protein kinase C) complex is a highly conserved protein complex playing an essential role in the establishment of cell polarity (Ebnet, 2008). The Par proteins were initially identified in C.elegans as proteins required for asymmetric cell division in the zygote, and have since been shown 55
56 to play conserved roles in cell polarity in higher eukaryotes. Par3 and Par6 are scaffold proteins, which bind to and regulate the activity of apkc (Joberty et al., 2000; Lin et al., 2000). In epithelial cells, this complex localizes to tight junctions, and a number of studies using RNAi knockdown and expression of dominant-negative mutants have shown it to be required for tight junction formation (Chen and Macara, 2005; Suzuki et al., 2004; Suzuki et al., 2001; Yamanaka et al., 2001). In particular, the kinase activity of apkc is required for nascent junctions to mature and for the subsequent recruitment of claudins to form tight junctions (Suzuki et al., 2002). Par3 and Par6 regulate the localization and the kinase activity of the associated apkc. Par6 is an effector protein for Cdc42 and Rac1, and activation of these small GTPases downstream of E-cadherin and nectin adhesion results in activation of apkc. apkc is not active when in complex with Par6 alone, but conformational changes induced by GTPase-binding to Par6 lead to apkc activation (Yamanaka et al., 2001). At least two mechanisms have been proposed for the recruitment of this complex to junctions: an interaction between the first PDZ domain of Par3 and the C-terminal PDZ-binding motif of JAM-A (Ebnet et al., 2001), and an interaction between the PDZ domain of Par6 and the N-terminus of Pals1 (partner of Lin7), which itself is recruited by PATJ (Pals1-associated tight junction protein) and ZO-3 (Hurd et al., 2003; Roh et al., 2002). The role of apkc in tight junction formation is not clear. apkc can phosphorylate tight junction proteins, including ZO-1, occludin and claudin-1 in vitro (Nunbhakdi-Craig et al., 2002), and it is known that these proteins are phosphorylated in tight junctions (see section below), however it is not known if these are physiological substrates of apkc. Other substrates for apkc include the polarity proteins Par1 (partitioningdefective 1) and lgl (lethal giant larvae). Par1, like Par3 and Par6, was discovered in C.elegans as a protein essential for cell polarity and is conserved in higher eukaryotes. It is a serine/threonine kinase, and plays a role in establishing apical-basal polarity in epithelial cells. Par1 is localized to the lateral membrane in polarized epithelial cells, while the Par3/Par6/aPKC complex is localized apically. Phosphorylation of Par1 by apkc causes it to dissociate from the membrane, and this prevents Par1 from associating with the apical membrane domain (Suzuki et al., 2004), while phosphorylation of Par3 by Par1, at least in Drosophila, causes Par3 to dissociate from 56
57 the Par6/aPKC complex, and thus restricts the ternary complex to the apical membrane (Benton and St Johnston, 2003). Par1 and the Par3/Par6/aPKC complex thus play antagonistic roles to establishing polarized membrane domains. A similar antagonistic relationship is seen between apkc and Lgl. Lgl, another conserved polarity protein, is localized to the basolateral membrane domain in epithelial cells. It can bind to Par6 and apkc and prevent Par3 from binding to them, and so is thought to restrict the Par3/Par6/aPKC complex to the apical membrane. In turn, apkc can phosphorylate Lgl to exclude it from the apical membrane (Yamanaka et al., 2003). apkc clearly plays an important role in establishing apical-basal polarity in epithelial cells, but it is not clear whether its role in polarity is linked to its role in tight junction formation. The fact that a number of polarity proteins discovered in lower eukaryotes have been found to be important for tight junction formation in vertebrates, including Par3 and Par6 discussed above and also Crb3 (Crumbs in Drosophila) (Fogg et al., 2005), Pals1 (Partner of lin7, stardust in Drosophila) (Straight et al., 2004), PATJ (Pals1-associated tight junction protein, Discs lost in Drosophila) (Shin et al., 2005), Dlg (Discs large in Drosophila) (Stucke et al., 2007) and Scrib (Scribble in Drosophila) (Qin et al., 2005), suggests a functional link between tight junction formation and apical-basal polarization. In vertebrates, tight junctions are found at the border between the apical and basolateral membrane domains, and it is plausible that the distinction between these domains acts as a landmark to position tight junctions. As junctions mature and cells elongate along the apical-basal axis, the actin cytoskeleton reorganizes to form the characteristic perijunctional actin ring found in polarized epithelial cells (Figure 1.4). Cortical actin filaments contract and bundle so that they tightly align with the apical junctional complex. These changes in cell shape and junctional maturation require myosin II activity and actin-myosin contractility (Zhang et al., 2005). Inhibition of myosin II ATPase activity does not prevent nascent cadherin contacts forming, but does prevent subsequent tight junction formation, perijunctional actin ring formation, and cell polarization (Ivanov et al., 2005a). Myosin II is activated at junctions in a Rho- and ROCK-dependent manner (Yamazaki et al., 2008). 57
58 1.4.5 Regulation of apical junctions Epithelial junctions are highly dynamic. Remodelling of junctions occurs during normal morphogenesis as epithelial cells are organized in to tissues, and also in disease states such as cancer. The formation, maintenance and disassembly of junctions can be regulated by a number of mechanisms, including alteration of the actin cytoskeleton, the availability of junctional proteins at the cell surface, and post-translational modifications of junctional proteins. The perijunctional actin ring is dynamic in nature, and continual actin polymerization is required to maintain apical junctions in polarized monolayers (Yamada et al., 2005). Pharmacological inhibition of actin polymerization in epithelial monolayers results in loss of perijunctional actin and disruption of apical junctions (Shen and Turner, 2005; Yamazaki et al., 2007). Actin-myosin contractility might also play a role in junctional maintenance, although there is conflicting evidence. Some studies have found inhibition of myosin II disrupts junctions, while others have found myosin II activity is not required for the maintenance of junctions. Hyperactivation of myosin II results in disassembly of junctions, as a result of contraction of the perijunctional actin ring (Sahai and Marshall, 2002; Shewan et al., 2005). The membrane proteins forming junctions, such as E-cadherin and claudins, are continually undergoing endocytosis, and can be targeted for degradation or recycled back to the plasma membrane. Internalized junctional proteins first accumulate in Rab5-positive early endosomes, and can be sorted to either Rab11-positive recycling endosomes for recycling back to the plasma membrane, or to Rab7-positive late endosomes for subsequent degradation (Ivanov et al., 2005b). Endocytosis of junctional proteins occurs constitutively in stable monolayers (Le et al., 1999; Matsuda et al., 2004), where it plays important roles in junction maintenance and repair, and can also be stimulated by growth factors and cytokines that affect epithelial integrity and barrier function during morphogenesis and pathogenesis (Ivanov et al., 2005b). Trafficking of 58
59 junctional proteins thus plays an important role in the regulation of junctional integrity by controlling the availability of junctional proteins at the cell surface. The integrity of junctions can be regulated by phosphorylation of junctional proteins. Phosphorylation of E-cadherin and catenins regulates their interactions with each other, and thus regulates the strength of cell-cell adhesion. Transformation of epithelial cells, by overexpression of oncogenes such as Src or addition of growth factors, results in tyrosine phosphorylation of E-cadherin, β-catenin and p120-catenin (Behrens et al., 1993; Hoschuetzky et al., 1994; Roura et al., 1999). Src directly phosphorylates β- catenin, and this weakens its interaction with E-cadherin, while Fer and Fyn, two Srcfamily kinases (SFKs), directly phosphorylate β-catenin and weaken its interaction with α-catenin. Disruption of the cadherin-catenin complex by SFKs contributes to their ability to transform epithelial cells. On the other hand, a positive role for SFKdependent tyrosine phosphorylation of catenins in junction formation has also been proposed. Fyn is activated as cell-cell contacts form in keratinocytes, and phosphorylation of catenins downstream of SFKs is required for efficient adherens junction formation in these cells (Calautti et al., 2002). The cadherin-catenin complex is also regulated by serine/threonine kinases, including CKII and GSK3-β, which phosphorylate the cytoplasmic tail of E-cadherin and enhance its interaction with β- catenin (Lickert et al., 2000). The tight junction proteins occludin, claudins and ZOs are all phosphorylated in tight junctions, mainly on serine and threonine residues. Similar to adherens junction proteins, phoshorylation of tight junction proteins can have both positive and negative effects on tight junction formation and maintenance. A number of kinases have been found to be both required for tight junction formation and to promote tight junction disassembly. This includes the PKA and PKC families, which can directly phosphorylate tight junction proteins, at least in vitro. However the physiological relevance of phosphorylation of tight junction proteins by PKA and PKC has not been determined. Phosphorylation of specific claudin isoforms has also been shown to alter the barrier properties of tight junctions (Gonzalez-Mariscal et al., 2008). 59
60 1.5 Rho GTPases and apical junctions As described in previous sections, Rho GTPases control a number of basic processes in the cell, including the organization of the cytoskeleton, membrane trafficking and gene expression. It is therefore not surprising that they have emerged as key regulators of complex cellular behaviours such as migration, division and morphogenesis. Experiments in cultured epithelial cells, mainly using overexpression of mutant proteins or toxins to manipulate the activity of Rho GTPases, have shown that Rho family members regulate the assembly and maintenance of both adherens and tight junctions. In some cases components of the signalling pathways involved have been identified Rho GTPases and the assembly of apical junctions The activity of Rho is required for epithelial junctions to form. This has been shown by expression of dominant-negative RhoA or by using C3 toxin (to inhibit RhoA, B and C), which block recruitment of adherens junction and tight junction proteins to sites of cell-cell contact (Braga et al., 1997; Takaishi et al., 1997). Recently developed FRET probes enable visualization of active forms of GTPases in live cells, and studies using these have shown RhoA is active at sites of cell-cell contact and junction formation (Yamada and Nelson, 2007; Yamazaki et al., 2008). Earlier studies looking at RhoA activation using a biochemical approach had shown that levels of active RhoA decrease as epithelial junctions form (Noren et al., 2001). However it should be noted that this biochemical approach looks at GTPase activation globally, whereas fluorescent probes allow visualization of localized pools of active GTPase. While the overall level of active RhoA in the cell decreases as epithelial cells form monolayers, some Rho activity is required at sites of cell-cell contact for junctions to form. The Rho GEFs ECT2 and GEF-H1, and the Rho GAPs ARHGAP10 and p190rhogap, can potentially regulate Rho activity at junctions. ECT2 is best known for its role in cytokinesis in mitotic cells, and in interphase cells localizes predominantly in the nucleus (Kim et al., 2005; Yuce et al., 2005). However some ECT2 localization has been seen at junctions in epithelial 60
61 cells, where it colocalizes with the tight junction protein ZO-1 (Liu et al., 2004). Expression of dominant-negative ECT2 prevented lumen formation in MDCK cells grown in 3D cultures, a phenotype that might reflect a defect in tight junction formation (Liu et al., 2006). However it is not clear if any role for ECT2 in regulating junctions is dependent on its ability to regulate Rho activity, and instead ECT2 can interact with the Par3/Par6/aPKC complex and stimulate the kinase activity of apkc (Liu et al., 2004). The Rho GEF GEF-H1 also localizes to tight junctions, but is not thought to regulate junction formation. Proposed roles instead include regulation of junctional permeability, and cell density-dependent regulation of cell-cycle progression (Aijaz et al., 2005; Benais-Pont et al., 2003). ARHGAP10 localizes to cell-cell contacts, and depletion of ARHGAP10 resulted in decreased recruitment of α-catenin to cell-cell contacts in JEG-3 epithelial cells, but surprisingly E-cadherin localization was not affected, suggesting ARHGAP10 does not play a significant role in adherens junction formation (Sousa et al., 2005). Instead ARHGAP10 is required for infection of cells by the bacterium Listeria monocytogenes, a process known to require E-cadherin as a receptor. p190rhogap has been implicated in inhibition of Rho downstream of cadherin ligation (Noren et al., 2003). Cadherin ligation resulted in increased tyrosine phosphorylation of p190rhogap which correlated with increased activity, and expression of dominant-negative p190rhogap prevented cadherin-dependent inhibition of Rho activity. Several Rho effector proteins have been implicated in junction formation. The actin nucleation activity of formins is required for junctions to form (see section above), and a subset of formins, the DRFs (Diaphonous-related formins), are regulated by Rho, which provides another potential mechanism for Rho to regulate junction formation. Consistent with this, RNAi-mediated depletion of mdia1 prevents cell-cell adhesion in A431 cells (Ryu MCB 2009). In keratinocytes, Src family kinases such as Fyn phosphorylate β-,γ- and p120-catenin, which increases their affinity for E-cadherin and promotes adherens junction formation. Inhibition of Rho prevents adherens junction formation, and results in decreased activity of Fyn kinase and decreased levels of tyrosine-phosphorylated catenins, suggesting Rho is promoting junction formation by activating Fyn (Calautti et al., 2002). The Rho effector PRK2 is activated in these cells 61
62 when junction formation is stimulated by calcium. While expression of a constitutively active RhoA mutant was found to increase the speed at which E-cadherin accumulated at cell-cell contacts, a RhoA effector mutant Y42C that can no longer bind to PRK2 failed to accelerate junction formation, suggesting Rho might be acting through PRK2. However, it should be noted that Rho GTPase effector mutants are likely to inhibit binding of multiple Rho effectors, so a clear role for PRK2 in adherens junction formation has not been demonstrated. In some studies pharmacological inhibition of the Rho effector protein ROCK prevented junction formation. The accumulation of E-cadherin at cell-cell contacts was inhibited using a ROCK inhibitor in MCF7 cells (Shewan et al., 2005) and T84 cells (Walsh et al., 2001), but not in MDCK (Yamada and Nelson, 2007) or HCT116 cells (Sahai and Marshall, 2002). It is not clear if these discrepancies reflect cell-type specific effects of ROCK inhibition, or simply differences in experimental conditions, and this is further confused by the fact that commonly used ROCK inhibitors are not very specific. ROCK is known to activate myosin II, by direct phosphorylation of MLC and by inhibition of MLC phosphatase. Myosin II-dependent contractility is required for epithelial junctions to mature in to distinct zonula adherens and zonula occludens (see section above), and this could be regulated by the Rho-ROCK pathway. Rac activity is also required for junctions to form. Expression of dominant-negative Rac1 or RNAi-mediated knockdown of Rac1 impairs E-cadherin recruitment to cell-cell contacts (Braga et al., 1997; Noritake et al., 2004). Rac1 is activated as cell-cell contact is initiated, and this activation is thought to occur as a direct consequence of both cadherin and nectin homophilic ligation (Kawakatsu et al., 2002; Noren et al., 2001). In the case of nectin-dependent activation of Rac1, the GEF Vav2 has been implicated, as expression of dominant-negative Vav2 blocks Rac1 activation by nectin ligation (Kawakatsu et al., 2005). It should be noted however that Vav2 has not been localized to cell-cell contacts and has not been shown to play a functional role in junction formation. Active Rac1 has been visualized in MDCK cells at sites of initial cell-cell contact. As cell-cell contacts extend, active Rac1 is localized predominantly at the edges of the contact region (Yamada and Nelson, 2007). This localization coincides 62
63 with regions of high lamellipodial activity, which seals neighbouring cells together as cell-cell contacts extend (see section above). The Arp2/3 complex, which is responsible for actin polymerization to form lamellipodia, is activated downstream of Rac, and also localizes to the edges of extending cell-cell contacts. Rac activates the Arp2/3 complex through WAVE proteins. WAVE2 localizes to lamellipodia as cellcell contacts form, and colocalizes with E-cadherin in mature monolayers. Depletion of WAVE2 by RNAi delays recruitment of E-cadherin to cell-cell contacts in MDCK cells (Yamazaki et al., 2007). IQGAP is an effector for Rac and Cdc42, and plays both positive and negative roles in adherens junction formation. IQGAP1 colocalizes with E-cadherin at cell-cell contacts in MDCK cells, and RNAi-mediated knockdown of IQGAP1 results in reduced localization of E-cadherin at cell-cell contacts (Noritake et al., 2004). IQGAP1 binds to actin filaments, and might play a positive role in junction formation by stabilizing actin at sites of cell-cell adhesion. IQGAP1 also binds to β-catenin and prevents β-catenin binding to α-catenin, resulting in decreased cell-cell adhesion. The interaction between IQGAP1 and β-catenin is thought to be prevented by binding of active Rac (or Cdc42) to IQGAP1 (Fukata et al., 1999; Kuroda et al., 1998). Rac could, therefore, promote junction formation by facilitating the interaction between β-catenin and α-catenin. Rac activity has also been implicated in apical junction maturation and the formation of tight junctions (Mertens et al., 2005). Knockout of the Rac-specific GEF Tiam1 in keratinocytes does not prevent initial E-cadherin-dependent cell-cell contacts forming, but does prevent maturation in to apical tight junctions. Tiam1 interacts with Par3, a component of the Par3/Par6/aPKC complex whose activity is required for tight junctions to form (see section above). Activation of apck in this complex requires binding of active Rac or Cdc42 to the Rho effector protein Par6. Tiam1- activated Rac is therefore thought to promote tight junction formation by activating apkc. There is conflicting data on the role of Cdc42 in junction formation. Several studies have shown inhibition of Cdc42 has no effect on junction formation (Gao et al., 2002; 63
64 Mertens et al., 2005; Takaishi et al., 1997), while other studies have shown Cdc42 is required for adherens junction and tight junction formation (Fukuhara et al., 2003; Otani et al., 2006; Rojas et al., 2001). Cdc42 is activated as cell-cell contacts are initiated (Noren et al., 2001; Otani et al., 2006). Cdc42 can be directly activated downstream of nectin ligation, and this might occur through the Cdc42 GEF FRG, as expression of dominant-negative FRG prevents nectin-dependent activation of Cdc42 (Fukuhara et al., 2004; Kawakatsu et al., 2002). The Cdc42-specific GEF Tuba interacts with ZO-1 and localizes to apical junctions in Caco-2 epithelial cells (Otani et al., 2006). Depletion of Tuba resulted in a delay in adherens junction formation. Proposed roles for Cdc42 in junction formation include filopodia formation, which are seen in some epithelial cells as cell-cell contact is initiated, regulation of IQGAP1, and activation of the Par3/Par6/aPKC complex Rho GTPases and the maintenance of apical junctions In addition to being required for junctions to form, Rho GTPases regulate the maintenance and disassembly of apical junctions. Addition of C3 toxin to inhibit Rho in a number of different epithelial cell lines results in loss of perijunctional F-actin and disruption of adherens and tight junctions (Braga et al., 1997; Nusrat et al., 1995; Sahai and Marshall, 2002; Takaishi et al., 1997). The perijunctional actin ring is dynamic in nature, and continual actin polymerization is required to maintain apical junctions in polarized monolayers. Pharmacological inhibition of actin polymerization results in loss of perijunctional actin and apical junctions (Shen and Turner, 2005; Yamazaki et al., 2007). Rho activity is required to maintain junctions through its effector mdia, a DRF that promotes actin polymerization (Sahai and Marshall, 2002). Expression of a dominant-negative mdia mutant that can not regulate actin polymerization phenocopies inhibition of Rho in HCT116 and MDCK cells, with loss of adherens junctions. Expression of dominant negative Rac1 in epithelial monolayers also results in disruption of established adherens junctions and tight junctions (Braga et al., 1997; Bruewer et al., 2004). Like Rho, Rac might contribute to maintenance of junctions through its regulation of actin polymerization (Yamazaki et al., 2007). Rac might also 64
65 stabilize junctions through its effector protein IQGAP1, which as described above regulates the interaction between catenins and also binds to actin filaments. A number of studies have shown that expression of dominant-negative Cdc42 in epithelial monolayers does not affect established junctions, suggesting Cdc42 activity is not required for maintenance of junctions (Bruewer et al., 2004; Takaishi et al., 1997). The activity of Rho GTPases needs to be tightly controlled for stable maintenance of epithelial junctions. Overexpression of constitutively active mutants of RhoA, Rac1 and Cdc42 disrupts adherens junctions and tight junctions (Braga et al., 2000; Kroschewski et al., 1999; Sahai and Marshall, 2002). Furthermore, disassembly of epithelial junctions during transformation by oncogenic Ras or addition of transforming growth factors such as HGF and TGF-β is dependent on activation of Rho GTPases (Bhowmick et al., 2001; Braga et al., 2000; Ridley et al., 1995). In the case of RhoA activation, disassembly of junctions occurs through activation of its effector ROCK, which activates myosin II, resulting in contraction of the perijunctional actin ring and loss of cell-cell contacts (Sahai and Marshall, 2002). 1.6 Experimental plan There is considerable evidence that Rho GTPases regulate epithelial junction formation. The activity of Rho GTPases is controlled by a large number of regulatory proteins and effector proteins. While some of the components of Rho GTPase signalling pathways regulating epithelial junction formation have been identified (discussed above), it seems likely that additional components await identification. In this study I therefore plan to carry out a systematic analysis of Rho GTPase signalling pathways regulating epithelial junction formation by screening RNAi libraries targeting Rho GEFs, GAPs and effector proteins, using the human bronchial epithelial cell line 16HBE14o-. 65
66 CHAPTER 2 Materials and Methods 2.1 Molecular biology DNA constructs The DNA constructs used in this study are listed in Table 2.1. All constructs were verified by sequence analysis (MSKCC sequencing facility). Plasmid name pcl2.flag-asef1 pcmv-tag3b-myc- ARHGEF10 pcdna3-ha-hrhoa pcdna3-ha-hrhob pcdna3-ha-hrhoc prk5myc-mrhoa prk5myc-mrhoc prk5myc-pak4s pbabe-ha pbabe-ha-mprk2 Description and source Flag-tagged human Asef1, from D.Billadeau Myc-tagged human ARHGEF10, from S.Lutz 3xHA-tagged (N-terminus) human RhoA, from Missouri S&T cdna Resource Center 3xHA-tagged (N-terminus) human RhoB, from Missouri S&T cdna Resource Center 3xHA-tagged (N-terminus) human RhoC, from Missouri S&T cdna Resource Center Myc-tagged (N-terminus) mouse RhoA. Made by PCR using pex_yfp- RhoA (from ATCC) as template and the following primers: forward: 5 -GCGCGGGATCCATGGCTGCCATCAGGAAGAAAC-3 reverse: 5 -GCGCGGAATTCTCACAAGATGAGGCACCCAGAC-3 BamHI/EcoRI fragment cloned in to BamHI/EcoRI prk5myc Myc-tagged (N-terminus) mouse RhoC. Made by PCR using pex_yfp- RhoC (from ATCC) as template and the following primers: forward: 5 -GCGCGGGATCCATGGCTGCGATCCGAAAGAAG-3' reverse: 5 -GCGCGGAATTCTCAGAGAATGGGACAGCCCCTC-3 BamHI/EcoRI fragment cloned in to BamHI/EcoRI prk5myc Myc-tagged (N-terminus) human PAK4S (short isoform), from T.Wagner pbabe-ha retroviral vector with puromycin resistance HA-tagged mouse PRK2. Made by PCR using pyx-mprk2 (from RZPD) as template and the following primers: forward: 5 -GCGCGCAGATCTATGGCGTCCAACCCCGACCGG-3 reverse: 5 -GCGCGCGAATTCTTAACACCAATCAGCAACGTAG-3 66
67 prk5myc-rhoa(f39a) prk5myc-rhoa(f39v) BglII/EcoRI fragment cloned in to BamHI/EcoRI pbabe-ha Myc-tagged (N-terminus) mouse RhoA(F39A) mutant. Made by single step PCR mutagenesis using prk5myc-mrhoa as template and the following primers: forward: 5 -CTATGTGCCCACGGTGGCTGAAAACTATGTGGCG-3 reverse: 5 -CGCCACATAGTTTTCAGCCACCGTGGGCACATAG-3 BamHI/EcoRI fragment cloned in to BamHI/EcoRI prk5myc Myc-tagged (N-terminus) mouse RhoA(F39V) mutant. Made by single step PCR mutagenesis using prk5myc-mrhoa as template and the following primers: forward: 5 -CTATGTGCCCACGGTGGTTGAAAACTATGTGGCG-3 reverse: 5 -CGCCACATAGTTTTCAACCACCGTGGGCACATAG-3 BamHI/EcoRI fragment cloned in to BamHI/EcoRI prk5myc prk5myc-rhoa(e40l) prk5myc-rhoa(y42c) pbabe-ha-pak4 Myc-tagged (N-terminus) mouse RhoA(E40L) mutant. Made by single step PCR mutagenesis using prk5myc-mrhoa as template and the following primers: forward: 5 -GTGCCCACGGTGTTTCTAAACTATGTGGCGGAT-3 reverse: 5 -ATCCGCCACATAGTTTAGAAACACCGTGGGCAC-3 BamHI/EcoRI fragment cloned in to BamHI/EcoRI prk5myc Myc-tagged (N-terminus) mouse RhoA(Y42C) mutant. Made by single step PCR mutagenesis using prk5myc-mrhoa as template and the following primers: forward: 5 -CACGGTGTTTGAAAACTGTGTGGCGGATATCCAG-3 reverse: 5 -CTCGATATCCGCCACACAGTTTTCAAACACCGTG-3 BamHI/EcoRI fragment cloned in to BamHI/EcoRI prk5myc HA-tagged (N-terminus) human PAK4 with 3 non-coding point mutations to make it resistant to PAK4 sirna duplex 4. Made by single step PCR mutagenesis using plpc-pak4 (from A.Minden) as template with the following primers: forward: 5 -CCAGCACGAAAACGTCGTGGAGATGTACAACAGCTACCTGGTG-3 reverse: 5 -GCTGTTGTACATCTCCACGACGTTTTCGTGCTGGTAGTCCCTC-3 Followed by PCR amplification using the following primers: forward: 5 -GCGCGGGATCCATGTTTGGGAAGAGGAAGAAG-3 reverse: 5 -GCGCGGAATTCTCATCTGGTGCGGTTCTGGCG-3 BamHI/EcoRI fragment cloned in to BamHI/EcoRI pbabe-ha 67
68 pbabe-ha-mpar6b pbabe-ha-pak4s HA-tagged (N-terminus) mouse Par6B. BamHI/EcoRI fragment excised from pk-myc-par6b (Addgene plasmid 15473) and cloned in to BamHI/EcoRI pbabe-ha. HA-tagged (N-terminus) human PAK4S (short isoform). Made by PCR using prk5myc-pak4s (T.Wagner) as template and the following primers: forward: 5 -GCGCGGGATCCATGTTTGGGAAGAGGAAGAAG-3 reverse: 5 -GCGCGGAATTCTCATCTGGTGCGGTTCTGGCG-3 BamHI/EcoRI fragment cloned in to BamHI/EcoRI pbabe-ha Table 2.1. DNA constructs used in this study. Constructs are listed in the order in which they first appear in Figures presented in chapters 3-5. All constructs were verified by sequence analysis (MSKCC DNA sequencing facility). Where applicable, the sequence of PCR primers used is given. Nucleotides in red indicate either restriction sites or mutations introduced DNA agarose gel electrophoresis 1% agarose gels were prepared by dissolving 1 g of agarose (Sigma) in 100 ml of TAE (40 mm Tris-acetate, 1 mm EDTA ph8.0). Ethidium bromide (1µg/ml) was added prior to polymerization. 6X DNA loading buffer (30% glycerol (v/v), 0.25% bromophenol blue (w/v), 0.25% xylene cyanol (w/v)) was added to DNA samples to achieve a final concentration of 1X DNA loading buffer. Samples were run at 100 V for approximately 1 hr. DNA bands were visualized using a UV transilluminator Polymerase chain reaction (PCR) Standard PCR to amplify fragments for subcloning was carried out using 100 ng plasmid DNA template, 50 pmol each primer (Sigma, see Table 2.1 for primer sequences) and 250 µm dntps (Sigma). Reactions were carried out in a final volume of 100 µl, using 1 µl (2.5 units) of cloned Pfu DNA polymerase (Stratagene) in the provided buffer. When necessary 10% DMSO (Fisher Scientific) was included in the reaction mix. Reactions were carried out in an Eppendorf Mastercycler, using the following parameters: 94 C for 3 mins, followed by 25 cycles of [94 C for 1 min, 52 C for 2 mins, 72 C for 3 mins], followed by 72 C for 10 mins. PCR products were 68
69 partially purified using QIAquick PCR Purification Kit (QIAGEN), following the manufacturer s instructions Restriction digests and ligations Plasmid DNA (5µg) or PCR products were digested in a final volume of 50 µl, using 1 µl of each restriction enzyme (New England Biolabs) and the provided buffers. Reactions were incubated at 37 C for 1 hr. Digested DNA fragments were purified by running them in 1% agarose gels (see section above), excising the appropriate bands, and extracting the DNA using QIAquick Gel Extraction Kit (QIAGEN), following the manufacturer s instructions. Ligations were carried out using a 1:4 or 1:8 molar ratio of vector:insert in a final volume of 10 µl, using 1 µl (400 units) of T4 ligase (New England Biolabs) in the provided buffer. Reactions were incubated at RT for 1 hr and the entire volume used to transform CaCl 2 -competent DH5a E.coli Site-directed mutagenesis Point mutations were introduced using single step PCR mutagenesis. Forward and reverse primers were purchased containing the desired point mutations (Sigma, see Table 2.1). PCR reactions were carried out in 50 µl total volume, using 50 ng plasmid DNA template, 125 ng each primer, 0.5 µl 25 mm dntps (New England Biolabs), 1 µl (2.5 units) Pfu turbo DNA polymerase (Stratagene) and the provided buffer. When necessary 10% DMSO (Fisher Scientific) was included in the reaction mix. Reactions were carried out in an Eppendorf Mastercycler using the following parameters: 95 C for 30 secs followed by 16 cycles of [95 C for 30 secs, 55 C for 1 min, 68 C for 2mins/kb plasmid]. Upon completion, the PCR mixture was treated with 1 µl (20 units) Dpn1 to digest template DNA. 5 µl of the reaction mix was then used to transform CaCl 2 -competent DH5a E.coli. 69
70 2.1.6 Preparation of CaCl 2 -competent E.coli A single colony of DH5a E.coli was used to innoculate 5 ml of LB (MSKCC media facility), and the culture was incubated overnight at 37 C with vigorous shaking. The following morning 1 ml of overnight culture was used to innoculate 100 ml LB. The culture was incubated at 37 C with vigorous shaking until it reached an OD 600 of 0.5. The culture was then chilled on ice for 30 mins and centrifuged at 4000 rpm at 4 C for 10 mins. Pelleted E.coli were resuspended in 80 ml cold sterile 100 mm CaCl 2 (Sigma) and incubated on ice for 30 mins. E.coli were pelleted again by centrifugation at 4000 rpm at 4 C for 10 mins, and resuspended in 4 ml sterile 50 mm CaCl 2 containing 25% glycerol. Aliquots of 200 µl were prepared and stored at -80 C Transformation of CaCl 2 -competent E.coli CaCl 2 -competent DH5a E.coli were thawed on ice. 50 µl of E.coli was mixed with DNA (10 µl ligation mix or 100 ng plasmid DNA) and incubated on ice for 30 mins. Samples were incubated at 42 C for 2 mins to induce DNA uptake, followed by addition of 1 ml LB (MSKCC media facility) and incubation at 37 C for 30 mins. Samples were centrifuged at 4000 rpm for 3 mins and the pelleted E.coli were resuspended in µl LB. Transformants were streaked on to LB-agar plates (MSKCC media facility) containing either ampicillin (100 µg/ml) or kanamycin (50 µg/ml) (both from Sigma) Purification of plasmid DNA Plasmid DNA was purified using either QIAprep Spin Miniprep Kit (QIAGEN) (typical yield 10 µg) or QIAfilter Plasmid Maxi Kit (QIAGEN) (typical yield 500 µg), following the manufacturer s instructions. 70
71 2.2 Cell culture and transfection Cell lines and culture conditions 2.2.1a 16HBE14o- cells 16HBE14o- cells, abbreviated here to 16HBE cells, were provided by the Gruenert lab (California Pacific Medical Center), in which this cell line was generated by transforming normal human bronchial epithelial cells with SV40 large T-antigen. 16HBE cells were grown in MEM + GlutaMAX + Earle s salts (Gibco, catalogue number 41090), supplemented with 10% fetal bovine serum (FBS) (BenchMark, lot number A27A00X) and a mixture of penicillin (100 U/ml) and streptomycin (100 µg/ml) antibiotics (Gibco). Cells were grown in a humidified incubator at 37 C with 5% CO 2. Cells were passaged when 50-75% confluent, every 3-4 days b HEK293T cells HEK293T cells were obtained from ATCC. Cells were grown in DME + L-glutamine + sodium pyruvate (MSKCC media facility) supplemented with 10% fetal bovine serum (FBS) (Omega Scientific, lot number ) and a mixture of penicillin (100 U/ml) and streptomycin (100 µg/ml) antibiotics (Gibco). Cells were grown in a humidified incubator at 37 C with 5% CO 2. Cells were passaged when 80% confluent, every 2-3 days Transfection of 16HBE cells with plasmid DNA 3x10 4 cells were seeded in each well of a sterile 24-well cell culture plate (Nunc), corresponding to approximately 1.5x10 4 cells/cm 2. Cells were thoroughly resuspended prior to seeding to avoid aggregation. Cells were allowed to adhere overnight, and were transfected the following day when at a confluency of 10-20%. Cells were transfected with 100 ng plasmid DNA, using 1 µl of lipofectamine LTX transfection reagent 71
72 (Invitrogen) and following the manufacturer s instructions. 16HBE cells were incubated with the transfection mix for 6 hours, before the media was changed to fresh growth media Transfection of 16HBE cells with sirna 3x10 4 cells were seeded in each well of a sterile 24-well cell culture plate (Nunc), corresponding to approximately 1.5x10 4 cells/cm 2. Cells were thoroughly resuspended prior to seeding to avoid aggregation. Cells were allowed to adhere overnight, and were transfected the following day when at a confluency of 10-20%. Cells were transfected with 25 pmol RNA in a final volume of 500 µl (corresponding to a concentration of 50 nm), using 1 µl of lipofectamine LTX transfection reagent (Invitrogen) and following the manufacturer s instructions. 16HBE cells were incubated with the transfection mix overnight (12-16 hours), before the media was changed to fresh growth media. See Table 2.2 for a list of sirna duplexes used. sirna duplex silamin sicontrol RhoA sirna duplex 1 RhoA sirna duplex 2 RhoA sirna duplex 3 RhoA sirna duplex 4 Cdc42 sirna duplex 1 Cdc42 sirna duplex 2 Cdc42 sirna duplex 3 Cdc42 sirna duplex 4 Asef sirna duplex 1 Asef sirna duplex 2 Asef sirna duplex 3 Asef sirna duplex 4 ARHGEF10 sirna duplex 1 ARHGEF10 sirna duplex 2 ARHGEF10 sirna duplex 3 Target sequence ACCAGGUGGAGCAGUAUAA GGAAAUUAUACAAGACCAA AUGGAAAGCAGGUAGAGUU GAACUAUGUGGCAGAUAUC GAAAGACAUGCUUGCUCAU GAGAUAUGGCAAACAGGAU GGAGAACCAUAUACUCUUG GAUUACGACCGCUGAGUUA GAUGACCCCUCUACUAUUG CGGAAUAUGUACCGACUGU GCACAAAGAUGGAGUCAAG GAAAGGAGGCUGCACAUAG ACACCAAGCUCAGCAAGUA GCUCAGAACUCAUCUACUC GAACCUUACCUAAAUAAUG GAAUACGGAUGGAGUUCGA GACGAUGGGAAUCACAUUA 72
73 ARHGEF10 sirna duplex 4 ITSN2 sirna duplex 1 ITSN2 sirna duplex 2 ITSN2 sirna duplex 3 ITSN2 sirna duplex 4 Par6B sirna duplex 1 Par6B sirna duplex 2 Par6B sirna duplex 3 Par6B sirna duplex 4 PRK2 sirna duplex 1 PRK2 sirna duplex 2 PRK2 sirna duplex 3 PRK2 sirna duplex 4 PAK4 sirna duplex 1 PAK4 sirna duplex 2 PAK4 sirna duplex 3 PAK4 sirna duplex 4 GACCUAACCCGUUUAAAGG GAUCAAACGUGACAAGUUG GACAGGAGCUUCUCAAUCA CCAAACAUGUGGGCUAUUA AAACUCAGCUGGCUACUAU GGAAUAAUGUUGUGAGGAA AGACAUCCAUGGAGACUUA CGAAGAAGAUGACAUUAUC GGGUACGUCUUUACAAAUA GACAGAAGAUCUCAGCAAA GGAGCGCUCUGAUGGACAA UAGACAGCCUGAUGUGUGU GUACGCAUCCCUCAACUAG GGAUAAUGGUGAUUGAGAU GGGUGAAGCUGUCAGACUU AGAAUGUGGUGGAGAUGUA CCAUGAAGAUGAUUCGGGA Table 2.2. sirna duplexes used in this study. All duplexes were purchased from Dharmacon Sequential transfection of 16HBE cells with plasmid DNA and sirna In some rescue experiments 16HBE cells were transfected with plasmid DNA followed by sirna. In these experiments, cells were seeded as described in sections and (above). The following day, cells were transfected with 100 ng plasmid DNA, as described in section (above). After 6 hours the DNA transfection mix was removed, cells were washed once with sterile PBS, and the sirna transfection mix was added, as described in section (above). Cells were left overnight, before the media was changed to fresh growth media Transfection of HEK293T cells with plasmid DNA 3x10 5 cells were seeded in each well of a sterile 6-well cell culture plate (Nunc), corresponding to approximately 3x10 4 cells/cm 2, and allowed to adhere overnight. The 73
74 following day cells were transfected while at a confluency of approximately 50%. Cells were transfected with 1 µg of DNA, using 5 µl lipofectamine 2000 transfection reagent (Invitrogen) and following the manufacturer s instructions. Cells were incubated with the transfection mix overnight (12-16 hours), before the media was changed to fresh growth media Sequential transfection of HEK293T cells with sirna and plasmid DNA In some cases the ability of sirna duplexes to downregulate expression of their target gene was determined by expressing exogenous protein in HEK293T cells. 3x10 5 cells were seeded in each well of a sterile 6-well cell culture plate (Nunc), corresponding to approximately 3x10 4 cells/cm 2, and allowed to adhere overnight. The following day cells were transfected while at a confluency of approximately 50%. Cells were first transfected with 100 pmol sirna in a final volume of 2 ml, corresponding to a final concentration of 50 nm, using 5 µl lipofectamine 2000 transfection reagent (Invitrogen) and following the manufacturer s instructions. 6 hours later, the RNA transfection mix was removed from cells and was replaced with DNA transfection mix, containing 1 µg of DNA, using 5 µl lipofectamine 2000 transfection reagent (Invitrogen) and following the manufacturer s instructions. Cells were incubated overnight before the media was changed to fresh growth media Infection of 16HBE cells with retrovirus Retroviral particles were produced by triply transfecting HEK293T cells with 1 µg retroviral expression vector (pbabe), 1 µg VSV-G expression vector and 1 µg Gag/Pol expression vector, using 5 µl lipofectamine 2000 transfection reagent and the transfection protocol described in section (above). The following day, the transfection mix was removed, cells were washed once in sterile PBS (MSKCC media facility) and 2 ml of 16HBE growth media was added. HEK293T cells were incubated in 16HBE growth media for 24 hours to collect secreted viral particles. The media was then collected and filtered through a 0.45 µm filter (Sarstedt), and supplemented with 8 74
75 µg/ml polybrene (hexadimethrine bromide, Sigma). This mix was added to 16HBE cells, which had been seeded at a density of 1.5x10 4 cells/cm 2 in a 6-well cell culture dish the previous day. 16HBE cells were incubated overnight with the virus-containing media, which was then removed and fresh growth media added. 48 hours after infection, infected cells were selected using growth media containing 1.5 µg/ml puromycin (Invitrogen) Calcium-switch in 16HBE cells Junction formation was induced in 16HBE cells using the calcium-switch technique. 16HBE monolayers were washed 3 times in PBS without calcium (MSKCC core facility) to remove all traces of calcium. Cells were then incubated for 4 hours in DMEM without calcium chloride (Gibco catalogue number 21068) supplemented with 10% calcium-depleted FBS (BenchMark, lot number A27A00X) and a mixture of penicillin (100 U/ml) and streptomycin (100 µg/ml) antibiotics (Gibco). Calcium was depleted from FBS by chelation using Chelex 100 Resin (Bio-Rad). 80 g Chelex resin was dissolved in 2 L water and the ph adjusted to 7.4 using hydrochloric acid. The resin was then removed from solution by filtering through Whatman no. 1 filter paper and incubated with 200 ml FBS at RT for 3 hours. Calcium-depleted FBS was purified by filtering through Whatman no. 1 filter paper and sterilized by filtering through a 0.2 µm filter (Sarstedt). Following incubation in calcium-depleted media, junction assembly was induced by changing cells back to normal 16HBE growth media containing calcium (see section 2.2.1a). 2.3 Protein biochemistry Preparation of cell lysates Total cell lysates were prepared by adding protein sample buffer (2% (v/v) SDS, 0.1 M DTT, 50 mm Tris-HCl ph6.8, 10% (v/v) glycerol, 0.1% (v/v) bromophenol blue) to 75
76 cells on ice, and scraping using a cell scraper or a pipette tip. HEK293T cells grown in 6-well plates were lysed in 250 µl protein sample buffer, while 16HBE cells grown in 24-well plates were lysed in 100 µl protein sample buffer. The lysate was boiled at 100 C for 5 mins to denature proteins, then sonicated in a sonicating waterbath for 1 min to shear DNA. Soluble fractions were prepared by adding 100 µl of 0.1% NP40 lysis buffer (0.1% (v/v) NP-40 (Igepal CA630, Sigma), 50 mm Tris-HCl ph 8.0, 150 mm NaCl, supplemented with 0.5 mm PMSF (Fluka, stock solution 100 mm in methanol) and Complete protease inhibitor cocktail tablet (Roche)) to 16HBE cells grown in a 24-well plate. Cells were scraped on ice with a pipette tip to aid solubilization. The lysate was transferred to a 1.5 ml microcentrifuge tube and centrifuged at rpm at 4 C for 10 mins. The supernatant was transferred to a fresh microcentrifuge tube and 25 µl 5X protein sample buffer added (to give a final concentration of 1X protein sample buffer). The sample was boiled at 100 C for 5 mins to denature proteins, then sonicated in a sonicating waterbath for 1 min to shear DNA SDS Polyacrylamide Gel Electrophoresis (SDS-PAGE) Protein samples were prepared in protein sample buffer (see section above) and loaded on to 1.5 mm thick polyacrylamide gels. Separating gels were prepared by diluting a stock solution of 30% acrylamide/0.8% bis-acrylamide (National Diagnostics) to a final concentration of 7.5%-15% (w/v) acrylamide (depending on the molecular weight of the protein of interest) in 350 mm Tris-HCl ph8.6, 0.1% SDS, and adding 0.1% (w/v) ammonium persulphate (Amersham Biosciences) and 0.001% (v/v) tetramethylethlyenediamine (TEMED, Fisher scientific) to polymerize. Stacking gels were prepared by diluting a stock solution of 30% acrylamide/0.8% bis-acrylamide to a final concentration of 4% (w/v) acrylamide in 130 mm Tris-HCl ph6.8, 0.1% SDS, and adding 0.2% (w/v) ammonium persulphate and 0.002% (v/v) TEMED to polymerize. A full-range rainbow protein marker (Amersham) was included to allow determination of protein size. Proteins were resolved by running gels at 120 V for approximately 90 76
77 minutes in a Bio-Rad minigel apparatus, in a running buffer containing 200 mm glycine, 25 mm Tris base and 0.05% (w/v) SDS. Proteins were transferred to a PVDF membrane to allow protein visualization (see section 2.3.3, below) Western blot analysis Proteins were resolved by SDS-PAGE (see section 2.3.2, above). Proteins were transferred to methanol-activated PVDF membrane (0.45 µm pore size, Millipore) using a Bio-Rad minitransfer apparatus, in a transfer buffer containing 125 mm glycine, 25 mm Tris base, 0.1% (w/v) SDS and 10% (v/v) methanol. The transfer was carried out at 40V in a 4 C cold room for 2 hours. Following protein transfer membranes were blocked with a solution of 5% milk in TBS-T (50 mm Tris-HCl ph8.0, 150 mm NaCl, 0.1% Tween20 (Sigma)) for 30 mins at RT. Primary antibody incubations were performed overnight in 5% milk in TBS-T at 4 C (see Table 2.3 for a list of antibodies used). Membranes were washed 3 x 10 mins in TBS-T. Secondary antibody incubations were carried out using HRP-conjugated secondary antibodies (DakoCytomation) diluted 1:5000 in 5% milk in TBS-T, for 1 hour at RT. Membranes were washed 4 x 10 mins in TBS-T. Proteins were detected using ECL Western Blotting Detection Reagents (Amersham), following the manufacturer s instructions, and visualized by exposing Fuji medical X-ray film (Crystalgen). Antibody Host Clone Source Cat. # Stock (µg/ml) IF (µg/ml) WB (µg/ml) LaminA/C mouse 636 Santa Cruz sc α-tubulin rat YL1/2 Serotec MCA77S n/a - 1:1000 β-actin mouse AC-74 Sigma A flag mouse M2 Sigma F myc mouse 9E10 CRUK n/a HA mouse 12CA5 CRUK n/a HA rat 3F10 Roche RhoA mouse 26C4 Santa Cruz sc RhoA/C rabbit poly Santa Cruz sc RhoB rabbit poly Santa Cruz sc Rac1 mouse 23A8 Upstate
78 Cdc42 mouse 44 BD Transduction ITSN2 mouse poly Abnova H n/a - 1: A01 p115rhogef goat poly Santa Cruz sc Par6B rabbit poly Santa Cruz sc PRK1 mouse 49 BD Transduction PRK2 mouse 22 BD Transduction PAK4 rabbit poly Cell Signaling 3242 n/a 1:100 1:1000 E-cadherin mouse 34 BD Transduction E-cadherin rat ECCD-2 Invitrogen β-catenin mouse 14 BD Transduction β-catenin rabbit poly Invitrogen Occludin rabbit poly Zymed Occludin mouse OC-3F10 Zymed ZO-1 mouse 1A12 Zymed ZO-1 rabbit poly Zymed Table 2.3 Antibodies used in this study. All primary antibodies used for western blot analysis and immunofluorescence microscopy are listed, with working concentrations. In some cases the concentration is not known, and the working dilution is given. Poly - polyclonal. 2.4 Immunofluorescence microscopy Preparation of coverslips 13 mm glass coverslips (Fisher Scientific) were treated with 70% nitric acid for 15 mins with gentle agitation. Coverslips were washed for 20 mins under a flowing deionized water tap. Coverslips were then washed several times in methanol to remove all traces of water, and transferred to a glass petri dish. Once dry, coverslips were sterilized by baking for 30 minutes at 180 C. 78
79 2.4.2 Fixing and immunostaining 16HBE cells were seeded on glass coverslips in 24-well cell culture plates. Following experimental manipulation, cells were washed once in PBS (MSKCC media facility) and fixed. Unless otherwise stated, cells were fixed by incubating in 3.7% (v/v) formaldehyde (Sigma), diluted in PBS, for 20 mins at RT. Following formaldehyde fixation, coverslips were washed 5 times in PBS, and cells were permeabilized with 0.5% (v/v) Triton X-100 in PBS for 5 mins at RT. In some cases cells were fixed by incubating in ice cold methanol for 5 mins at -20 C. Following methanol fixation, cells were washed 5 times in PBS at RT. Coverslips were incubated with primary antibodies diluted in PBS for 1 hour at RT (see Table 2.3 for a list of antibodies used). Coverslips were then washed 5 times in PBS. Secondary antibody incubations were carried out using Alexa488- or Alexa568- conjugated secondary antibodies (Invitrogen) diluted 1:500 in PBS, incubating for 45 mins at RT. In some experiments, rhodamine-conjugated phalloidin (Invitrogen, stock solution prepared in methanol according to manufacturer s instructions, diluted 1:250 in PBS) was added to the secondary antibody mix, to allow visualization of filamentous actin. Coverslips were then washed 5 times in PBS. Hoechst (Sigma) was included in the first PBS wash at a concentration of 1 µg/ml, to visualize DNA. Following immunostaining, coverslips were mounted on glass microscope slides (Fisher Scientific) using Dako fluorescent mounting medium (DakoCytomation). Mounting solution was allowed to set by incubating coverslips at 37 C for 1 hour or at RT overnight Immunofluorescence microscopy Stained cells were visualized using a Zeiss Axio inverted fluorescence microscope. Images were captured using a Hamamatsu ORCA-ER digital camera and AxioVision computer software. In each experiment the camera exposure time was optimized for each fluorescence channel using the control sample, and all further images were captured with the same camera settings, making fluorescence intensity comparisons possible. Captured images were saved as TIFFs to allow further analysis in other 79
80 software programmes. For presentation purposes, images were processed using Adobe photoshop. In some experiments, brightness and contrast settings were changed to improve image quality. In most experiments, images were cropped to increase image size and facilitate visualization. In all cases, all images within an experiment were processed in an identical manner, allowing comparison of image intensity and size Quantification of tight junction formation Tight junction formation in 16HBE cells was quantified after staining cells with antioccludin or anti-zo-1 antibody. 12 random non-overlapping images were taken at 40X magnification (see section above), containing approximately cells. Images were saved in TIFF format and later opened in Metamorph image analysis software. For each cell, tight junction integrity was assessed. Cells with a continuous staining of occludin or ZO-1 at cell-cell contacts were defined as having intact tight junctions, whereas cells with punctate discontinuous staining or no staining at cell-cell contacts were defined as not having intact tight junctions. In control monolayers mitotic cells (approximately 3-5% of total cells), identified by DNA staining, sometimes exhibit disruptions in their tight junction staining. Mitotic cells were therefore not included in our analysis of tight junction integrity. Cells were counted manually using the Metamorph manual count option. The percentage of cells with intact tight junctions was calculated and represented in bar charts, in which error bars correspond to the SEM (Standard Error of the Mean) of at least 3 independent experiments. SEM was calculated by the following formula: SEM = standard deviation/ n. 80
81 CHAPTER3 - Results RNAi screens to identify Rho GEFs, GAPs and effector proteins required for tight junction formation. 3.1 Overview 16HBE14o- human bronchial epithelial cells (abbreviated to 16HBE) were chosen as a model epithelial cell line to study the signalling pathways regulating tight junction formation. 16HBE cells cultured on glass coverslips form tight junctions, which can be analysed by immunofluorescence microscopy using antibodies against tight junction proteins such as ZO-1 and occludin. 16HBE cells seeded at low density can be transfected with sirna with high efficiency, such that 72 hours post-transfection cells are approaching confluence and have formed tight junctions, defined here as a continuous ring of ZO-1 or occludin protein localized at cell-cell contacts. As expected, downregulation of RhoA or Cdc42 prevented tight junction formation in this assay, and served as positive controls in screens to identify components of Rho GTPase signalling pathways required for tight junction formation. These screens identified three Rho GEFs, namely Asef, ARHGEF10 and ITSN2, and three Rho effector proteins, namely PAK4, PRK2 and Par6B, as potential regulators of tight junction formation. Screens were carried out using SMARTpool sirna reagents (Dharmacon) consisting of a pool of 4 distinct sirna duplexes targeting each gene. To assess the specificity of the observed tight junction defects, the sirna duplexes making up each pool were transfected individually. The ability of each sirna duplex to knockdown expression of its target protein was determined by western blot analysis, and was compared with its ability to prevent tight junction formation. Based on this analysis, we concluded that the tight junction defect observed after transfection of Asef, ARHGEF10 or ITSN2 sirna is likely to be caused by a non-specific mechanism, whereas the tight junction defect observed after transfection of PAK4, PRK2 or Par6B sirna is likely to be a specific consequence of downregulation of these proteins. 81
82 3.2 16HBE cells as a model for tight junction formation 16HBE14o- cells (abbreviated here to 16HBE cells) are SV40 large T-antigentransformed human bronchial epithelial cells. When cultured in vitro they form monolayers with many of the properties of normal epithelial cells, including the presence of tight junctions and cilia detected by transmission EM, and the generation of transepithelial electrical resistance (TER) (Cozens et al., 1994). This is in contrast to most transformed epithelial cell lines, which do not retain these properties. We therefore decided to assess the suitability of 16HBE cells for RNAi-based screens. 16HBE cells were seeded on glass coverslips at low density (1.5 x 10 4 cells/cm 2 ) and allowed to adhere overnight. The following day cells were transfected with sirna targeting lamina/c (silamin) at a concentration of 50 nm using lipofectamine LTX transfection reagent. 72 hours later knockdown efficiency was determined by immunofluorescence microscopy and western blot analysis with an anti-lamina/c antibody (Figure 3.1). Typically 80-90% of cells showed a clear knockdown of lamina/c expression. The ability of 16HBE cells to form tight junctions after transfection with sirna was determined by comparing untransfected cells with cells transfected with a control sirna (sicontrol, not known to knockdown expression of any genes) and cells transfected with silamin. 72 hours post-transfection tight junction formation was assessed by staining with an anti-occludin antibody. Untransfected cells are approaching confluence by this time, and the majority of cells have a continuous ring of occludin staining at cell-cell contacts (Figure 3.2). sicontrol- and silamintransfected cells were indistinguishable from untransfected cells, showing that the transfection protocol itself does not have any adverse effects on cell behaviour. The percentage of cells forming tight junctions, defined as the presence of a continuous ring of occludin staining at cell-cell contacts, was determined by taking 12 random nonoverlapping images at 40X magnification (typically cells in total) and scoring cells for the presence of a continuous ring of occludin staining at cell-cell contacts. Cells with discontinuous punctate occludin staining at cell-cell contacts, or cells completely lacking occludin staining at cell-cell contacts, do not have tight junctions. 82
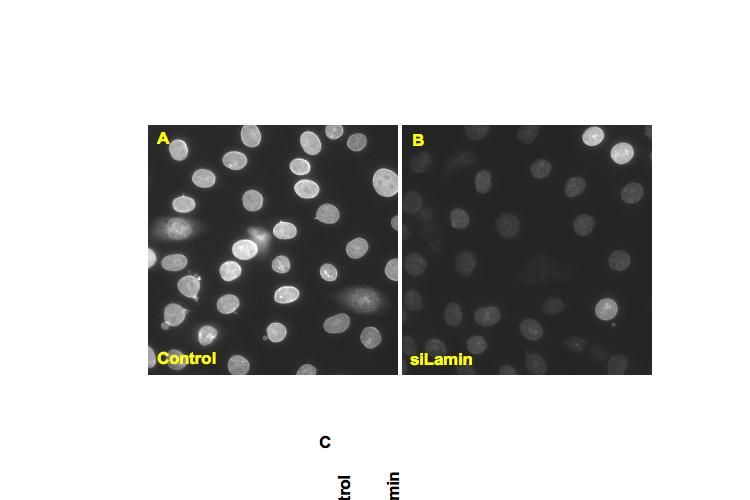
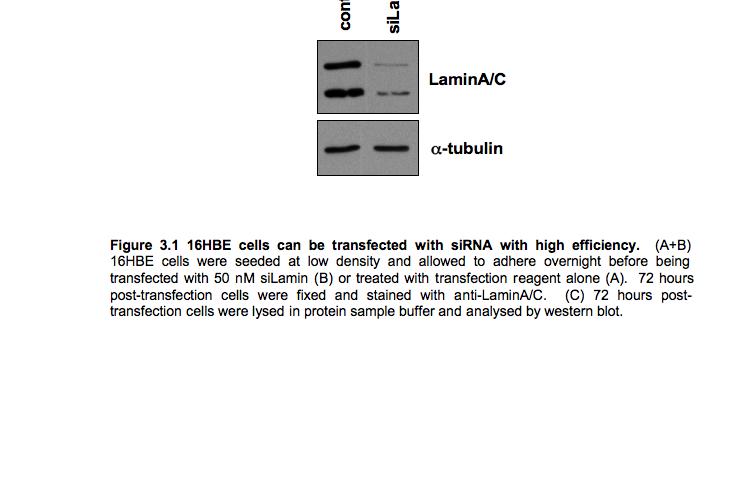
83 83
.")

84 16HBE cells consistently form tight junctions in this assay, and this is not affected by transfection with control sirna duplexes (Figure 3.2). The high transfection efficiency of these cells together with their ability to reproducibly form tight junctions that can be readily assessed by immunofluorescence microscopy makes them a suitable model cell line for RNAi screens to identify proteins required for tight junction formation. 84
85 3.3 RhoA and Cdc42 are required for tight junction formation The three best-characterized members of the Rho family, namely RhoA, Rac1 and Cdc42, have each been implicated in tight junction formation (see introduction, section 1.5.1). However these experiments have mainly been carried out in MDCK cells and keratinocytes, two established cell culture models for studying epithelial morphogenesis. To examine whether these GTPases are required for tight junction formation in 16HBE cells, cells were transfected with SMARTpool sirna targeting RhoA, Rac1 and Cdc hours post-transfection many cells transfected with sirhoa or sicdc42 did not have tight junctions, seen as a failure to localize occludin at cell-cell contacts (Figure 3.3). This defect in tight junction formation was not a result of loss of expression of junctional proteins as occludin and E-cadherin expression were not affected by knockdown of RhoA or Cdc42 (Figure 3.3G). Cells transfected with sirac1 were indistinguishable from control cells. Protein expression level was determined by western blot analysis, which revealed that RhoA and Cdc42 expression was strongly reduced by transfection of sirhoa and sicdc42 respectively (Figure 3.3F). sirac1 only partially reduced expression of Rac protein, which might explain why sirac1 does not affect tight junction formation (discussed further below, section 3.6). To assess the specificity of the tight junction defect observed after transfection of RhoA and Cdc42 SMARTpool sirna, the 4 duplexes comprising the SMARTpool were transfected individually. Transfection of all 4 RhoA sirna duplexes resulted in the same tight junction defect observed after transfection of the RhoA SMARTpool, and in each case RhoA protein level was reduced (Figure 3.4). RhoA sirna duplex 1 was particularly efficient at knocking down RhoA expression, and resulted in a more severe defect in tight junction formation, as far as number of cells affected is concerned. Transfection of 3 out of 4 Cdc42 sirna duplexes resulted in the same tight junction defect observed after transfection of the Cdc42 SMARTpool, with a corresponding decrease in Cdc42 expression (Figure 3.5). Cdc42 sirna duplex 1 did not knockdown expression of Cdc42, and did not affect tight junction formation. For both RhoA and Cdc42 the phenotype observed after transfection of sirna is therefore likely to be a specific consequence of loss of the target protein, as in each case multiple distinct 85
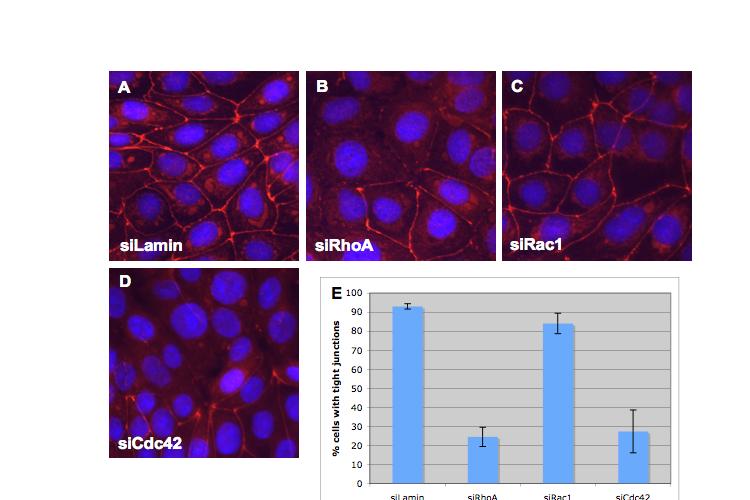
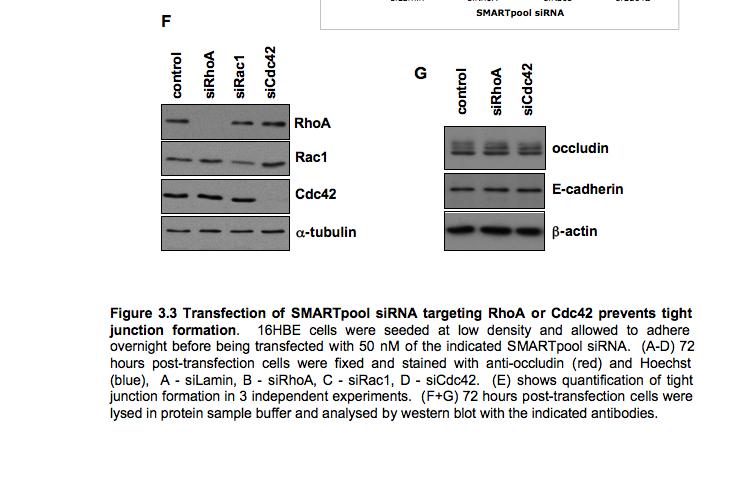
86 86
87 87
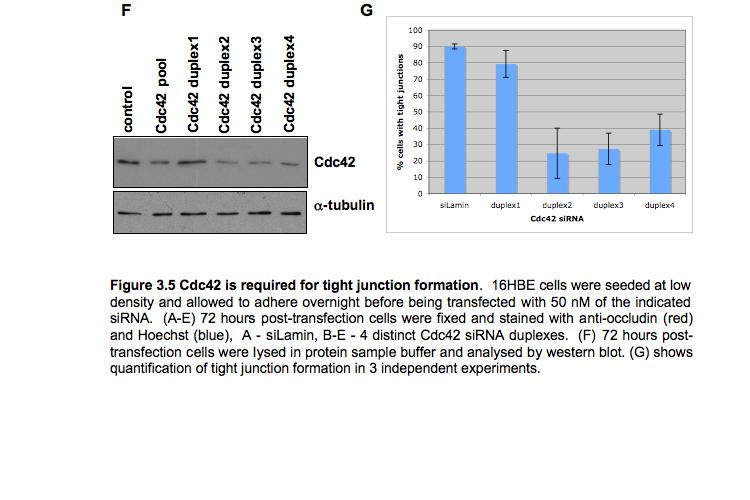
88 88
89 sirna duplexes impair tight junction formation. These experiments show that RhoA and Cdc42 are required for tight junction formation in 16HBE cells, as expected based on experiments carried out in other cell types. 3.4 Screening of Rho GEFs and Rho GAPs To identify upstream regulators of Rho GTPases required for tight junction formation, we screened SMARTpool sirna libraries targeting 82 known human Rho GEFs and 66 known human Rho GAPs (see Tables 3.1 and 3.2 for a complete list of genes targeted), using the assay described above with sirhoa and sicdc42 as positive controls. Transfection of three Rho GEF SMARTpool reagents resulted in a failure to form tight junctions, phenocopying knockdown of RhoA or Cdc42, while none of the Rho GAP SMARTpool reagents generated this phenotype. The 3 hits from the Rho GEF screen were Asef (ARHGEF4), ARHGEF10 and ITSN2 (intersectin2) (Figure 3.6). This screen therefore identified these proteins as potential regulators of tight junctions. Table 3.1 (below) Rho GEF genes targeted with sirna. All sirna reagents used are sigenome SMARTpool sirna purchased from Dharmacon. Number Gene name Accession # Alternative names 1 SWAP70 NM_ SGEF NM_ PREX1 NM_ GEFT NM_ p63 RhoGEF 5 ARHGEF10 NM_ NBR, neuroblastoma 6 FLJ10521 NM_ GrinchGEF 7 FGD6 XM_ DNMBP NM_ Tuba 9 MCF2 NM_ Dbl 10 MCF2L NM_ Dbs, ARHGEF14 11 DOCK4 NM_ DOCK5 NM_ DOCK6 NM_ DOCK7 NM_
90 15 DOCK8 NM_ NGEF NM_ Ephexin 17 FGD2 NM_ SPATA13 NM_ Asef2 19 MCF2L2 NM_ DEF6 NM_ IBP 21 FGD4 NM_ Frabin 22 ARHGEF19 NM_ FGD3 NM_ DOCK10 XM_ PLEKHG5 NM_ DOCK9 NM_ AKAP13 NM_ Lbc 28 LOC XM_ ECT2 NM_ FARP1 NM_ CDEP 31 FARP2 XM_ FRG 32 ABR NM_ ALS2 NM_ Alsin 34 ARHGEF3 NM_ ARHGEF4 NM_ Asef 36 ARHGEF10 NM_ ARHGEF15 NM_ Vsm-RhoGEF 38 BCR NM_ PLEKHG2 NM_ Clg 40 DOCK1 NM_ DOCK DOCK2 NM_ DOCK3 NM_ FLJ10665 NM_ NET1 NM_ C9ORF100 NM_ FLJ20148 NM_ ITSN1 NM_ Intersectin1 48 ITSN2 NM_ Intersectin2 49 ARHGEF12 NM_ Larg 50 ARHGEF2 NM_ GEF-H1 51 KIAA1639 XM_ Obscurin 52 ARHGEF18 NM_ p114-rhogef 53 ARHGEF1 NM_ p115-rhogef 54 ARHGEF17 NM_ p164-rhogef 55 ARHEGF11 NM_ PDZ-RhoGEF 56 ARHGEF9 XM_ h-pem2, collybistin 57 ARHGEF6 NM_ α-pix 58 ARHGEF7 NM_ β-pix 59 RASGRF1 NM_ RASGRF2 NM_ SOS1 NM_ SOS2 NM_ TIAM1 NM_ TIAM2 NM_ ARHEGF5 NM_ TIM 66 TRIO NM_ VAV1 NM_ VAV2 NM_
91 69 VAV3 NM_ FGD5 XM_ PLEKHG1 XM_ RGNEF XM_ FLJ10357 XM_ PLEKHG4B NM_ PLEKHG7 NM_ LOC XM_ LOC XM_ DOCK11 NM_ FGD1 NM_ KALRN NM_ Duet 81 PLEKHG4 NM_ PLEKHG3 NM_ Table 3.1 (above) Rho GEF genes targeted with sirna. SMARTpool sirna purchased from Dharmacon. All sirna reagents are sigenome Table 3.2 (below) Rho GAP genes targeted with sirna. SMARTpool sirna purchased from Dharmacon. All sirna reagents are sigenome Number Gene name Accession # Alternative names 1 7H3 NM_ SYDE1 2 ARHGAP1 NM_ ARHGAP10 NM_ GRAF2 4 ARHGAP11A NM_ ARHGAP12 NM_ ARHGAP15 NM_ ARHGAP17 NM_ RICH1 8 ARHGAP18 NM_ ARHGAP19 NM_ ARHGAP20 NM_ ARHGAP21 NM_ ARHGAP22 NM_ ARHGAP23 XM_ ARHGAP24 NM_ ARHGAP25 NM_ ARHGAP26 NM_ GRAF 17 ARHGAP28 NM_ ARHGAP4 NM_ ARHGAP5 NM_ ARHGAP6 NM_ ARHGAP8 NM_ ARHGAP9 NM_ BNIP2 NM_ C5ORF5 NM_
92 25 CDGAP NM_ CENTD1 NM_ ARAP2 27 CENTD2 NM_ ARAP1 28 CENTD3 NM_ ARAP3 29 CHN1 NM_ chimaerin-1 30 CHN2 NM_ chimaerin-2 31 DEPDC1 NM_ DEPDC1B NM_ DLC1 NM_ STARD12, p112-rhogap 34 FKSG42 NM_ FLJ13815 XM_ SYDE2 36 FLJ30058 NM_ FLJ32810 XM_ GMIP NM_ GRLF1 NM_ p190-rhogap 40 HA-1 NM_ INPP5B NM_ KIAA0672 NM_ KIAA1688 NM_ LOC NM_ ARHGAP27 45 LOC NM_ ARHGAP30 46 LOC XM_ LOC XM_ LOC XM_ MYO9A NM_ MYO9B NM_ OCRL NM_ INPP5F 52 OPHN1 NM_ PARG1 NM_ ARHGAP29 54 PIK3R1 NM_ p85-alpha 55 PIK3R2 NM_ p85-beta 56 RACGAP1 NM_ Mgc-RacGAP 57 RALBP1 NM_ RICS NM_ GRIT, p200-rhogap 59 SH3BP1 NM_ SNX26 NM_ TCGAP 61 SRGAP1 NM_ SRGAP2 NM_ SRGAP3 NM_ STARD13 NM_ DLC2 65 STARD8 NM_ DLC3 66 TAGAP NM_ Table 3.2 (above) Rho GAP genes targeted with sirna. SMARTpool sirna purchased from Dharmacon. All sirna reagents are sigenome 92
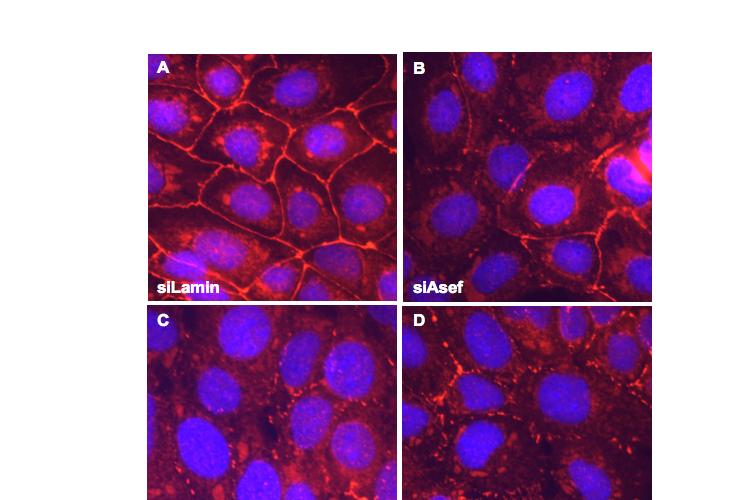
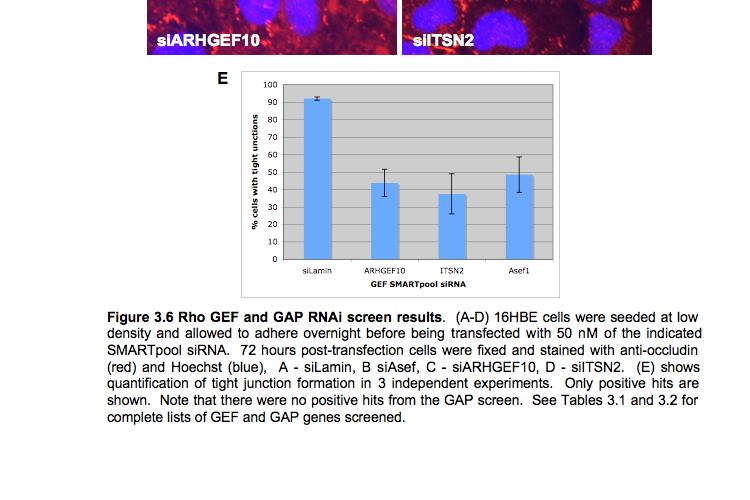
93 93
94 To assess the specificity of the tight junction defect observed after transfection of these SMARTpool sirna reagents, the 4 duplexes making up the SMARTpool were transfected individually. Transfection of 16HBE cells with Asef sirna duplex 2 resulted in the same tight junction defect seen after transfection of Asef SMARTpool sirna, while transfection of Asef sirna duplexes 1, 3 and 4 had no effect (Figure 3.7). We were not able to detect Asef expression in 16HBE cells using an anti-asef antibody (data not shown). To check which Asef duplexes can knockdown expression of Asef, HEK293T cells were transfected with Asef sirna duplexes followed by a flag-tagged human Asef cdna, and expression of exogenous Asef was determined by western blot using an anti-flag antibody. Several bands were detected after expression of Asef, presumably as a result of post-translational modifications (Figure 3.7). Asef sirna duplexes 1 and 3 were able to downregulate Asef expression, but Asef sirna duplexes 2 and 4 were not. The inability of Asef sirna duplex 2 to downregulate expression of Asef suggests that the defect in tight junction formation in 16HBE cells caused by transfection of this duplex is not a specific consequence of loss of Asef protein. Transfection of 16HBE cells with ARHGEF10 sirna duplex 3 resulted in the same tight junction defect seen after transfection of ARHGEF10 SMARTpool sirna, while transfection of ARHGEF10 sirna duplexes 1, 2 and 4 had no effect (Figure 3.8). There is currently not an antibody against ARHGEF10 protein, so to check which ARHGEF10 sirna duplexes can knockdown expression of ARHGEF10, HEK293T cells were transfected with ARHGEF10 sirna duplexes followed by a myc-tagged human ARHGEF10 cdna, and expression of exogenous ARHGEF10 was determined by western blot using an anti-myc antibody. All 4 ARHGEF10 sirna duplexes were able to downregulate expression of ARHGEF10 protein (Figure 3.8). The observation that ARHGEF10 sirna duplexes 1, 2 and 4 are able to downregulate expression of ARHGEF10 as efficiently as ARHGEF10 sirna duplex 3 and yet do not impair tight junction formation suggests that the defect in tight junction formation observed after transfection of ARHGEF10 sirna duplex 3 is not caused by knockdown of ARHGEF10 protein. 94
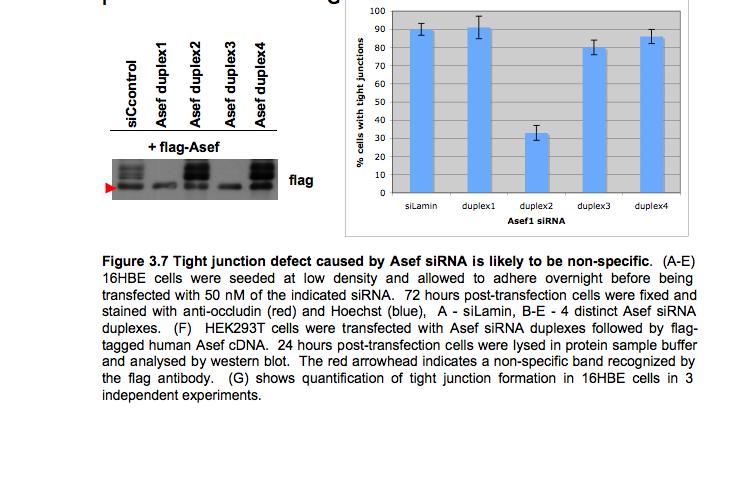
95 95
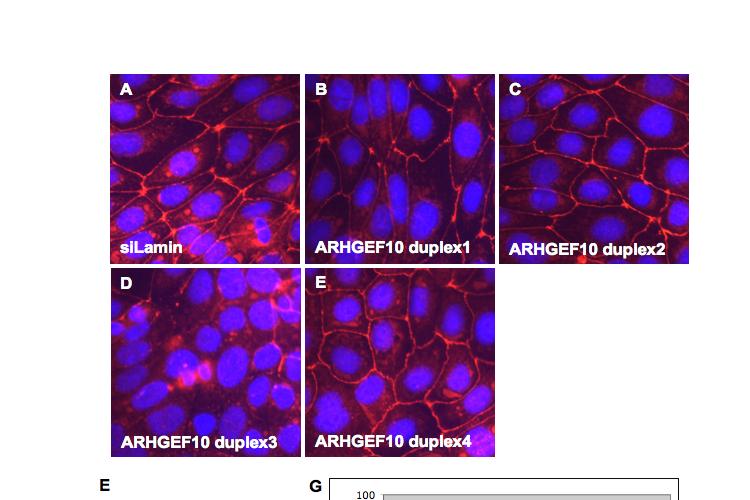
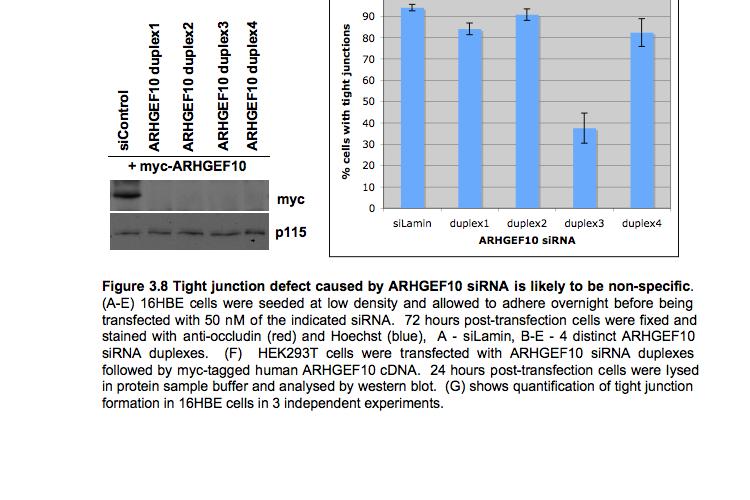
96 96
97 Transfection of 16HBE cells with ITSN2 sirna duplex 3 resulted in the same tight junction defect seen after transfection of ITSN2 SMARTpool sirna, while transfection of ITSN2 sirna duplexes 1, 2 and 4 had no effect (Figure 3.9). To check which ITSN2 sirna duplexes can downregulate expression of ITSN2, lysates from 16HBE cells were analysed by western blot with an anti-itsn2 antibody. All 4 ITSN2 sirna duplexes were able to knockdown expression of endogenous ITSN2 protein isoforms to a similar extent (Figure 3.9). The observation that ITSN2 sirna duplexes 1, 2 and 4 are able to downregulate expression of ITSN2 as efficiently as ITSN2 sirna duplex3 and yet do not impair tight junction formation suggests that the defect in tight junction formation observed after transfection of ITSN2 sirna duplex 3 is not caused by specific knockdown of ITSN2 protein. 97
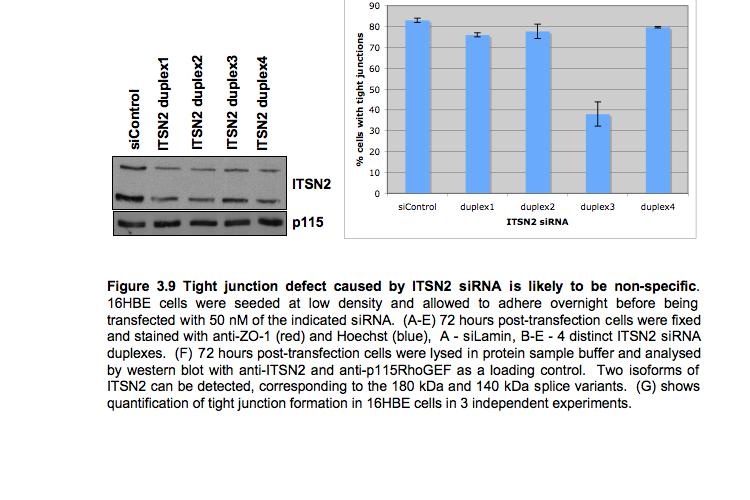
98 98
99 3.5 Screening of Rho effector proteins To identify Rho effector proteins required for tight junction formation, we screened a SMARTpool sirna library targeting known Rho effector proteins (Table 3.3). In the light of our failure to identify any Rho GEFs or GAPs using this approach, we decided to screen our effector proteins individually and also in families of related proteins. Redundancy amongst closely related proteins could result in failure to identify proteins required for tight junction formation when only one family member is targeted. 16HBE cells were transfected with the 92 SMARTpool sirna reagents listed in Table 3.3, and tight junction formation was assessed 72 hours post-transfection by staining with an anti-occludin antibody. This screen identified PAK4, Par6B and PRK2 as potential regulators of tight junction formation. Transfection of SMARTpool sirna targeting these genes resulted in a large number of cells without tight junctions (Figure 3.10a). PAK4 belongs to a family of proteins including PAK5 and PAK6 (the class II PAK family). In this screen transfection of PAK6 SMARTpool sirna resulted in a partial decrease in tight junction formation, while transfection of PAK5 SMARTpool sirna had no effect (Figure 3.10a, red bars in G). Par6B belongs to a family of proteins including Par6A and Par6G, however transfection of Par6A or Par6G SMARTpool sirna had no effect on tight junction formation (Figure 3.10a, green bars in G). PRK2 belongs to a family of proteins including PRK1 and PRK3. Transfection of PRK1 SMARTpool sirna resulted in a slight decrease in tight junction formation, while transfection of PRK3 SMARTpool sirna had no effect (Figure 3.10a, yellow bars in G). 99
100 Table 3.3 (below) Rho effector genes targeted with sirna. All sirna reagents are sigenome SMARTpool sirna purchased from Dharmacon. Number Gene name Gene ID Alternative names 1 ARFIP Arfaptin 2 BAIAP IRSp53 3 CCM CDC42BPA 8476 MRCKα 5 CDC42BPB 9578 MRCKβ 6 CDC42EP Borg5 7 CDC42EP Borg1 8 CDC42EP Borg2 9 CDC42EP Borg4 10 CDK5R Cdk5 regulatory subunit 1 11 CDKN1B 1027 kip1/p27 12 CIT Citron kinase 13 CNKSR CNKSR CNKSR CYFIP SRA1 17 DAAM DGKG 1608 Diacylglycerol kinase-γ 19 DGKQ 1609 Diacylglycerol kinase-θ 20 DIAPH DRF1, Dia1 21 DIAPH DRF2, Dia2 22 DIAPH DRF3, Dia3 23 ELMO ELMO ELMO EXOC Exo70 27 FHOD FLNA 2316 Filamin-A 29 FMNL1 756 Formin-like 1 30 GNB GOPC PIST 32 HSMDPKIN CDC42BPG, MRCKγ 33 IQGAP IQGAP KTN Kinectin 36 MAP3K MEKK1 37 MAP3K MLK2 38 MAP3K MLK2 39 MAP3K MEKK4 40 MAP3K MEKK5 41 M-RIP NCF p67phox 43 NOX NADPH oxidase 1 44 NOXA NADPH oxidase activator 1 45 PAK PAK PAK
101 48 PAK PAK PAK PAK5 51 PARD6A Par6A 52 PARD6B Par6B 53 PARD6G Par6G 54 PDE6D 5147 Phosphodiesterase 6D 55 PIK3R p85α 56 PIK3R p85β 57 PIK4CB PIP5K1A PIP5K1B PIP5K1C PITPNM PKN PRK3 63 PLCB PhospholipaseC-β2 64 PLCB PhospholipaseC-β3 65 PLCE PhospholipaseC-ε1 66 PLCG PhospholipaseC-γ1 67 PLD PhospholipaseD 68 PLXNA plexina1 69 PLXNB plexinb1 70 PLXNB plexinb2 71 PPP1R12A 4659 Protein phosphatase 1 72 PRKCL PRK1, PKN1 73 PRKCL PRK2, PKN2 74 RCC RHPN Rhophilin1 76 RHPN Rhophilin2 77 ROCK ROK1 78 ROCK ROK2 79 RPS6KB RTKN 6242 Rhotekin 81 SH3RF POSH 82 SMURF SPRED SYNJ Synaptojanin1 85 SYNJ Synaptojanin2 86 TNK TNK ACK1 88 FNBP1L TOCA 89 TRIP CIP4 90 USP WAS 7454 WASP 92 WASL 8976 N-WASP Table 3.3 (above) Rho effector genes targeted with sirna. All sirna reagents are sigenome SMARTpool sirna purchased from Dharmacon. 101
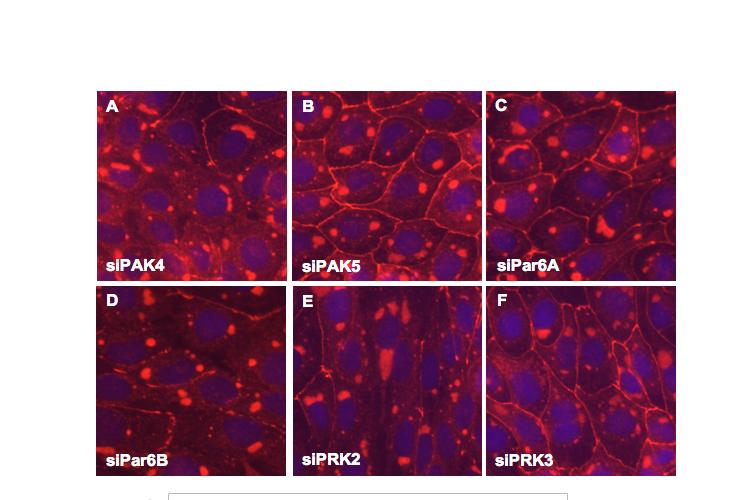
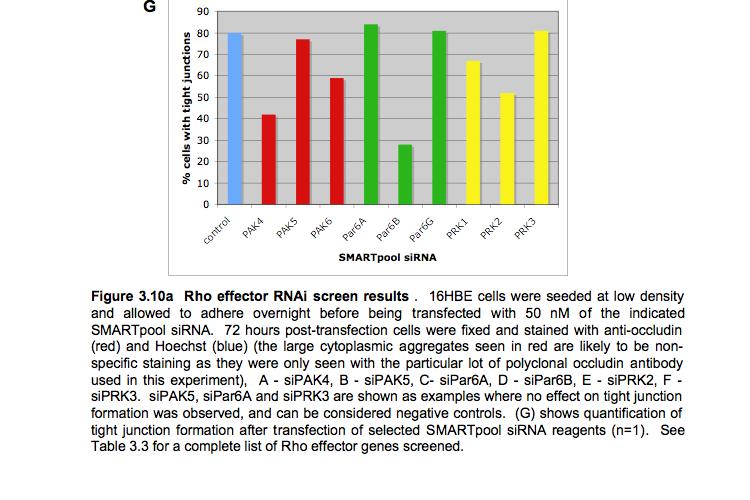
102 102
103 In a parallel screen, 16HBE cells were transfected with the combinations of SMARTpool sirna reagents listed in Table 3.4. Where two genes were targeted, each sirna was transfected at a concentration of 25 nm. Where three genes were targeted, each sirna was transfected at a concentration of 16.7 nm. The total sirna concentration was thus maintained at 50 nm for all experiments. Number SMARTpool sirnas co-transfected 1 MRCKα + MRCKβ 2 CDC42BP1 + CDC42BP2 + CDC42BP3 3 CDC42BP2 + CDC42BP3 + CDC42BP4 4 DGKG + DGKQ 5 Dia1 + Dia2 6 Dia1 + Dia3 7 Dia2 + Dia3 8 Dia1 + Dia2 + Dia3 9 ELMO1 + ELMO2 + ELMO3 10 IQGAP1 + IQGAP2 11 PAK1 + PAK2 12 PAK1 + PAK3 13 PAK2 + PAK3 14 PAK1 + PAK2 + PAK3 15 PAK4 + PAK5 16 PAK4 + PAK6 17 PAK5 + PAK6 18 PAK4 + PAK5 + PAK6 19 PIK3R1 + PIK3R2 20 PIP5K1A + PIP5K1B + PIP5K1C 21 PRK1 + PRK2 22 PRK1 + PRK3 23 PRK2 + PRK3 24 PRK1 + PRK2 + PRK3 25 PlexinB1 + PlexinB2 26 Rhophilin1 + Rhophilin2 27 ROCK1 + ROCK2 28 Synaptojanin1 + Synaptojanin2 29 TNK1 + TNK2 30 WASP + N-WASP Table 3.4 Combinations of Rho effector genes targeted with sirna. The combinations of SMARTpool sirna reagents listed, targeting closely related genes were, were co-transfected. Co-transfection of PAK4 and PAK6 SMARTpool sirna resulted in a strong defect in tight junction formation (Figure 3.10b). Co-transfection of PAK4 and PAK5 SMARTpool sirna also resulted in a clear defect in tight junction formation, although the number of cells that formed tight junctions was slightly higher than after cotransfection of PAK4 and PAK6 SMARTpool sirna (Figure 3.10b). Co-transfection 103
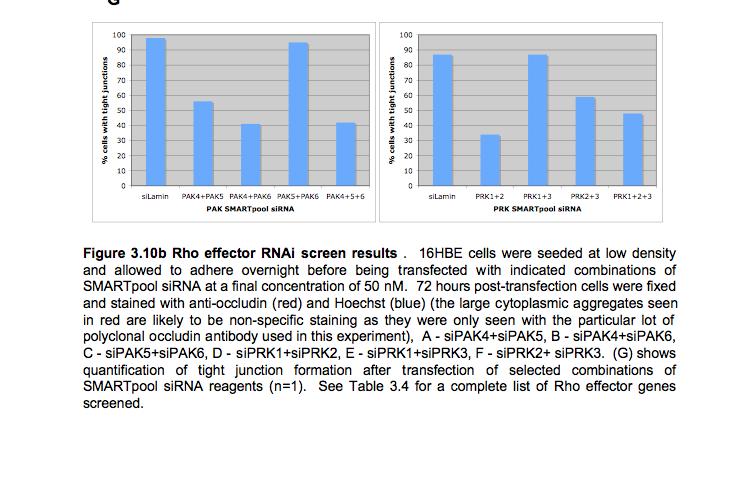
104 104
105 of PAK5 and PAK6 SMARTpool sirna had no effect on tight junction formation. These results, together with the results of transfecting single SMARTpool sirna reagents in Figure 3.10a, suggest PAK4 is a potential regulator of tight junction formation, with the related protein PAK6 possibly contributing to this function. Co-transfection of PRK1 and PRK2 SMARTpool sirna resulted in a strong defect in tight junction formation (Figure 3.10b). Co-transfection of PRK2 and PRK3 SMARTpool sirna also resulted in a clear defect in tight junction formation, although the number of cells that formed tight junctions was higher than after co-transfection of PRK1 and PRK2 SMARTpool sirna (Figure 3.10b). Co-transfection of PRK1 and PRK3 SMARTpool sirna had no effect on tight junction formation. These results, together with the effects of transfecting single SMARTpool sirna reagents in figure 3.10a, suggest PRK2 is a potential regulator of tight junction formation, with the related protein PRK1 possibly contributing to this function. To assess the specificity of the phenotypes observed in these screens using SMARTpool sirna reagents, the effect of transfection of individual sirna duplexes making up the SMARTpool was analysed. 16HBE cells were transfected with 4 distinct Par6B sirna duplexes and tight junction formation was assessed by staining cells with an anti-zo1 antibody 72 hours after transfection. Transfection of all 4 Par6B sirna duplexes phenocopied the tight junction defect observed after transfection of Par6B SMARTpool sirna, although to varying degrees (Figure 3.11). Transfection of Par6B sirna duplex 3 gave the strongest defect in tight junction formation, while duplexes 1 and 4 gave intermediate phenotypes, and duplex 2 gave a mild phenotype, as far as number of cells affected is concerned. The ability of the Par6B sirna duplexes to knockdown expression of Par6B was determined by western blot analysis using an anti-par6b antibody. All duplexes were able to knockdown expression of Par6B to varying degrees, and the level of knockdown correlated well with the severity of the defect observed in tight junction formation (Figure 3.11). These results strongly suggest that the impaired tight junction formation observed after transfection of Par6B sirna is a specific consequence of loss of Par6B protein. 105
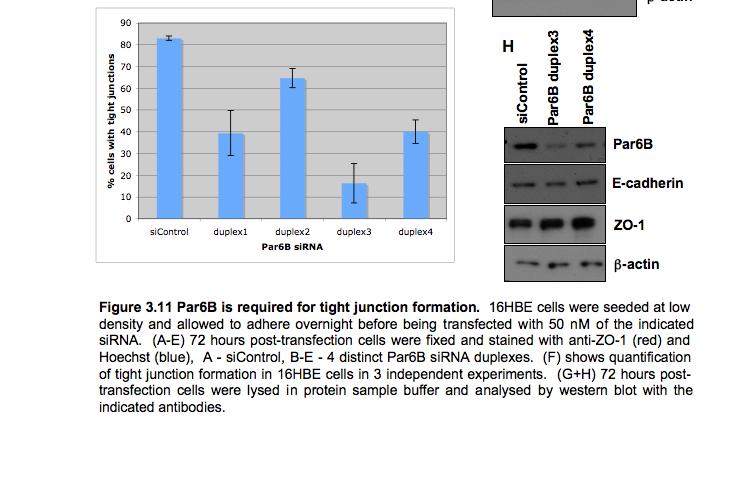
106 106
107 16HBE cells were transfected with two sirna duplexes targeting PRK1 and two targeting PRK2 alone or in combination (Figure 3.12). All sirna duplexes were transfected at a concentration of 25 nm. Where only one PRK duplex was transfected, sicontrol duplex was co-transfected to keep the total sirna concentration at 50 nm in all experiments. Both PRK1 sirna duplexes downregulated expression of PRK1 protein, while both PRK2 sirna duplexes downregulated expression of PRK2 protein (Figure 3.12E). Transfection of 16HBE cells with either PRK2 sirna duplex 1 or PRK2 sirna duplex 3 resulted in a clear defect in tight junction formation, while transfection of either PRK1 sirna duplex 2 or PRK1 sirna duplex 3 had no effect on tight junction formation. The defect in tight junction formation caused by knockdown of PRK1 and PRK2 together was similar to that caused by knockdown of PRK2 alone, suggesting that if PRK1 makes any contribution to tight junction formation it is minimal. 16HBE cells were transfected with two sirna duplexes targeting PAK4 and two targeting PAK6 alone or in combination (Figure 3.13). In these experiments, all sirna duplexes were transfected at a concentration of 25 nm. Where only one PAK sirna duplex was transfected, sicontrol duplex was co-transfected to keep the total sirna concentration 50 nm in all experiments. Transfection of 16HBE cells with either PAK4 sirna duplex 3 or PAK4 sirna duplex 4 alone resulted in a clear defect in tight junction formation, while transfection of either PAK6 sirna duplex 2 or PAK6 sirna duplex 3 alone had minimal effect (Figure 3.13). Co-transfection of PAK4 and PAK6 sirna duplexes together resulted in a slightly increased tight junction defect compared to transfection of PAK4 sirna duplexes alone, but the increase was minimal. Transfection of PAK4 sirna duplex 3 and duplex 4 both resulted in downregulation of PAK4 expression in 16HBE cells, determined by western blot analysis using an anti- PAK4 antibody (Figure 3.13). Together these results suggest that the defect in tight junction formation observed after transfection of PAK4 sirna duplexes is a specific consequence of loss of PAK4 protein. PAK6 does not seem to make a major contribution to tight junction formation in these cells, however as I have not been able to detect expression of PAK6 in 16HBE cells using the available antibody reagents or 107
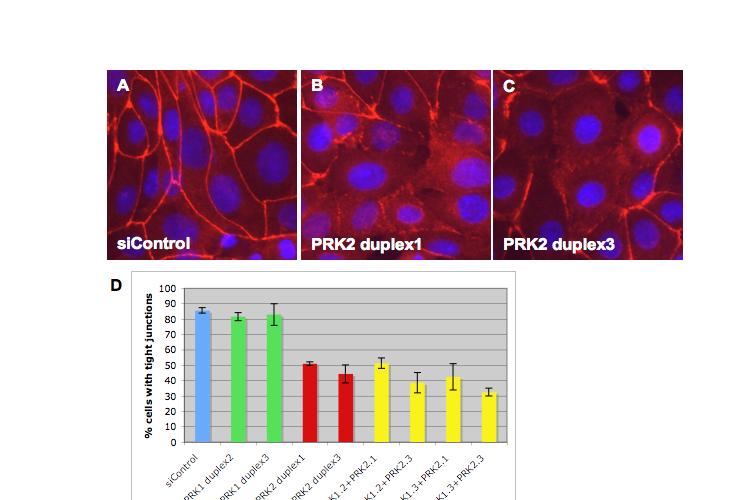
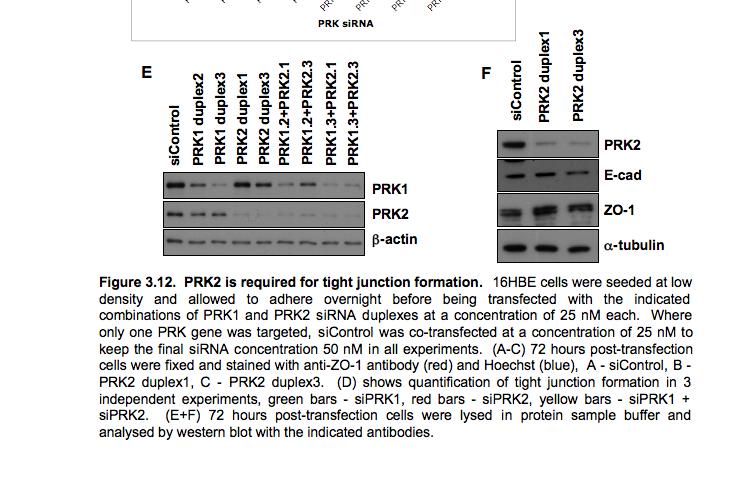
108 108
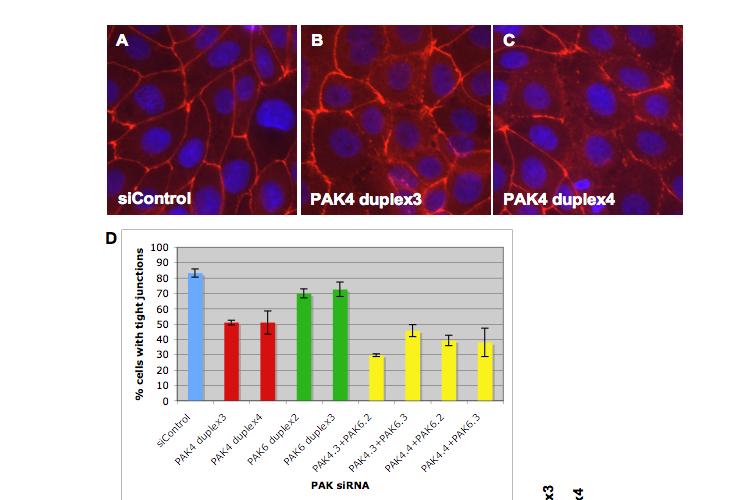
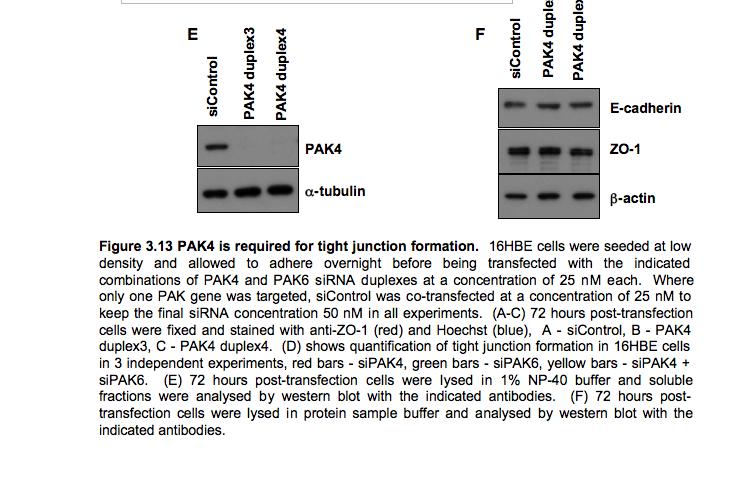
109 109
110 determine whether it is downregulated by the PAK6 sirna duplexes used in these experiments, a contribution can not be ruled out. 16HBE cells depleted of Par6B, PRK2 or PAK4 express the junctional proteins ZO-1 and E-cadherin at similar levels to control cells (Figures 3.11H, 3.12F and 3.13F), showing that the observed defects in tight junction formation are not simply due to loss of expression of junctional proteins. 3.6 Discussion To analyse the signalling pathways through which Rho GTPases regulate tight junction formation, an assay was established to quantitatively assess tight junction formation in 16HBE cells. 16HBE cells can be transfected with control sirnas with high efficiency and under conditions that do not affect tight junction formation (Figures 3.1 and 3.2). 72 hours after transfection tight junction formation can be assessed by fixing and staining cells with anti-occludin or anti-zo-1 antibodies. I have demonstrated a clear role for two Rho family GTPases in tight junction formation in 16HBE cells, namely RhoA and Cdc42. Transfection of multiple sirna duplexes targeting each gene resulted in downregulation of their target protein and caused the observed defect in tight junction formation, suggesting these phenotypes are likely to be specific and not caused by off-target mechanisms (Figures 3.4 and 3.5). These results are consistent with studies in other cell types showing that Rho and Cdc42 activity are required for tight junction formation (Braga et al., 1997; Otani et al., 2006) (see introduction, section 1.5.1). Transfection of SMARTpool sirna targeting Rac1 had no effect on tight junction formation in 16HBE cells, which is surprising given the considerable evidence that Rac is required for epithelial junction formation (see introduction, section 1.5.1). However, western blot analysis revealed that the Rac1 SMARTpool used in these experiments only partially reduced Rac expression (Figure 4.3). Rac3 is likely to be expressed in 110
111 16HBE cells and might act redundantly with Rac1. I have not determined the specificity of the Rac1 antibody used in these experiments. The residual protein seen after transfection of Rac1 SMARTpool sirna is likely to be either Rac1 that has not been downregulated efficiently or Rac3 that has cross-reacted with the Rac1 antibody. In either case, there is a considerable amount of Rac protein left in 16HBE cells after transfection of Rac1 sirna, which is likely to explain why no defect in tight junction formation was observed. To identify upstream GEFs and GAPs and downstream effector proteins required for tight junction formation, RNAi libraries were screened. Unfortunately I failed to identify any GEFs and GAPs using this approach. Three GEF SMARTpool sirna reagents prevented tight junction formation, but subsequent analysis found this was likely to be due to non-specific effects. There are at least 3 potential reasons for not identifying any Rho GEFs or GAPs regulating tight junction formation. Firstly, tight junction formation in 16HBE cells might not require any Rho GEF or Rho GAP function. This is unlikely, as RhoA and Cdc42 are required for tight junction formation in these cells. Rho GTPases require Rho GEFs for their activation, and so it is highly likely that any Rho-dependent process will also be Rho GEF-dependent. Rho GAPs terminate Rho GTPase signalling. Often Rho-dependent processes require precise regulation of the level of Rho activity, both spatially and temporally, and Rho GAP activity is important for achieving this. Overexpression of either constitutively active or dominant negative mutants of Rho GTPases results in disruption of tight junctions (Braga et al., 2000; Braga et al., 1997; Kroschewski et al., 1999; Otani et al., 2006; Sahai and Marshall, 2002), highlighting the importance of precisely regulating the level of Rho activity. It therefore seems likely that Rho GAPs will also be required for tight junction formation. Secondly, the level of knockdown achieved after transfection of sirna targeting a particular gene varies. Not all sirnas efficiently downregulate expression of their target gene. I might therefore have failed to identify Rho GEFs and GAPs required for tight junction formation because their expression was not reduced sufficiently. 111
112 Thirdly, I might have failed to identify Rho GEFs and GAPs required for tight junction formation because of redundancy. Most Rho GEFs and GAPs in the human genome have closely related homologues which can potentially have redundant functions. It might therefore be necessary to simultaneously downregulate expression of more than one closely related GEF or GAP for a defect in tight junction formation to become apparent. Three Rho effector proteins were identified as being required for tight junction formation, namely Par6B, PAK4 and PRK2. RNAi-mediated knockdown of Par6B, using multiple sirna duplexes, resulted in a defect in tight junction formation that correlated with knockdown of Par6B expression, indicating that this phenotype is likely to be a specific consequence of Par6B downregulation (Figure 3.11). Transfection of SMARTpool sirna targeting Par6A or Par6G did not affect tight junction formation (Figure 3.10a). This suggests that either Par6B is the main Par6 isoform expressed in 16HBE cells, or that Par6 isoforms have distinct functions. It is known that Par6A is not detectably expressed in 16HBE cells using a Par6A specific antibody (D.Jin and A.Hall, unpublished data), however it is not known whether Par6G is expressed in 16HBE cells due to lack of an antibody that recognizes Par6G. Initial experiments using SMARTpool sirna reagents suggested PAK4 is required for tight junction formation in 16HBE cells, with PAK6 perhaps contributing to this function, and PAK5 playing no role (Figure 3.10). Further experiments using multiple sirna duplexes targeting PAK4 and PAK6 individually or in combination confirmed that PAK4 is required for tight junction formation, but suggested that PAK6 makes minimal contribution to this function (Figure 3.13). The apparent requirement for PAK4 but not PAK5 or PAK6 for tight junction formation in 16HBE cells is consistent with the reported tissue distribution of PAK expression. Within the class II PAKs, PAK4 is expressed ubiquitously, PAK5 is expressed specifically in the brain, and PAK6 shows high expression in the brain but also limited expression in several other tissues including placenta, testis and prostate (Callow et al., 2002; Pandey et al., 2002). PAK5 and PAK6 are therefore not expected to be expressed in bronchial epithelial cells. 112
113 However a role for PAK5 or PAK6 in 16HBE cells can not be ruled out, as I have not determined their expression level in these cells and do not know how efficiently the sirna reagents used in these experiments downregulate expression of PAK5 and PAK6. Initial results using SMARTpool sirna reagents suggested PRK2 is required for tight junction formation in 16HBE cells, with PRK1 perhaps contributing to this function and PRK3 playing no role (Figure 3.10). Subsequent experiments using multiple sirna duplexes targeting PRK1 and PRK2, transfected individually or in combination, confirmed that PRK2 is required for tight junction formation, but showed that PRK1 does not contribute to this function (Figure 3.12). PRK1 and PRK2 are both expressed ubiquitously (Mukai, 2003), and I have detected expression of both proteins in 16HBE cells (Figure 3.12). It is therefore surprising that PRK1 does not contribute to tight junction formation in these cells. It should be noted, however, that I have not determined the relative expression levels of PRK1 and PRK2 in 16HBE cells. The failure to detect any defect in tight junction formation after depletion of PRK1 might therefore simply be because PRK1 expression is lower than that of PRK2 and does not make a significant contribution to the total PRK pool in 16HBE cells. PRK3 expression has only been detected in cancer cells and not in normal tissues (Mukai, 2003). It is therefore unlikely that PRK3 is expressed in 16HBE cells, which is likely to explain why transfection of sirna against PRK3 has no effect on tight junction formation in these cells. However as I have not analysed PRK3 expression in 16HBE cells or determined how efficiently the PRK3 sirna used downregulates PRK3 expression I can not rule out a role for PRK3. Par6B is a scaffold protein and an effector protein for Cdc42, and has previously been implicated in tight junction formation through the regulation of apkc (see introduction, section 1.4.4). PAK4 is a serine/threonine kinase belonging to the STE family and an effector protein for Cdc42. PRK2 is a serine/threonine kinase belonging to the AGC family and an effector protein for RhoA. PAK4 and PRK2 have not been previously implicated in tight junction formation. Chapter 4 will further analyse a potential signalling pathway involving RhoA and its effector protein PRK2 regulating tight 113

.")
114 junction formation, while chapter 5 will further analyse a potential signalling pathway involving Cdc42 and its effector proteins Par6B and PAK4 in regulating tight junction formation (Figure 3.14). 114
115 CHAPTER 4 Results Regulation of Epithelial Junctions by RhoA and its Effector PRK2 4.1 RhoA and RhoC can act redundantly to control tight junction formation The data presented in chapter 3 shows that RhoA expression is necessary for tight junction formation in 16HBE cells. RhoA belongs to a subfamily of Rho GTPases containing the highly related RhoB and RhoC proteins. To determine whether RhoB or RhoC also regulate tight junction formation, 16HBE cells were transfected with SMARTpool sirna targeting these genes and tight junction formation was analysed. Transfection of either RhoB or RhoC SMARTpool sirna had no effect on tight junction formation, while transfection of RhoA SMARTpool resulted in a clear defect in tight junction formation (Figure 4.1). There are several possible explanations for the lack of phenotype caused by transfection of RhoB or RhoC sirna in this assay. The RhoB and RhoC SMARTpool sirna used in these experiments might not efficiently downregulate expression of their target proteins. RhoB and RhoC might not be expressed in 16HBE cells, or might be expressed at lower levels than RhoA, and so might not make a contribution to tight junction formation in these cells. Finally, RhoB and RhoC might have distinct functions from RhoA, despite high sequence similarity. To determine whether RhoB and RhoC are expressed in 16HBE cells, and to assess the ability of the transfected sirna reagents to knockdown expression of RhoB and RhoC, several Rho antibodies were first characterized. HEK293T cells were transfected with HA-tagged human RhoA, RhoB and RhoC expression vectors, and protein lysates were analysed by western blot. An anti-ha antibody was used to determine the relative amount of RhoA, RhoB and RhoC in the HEK293T lysates. RhoA and RhoC were expressed at similar levels in the HEK293T lysates, while RhoB was expressed at considerably higher levels (Figure 4.2A, HA blot). These lyastes were used to assess the ability of several Rho antibodies to bind to Rho proteins. 115
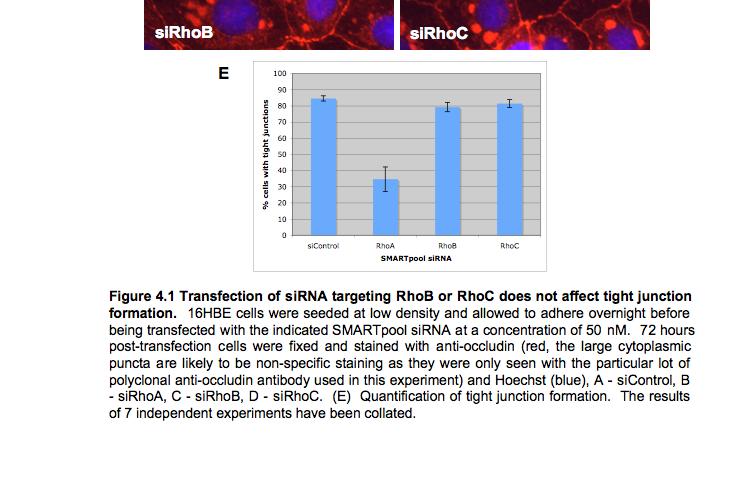
116 116
.")
.")
117 An anti-rhoa antibody specifically binds to RhoA with no cross-reactivity with RhoB or RhoC (Figure 4.2A, RhoA blot). An anti-rhoa/c antibody binds to both RhoA and RhoC, but has higher affinity for RhoC (Figure 4.2A, RhoA/C blot). An anti-rhob antibody binds with a strong preference to RhoB, with minimal cross-reactivity with RhoA or RhoC (Figure 4.2A, RhoB blot). 117
118 These antibodies were used to detect endogenous Rho GTPase proteins expressed in 16HBE cells and to check downregulation of expression after transfection of sirna. As shown in chapter 3 RhoA can be detected in 16HBE cells with the anti-rhoa antibody, and RhoA expression is downregulated by RhoA sirna (Figure 4.2B). RhoB expression can be detected using the anti-rhob antibody, and RhoB expression is downregulated after transfection of RhoB sirna (Figure 4.2C). Surprisingly a large increase in RhoB expression is seen after downregulation of either RhoA or RhoC (Figure 4.2C). While the reason for this is not clear, it has recently been described that the total levels of Rho GTPase proteins in cells can be limited by the availability of RhoGDIs (Keith Burridge, personal communication). RhoGDIs bind to inactive forms or Rho GTPases and sequester them in the cytosol, and are typically thought to negatively regulate Rho GTPase signalling, however they might also have an additional role in stabilizing Rho GTPases. The increase in RhoB expression after knockdown of RhoA or RhoC might therefore reflect an increase in the availability of RhoGDI. RhoC expression can be detected using the RhoA/C antibody. RhoA and RhoC proteins are both 193 amino acids in length, but RhoC has a slightly higher molecular weight, 22.0 kda compared to 21.8 kda. RhoC protein runs at a slightly higher molecular weight than RhoA on a 15% polyacrylamide gel, and this allowed differential detection of RhoA and RhoC in 16HBE cell lysates (Figure 4.2B). RhoC expression is downregulated after transfection of RhoC sirna (Figure 4.2B). The above experiments show that RhoB and RhoC are expressed in 16HBE cells and expression of these proteins is downregulated after transfection of corresponding sirna. The lack of phenotype caused by transfection of RhoB or RhoC sirna could therefore be because RhoB and RhoC have distinct roles from RhoA and do not regulate tight junction formation, or could be because RhoB and RhoC are functionally redundant with RhoA but are expressed at lower levels than RhoA in 16HBE cells, and so do not make a detectable contribution to tight junction formation in these cells. 118
119 The relative expression levels of RhoA and RhoC in 16HBE cells can be estimated using the RhoA/C antibody. This antibody binds considerably more strongly to RhoC than to RhoA when these proteins are expressed at similar levels in HEK293T cells (Figure 4.2A). Endogenous RhoA and RhoC proteins in 16HBE cells are detected by this antibody to a similar level (Figure 4.2B). Together this suggests that RhoA protein is expressed at considerably higher levels than RhoC in 16HBE cells. The observation that RhoC is expressed at considerably lower levels than RhoA means that RhoC might contribute to tight junction formation in 16HBE cells redundantly with RhoA, and the failure to detect a defect in tight junction formation after knockdown of RhoC expression might simply be because RhoC does not contribute significantly to the total RhoA/C pool in these cells. To address this, rescue experiments were carried out using expression vectors encoding mouse RhoA and RhoC proteins, which are not expected to be targeted by the human RhoA sirna duplexes used in these experiments. 16HBE cells were seeded at low density on glass coverslips and allowed to adhere overnight. The following day, cells were transfected with 50 ng of expression vectors encoding myc-tagged mouse RhoA, myc-tagged mouse RhoC, or myc-tagged PAK4 as an unrelated control protein. 6 hours later cells were transfected with sicontrol sirna or RhoA sirna duplex1, which gives the strongest knockdown of RhoA out of the 4 RhoA duplexes used in our experiments (Figure 3.4 in chapter 3). 72 hours later tight junction formation was analysed by immunofluorescence microscopy, using an antioccludin antibody. Exogenous expression of RhoA, RhoC or PAK4 did not affect tight junction formation (Figure 4.3, A-I), as the majority of myc-positive cells showed a continuous ring of occludin staining at cell-cell contacts after transfection of sicontrol sirna. Transfection of RhoA sirna resulted in the expected tight junction defect in cells expressing the control myc-tagged protein (myc-pak4, Figure 4.3 P-R). Expression of mouse RhoA rescued the tight junction defect caused by knockdown of endogenous RhoA, as expected, with most myc-positive cells showing a continuous ring of occludin staining at cell-cell contacts (Figure 4.3, J-L). Interestingly expression of mouse RhoC also rescued the tight junction defect caused by knockdown of endogenous RhoA (Figure 4.3, M-O). Similar results were obtained when RhoA sirna duplex 2 or duplex 3 were used instead of RhoA sirna duplex1 (data not shown). These experiments confirm that the defect in tight junction formation caused 119

120 by transfection of RhoA sirna duplexes is a specific consequence of loss of RhoA protein, and show that RhoC is able to act redundantly with RhoA in regulating tight junction formation. 120
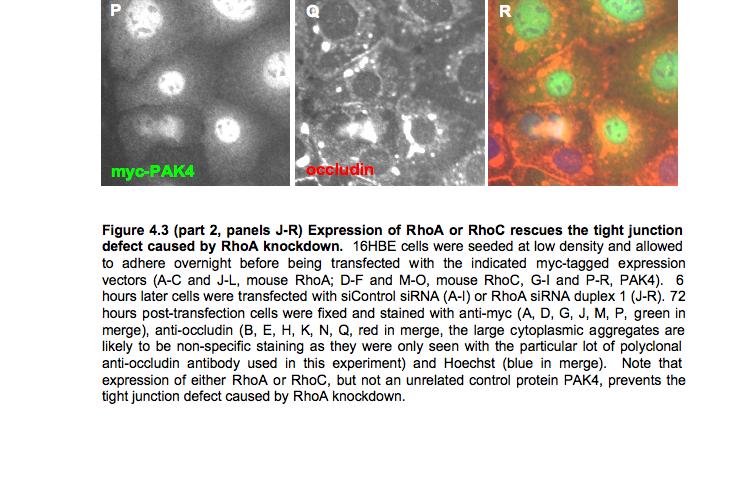
121 121
122 4.2 Expression of mouse PRK2 rescues the tight junction defect caused by transfection of PRK2 sirna. The results presented in chapter 3 show that transfection of sirna targeting PRK2 results in a defect in tight junction formation in 16HBE cells. Two distinct sirna duplexes targeting PRK2 generated this phenotype, suggesting it is likely to be a specific consequence of loss of PRK2 expression. To confirm this, an attempt was made to rescue this phenotype by expressing exogenous mouse PRK2, which should be resistant to the human PRK2 sirna duplexes used in these experiments. In contrast to the mouse RhoA and RhoC expression constructs used above, mouse PRK2 constructs did not express well after transient transfection. Mouse PRK2 was therefore subcloned in to pbabe-ha retroviral expression vector, and retroviral particles were made by transfecting pbabe-ha empty vector or pbabe-ha-mprk2 in to HEK293T cells, along with VSV-G and Gag/Pol. Retroviral particles were collected from the growth medium and used to infect 16HBE cells. Infected cells were selected with puromycin for at least one week. Following selection, stably-expressing cells were seeded on glass coverslips at low density, and transfected with sicontrol or sirna targeting PRK2. 72 hours post-transfection tight junction formation was assessed by immunofluorescence microscopy using an anti-zo-1 antibody. 16HBE-pBABE-HA control cells transfected with sicontrol sirna formed tight junctions normally, shown by a continuous ring of ZO-1 staining at cell-cell contacts (Figure 4.4, A-C). 16HBE-pBABE-HA control cells transfected with PRK2 sirna duplex 1 or duplex 3 showed a clear defect in tight junction formation, with many cells showing no ZO-1 staining or discontinuous ZO-1 staining at cell-cell contacts (Figure 4.4, D-F and G-I). 16HBE-pBABE-HA-mPRK2 cells transfected with sicontrol sirna formed tight junctions normally, showing that exogenous expression of mprk2 does not affect tight junction formation (Figure 4.4, J- L). 16HBE-pBABE-HA-mPRK2 cells transfected with PRK2 sirna duplex 1 did not show any defect in tight junction formation (Figure 4.4, M-O), showing that expression of mouse PRK2, which is resistant to knockdown by PRK2 sirna duplex 1, is able to rescue the tight junction defect caused by transfection of PRK2 sirna duplex 1. This provides strong evidence that the defect in tight junction formation caused by PRK2 sirna duplex 1 is a specific consequence of loss of PRK2 expression. 122
123 HA ZO-1 merge 123

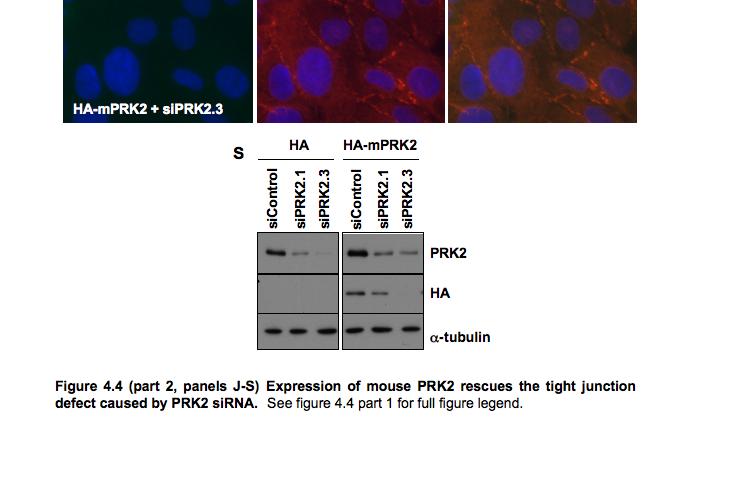
124 HA ZO-1 merge 124
125 Surprisingly, PRK2 sirna duplex 3 was able to knockdown expression of mouse PRK2 in 16HBE-pBABE-HA-mPRK2 cells, determined by western blot and immunofluorescence microscopy using an anti-ha antibody (Figure 4.4, P and S - note that the PRK2 antibody used in S does not cross-react with mouse PRK2 (data not shown)). The human sequence targeted by PRK2 sirna duplex 3 has only 1 mismatch with the corresponding mouse sequence, and in this case 1 mismatch is not sufficient to prevent downregulation of mouse PRK2 expression. Accordingly, 16HBE-pBABE- HA-mPRK2 cells transfected with PRK2 sirna duplex 3 showed the same tight junction defect as 16HBE-pBABE-HA control cells transfected with this sirna duplex, as both endogenous and exogenous PRK2 expression was downregulated (Figure 4.4, P-R). 4.3 Multiple Rho effector proteins are likely to contribute to tight junction formation downstream of RhoA As discussed in chapter 1, a large number of proteins have been identified as effector proteins for Rho GTPases, and several have already been implicated in epithelial junction formation. PRK2 was the only effector protein for RhoA identified in the screen for Rho effector proteins required for tight junction formation (chapter 3). A reasonable hypothesis therefore is that RhoA regulates tight junction formation through PRK2. To analyse more directly the signalling pathway downstream of RhoA regulating tight junction formation, point mutations were made in the effector-binding loop of RhoA to selectively impair binding to certain downstream effector proteins. Structural changes occurring upon activation of Rho GTPases are limited to two short loops exposed on the surface of the protein, called switch regions. Residues within these loops are known to bind directly to effector proteins and to contribute to specificity. Residues within switch I of RhoA have been mutated, and the ability of the mutant GTPases (known as effector loop mutants) to bind to several Rho effector proteins has been assessed (Sahai et al., 1998). RhoA(F39A) has reduced affinity for PRK and for ROCK. RhoA(F39V) and RhoA(Y42C) bind to ROCK normally but have reduced affinity for PRK. RhoA(E40L) binds to PRK normally but has reduced affinity for ROCK. Importantly, all proteins can still bind to mdia and to upstream GEFs, 125
126 showing that these mutations do not simply cause the GTPase to misfold. These point mutations were introduced in to wild-type mouse RhoA, with the intention of using the mutant proteins in rescue experiments. However overexpression of these proteins resulted in a similar tight junction defect to that caused by knockdown of RhoA (Figure 4.5, note that overexpression of wild-type RhoA does not affect tight junction formation), making rescue experiments impossible with these constructs. When overexpressed these mutant proteins are likely to act in a dominant-negative manner, as they will compete with endogenous Rho proteins for binding to upstream GEFs, thus preventing activation of endogenous Rho proteins, but can not regulate certain downstream effector pathways. RhoA(F39A), RhoA(F39V) and RhoA(Y42C) have impaired binding to PRK, and when overexpressed are expected to inhibit endogenous RhoA signalling through PRK as they will compete for upstream activators of RhoA. The defect in tight junction formation observed after overexpression of these mutants (Figure 4.5) is consistent with the hypothesis, based on RNAi-mediated depletion of PRK2, that RhoA promotes tight junction formation by acting through PRK2. Surprisingly, overexpression of RhoA(E40L) also resulted in a defect in tight junction formation (Figure 4.5). This mutant is able to bind to PRK normally, but has impaired binding to ROCK. Overexpression of this protein is therefore expected to inhibit endogenous RhoA signalling through ROCK but not through PRK. The defect in tight junction formation seen after overexpression of this mutant suggests that regulation of ROCK by RhoA is also required for RhoA to function in tight junction formation. Transfection of ROCK1 and ROCK2 sirna, either alone or together, did not prevent tight junction formation in the RNAi screens carried (chapter 3). However I have not determined how efficiently ROCK is downregulated by the sirna used. It should also be noted that the point mutations used to prevent binding of Rho to its effector proteins might not be very specific, as only binding of Rho to certain effectors was tested when these mutants were first described and the interaction with many other effector proteins has not been tested. The E40L mutation could potentially prevent RhoA from binding to other effectors in addition to ROCK. Together these experiments show that at least two Rho effector proteins are required downstream of RhoA for tight 126

127 junction formation, and that regulation of PRK2 by RhoA is not the sole mechanism through which RhoA regulates tight junctions. 127
128 4.4 RhoA and PRK2 are required for the formation of mature adherens junctions and the organization of junctional F-actin In addition to tight junctions, epithelial cells are characterized by the presence of adherens junctions and junctional actin filaments. Epithelial adherens junctions are formed by the transmembrane cell adhesion molecule E-cadherin, which associates via its cytoplasmic tail with β-catenin. Adherens junctions can be analysed by immunofluorescence microscopy using antibodies against E-cadherin or β-catenin. 16HBE monolayers stained with an anti-e-cadherin antibody show two pools of E- cadherin at cell-cell contacts. A sharp line of E-cadherin along contacting membranes is seen in cells with mature cell-cell contacts (Figure 4.6, closed arrowheads in panel B). This E-cadherin staining often overlaps, at least partly, with tight junction proteins such as ZO-1 (Figure 4.6, panel C) and occludin (not shown). Additionally, E-cadherin is also localized in a more broad and diffuse pattern at the plasma membrane. In cultured epithelial cells some adherens junction proteins, including E-cadherin and β- catenin, are localized along the lateral membrane and are not restricted to such a narrow plane as tight junction proteins. Lateral membranes are often dynamic, with membrane protrusions from one cell extending beneath a neighbouring cell. This results in the broad membrane staining of E-cadherin seen in some cells (Figure 4.6, open arrowheads in panel B). In control monolayers most cells contain both pools of E-cadherin at cellcell contacts (Figure 4.6, panel B). 16HBE cells depleted of RhoA or PRK2 show abnormal E-cadherin staining (Figure 4.6, panels E, H and K). Most cells are still in contact with neighbouring cells, and some E-cadherin is localized to cell-cell contacts. However mature adherens junctions do not form, seen as a failure to concentrate E- cadherin in to the sharp line observed in control monolayers. 128
129 ZO-1 E-cadherin merge 129
130 Actin is reorganized as epithelial cells form monolayers. Thick cortical actin bundles are found in isolated cells and along non-contacting plasma membranes, and when cellcell contacts form this actin is reorganized to form the characteristic junctional F-actin associated with apical junctions. 16HBE monolayers stained with fluorescently labelled phalloidin, which binds to F-actin, show actin filaments tightly associated with cell-cell contacts, as well as cytoplasmic staining and in some cells prominent stress fibres (Figure 4.7, arrowheads in panel A indicate junctional actin filaments). 16HBE cells depleted of RhoA or PRK2 do not organize F-actin normally between contacting cells. Prominent cortical F-actin bundles are seen in both neighbouring cells, and this actin has failed to reorganize in to the actin filaments tightly associated with mature junctions found in control monolayers (Figure 4.7, panels D, G and J). The organization of tight junction proteins, adherens junction proteins and F-actin observed in 16HBE monolayers depleted of RhoA or PRK2 is similar to that of control cells at early stages of junction formation. Junction formation can be monitored over time using the calcium-switch technique. Incubation of epithelial monolayers in medium that has been depleted of calcium results in disassembly of adherens junctions and tight junctions, because E-cadherin-mediated adhesion is calcium-dependent. Upon re-addition of calcium, adherens junctions and tight junctions re-form. Figure 4.8 shows 16HBE monolayers at 1 hour after calcium-switch, a time at which cell-cell contacts are in the process of forming. The organization of tight junction proteins (ZO- 1 in Figure 4.8), adherens junction proteins (β-catenin in Figure 4.8) and F-actin at this time are similar to that of 16HBE cells in monolayers depleted of RhoA or PRK2. Adherens junction proteins are localized diffusely to cell-cell contacts but have not matured in to the continuous line found in control monolayers, and tight junction proteins are absent from cell-cell contacts or show a punctate staining pattern. F-actin is present in prominent cortical bundles that have not reorganized yet to form the thinner actin filaments found closely associated with mature junctions. In summary, RhoA and PRK2 are required for the formation of mature epithelial apical junctions, comprising adherens junctions and tight junctions and the associated junctional F-actin. Cells depleted of RhoA or PRK2 are able to undergo early stages of cell-cell contact 130
131 formation, in which adherens junction proteins are localized at cell-cell contacts, but can not form mature junctions. F-actin occludin 131 merge
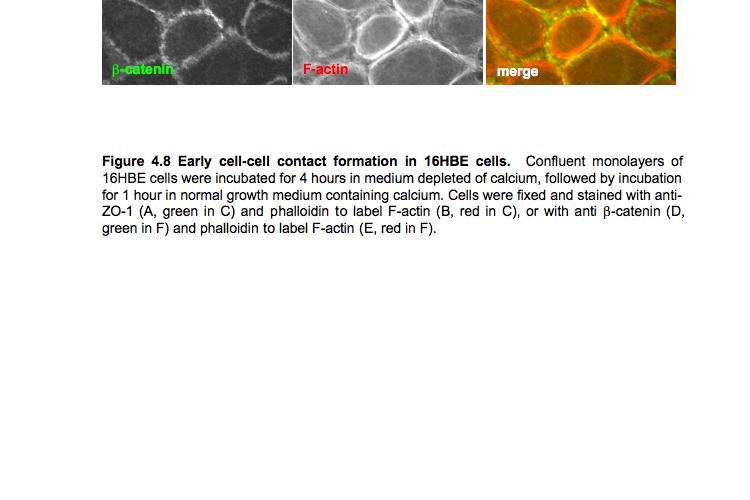
132 132
133 4.5 PRK2 colocalizes with ZO-1 at tight junctions 16HBE monolayers were stained with the anti-prk2 antibody and analysed by immunofluorescence microscopy to determine the localization of PRK2. Most cells showed a diffuse cytoplasmic staining, with a clear enrichment at cell-cell contacts in some cells that overlaps with the tight junction protein ZO-1 (Figure 4.9, panels A-C). This staining pattern is likely to be specific because 16HBE cells transfected with an expression vector encoding HA-tagged PRK2 show the same localization at cell-cell contacts (Figure 4.9, G-L). The PRK2 staining at cell-cell contacts also partly overlaps with the adherens junction protein β-catenin (Figure 4.9, panels D-F). Under these culture conditions, tight junction proteins and adherens junction proteins do not fully separate along the lateral membrane. Adherens junction proteins such as E-cadherin and β-catenin localize all along the lateral membrane, while tight junction proteins such as ZO-1 and occludin are localized in a more discrete plane. Tight junction proteins overlap with the adherens junction proteins located at the apical-most edge of the adherens junction (for examples, see Figure 4.6, panels A-C). Our observation that PRK2 protein localizes in a discrete plane that colocalizes with ZO-1, rather than in a more diffuse pattern all along the lateral membrane, suggests that PRK2 is localized at the tight junction and not the adherens junction. However this should be confirmed under conditions where tight junctions fully separate from adherens junctions along the lateral membrane. Such conditions might be provided by growing 16HBE cells on transwell filters, which are thought to facilitate the final steps in polarization along the apical-basal axis, or by using other cell types such as Caco-2 or MDCK, which separate adherens junction and tight junction proteins more readily when cultured on glass coverslips. Furthermore, due to the narrow width of tight junction structures (typically nm), it is not possible to conclusively localize a protein at tight junctions based on colocalization with tight junction proteins in fluorescence microscopy studies. Instead ultrastructural studies are required to resolve tight junctions (Matter and Balda, 2003a). We have not performed such experiments as they are technically challenging. 133
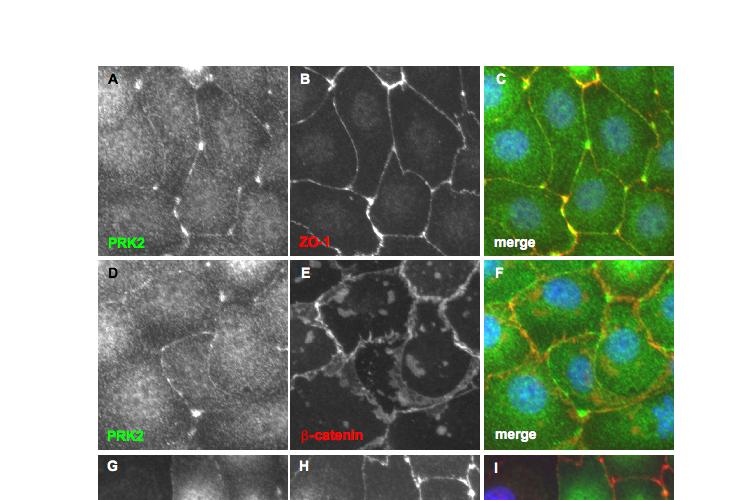
134 134
135 Only a minority of cells in a monolayer show PRK2 localization at cell-cell contacts, suggesting PRK2 is localized transiently at cell-cell contacts. This is consistent with PRK2 playing a regulatory role in junction formation. 4.6 Discussion I have demonstrated that RhoA is required for tight junction formation in 16HBE cells (see chapter 3). Two closely related Rho family members, RhoB and RhoC, are also expressed in 16HBE cells, but RNAi-mediated downregulation of RhoB or RhoC does not affect tight junction formation (Figure 4.1 and 4.2). This raises the possibility that RhoB and RhoC have distinct functions from RhoA and do not regulate tight junction formation. Using an antibody that recognizes RhoA and RhoC, I estimated that RhoA is expressed at considerably higher levels than RhoC in 16HBE cells (Figure 4.2). Furthermore exogenous expression of RhoC is able to rescue the tight junction defect caused by knockdown of RhoA in 16HBE cells (Figure 4.3). Together this suggests that RhoC does in fact act redundantly with RhoA during tight junction formation, and the failure to observe a defect in tight junction formation after knockdown of RhoC simply reflects the fact that RhoC does not make a significant contribution to the total RhoA/C levels in 16HBE cells. I have not yet attempted to rescue the tight junction defect caused by RNAi-mediated depletion of RhoA with exogenous expression of RhoB. RhoA, RhoB and RhoC proteins show a high level of sequence similarity. RhoA and RhoB are 83% identical and 94% homologous, while RhoA and RhoC are 91% identical and 96% homologous. However RhoB acquires different posttranslational modifications than RhoA and RhoC, as a result of sequence differences at the C-terminus. All three proteins undergo prenylation at their C-terminus but with different moieties; RhoA and RhoC are geranylgeranylated but RhoB is farnesylated. RhoB can also be palmitoylated, whereas RhoA and RhoC are not (Ridley, 2006). These differences in lipid modification affect GTPase localization, as RhoA and RhoC localize to the plasma membrane but RhoB to endosomes. It will therefore be interesting to determine whether RhoA and RhoB are functionally distinct in 16HBE cells by attempting to rescue the RhoA phenotype with exogenous RhoB. 135
 (subsequently shown to bind to Rho GTPases), HR2 (a C2-like")
136 PRK2 belongs to a family of mammalian serine/threonine kinases, the PRKs (PKCrelated kinase; also called PKN, protein kinase novel), which were first identified on the basis of their similarity to PKC. Three PRK genes exist in mammals, encoding proteins characterized by the presence of 3 conserved domains: HR1 (homology region 1) (subsequently shown to bind to Rho GTPases), HR2 (a C2-like domain similar to the lipid-binding C2 domain found in PKC), and a serine/threonine kinase domain homologous to the kinase domain of PKC (Figure 4.10). While the biological role of PRKs is not clear, there is some evidence they regulate epithelial morphogenesis. A PRK homologue, PKN, has been described in Drosophila and plays a role in morphogenesis during development. Null mutations of PRK in flies are lethal, and embryos show defects in dorsal closure (Lu and Settleman, 1999). Dorsal closure is a process that occurs at a late stage of Drosophila development in which leading edge cells of the epidermis elongate along the dorsal-ventral axis until they meet at the dorsal midline. Cell shape changes during dorsal closure require actinmyosin contractility, and PRK has been proposed to regulate this downstream of Rho, 136
137 but the details are not known (Betson and Settleman, 2007). In cultured keratinocytes, PRK2 has been suggested to play a role in adherens junction formation, although the evidence is not strong. PRK2 activity increases during calcium-induced cell-cell adhesion in keratinocytes. Overexpression of V14RhoA, a constitutively-active mutant, results in increased E-cadherin localization at cell-cell contacts in these cells, while overexpression of V14RhoA(Y42C), a constitutively active mutant of RhoA that has reduced affinity for PRK proteins, does not increase E-cadherin localization at cell-cell contacts (Calautti et al., 2002), suggesting that active RhoA promotes adherens junction formation through a PRK family member. However, as noted earlier, Rho effector-loop mutants are likely to inhibit binding of Rho to more than one effector protein, and so the Y42C mutation might affect binding to proteins other than PRKs. We have clearly demonstrated that PRK2 is required for apical junction formation in 16HBE cells, using RNAi-mediated knockdown and rescue experiments. Depletion of PRK2 does not inhibit the early stages of cell-cell adhesion, during which E-cadherin starts to accumulate at cell contacts, but does prevent mature junctions, consisting of adherens junctions, tight junctions and perijunctional F-actin, from forming. Based on the observation that RNAi-mediated depletion of RhoA phenocopies depletion of PRK2, I propose that PRK2 acts downstream of RhoA to regulate junction formation. PRK was identified as a Rho GTPase effector protein using biochemical approaches to isolate proteins that bind to active RhoA. Initial experiments on PRK1 and PRK2 found they interact specifically with GTP-bound RhoA (and RhoB and RhoC), but not with GTP-bound Rac1 or Cdc42 (Amano et al., 1996; Quilliam et al., 1996; Watanabe et al., 1996). However it has since been reported that PRK1 and PRK2 can both bind to active Rac1, in contrast to the earlier studies (Owen et al., 2003; Vincent and Settleman, 1997). The N-terminus of PRK contains 3 leucine-rich repeats, called HR1 (homology region 1) domains (HR1a-c), which have been defined biochemically as the GTPasebinding domains. The HR1a and HR1b domains of PRK1, but not the HR1c domain, bind to active RhoA (Flynn et al., 1998). A crystal structure of the HR1a domain of PRK1 in complex with RhoA has been solved, showing that the HR1a domain forms an antiparallel coiled-coil, and that a number of hydrophobic and charged residues make 137
138 direct contact with the GTPase (Maesaki et al., 1999). Many of these residues are not conserved in HR1c, which might explain why it does not bind to RhoA. In vitro the kinase activity of PRK is enhanced by GTPase-binding, and relief of autoinhibition has been proposed as the mechanism (Amano et al., 1996; Quilliam et al., 1996; Watanabe et al., 1996). The N-terminal regulatory domain and the C-terminal kinase domains of PRK1 interact, suggesting PRK1 exists in a closed conformation (Kitagawa et al., 1996). A small peptide corresponding to a region overlapping with HR1a inhibits the kinase activity of PRK1. The N-terminus of PRK1 is therefore thought to act as an autoinhibitory pseudosubstrate, and relief of autoinhibition occurs upon GTPase-binding, although the structural details are not known. In addition to relieving autoinhibition, GTPase-binding to PRK1 and PRK2 allows them to interact with PDK-1 (3-phosphoinositide dependent protein kinase-1) (Flynn et al., 2000). PDK-1 phosphorylates many AGC kinases (including PKC and PRK) in their conserved activation loop, and this phosphorylation is required for kinase activity. To investigate whether PRK2 acts downstream of RhoA to regulate tight junction formation in 16HBE cells, I overexpressed mutants of RhoA that are defective in binding to certain effector proteins and therefore act as selective dominant-negatives to inhibit signalling from endogenous RhoA to specific downstream effectors. Overexpression of either RhoA(F39V) or RhoA(Y42C) phenocopies RNAi-mediated knockdown of RhoA, resulting in a defect in tight junction formation (Figure 4.5). As discussed above, both mutants have reduced affinity for PRK and when overexpressed are expected to inhibit activation of PRK by endogenous RhoA without affecting activation of ROCK or mdia. These results are therefore consistent with the idea that RhoA acts through PRK2 to regulate tight junction formation in 16HBE cells. However, as noted previously, although these point mutations in RhoA do not affect binding to ROCK or mdia they might affect binding to other Rho effectors in addition to PRK. PRK2 colocalizes with ZO-1 in a subset of cells, suggesting it localizes at tight junctions (Figure 4.9). As discussed earlier (section 4.5), more experiments are needed 138
139 to conclude that PRK2 is a tight junction. It seems likely that the localization of PRK2 at cell-cell contacts is important for its function in junction formation. In a monolayer only a subset of cells show cell-cell contact localization, suggesting that PRK2 localizes transiently at cell-cell contacts. This is consistent with the idea that PRK2 regulates junction formation. The localization of endogenous Rho proteins in 16HBE cells has not been determined, as the Rho antibodies do not work for immunostaining. Overexpressed RhoA and RhoC show cytosolic localization, and do not localize appreciably at cell-cell contacts (Figure 4.3 and 4.5). However studies using FRETbased probes to look specifically at active RhoA have found some RhoA activity at epithelial cell-cell contacts during junction formation (Yamada and Nelson, 2007; Yamazaki et al., 2008). It will be interesting to see if PRK2 localization at cell-cell contacts is GTPase-dependent, by assessing the localization of HR1 mutants (discussed further in chapter 6). It should be noted of course that PRK2 localization and PRK2 activity might not necessarily be regulated by the same upstream signals. In summary, I have found that RhoA and its effector PRK2 are required for apical junction formation in 16HBE cells. Depletion of either protein does not prevent the initial stages of cell-cell contact formation, during which E-cadherin accumulates at cell-cell contacts, but does prevent junctional maturation, during which F-actin is remodelled, E-cadherin is reorganized and tight junctions form. PRK2 localizes partly at cell-cell contacts, and this is likely to be important for its role in regulating junction formation. Based on the fact that PRK2 is a known effector protein for RhoA, it is reasonable to speculate that RhoA regulates junction formation through PRK2. Experiments using RhoA effector-loop mutants are consistent with this model, but do not prove it. Potential experiments to test this hypothesis further will be discussed in chapter
140 CHAPTER 5 Results Regulation of epithelial junctions by Cdc42 and its effectors PAK4 and Par6B 5.1 Expression of RNAi-resistant PAK4 rescues the tight junction defect caused by transfection of PAK4 sirna. The results presented in chapter 3 show that transfection of sirna targeting PAK4 caused a defect in tight junction formation in 16HBE cells. Two distinct PAK4 sirna duplexes downregulated the expression of PAK4 protein and caused the defect in tight junction formation, suggesting this effect is likely to be a specific consequence of loss of PAK4 protein (see Figure 3.13 in chapter 3). To confirm this an attempt was made to rescue this phenotype by expressing exogenous PAK4 protein. Three non-coding mutations were introduced in to a human PAK4 cdna such that it would no longer be targeted by PAK4 sirna duplex 4 (Figure 5.1). RNAi-resistant PAK4 was subcloned in to pbabe-ha retroviral expression vector. Retroviral particles were produced by transfecting HEK293T cells with pbabe-ha-pak4 or pbabe-ha empty vector, along with plasmids encoding VSV-G and Gag/Pol, and retroviral particles were collected from the growth medium. 16HBE cells were infected with pbabe-ha- PAK4 or pbabe-ha empty vector, and infected cells were selected with puromycin for at least one week. Immunofluorescence microscopy using an anti-ha antibody showed that, while the expression level varied from cell to cell, almost all cells were expressing a detectable level of exogenous PAK4 (Figure 5.2, panels G and J). Stablyexpressing cells were seeded at low density, transfected with sicontrol or PAK4 sirna duplex 4, and tight junction formation was analysed by immunofluorescence microscopy using an anti-zo-1 antibody. 16HBE-pBABE-HA cells transfected with sicontrol formed tight junctions normally, with the majority of cells showing a continuous ring of ZO-1 staining at cell-cell contacts (Figure 5.2, panels A-C). 16HBEpBABE-HA cells transfected with PAK4 sirna duplex 4 showed a clear defect in tight 140
141 junction formation, as expected, with about half the cells showing no ZO-1 staining or discontinuous ZO-1 staining at cell-cell contacts (Figure 5.2, panels D-F). 16HBEpBABE-HA-PAK4 cells transfected with sicontrol formed tight junctions normally, showing that exogenous expression of PAK4 does not affect tight junction formation (Figure 5.2, panels G-I). 16HBE-pBABE-HA-PAK4 cells transfected with PAK4 sirna duplex 4, which downregulates expression of endogenous PAK4 but is not expected to downregulate expression of exogenous RNAi-resistant PAK4, also showed normal tight junction formation (Figure 5.2, panels J-L). Western blot analysis (Figure 5.1B) and immunofluorescence microscopy (Figure 5.2, panel J) confirmed that exogenous PAK4 was resistant to knockdown by PAK4 sirna duplex 4. The fact that the tight junction defect caused by transfection of PAK4 sirna duplex 4 is no longer seen when exogenous RNAi-resistant PAK4 is expressed strongly suggests that the tight junction defect is a specific consequence of downregulation of PAK4 expression. 141
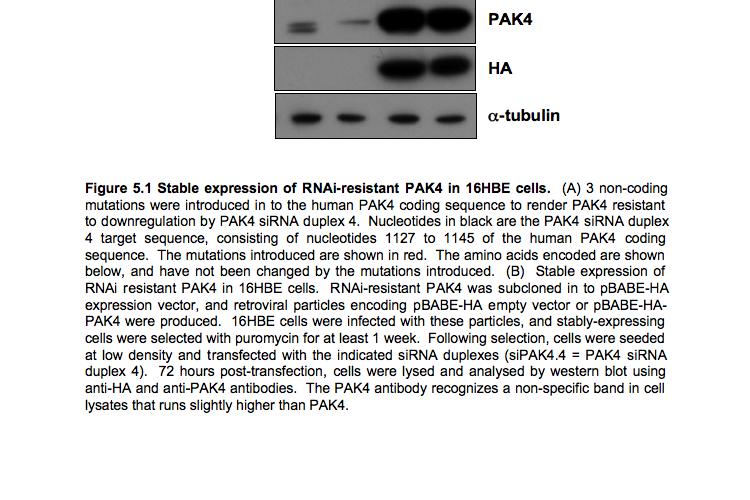
142 142

143 HA ZO-1 merge 143
144 5.2 Expression of mouse Par6B does not rescue the tight junction defect caused by transfection of Par6B sirna. The results presented in chapter 3 show that transfection of sirna targeting Par6B caused a defect in tight junction formation. 4 distinct Par6B sirna duplexes used generated this phenotype, and the severity of the phenotype correlated well with the degree of Par6B knockdown, indicating this phenotype is likely to be a specific consequence of loss of Par6B protein (See Figure 3.11 in chapter 3). To confirm this, an attempt was made to rescue this phenotype by expressing exogenous Par6B protein. An expression vector encoding mouse Par6B (mpar6b) was available and, as this cdna is naturally resistant to the human sirna duplexes used in our experiments, we used this for our rescue experiments (Figure 5.3A). mpar6b was subcloned in to pbabe-ha expression vector, and retroviral particles were produced by transfecting HEK293T cells with either pbabe-ha-mpar6b or pbabe-ha empty vector, along with VSV-G and Gag/Pol. Retroviral particles were collected from the growth medium and used to infect 16HBE cells. Infected cells were selected using puromycin for at least one week. Immunofluorescence microscopy using an anti-ha antibody showed that almost all cells were expressing detectable levels of mpar6b, although the expression level varied from cell to cell (Figure 5.4, panel J). Stably-expressing cells were seeded at low density, transfected with sicontrol, Par6B sirna duplex 3, or Par6B sirna duplex 4, and tight junction formation was analysed by immunofluorescence microscopy using an anti-zo-1 antibody. 16HBE-pBABE cells transfected with sicontrol formed tight junctions normally, while 16HBE-pBABE-HA cells transfected with either Par6B sirna duplex 3 or duplex 4 showed a clear defect in tight junction formation (Figure 5.4, panels A-I). 16HBE-pBABE-HA-mPar6B cells transfected with sicontrol formed tight junctions normally, showing that exogenous expression of mpar6b does not affect tight junctions (Figure 5.4, panels J-L). Surprisingly, 16HBE-pBABE-HA-Par6B cells transfected with either Par6B sirna duplex 3 or duplex 4 showed the same tight junction defect seen in 16HBE-pBABE-HA cells (Figure 5.4, panels M-O and P-R). Par6B sirna duplexes 3 and 4 both contain 4 mismatches compared to the corresponding sequences in the mouse Par6B gene (Figure 5.3A) and are therefore not expected to downregulate expression of mouse Par6B. 144
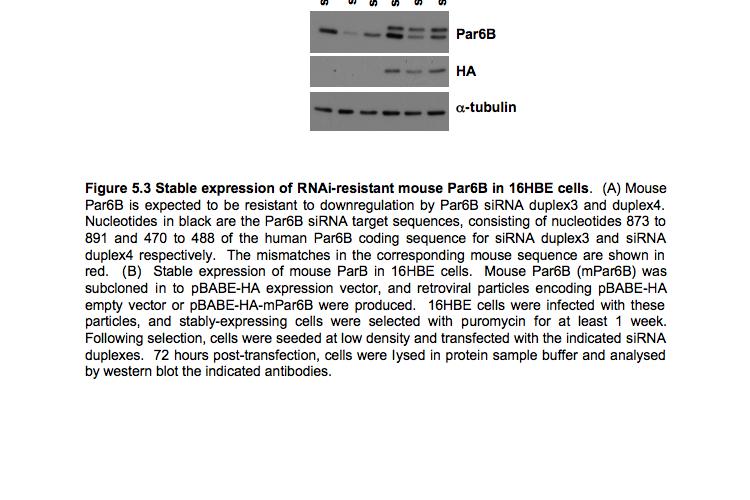
145 145

146 HA ZO-1 merge 146

147 HA ZO-1 merge 147
148 Western blot analysis (Figure 5.3B) and immunofluorescence microscopy (Figure 5.4, panels M and P) confirmed that the mouse Par6B cdna is indeed resistant to the human Par6B sirna duplexes used. Exogenous expression of mouse Par6B was therefore not able to rescue the tight junction defect caused by transfection of Par6B sirna duplexes. There are at least 4 possible explanations for this. The phenotype caused by transfection of Par6B sirna duplexes might be caused by non-specific mechanisms such as off-target downregulation of other genes. This is highly unlikely, as all 4 Par6B sirna duplexes used result in a defect in tight junction formation (see Figure 3.11). Over 250 SMARTpool sirna reagents have been screened in this assay, and only 8 were found to give a tight junction defect (see chapter 3 - RhoA, Cdc42, Asef, ARHGEF10, ITSN2, PRK2, PAK4 and Par6B). Non-specific effects of sirna transfection therefore do not often result in a defect in tight junction formation in this assay. The probability of 4 distinct sirna duplexes targeting the same gene, Par6B, all causing a tight junction defect by non-specific mechanisms is therefore extremely low. A second possible explanation is that the exogenous Par6B protein does not seem to localize properly. Several studies have reported that Par6 localizes to tight junctions. Furthermore, an antibody against Par6B gives tight junction staining in 16HBE cells (Figure 5.11, below). In 16HBE-HA-mPAR6 cells exogenous Par6B shows cytosolic localization and does not localize at tight junctions. Overexpression can cause a protein to mislocalize, however even cells expressing low levels of HA-mPAR6B do not show tight junction localization. It is possible that the N-terminal HA epitope interferes with Par6B localization, which would obviously interfere with its function. A third possible explanation is that in 16HBE-HA-mPar6B cells mpar6b might not be expressed at a sufficient level to rescue the phenotype caused by knockdown of endogenous Par6B. Conveniently, HA-tagged mouse Par6B runs at a slightly higher molecular weight than endogenous human Par6B, allowing the bands to be distinguished from each other in western blot analysis (Figure 5.3B). When lysates from 16HBE-pBABE-HA-mPar6B cells are analysed in this way, the band 148
149 corresponding to exogenous mouse Par6B is approximately half as intense as the band corresponding to endogenous human Par6B, suggesting that the exogenous Par6B is expressed at a lower level than the endogenous Par6B (Figure 5.3B). It should be noted however that this antibody was raised using an antigen corresponding to amino acids of human Par6B, and there are several non-conserved amino acids in the corresponding region of the mouse Par6B protein. The antibody might therefore bind more strongly to human Par6B than to mouse Par6B, which would mean the expression of mouse Par6B is underestimated when compared to human Par6B. As the relative expression levels of mouse and human Par6B in 16HBE-pBABE-HA-mPar6B can not be conclusively estimated it is not possible to comment on whether the exogenous Par6B expression is sufficient to rescue the phenotype caused by knockdown of endogenous Par6B. A final possible explanation for the failure of the exogenous Par6B protein to rescue the Par6B phenotype is that mouse Par6B might not be sufficiently similar to human Par6B. However this is unlikely as mouse and human Par6B proteins show a high degree of sequence similarity (91% identity and 94% homology). The mouse Par6B construct used in these experiments was found to interact with human apkc, a known interacting partner of Par6B, in coimmunoprecipation experiments (data not shown), confirming the high degree of similarity between mouse and human Par6B proteins. 149
150 5.3 Cdc42, PAK4 and Par6B are required for the formation of adherens junctions and the organization of junctional F-actin As described earlier, epithelial cells form adherens junctions which can be analysed by immunofluorescence microscopy using antibodies against E-cadherin or β-catenin, and organize F-actin in to the characteristic perijunctional ring closely associated with junctions. In addition to preventing tight junction formation, knockdown of Cdc42, PAK4 or Par6B was found to result in abnormal E-cadherin staining. Some E-cadherin was localized at cell-cell contacts, but it was not concentrated in the sharp line indicative of mature adherens junctions found in control monolayers (Figure 5.5 and 5.6). F-actin, visualized by phalloidin staining, was found in prominent cortical bundles and did not reorganize in to the junctional actin filaments found in control monolayers (Figure 5.7 and 5.8). As described for knockdown of RhoA and PRK2 earlier (section 4.4), the junctions in 16HBE monolayers depleted of Cdc42, PAK4 or Par6B are similar to those in control cells at early times of calcium-induced junction formation. Cdc42, PAK4 and Par6B are required for the formation of mature epithelial apical junctions, comprising adherens junctions and tight junctions and the associated junctional F-actin. Cells depleted of Cdc42, PAK4 or Par6B are able to undergo early stages of cell-cell contact formation, in which adherens junction proteins are localized at cell-cell contacts, but can not form mature junctions. 150

151 ZO-1 E-cadherin merge 151
152 ZO-1 E-cadherin merge 152

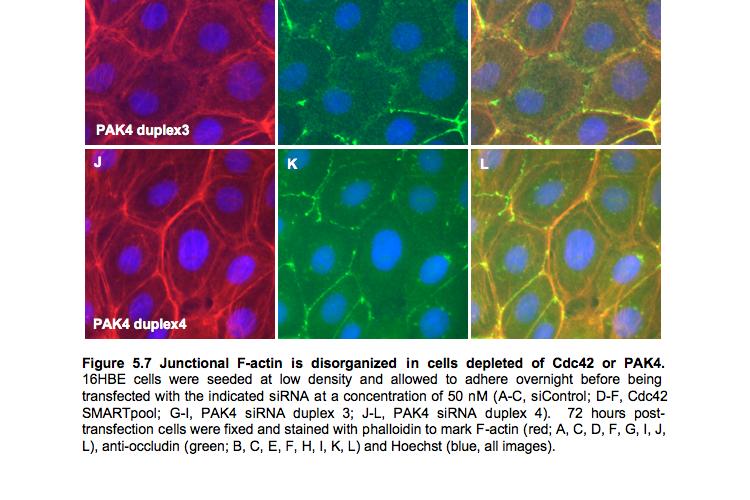
153 F-actin occludin 153 merge

154 F-actin ZO-1 merge 154
, and also in the nucleus (Figure 5.9 above, panels A and D).")
155 5.4 PAK4 and Par6B colocalize with ZO-1 at tight junctions 16HBE monolayers were stained with the anti-pak4 antibody to determine the localization of PAK4 protein. PAK4 staining was detected at cell-cell contacts where it colocalized with the tight junction protein ZO-1 (Figure 5.9 above, panels A-C), and also in the nucleus (Figure 5.9 above, panels A and D). The PAK4 signal at cell-cell contacts is likely to be specific, because HA-tagged PAK4 also colocalized with ZO-1 at cell-cell contacts (Figure 5.10, panels D-F). Interestingly, a PAK4 splice variant has been identified, PAK4-short, and when expressed exogenously in 16HBE cells it localizes to the nucleus (Figure 5.10, panels G-I), raising the possibility that the nuclear staining seen with the PAK4 antibody might be endogenous PAK4-short protein. However, a band was not seen corresponding to the PAK4-short isoform when 16HBE cell lysates are analysed by western blot using the PAK4 antibody, despite the fact that the PAK4-short isoform is recognized by the PAK4 antibody used (data not shown), suggesting that if PAK4-short is expressed in 16HBE cells it is at a significantly lower level than the long isoform of PAK4. 155
156 The PAK4 staining at cell-cell contacts also partly overlaps with the adherens junction protein β-catenin (Figure 5.9, panels D-F). As discussed earlier (section 4.5) with regard to PRK2 localization, tight junction proteins and adherens junction proteins do not fully separate along the lateral membrane under these culture conditions. Adherens junction proteins such as E-cadherin and β-catenin localize all along the lateral membrane, while tight junction proteins such as ZO-1 and occludin are localized in a more discrete plane. Tight junction proteins colocalize with the adherens junction proteins located at the apical-most edge of the adherens junction (for examples, see Figures 5.5 panels A-C and 5.6 panels A-C). The observation that PAK4 localizes in a discrete plane that colocalizes with ZO-1, rather than in a more diffuse pattern all along the lateral membrane, suggests that PAK4 is localized at the tight junction and not the adherens junction. However this should be confirmed under conditions where tight junctions fully separate from adherens junctions along the lateral membrane. Furthermore, due to the narrow width of tight junction structures (typically nm), it is not possible to conclusively localize a protein at tight junctions based on colocalization with tight junction proteins in fluorescence microscopy studies. Instead ultrastructural studies are required to resolve tight junctions (Matter and Balda, 2003a). We have not performed such experiments as they are technically challenging. In contrast to ZO-1, which is localized in a continuous ring around the cell-cell contact in the majority of cells, PAK4 protein is only localized to the cell-cell contact in approximately 25% of cells, and some of those cells only have PAK4 localized at a part of the cell-cell contact. This partial localization at junctions would be consistent with PAK4 playing a regulatory role in junction formation, in contrast to ZO-1, which is a structural component of the tight junction. 16HBE monolayers were stained with the Par6B antibody to determine the localization of Par6B protein. As discussed in Chapter 1 (section 1.4.4), Par6 localizes to the tight junction in epithelial cells, where it forms a complex with Par3 and apkc and regulates tight junction formation. As expected, endogenous Par6B colocalized with ZO-1 at cell-cell contacts in 16HBE cells (Figure 5.11, A-C). As observed for PAK4, Par6B does not colocalize exclusively with ZO-1, and some overlap can be seen with the 156
157 adherens junction protein β-catenin (Figure 5.11 D-F). As discussed above, this is likely to reflect the fact that under these culture conditions tight junction and adherens junction proteins do not fully segregate along the lateral membrane. 157
, the semi-crib domain (which binds to active")
158 5.5 Discussion Three mammalian Par6 genes have been cloned, Par6A-C (Joberty et al., 2000). Par6 isoforms show high sequence identity, particularly in the known protein-protein interaction domains, including the PB1 domain (which binds to apkc), the semi-crib domain (which binds to active forms of the GTPases Cdc42, TC10 and Rac), and the PDZ domain (which binds to Par3 and PALS1, and contributes to GTPase-binding) (Figure 5.12). Areas outside these domains, and in particular at the C-terminus, show more sequence divergence, but these areas do not have any known binding partners. 158
159 Par6 is one of many polarity proteins to be discovered using genetic approaches in C.elegans and Drosophila. The Par (partitioning-defective) genes were discovered in a screen to identify genes required for asymmetric cell division in the C.elegans zygote, and have since been found to be conserved in higher organisms. In general, polarity genes encode scaffold proteins that form multiprotein complexes through a network of protein-protein interactions and associate with discrete plasma membrane domains to define plasma membrane identity and to establish and maintain cell polarity (see introduction, section 1.4.4). Epithelial cells exhibit apical-basal polarity, with distinct apical and basolateral membrane domains. Par6, in a complex with Par3 and apkc, is localized apically, where it activates apkc in a spatially restricted manner. apkc in turn phosphorylates basolateral proteins including Par1 and Lgl and restricts them to the basolateral domain. The Par3/Par6/aPKC complex is therefore a key regulator of apical-basal polarity in epithelial cells. In vertebrate epithelial cells tight junctions, consisting of strands of claudin proteins, form at the boundary between the apical and basolateral membrane domain. Many of the polarity proteins required for apical-basal polarization are also required for tight junction formation in vertebrate epithelial cells, including the Par3/Par6/aPKC complex. Par6 is localized at tight junctions, where it colocalizes with Par3 and apkc (Johansson et al., 2000; Yamanaka et al., 2001). At 159
160 least two mechanisms have been proposed for the localization of this complex at tight junctions: Par3 binding to JAM and Par6 binding to PALS1 (see introduction, section 1.4.4). Evidence that Par6 regulates tight junction formation has come from overexpression studies. Overexpression of full-length Par6B (Joberty et al., 2000), or Par6A or Par6B mutants lacking the N-terminal PB1 domain that binds to apkc (Gao et al., 2002; Yamanaka et al., 2001), resulted in disruption of tight junctions in MDCK cells. However it is difficult to draw conclusions about the physiological role of Par6 based on these studies, as overexpressed Par6 proteins are likely to sequester binding partners with known roles in tight junction formation, including Par3, apkc, Cdc42 and PALS1. I have demonstrated a clear role for Par6B, one of the mammalian Par6 homologues, in tight junction formation. Regulation of tight junction formation in 16HBE cells by Par6B is likely to involve apkc. apkc has been shown to be required for tight junction formation using RNAimediated knockdown and overexpression of dominant-negative mutants, and this role is dependent on apkc kinase activity (Suzuki et al., 2002; Suzuki et al., 2001). In addition to phosphorylating Par1 and Lgl and establishing apical-basal polarity, apkc isoforms can also directly phosphorylate tight junction proteins including ZO-1, occludin and claudin-1, at least in vitro, and this might contribute to apkc function in tight junction formation (Nunbhakdi-Craig et al., 2002). Depletion of apkc in 16HBE cells using sirna duplexes targeting both apkcι and apkcζ isoforms prevents tight junction formation, phenocopying knockdown of Par6B (J. Durgan and A.Hall, unpublished data). Based on the observation that RNAi-mediated knockdown of Par6B phenocopies knockdown of Cdc42, it is reasonable to speculate that Par6B acts downstream of Cdc42 in tight junction formation in 16HBE cells. Par6 is an effector protein for Cdc42, as it binds specifically to the active GTP-bound form of Cdc42. Binding of active Cdc42 to Par6 results in activation of the associated apkc, and this is thought to involve relief of inhibition of apkc by Par6. apkc in complex with Par6 has low kinase activity compared to isolated apkc, and binding of active Cdc42 restores apkc kinase activity to basal levels (Yamanaka et al., 2001). Polarized localization of Par6 in 160
161 the C.elegans zygote and in Drosophila epithelial cells requires Cdc42. RNAimediated depletion of Cdc42 in C.elegans phenocopies loss of Par6, resulting in loss of asymmetric cell division, and this results from a failure to restrict Par6 localization to the anterior cortex (Gotta et al., 2001). After cellularization of the Drosophila embryo Par6 localizes apically in the newly-formed epithelial cells, and this is blocked by expression of dominant-negative Cdc42. A mutant of Par6 that can no longer bind to Cdc42 but still binds to Par3 and apkc can not rescue the polarity defect in Par6-null embryos (Hutterer et al., 2004). Cdc42 therefore regulates Par6 function in two ways, by controlling its localization and by activating the associated apkc. In vertebrate epithelial cells Cdc42 partly localizes at tight junctions, and Cdc42 is activated in response to cell-cell adhesion (Otani et al., 2006), both of which are consistent with the idea that Cdc42 activates the Par3/Par6/aPKC complex to promote tight junction formation. However there is some disagreement in the literature about whether Cdc42 activity is required for tight junction formation. Some studies have found that expression of dominant-negative Cdc42 has no effect on junction formation (Gao et al., 2002; Mertens et al., 2005; Takaishi et al., 1997), while other studies have shown that inhibition of Cdc42 signalling prevents junction formation (Fukuhara et al., 2003; Otani et al., 2006; Rojas et al., 2001). Par6 is also an effector for the GTPase Rac1, which also localizes partly at tight junctions where it is activated by the GEF Tiam1 (Mertens et al., 2005). Tiam1 binds to Par3, and in keratinocytes at least activation of the Par3/Par6/aPKC complex during tight junction formation is Rac-dependent and not Cdc42-dependent. I have found that Cdc42 is required for apical junction formation in 16HBE cells, and a reasonable model is that it is acting through Par6B. However it is not known whether Rac activity is also required for apical junction formation in 16HBE cells (see section 3.6). It therefore remains possible that regulation of the Par6 complex in 16HBE cells is Rac- and not Cdc42-dependent. PAK4 belongs to the p21-activated kinase (PAK) family, consisting of 6 members in mammals, which are divided in to class I PAKs (PAK1, 2 and 3) and class II PAKs (PAK4, 5 and 6), based on sequence similarity and mode of regulation. PAKs belong to the STE family of kinases, named after one of the yeast PAK proteins STE20. Genetic analysis in yeast has shown that PAK regulates the actin cytoskeleton and MAPK 161
.")
162 signalling pathways, and these functions are conserved in higher organisms (Hofmann et al., 2004). The 6 mammalian PAKs contain a conserved C-terminal serine/threonine kinase domain and a conserved N-terminal GTPase-binding domain including a CRIB motif (Figure 5.13 above). Apart from these conserved domains, class I and class II PAKs do not show sequence similarity. PAK4 homologues have been described in Drosophila and Xenopus, and there is evidence they regulate epithelial morphogenesis. The Drosophila PAK4 homologue Mbt (mushroom body tiny) was identified as a gene required for normal brain development. Mbt mutant flies have unusually small mushroom bodies (structures involved in learning and memory analogous to the hippocampus) with reduced numbers of Kenyan cells, suggesting Mbt is required for proliferation, differentiation or survival (Melzig et al., 1998). The eyes of mutant flies also develop abnormally, with variable numbers of photoreceptor cells missing, and the remaining photoreceptor cells exhibiting morphological defects (Schneeberger and Raabe, 2003). Drosophila eyes develop from the eye imaginal disc, which is a simple epithelial sheet. Mbt protein is localized at adherens junctions in differentiating photoreceptor cells in the eye imaginal 162
163 disc, and Mbt mutants show fragmented localization of adherens junction proteins. Mbt is therefore thought to regulate photoreceptor morphogenesis through the regulation of adherens junctions. Interestingly, expression of constitutively active Mbt also disrupts adherens junctions in photoreceptor cells (Menzel et al., 2007), suggesting Mbt levels need to be tightly regulated. Mbt can directly phosphorylate armadillo (the Drososphila homologue of β-catenin) in vitro, and this weakens the interaction between armadillo and DE-cadherin, which could contribute to the disruption of adherens junctions seen when constitutively active Mbt is overexpressed (Menzel et al., 2008). In developing Xenopus embryos, X-PAK5 (the Xenopus PAK4 homologue) localizes to adherens junctions in animal cap cells and dorsal marginal zone (DMZ) cells. Expression of either kinase-dead X-PAK5, which is expected to act as a dominant-negative, or constitutively active X-PAK5 in DMZ cells interferes with convergence extension (CE) movements, during which cells elongate and intercalate between each other (Faure et al., 2005). CE movements require dynamic rearrangements of cell-cell adhesion. The finding that activation or inhibition of X-PAK5 prevents CE movements is consistent with the observation that loss of Mbt or overexpression of active Mbt in Drosophila photoreceptor cells both result in adherens junction defects. Mammalian PAK4 has not been studied in the context of epithelial morphogenesis. PAK4 knockout mice have been generated, but die during embryogenesis with defects in multiple tissues, making it difficult to draw conclusions about PAK4 function (Qu et al., 2003). Cell culture studies have focused on overexpression of PAK4 in fibroblasts, showing that PAK4 regulates cell morphology and allows anchorage-independent growth, a sign of cellular transformation (Qu et al., 2001). This is interesting as PAK4 is overexpressed in many cancer cell lines (Callow et al., 2002). However it is unclear if these effects reflect physiological functions of PAK4. I have demonstrated that PAK4 is required for the formation of apical junctions in epithelial cells, using RNAimediated knockdown and rescue experiments. 16HBE cells depleted of PAK4 undergo initial stages of cell-cell adhesion, but do not form mature junctional structural structures consisting of adherens junctions, tight junctions and the associated perijunctional F-actin. Based on the observation that RNAi-mediated knockdown of Cdc42 phenocopies knockdown of PAK4, I propose that PAK4 acts downstream of 163
164 Cdc42 to regulate tight junction formation in 16HBE cells. PAK was the first kinase to be identified as an effector protein for Rho GTPases, and the regulation of PAK1 by Rac and Cdc42 has been extensively studied. Active forms of Rac and Cdc42 bind to the GTPase-binding domain of PAK1 and enhance its kinase activity. Deletion of the N-terminus of PAK1, including the GTPase-binding domain, leads to constitutive activation of PAK1, suggesting that the N-terminus acts in an autoinhibitory fashion (Xhao et al 1998). Mutational analysis defined an autoinhibitory region that overlapped with the GTPase-binding domain, and structural studies showed this autoinhibitory region binds to the kinase domain and blocks the catalytic site (Lei et al., 2000). These studies lead to a general model in which PAKs are activated by binding of Rac or Cdc42 to the GTPase-binding domain resulting in dissociation of the autoinhibitory region from the kinase domain. However important differences have been found in class II PAKs, including PAK4. Class II PAKs bind preferentially to active Cdc42 and only weakly to Rac (Abo et al., 1998; Dan et al., 2002). Class II PAKs lack the autoinhibitory region found in class I PAKs and show relatively high kinase activity in vitro in the absence of GTPase. Addition of GTP-bound Cdc42 does not further increase the kinase activity of class II PAKs. Deletion of the N-terminus including the GTPase-binding domain does lead to a modest enhancement of kinase activity though, suggesting alternative autoinhibitory interactions might exist in class II PAKs. It has been proposed that Cdc42 regulates PAK4 activity by controlling its cellular localization. When PAK4 is overexpressed in fibroblasts it is recruited to the Golgi by constitutively active Cdc42 (Abo et al., 1998). The Drosophila Mbt homologue localizes at adherens junctions in photoreceptor cells and this requires an intact CRIB motif. Point mutations in the CRIB motif that prevent Cdc42-binding prevent adherens junction localization and fail to rescue the defect in adherens junctions seen in Mbt mutants (Schneeberger and Raabe, 2003). In mammalian epithelial cells Cdc42 localizes partly at tight junctions and is activated in response to cell-cell adhesion (Otani et al., 2006). I have found that PAK4 is localized partly to tight junctions in 16HBE cells, where it colocalizes with the tight junction protein ZO-1, consistent with it playing a regulatory role in tight junction formation. Activation of Cdc42 at tight junctions might provide a mechanism for recruitment of PAK4 to tight junctions. 164
165 PAK4 is a serine/threonine kinase and several substrates have been identified. Most notably PAK4 phosphorylates LIMK (LIM kinase) and SHH (slingshot phosphatase) to control the activity of the actin regulatory protein cofilin/adf (Dan et al., 2001; Soosairajah et al., 2005). LIMK phosphorylates cofilin to inactivate it, while SHH dephosphorylates the same residue in cofilin to activate it. PAK4 phosphorylation of LIMK activates it, while PAK4 phosphorylation of SHH inactivates it. PAK4 thus inhibits cofilin activity by these two complementary pathways. Cofilin stimulates actin polymerization by severing actin filaments, which generates free barbed ends for actin assembly, and also stimulates depolymerization of actin filaments at pointed ends (Desmarais et al., 2005) (see introduction, section 1.3.1a). There is some evidence that cofilin activity contributes to the disassembly of epithelial junctions (Ivanov et al., 2004). Cultured epithelial cells depleted of calcium rapidly disassemble their junctions, as they are no longer able to maintain E-cadherin at the cell surface in a competent state for trans-dimerization. Junction disassembly is associated with contraction of the perijunctional actin ring, which exacerbates junction disassembly. Cofilin activity increases as junctions disassemble, seen as a decrease in phosphorylated cofilin, and active non-phosphorylated cofilin is found associated with the contracting actin ring. Contraction of the perijunctional actin ring clearly requires myosin II motor activity, but it has been proposed that the actin depolymerizing activity of cofilin might also be important during this process, as pharmacological inhibition of actin depolymerization prevents contraction of perijunctional actin filaments in calcium-depleted cells (Ivanov et al., 2004). It is therefore possible that inhibition of cofilin downstream of PAK4 is required for the formation of stable perijunctional actin filaments found in mature epithelial monolayers, analogous to the proposed role for cofilin inhibition downstream of Rho-ROCK-LIMK to stabilize actin filaments that form stress fibres (Burridge and Wennerberg, 2004). On the other hand, one study suggested cofilin activity to be important for tight junction formation (Chen and Macara, 2006). RNAi-mediated depletion of Par3 in MDCK cells delays tight junction formation, and also leads to increased levels of phosphorylated inactive cofilin. The defect in tight junction formation could be partially rescued by expressing an active non-phosphorylatable form of cofilin or by downregulating expression of LIMK2. Furthermore, Par3 binds to 165
166 LIMK2 and inhibits its kinase activity. Par3 might therefore promote tight junction formation, at least in part, by inhibiting LIMK2 and preventing cofilin from being inactivated. However, RNAi-mediated downregulation of cofilin itself had no effect on tight junction formation in this study, so it remains unclear whether cofilin activity is required for tight junction formation. Inhibition of cofilin downstream of PAK4 therefore remains a potential mechanism for PAK4-dependent tight junction formation. Another interesting PAK4 substrate is β-catenin, an important component of adherens junctions. As mentioned above the Drosophila PAK4 homologue, Mbt, directly phosphorylates the Drosophila β-catenin homologue, armadillo (Menzel et al., 2008). However, this phosphorylation weakens the interaction between β-catenin and E- cadherin, and is thought to contribute to the disruption of adherens junctions caused by overexpression of active Mbt. It is therefore unlikely that phosphorylation of β-catenin by PAK4 would contribute to junction formation. In summary, I have found that Cdc42 and its effector proteins Par6B and PAK4 are required for apical junction formation in 16HBE cells. Depletion of any one of these proteins results in a similar phenotype, in which cells undergo the initial stages of cellcell adhesion during which E-cadherin accumulates at cell-cell contact, but do not form mature apical junctions. Par6B and PAK4 both colocalize with ZO-1 at cell-cell contacts, and this is likely to be important for their function in junction formation. Par6B and PAK4 are both known to be effector proteins for Cdc42, and I therefore propose that Cdc42 controls junction formation by regulating Par6B and PAK4. 166
167 CHAPTER 6 Final Discussion 6.1 Thesis overview Rho GTPases control many different cellular processes by regulating the activity of a large number of downstream effector proteins. Rho GTPases are themselves regulated by upstream signalling pathways acting through Rho GEFs and Rho GAPs. The human genome contains 20 Rho GTPases and approximately 80 GEFs, 70 GAPs and at least 90 effectors. An outstanding question is therefore how the components of Rho GTPase signalling pathways are organized during diverse processes to generate specific responses. Substantial evidence exists in the literature for a role for Rho GTPases in epithelial junction formation (see section above). I have confirmed that two Rho family proteins, RhoA and Cdc42, are required for apical junction formation in 16HBE cells, using a microscopy-based assay. RNAi screens carried out to identify components of the signalling pathways through which these GTPases regulate apical junction formation have identified 3 Rho effector proteins, namely PRK2, PAK4 and Par6B. RNAi-mediated depletion of these proteins phenocopies depletion of the upstream GTPases, with cells undergoing the early stages of cell-cell adhesion, during which E- cadherin is recruited to nascent cell-cell contacts, but failing to undergo junctional maturation, during which mature adherens and tight junctions and the associated perijunctional actin filaments form. It is likely that additional Rho GTPase effector signalling pathways, not identified in these screens, play a role in regulating junction formation in 16HBE cells. The Rho family consists of 20 members, only a small number of which were investigated in this study. A number of well-characterized Rho effector proteins have described roles in junction formation, including ROCK, mdia and IQGAP (discussed earlier in section 1.5.1) and yet were not identified in the effector RNAi screens in 16HBE cells. While 167
168 this might in some cases reflect differences in cell types, it is likely that some Rho effector proteins were not identified here due to insufficient protein knockdown with the SMARTpool sirna reagents used in these experiments. In this study I have used a microscopy-based assay to look at junction formation. As discussed in the introduction (section 1.4.3), tight junction strands, the structural components of tight junctions seen in EM studies, are composed principally of claudin proteins. I have used the localization of ZO-1 and occludin at cell-cell contacts to assess tight junction formation, due to the availability of good antibodies for these proteins and the large number of claudin proteins known to exist (at least 24 isoforms) (Aijaz et al., 2006). ZO proteins are essential for tight junctions formation and localize to the cytoplasmic face of tight junctions in polarized epithelia, but they are not transmembrane proteins and do not contribute physically to tight junction strands. While occludin is found in tight junction strands its role in junction formation is unclear. ZO-1 and occludin are, however, still regarded as good indicators of tight junction integrity in microscopy studies. Non-microscopy based assays also exist for analysing tight junctions, including measurement of transepithelial electrical resistance (TER) and permeability to labelled molecules (Matter and Balda, 2003a), and these have been used to study the distinct barrier properties of specific epithelia in functional studies. These assays can also be used to quantitatively assess gross defects in tight junction formation, and could be used in future to complement the microscopy studies presented here. 6.2 Identification of effector proteins acting downstream of RhoA and Cdc42 to regulate apical junction formation As discussed in chapter 4 (section 4.6), PRK2 is a known effector protein for RhoA. In vitro the kinase activity of PRK family kinases is enhanced by addition of active RhoA. Furthermore, there is evidence that active RhoA localizes at cell-cell contacts during junction formation, which could potentially recruit PRK2. Based on the results 168
169 presented in this thesis I propose that RhoA promotes junction formation by regulating PRK2. However it should be noted that GTPase-independent regulatory mechanisms have also been described for PRK. Due to its similarity to PKC, initial biochemical characterization of PRK1 was based on known regulatory mechanisms for PKC. In contrast to PKC family members, PRK1 is not activated by calcium or phosphatidylserine, but is activated by other phospholipids such as phosphatidylinositol, and also by unsaturated fatty acids including arachidonic acid and linoleic acid (Mukai et al., 1994; Palmer et al., 1995). PRK2 was subsequently found to have similar regulatory mechanisms, being activated in vitro by phospholipids and fatty acids, although activation of PRK2 by fatty acids is considerably weaker than activation of PRK1 (Yu et al., 1997). Deletion analysis of PRK1 has defined an autoinhibitory region of approximately 60 amino acids within the C2-like domain (Yoshinaga et al., 1999). N-terminal truncation of PRK1 before the C2-like domain does not activate PRK1, and the truncated protein can still be activated by addition of arachidonic acid. However N-terminal truncation of PRK1 just before the kinase domain results in a constitutively active form of PRK1 which lacks the C2-like domain and is no longer sensitive to arachidonic acid. Furthermore, a peptide corresponding to the C-terminal portion of the C2-like domain inhibits PRK1 kinase activity, suggesting it acts as an autoinhibitory pseudosubstrate. Based on these experiments, it has been proposed that the ability of lipids to activate PRK is based on binding to the C2-like domain and relieving autoinhibition (Yoshinaga et al., 1999). To more directly test the idea that PRK2 acts downstream of RhoA to regulate tight junction formation rescue experiments should be performed. If PRK2 acts downstream of RhoA, overexpression of PRK2 might be sufficient to rescue the phenotype caused by depletion of RhoA. However the results of experiments overexpressing Rho effector-loop mutants as dominant-negatives suggest that more than one Rho effector protein is likely to be acting downstream of RhoA to regulate tight junction formation (section 4.3). Overexpression of PRK2 alone is therefore unlikely to be sufficient to rescue the RhoA phenotype. 169
170 Exogenous expression of mouse PRK2, which is not targeted by some of the human sirna duplexes used in our experiments, rescued the defect in tight junction formation caused by knockdown of PRK2 (Figure 4.4). The signalling pathways upstream and downstream of PRK2 can now be assessed by using mutant forms of PRK2 in rescue experiments. Structural studies of the HR1 domains of PRK1 in complex with GTPases have highlighted a number of residues that make direct contacts (Maesaki et al., 1999; Owen et al., 2003). These residues can be mutated to interfere with GTPase-binding and the mutant proteins can be used in rescue experiments and localization studies to determine whether PRK2 function in the regulation of junctions is GTPase-dependent. As mentioned earlier (section 4.6) there are some reports that PRK proteins can interact with Rac1 as well as RhoA (Owen et al., 2003; Vincent and Settleman, 1997). I have not been able to determine whether Rac is required for tight junction formation in 16HBE cells (discussed in section 3.6). It therefore remains possible that PRK2 regulates tight junction formation downstream of Rac and not RhoA. There are conflicting reports on the binding specificity of individual HR1 domains of PRK1. One study found that HR1a and HR1b both interact only with RhoA and not with Rac1 (Flynn et al., 1998), while another found HR1a and HR1b both interact with Rac1 and only HR1a interacts with RhoA (Owen et al., 2003). The binding specificity of individual HR1 domains of PRK2 has not been determined. It is possible that different HR1 domains of PRK2 mediate interactions with different GTPases. Mutation of residues involved in GTPase binding might therefore provide a way to test not only whether PRK2 regulates tight junction formation in a GTPase-dependent manner, but also whether it acts downstream of RhoA or Rac1. This approach was successfully used to show that the Drosophila PRK protein, PKN, acts downstream of Rho and not Rac1 during dorsal closure (Betson and Settleman, 2007). As discussed in earlier (section 5.5), PAK4 is an effector protein for Cdc42. In vitro the kinase activity of PAK4 is not regulated by GTPase-binding, and instead Cdc42 has been suggested to regulate PAK activity by controlling its cellular localization. Based on the data presented in this thesis, I propose that Cdc42 promotes junction formation, 170
171 at least in part, by regulating PAK4. To test whether PAK4 function in regulating tight junctions is Cdc42-dependent, a similar approach can be taken to that described above for PRK2 and RhoA. Exogenous expression of RNAi-resistant PAK4 rescued the tight junction defect caused by depletion of PAK4 (Figure 5.2). Point mutations can be introduced in to the CRIB motif of PAK4 to abolish its interaction with Cdc42, and this mutant protein can be used to determine whether PAK4 localization at cell-cell contacts, and PAK4 function in regulating apical junction formation, require Cdc42- binding. A similar approach was used to show that the function of Mbt, the Drosophila homologue of PAK4, acts downstream of Cdc42 to regulate adherens junction formation in photoreceptor cells (Schneeberger and Raabe, 2003). A second Cdc42-effector protein was identified in the Rho effector screen, Par6B. Par6 homologues have well documented roles downstream of Cdc42 in the regulation of cell polarity, by controlling the localization and activity of apkc (discussed in sections 5.5 and 1.4.4). While it seems likely that Par6B function in tight junction formation in 16HBE cells is also dependent on GTPase-binding and regulation of apkc, this should be tested by performing rescue experiments using Par6B proteins with mutations in the semi-crib motif, that binds to Cdc42 and Rac1, and the PB1 domain, that binds to apkc. Unfortunately initial attempts to rescue the Par6B phenotype with wild-type mouse Par6B failed. A number of possible reasons were discussed (section 5.5), including insufficient expression of the rescue construct and mislocalization, perhaps due to the N-terminal HA tag. It is highly unlikely that the phenotype caused by transfection of Par6B sirna is non-specific, as 4 distinct sirna duplexes generated this phenotype, and the degree of Par6B protein knockdown correlated well with the severity of the phenotype. Future experiments will resolve this by using untagged or C- terminally tagged Par6B rescue constructs, and using a different expression vector to achieve a higher level of expression. 171
172 6.3 Mechanisms through which Rho effector proteins regulate apical junction formation Epithelial junction formation is a complex multistep process. For junctions to form, the junctional transmembrane proteins, including E-cadherin and claudins, need to be recruited to the plasma membrane and stabilized there in a competent state to form junctions. This requires coordination of membrane trafficking pathways, changes in the cytoskeleton, and biochemical regulation of junctional proteins. I have identified 3 Rho effector proteins whose activity is required for junctions to form, seen as a failure to properly recruit junctional proteins and reorganize the associated actin cytoskeleton at cell-cell contacts. However based on these microscopy studies it is difficult to determine the mechanism through these proteins act. Instead, analysis of their downstream signalling pathways will be required elucidate the mechanisms through which they regulate junction formation. As discussed, Par6B is likely to regulate junction formation through apkc. However the mechanisms through which PAK4 and PRK2 regulate junction formation remain to be determined (Figure 6.1). Rescue experiments can be used to analyse the signalling pathway downstream of PAK4 and PRK2. Kinase-dead mutants of both have been described (Abo et al., 1998),(Vincent and Settleman, 1997), which can be used to determine whether their function in junction regulation requires kinase activity. It should be noted that kinase-dead proteins, when overexpressed, might potentially act as dominant-negatives, which would preclude their use in rescue experiments, but would still enable assessment of whether kinase activity is important for tight junction formation. As discussed earlier (section 5.5), some interesting PAK4 substrates have been identified, including LIM kinase, slingshot phosphatase and β-catenin, although it is not clear if these represent relevant substrates as far as junction formation is concerned. In vitro PRK efficiently phosphorylates synthetic peptides corresponding to PKC consensus sequences, and a number of protein substrates have also been identified in vitro, including several actin associated proteins, but physiologically relevant substrates 172

173 for PRK have not been found (Mukai, 2003). Future work will be required to identify interacting partners, including potential substrates, for PAK4 and PRK2 using biochemical approaches. A potentially interesting biochemical interaction has been found between PAK4 and Par6B, the two Cdc42 effector proteins identified in this study, in immunoprecipitation experiments (D.Jin and A.Hall, unpublished data). This interaction has been mapped to the kinase domain of PAK4, raising the possibility that Par6B is a PAK4 substrate. The physiological significance of this interaction is currently being investigated. 173
Activation of a receptor. Assembly of the complex
 Activation of a receptor ligand inactive, monomeric active, dimeric When activated by growth factor binding, the growth factor receptor tyrosine kinase phosphorylates the neighboring receptor. Assembly
CELB40060 Membrane Trafficking in Animal Cells. Prof. Jeremy C. Simpson. Lecture 2 COPII and export from the ER
 CELB40060 Membrane Trafficking in Animal Cells Prof. Jeremy C. Simpson Lecture 2 COPII and export from the ER Today s lecture... The COPII coat - localisation and subunits Formation of the COPII coat at
Signal Transduction. Dr. Chaidir, Apt
 Signal Transduction Dr. Chaidir, Apt Background Complex unicellular organisms existed on Earth for approximately 2.5 billion years before the first multicellular organisms appeared.this long period for
Regulation and signaling. Overview. Control of gene expression. Cells need to regulate the amounts of different proteins they express, depending on
 Regulation and signaling Overview Cells need to regulate the amounts of different proteins they express, depending on cell development (skin vs liver cell) cell stage environmental conditions (food, temperature,
1. The plasma membrane of eukaryotic cells is supported by a. actin filaments. b. microtubules. c. lamins. d. intermediate filaments.
 ANALYSIS AND MODELING OF CELL MECHANICS Homework #2 (due 1/30/13) This homework involves comprehension of key biomechanical concepts of the cytoskeleton, cell-matrix adhesions, and cellcell adhesions.
Zool 3200: Cell Biology Exam 5 4/27/15
 Name: Trask Zool 3200: Cell Biology Exam 5 4/27/15 Answer each of the following short answer questions in the space provided, giving explanations when asked to do so. Circle the correct answer or answers
Molecular Cell Biology 5068 In Class Exam 2 November 8, 2016
 Molecular Cell Biology 5068 In Class Exam 2 November 8, 2016 Exam Number: Please print your name: Instructions: Please write only on these pages, in the spaces allotted and not on the back. Write your
13-3. Synthesis-Secretory pathway: Sort lumenal proteins, Secrete proteins, Sort membrane proteins
 13-3. Synthesis-Secretory pathway: Sort lumenal proteins, Secrete proteins, Sort membrane proteins Molecular sorting: specific budding, vesicular transport, fusion 1. Why is this important? A. Form and
5- Semaphorin-Plexin-Neuropilin
 5- Semaphorin-Plexin-Neuropilin 1 SEMAPHORINS-PLEXINS-NEUROPILINS ligands receptors co-receptors semaphorins and their receptors are known signals for: -axon guidance -cell migration -morphogenesis -immune
Cell Biology Review. The key components of cells that concern us are as follows: 1. Nucleus
 Cell Biology Review Development involves the collective behavior and activities of cells, working together in a coordinated manner to construct an organism. As such, the regulation of development is intimately
Examination paper for Bi3016 Molecular Cell Biology
 Department of Biology Examination paper for Bi3016 Molecular Cell Biology Academic contact during examination: Per Winge Phone: 99369359 Examination date: 20 th December 2017 Examination time (from-to):
MAPK kinase kinase regulation of SAPK/JNK pathways
 MAPK kinase kinase regulation of SAPK/JNK pathways Lisa Stalheim and Gary L. Johnson Abstract SAPK/JNK members of the MAPK family are regulated by at least fourteen known MAPK kinase kinases (MKKKs). In
Mechanisms of Cell Proliferation
 Mechanisms of Cell Proliferation Cell Cycle G 2 S G 1 Multi-cellular organisms depend on cell division/proliferation; Each organism has a developmental plan that determines its behavior and properties;
Visual pigments. Neuroscience, Biochemistry Dr. Mamoun Ahram Third year, 2019
 Visual pigments Neuroscience, Biochemistry Dr. Mamoun Ahram Third year, 2019 References Webvision: The Organization of the Retina and Visual System (http://www.ncbi.nlm.nih.gov/books/nbk11522/#a 127) The
Signal Transduction Phosphorylation Protein kinases. Misfolding diseases. Protein Engineering Lysozyme variants
 Signal Transduction Phosphorylation Protein kinases Misfolding diseases Protein Engineering Lysozyme variants Cells and Signals Regulation The cell must be able to respond to stimuli Cellular activities
Lecture 10: Cyclins, cyclin kinases and cell division
 Chem*3560 Lecture 10: Cyclins, cyclin kinases and cell division The eukaryotic cell cycle Actively growing mammalian cells divide roughly every 24 hours, and follow a precise sequence of events know as
Protein Sorting, Intracellular Trafficking, and Vesicular Transport
 Protein Sorting, Intracellular Trafficking, and Vesicular Transport Noemi Polgar, Ph.D. Department of Anatomy, Biochemistry and Physiology Email: polgar@hawaii.edu Phone: 692-1422 Outline Part 1- Trafficking
Mechanisms of Cell Proliferation
 Mechanisms of Cell Proliferation Cell Cycle G 2 S G 1 Multi-cellular organisms depend on cell division/proliferation; Each organism has a developmental plan that determines its behavior and properties;
Chem Lecture 10 Signal Transduction
 Chem 452 - Lecture 10 Signal Transduction 111202 Here we look at the movement of a signal from the outside of a cell to its inside, where it elicits changes within the cell. These changes are usually mediated
Molecular Cell Biology 5068 In Class Exam 1 September 30, Please print your name:
 Molecular Cell Biology 5068 In Class Exam 1 September 30, 2014 Exam Number: Please print your name: Instructions: Please write only on these pages, in the spaces allotted and not on the back. Write your
Central Roles of Small GTPases in the Development of Cell Polarity in Yeast and Beyond
 MICROBIOLOGY AND MOLECULAR BIOLOGY REVIEWS, Mar. 2007, p. 48 96 Vol. 71, No. 1 1092-2172/07/$08.00 0 doi:10.1128/mmbr.00028-06 Copyright 2007, American Society for Microbiology. All Rights Reserved. Central
The EGF Signaling Pathway! Introduction! Introduction! Chem Lecture 10 Signal Transduction & Sensory Systems Part 3. EGF promotes cell growth
 Chem 452 - Lecture 10 Signal Transduction & Sensory Systems Part 3 Question of the Day: Who is the son of Sevenless? Introduction! Signal transduction involves the changing of a cell s metabolism or gene
Reception The target cell s detection of a signal coming from outside the cell May Occur by: Direct connect Through signal molecules
 Why Do Cells Communicate? Regulation Cells need to control cellular processes In multicellular organism, cells signaling pathways coordinate the activities within individual cells that support the function
S1 Gene ontology (GO) analysis of the network alignment results
 analysis of the network alignment results") 1 Supplementary Material for Effective comparative analysis of protein-protein interaction networks by measuring the steady-state network flow using a Markov model Hyundoo Jeong 1, Xiaoning Qian 1 and
1 Supplementary Material for Effective comparative analysis of protein-protein interaction networks by measuring the steady-state network flow using a Markov model Hyundoo Jeong 1, Xiaoning Qian 1 and
Big roles for small GTPases in the control of directed cell movement
 Biochem. J. (2007) 401, 377 390 (Printed in Great Britain) doi:10.1042/bj20061432 377 REVIEW ARTICLE Big roles for small GTPases in the control of directed cell movement Pascale G. CHAREST and Richard
Neurite initiation. Neurite formation begins with a bud that sprouts from the cell body. One or several neurites can sprout at a time.
 Neurite initiation. Neuronal maturation initiation f-actin polarization and maturation tubulin stage 1: "spherical" neuron stage 2: neurons extend several neurites stage 3: one neurite accelerates its
Time allowed: 2 hours Answer ALL questions in Section A, ALL PARTS of the question in Section B and ONE question from Section C.
 UNIVERSITY OF EAST ANGLIA School of Biological Sciences Main Series UG Examination 2015-2016 FUNDAMENTALS OF CELL BIOLOGY AND BIOCHEMISTRY BIO-4004B Time allowed: 2 hours Answer ALL questions in Section
Study Guide 11 & 12 MULTIPLE CHOICE. Choose the one alternative that best completes the statement or answers the question.
 Study Guide 11 & 12 MULTIPLE CHOICE. Choose the one alternative that best completes the statement or answers the question. 1) The receptors for a group of signaling molecules known as growth factors are
Cell-Cell Communication in Development
 Biology 4361 - Developmental Biology Cell-Cell Communication in Development October 2, 2007 Cell-Cell Communication - Topics Induction and competence Paracrine factors inducer molecules Signal transduction
1- Below is a list of cell cycle phases matched with specific processes. Choose the correct pairing:
 Name: NetID: Exam 4 - Version 2 November 13, 2018 Dr. A. Pimentel Instructions: 1- Select the BEST answer for each question 2- Use pencil to mark your responses in the answer sheet. 3- You can mark your
The molecular genetics of chemotaxis: sensing and responding to chemoattractant gradients
 The molecular genetics of chemotaxis: sensing and responding to chemoattractant gradients Richard A. Firtel* and Chang Y. Chung Summary Chemotaxis plays a central role in various biological processes,
Cell-Cell Communication in Development
 Biology 4361 - Developmental Biology Cell-Cell Communication in Development June 23, 2009 Concepts Cell-Cell Communication Cells develop in the context of their environment, including: - their immediate
THE ROLE OF RhoD IN ACTIN DYNAMICS, RECEPTOR TRAFFICKING AND CANCER CELL MIGRATION
 From the Department of Microbiology, Tumor and Cell Biology Karolinska Institutet, Stockholm, Sweden THE ROLE OF RhoD IN ACTIN DYNAMICS, RECEPTOR TRAFFICKING AND CANCER CELL MIGRATION Vishal Nehru Stockholm
Cell Cell Communication in Development
 Biology 4361 Developmental Biology Cell Cell Communication in Development June 25, 2008 Cell Cell Communication Concepts Cells in developing organisms develop in the context of their environment, including
Cellular Signalling 26 (2014) Contents lists available at ScienceDirect. Cellular Signalling
 Contents lists available at ScienceDirect. Cellular Signalling") Cellular Signalling 26 (2014) 2998 3006 Contents lists available at ScienceDirect Cellular Signalling journal homepage: www.elsevier.com/locate/cellsig Review Controlling the switches: Rho GTPase regulation
Cellular Signalling 26 (2014) 2998 3006 Contents lists available at ScienceDirect Cellular Signalling journal homepage: www.elsevier.com/locate/cellsig Review Controlling the switches: Rho GTPase regulation
Student Learning Outcomes: Nucleus distinguishes Eukaryotes from Prokaryotes
 9 The Nucleus Student Learning Outcomes: Nucleus distinguishes Eukaryotes from Prokaryotes Explain general structures of Nuclear Envelope, Nuclear Lamina, Nuclear Pore Complex Explain movement of proteins
Biol403 - Receptor Serine/Threonine Kinases
 Biol403 - Receptor Serine/Threonine Kinases The TGFβ (transforming growth factorβ) family of growth factors TGFβ1 was first identified as a transforming factor; however, it is a member of a family of structurally
RNA Synthesis and Processing
 RNA Synthesis and Processing Introduction Regulation of gene expression allows cells to adapt to environmental changes and is responsible for the distinct activities of the differentiated cell types that
Plant Molecular and Cellular Biology Lecture 8: Mechanisms of Cell Cycle Control and DNA Synthesis Gary Peter
 Plant Molecular and Cellular Biology Lecture 8: Mechanisms of Cell Cycle Control and DNA Synthesis Gary Peter 9/10/2008 1 Learning Objectives Explain why a cell cycle was selected for during evolution
Ras e la Cascata delle Piccole GTPasi
 Roma 26-27 Giugno 2015 Multidisciplinarietà e Biologia Molecolare applicate alla pratica Clinica i Oncologica: un'opportunità ed un vantaggio per tuttitti Ras e la Cascata delle Piccole GTPasi Alvaro Leone
Analysis of correlated mutations in Ras G-domain
 www.bioinformation.net Volume 13(6) Hypothesis Analysis of correlated mutations in Ras G-domain Ekta Pathak * Bioinformatics Department, MMV, Banaras Hindu University. Ekta Pathak - E-mail: ektavpathak@gmail.com;
Heterotrimeric G proteins and the role of lipids in signaling. John Sondek, Ph.D. Depts. of Pharmacology and Biochemistry & Biophyscis
 Heterotrimeric G proteins and the role of lipids in signaling John Sondek, Ph.D. Depts. of Pharmacology and Biochemistry & Biophyscis The GTPase cycle molecular switch A GTPases is NOT a kinase Two major
Life Sciences 1a: Section 3B. The cell division cycle Objectives Understand the challenges to producing genetically identical daughter cells
 Life Sciences 1a: Section 3B. The cell division cycle Objectives Understand the challenges to producing genetically identical daughter cells Understand how a simple biochemical oscillator can drive the
A Genome-Wide Analysis of Arabidopsis Rop-Interactive CRIB Motif Containing Proteins That Act as Rop GTPase Targets
 The Plant Cell, Vol. 13, 2841 2856, December 2001, www.plantcell.org 2001 American Society of Plant Biologists A Genome-Wide Analysis of Arabidopsis Rop-Interactive CRIB Motif Containing Proteins That
Richik N. Ghosh, Linnette Grove, and Oleg Lapets ASSAY and Drug Development Technologies 2004, 2:
 1 3/1/2005 A Quantitative Cell-Based High-Content Screening Assay for the Epidermal Growth Factor Receptor-Specific Activation of Mitogen-Activated Protein Kinase Richik N. Ghosh, Linnette Grove, and Oleg
Cells to Tissues. Peter Takizawa Department of Cell Biology
 Cells to Tissues Peter Takizawa Department of Cell Biology From one cell to ensembles of cells. Multicellular organisms require individual cells to work together in functional groups. This means cells
1 Morphogenesis: Control of Cell Types and Shape
 1 Morphogenesis: Control of Cell Types and Shape K.J. Boyce 1,2,A.Andrianopoulos 1 CONTENTS I. Introduction Cell Types and Cell Shapes: a Diverse Array of Form... 3 II. Polarity... 3 A. Cytoskeleton...
JBC Papers in Press. Published on August 13, 2018 as Manuscript RA
 JBC Papers in Press. Published on August 13, 2018 as Manuscript RA118.003290 The latest version is at http://www.jbc.org/cgi/doi/10.1074/jbc.ra118.003290 Bond swapping from a charge cloud allows flexible
Lecture 6 - Intracellular compartments and transport I
 01.26.11 Lecture 6 - Intracellular compartments and transport I Intracellular transport and compartments 1. Protein sorting: How proteins get to their appropriate destinations within the cell 2. Vesicular
Unit 2: Cells Guided Reading Questions (60 pts total)
") Name: AP Biology Biology, Campbell and Reece, 7th Edition Adapted from chapter reading guides originally created by Lynn Miriello Chapter 6 A Tour of the Cell Unit 2: Cells Guided Reading Questions (60
Name: AP Biology Biology, Campbell and Reece, 7th Edition Adapted from chapter reading guides originally created by Lynn Miriello Chapter 6 A Tour of the Cell Unit 2: Cells Guided Reading Questions (60
Visual pigments. Neuroscience, Biochemistry Dr. Mamoun Ahram Third year, 2015
 Visual pigments Neuroscience, Biochemistry Dr. Mamoun Ahram Third year, 2015 References Photoreceptors and visual pigments Webvision: The Organization of the Retina and Visual System (http://www.ncbi.nlm.nih.gov/books/nbk11522/#a127)
16 The Cell Cycle. Chapter Outline The Eukaryotic Cell Cycle Regulators of Cell Cycle Progression The Events of M Phase Meiosis and Fertilization
 The Cell Cycle 16 The Cell Cycle Chapter Outline The Eukaryotic Cell Cycle Regulators of Cell Cycle Progression The Events of M Phase Meiosis and Fertilization Introduction Self-reproduction is perhaps
BIOH111. o Cell Biology Module o Tissue Module o Integumentary system o Skeletal system o Muscle system o Nervous system o Endocrine system
 BIOH111 o Cell Biology Module o Tissue Module o Integumentary system o Skeletal system o Muscle system o Nervous system o Endocrine system Endeavour College of Natural Health endeavour.edu.au 1 Textbook
RhoGAP assay kit (Cat. # BK105)
") RhoGAP assay kit (Cat. # BK105) The Ras superfamily of small GTPases (such as Ras, Rho, Rab, Arf and Ran proteins) serve as binary switches cycling between a GDP-bound OFF state and a GTP-bound ON state,
RhoGAP assay kit (Cat. # BK105) The Ras superfamily of small GTPases (such as Ras, Rho, Rab, Arf and Ran proteins) serve as binary switches cycling between a GDP-bound OFF state and a GTP-bound ON state,
Gene Control Mechanisms at Transcription and Translation Levels
 Gene Control Mechanisms at Transcription and Translation Levels Dr. M. Vijayalakshmi School of Chemical and Biotechnology SASTRA University Joint Initiative of IITs and IISc Funded by MHRD Page 1 of 9
Lipniacki 2004 Ground Truth
 Abstract Lipniacki 2004 Ground Truth The two-feedback-loop regulatory module of nuclear factor kb (NF-kB) signaling pathway is modeled by means of ordinary differential equations. signaling pathway: https://en.wikipedia.org/wiki/signaling_pathway
Cytokines regulate interactions between cells of the hemapoietic system
 Cytokines regulate interactions between cells of the hemapoietic system Some well-known cytokines: Erythropoietin (Epo) G-CSF Thrombopoietin IL-2 INF thrombopoietin Abbas et al. Cellular & Molecular Immunology
of the Guanine Nucleotide Exchange Factor FARP2
 Structure, Volume 21 Supplemental Information Structural Basis for Autoinhibition of the Guanine Nucleotide Exchange Factor FARP2 Xiaojing He, Yi-Chun Kuo, Tyler J. Rosche, and Xuewu Zhang Inventory of
7.013 Problem Set
 7.013 Problem Set 5-2013 Question 1 During a summer hike you suddenly spot a huge grizzly bear. This emergency situation triggers a fight or flight response through a signaling pathway as shown below.
Chemical aspects of the cell. Shape and structure of the cell
 Chemical aspects of the cell Shape and structure of the cell Cellular composition https://www.studyblue.com/ 2 Cellular composition Set of videos with basic information: Cell characteristics: https://www.youtube.com/watch?v=urujd5nexc8
ADAM FAMILY. ephrin A INTERAZIONE. Eph ADESIONE? PROTEOLISI ENDOCITOSI B A RISULTATO REPULSIONE. reverse. forward
 ADAM FAMILY - a family of membrane-anchored metalloproteases that are known as A Disintegrin And Metalloprotease proteins and are key components in protein ectodomain shedding Eph A INTERAZIONE B ephrin
SIGNALLING TO AND FROM TIGHT JUNCTIONS
 SIGNALLING TO AND FROM TIGHT JUNCTIONS Karl Matter and Maria S. Balda Tight junctions have long been regarded as simple barriers that separate compartments of different compositions, but recent research
Chapter 6- An Introduction to Metabolism*
 Chapter 6- An Introduction to Metabolism* *Lecture notes are to be used as a study guide only and do not represent the comprehensive information you will need to know for the exams. The Energy of Life
Lecture 3 13/11/2018
 Lecture 3 13/11/2018 1 Plasma membrane ALL cells have a cell membrane made of proteins and lipids. protein channel Cell Membrane Layer 1 Layer 2 lipid bilayer protein pump Lipid bilayer allows water, carbon
COMPUTER SIMULATION OF DIFFERENTIAL KINETICS OF MAPK ACTIVATION UPON EGF RECEPTOR OVEREXPRESSION
 COMPUTER SIMULATION OF DIFFERENTIAL KINETICS OF MAPK ACTIVATION UPON EGF RECEPTOR OVEREXPRESSION I. Aksan 1, M. Sen 2, M. K. Araz 3, and M. L. Kurnaz 3 1 School of Biological Sciences, University of Manchester,
MAP Kinase Pathways in the Yeast Saccharomyces cerevisiae
 MICROBIOLOGY AND MOLECULAR BIOLOGY REVIEWS, Dec. 1998, p. 1264 1300 Vol. 62, No. 4 1092-2172/98/$04.00 0 Copyright 1998, American Society for Microbiology. All Rights Reserved. MAP Kinase Pathways in the
Graduate Institute t of fanatomy and Cell Biology
 Cell Adhesion 黃敏銓 mchuang@ntu.edu.tw Graduate Institute t of fanatomy and Cell Biology 1 Cell-Cell Adhesion and Cell-Matrix Adhesion actin filaments adhesion belt (cadherins) cadherin Ig CAMs integrin
Oligomerization of DH Domain Is Essential for Dbl-Induced Transformation
 MOLECULAR AND CELLULAR BIOLOGY, Jan. 2001, p. 425 437 Vol. 21, No. 2 0270-7306/01/$04.00 0 DOI: 10.1128/MCB.21.2.425 437.2001 Copyright 2001, American Society for Microbiology. All Rights Reserved. Oligomerization
The neuron as a secretory cell
 The neuron as a secretory cell EXOCYTOSIS ENDOCYTOSIS The secretory pathway. Transport and sorting of proteins in the secretory pathway occur as they pass through the Golgi complex before reaching the
GO ID GO term Number of members GO: translation 225 GO: nucleosome 50 GO: calcium ion binding 76 GO: structural
 GO ID GO term Number of members GO:0006412 translation 225 GO:0000786 nucleosome 50 GO:0005509 calcium ion binding 76 GO:0003735 structural constituent of ribosome 170 GO:0019861 flagellum 23 GO:0005840
Cellular Neuroanatomy I The Prototypical Neuron: Soma. Reading: BCP Chapter 2
 Cellular Neuroanatomy I The Prototypical Neuron: Soma Reading: BCP Chapter 2 Functional Unit of the Nervous System The functional unit of the nervous system is the neuron. Neurons are cells specialized
The cellular events that precede myelination in the
 JCB: ARTICLE ErbB2 directly activates the exchange factor Dock7 to promote Schwann cell migration Junji Yamauchi, 1 Yuki Miyamoto, 1 Jonah R. Chan, 2 and Akito Tanoue 1 1 Department of Pharmacology, National
RANK. Alternative names. Discovery. Structure. William J. Boyle* SUMMARY BACKGROUND
 RANK William J. Boyle* Department of Cell Biology, Amgen, Inc., One Amgen Center Drive, Thousand Oaks, CA 91320-1799, USA * corresponding author tel: 805-447-4304, fax: 805-447-1982, e-mail: bboyle@amgen.com
Cell Adhesion and Signaling
 Cell Adhesion and Signaling mchuang@ntu.edu.tw Institute of Anatomy and Cell Biology 1 Transactivation NATURE REVIEWS CANCER VOLUME 7 FEBRUARY 2007 85 2 Functions of Cell Adhesion cell cycle proliferation
DISCOVERIES OF MACHINERY REGULATING VESICLE TRAFFIC, A MAJOR TRANSPORT SYSTEM IN OUR CELLS. Scientific Background on the Nobel Prize in Medicine 2013
 DISCOVERIES OF MACHINERY REGULATING VESICLE TRAFFIC, A MAJOR TRANSPORT SYSTEM IN OUR CELLS Scientific Background on the Nobel Prize in Medicine 2013 Daniela Scalet 6/12/2013 The Nobel Prize in Medicine
Introduction. Gene expression is the combined process of :
 1 To know and explain: Regulation of Bacterial Gene Expression Constitutive ( house keeping) vs. Controllable genes OPERON structure and its role in gene regulation Regulation of Eukaryotic Gene Expression
Neurite formation & neuronal polarization
 Neurite formation & neuronal polarization Paul Letourneau letou001@umn.edu Chapter 16; The Cytoskeleton; Molecular Biology of the Cell, Alberts et al. 1 An immature neuron in cell culture first sprouts
CL T123 PKA? Possible Cx26deaf mutation: T123N 2,3 EL2 T177 Intracellular kinases or ecto-kinases 2 EL2/TM4 border
 Name AA MW (Da) Cx26 =GJB2 Cx31 =GJB3 BIP Region P-site Modifying enzyme 226 26,215 9.11 NT D2, T5 or S8 1 # Functional consequences Deafness mutation at S8 1 CL T123 PKA Possible Cx26deaf mutation: T123N
Newly made RNA is called primary transcript and is modified in three ways before leaving the nucleus:
 m Eukaryotic mrna processing Newly made RNA is called primary transcript and is modified in three ways before leaving the nucleus: Cap structure a modified guanine base is added to the 5 end. Poly-A tail
Massachusetts Institute of Technology Harvard Medical School Brigham and Women s Hospital VA Boston Healthcare System 2.79J/3.96J/BE.
 Massachusetts Institute of Technology Harvard Medical School Brigham and Women s Hospital VA Boston Healthcare System 2.79J/3.96J/BE.441/HST522J INTEGRINS I.V. Yannas, Ph.D. and M. Spector, Ph.D. Regulator
1. Ras-Interactors from the RASOMICS database
 Transformation by ras oncogenes induces the deregulation of intracellular signalling cascades that are critical elements in cell growth control. Ras genes code for small GTPases that act as GDP/ GTP-regulated
STRUCTURE AND FUNCTION OF HETEROTRIMERIC G PROTEIN-REGULATED RHO GUANINE NUCLEOTIDE EXCHANGE FACTORS
 Molecular Pharmacology This article has Fast not been Forward. copyedited Published and formatted. on The October final version 30, may 2009 differ as from doi:10.1124/mol.109.061234 this version. STRUCTURE
Theoretical Computer Science
 Theoretical Computer Science 1 (9) 3166 3185 Contents lists available at ScienceDirect Theoretical Computer Science journal homepage: www.elsevier.com/locate/tcs A process model of Rho GTP-binding proteins
Identification of Functional Amino Acids in the G Protein Alpha-Subunit
 The University of Maine DigitalCommons@UMaine University of Maine Office of Research and Sponsored Programs: Grant Reports Special Collections 7-31-2001 Identification of Functional Amino Acids in the
Components of a functional cell. Boundary-membrane Cytoplasm: Cytosol (soluble components) & particulates DNA-information Ribosomes-protein synthesis
 & particulates DNA-information Ribosomes-protein synthesis") Cell (Outline) - Components of a functional cell - Major Events in the History of Earth: abiotic and biotic phases; anaerobic and aerobic atmosphere - Prokaryotic cells impact on the biosphere - Origin
Cell (Outline) - Components of a functional cell - Major Events in the History of Earth: abiotic and biotic phases; anaerobic and aerobic atmosphere - Prokaryotic cells impact on the biosphere - Origin
1. Introduction. 1. Introduction. 1.1 Signal transduction
 1. Introduction 1.1 Signal transduction During the evolution of multicellular organisms, highly complex and integrative communication networks have evolved to coordinate growth, differentiation and metabolism
Cell Death & Trophic Factors II. Steven McLoon Department of Neuroscience University of Minnesota
 Cell Death & Trophic Factors II Steven McLoon Department of Neuroscience University of Minnesota 1 Remember? Neurotrophins are cell survival factors that neurons get from their target cells! There is a
Biological Process Term Enrichment
 Biological Process Term Enrichment cellular protein localization cellular macromolecule localization intracellular protein transport intracellular transport generation of precursor metabolites and energy
Co-ordination occurs in multiple layers Intracellular regulation: self-regulation Intercellular regulation: coordinated cell signalling e.g.
 Gene Expression- Overview Differentiating cells Achieved through changes in gene expression All cells contain the same whole genome A typical differentiated cell only expresses ~50% of its total gene Overview
REVIEW ARTICLE The extended protein kinase C superfamily
 Biochem. J. (1998) 332, 281 292 (Printed in Great Britain) 281 REVIEW ARTICLE The extended protein kinase C superfamily Harry MELLOR 1 and Peter J. PARKER 2 *Protein Phosphorylation Laboratory, Imperial
Receptors and Ion Channels
 Receptors and Ion Channels Laurie Kellaway Senior Lecturer Department of Human Biology Laurie@curie.uct.ac.za Tel. +27 +21 4066 271 What are the two types of Neurotransmitter receptors Ionotropic receptors
Cell (Learning Objectives)
") Cell (Learning Objectives) 1. Understand & describe the basic components necessary for a functional cell. 2. Review the order of appearance of cells on earth and explain the endosymbiotic theory. 3. Compare
Cell (Learning Objectives) 1. Understand & describe the basic components necessary for a functional cell. 2. Review the order of appearance of cells on earth and explain the endosymbiotic theory. 3. Compare
BME Engineering Molecular Cell Biology. Review: Basics of the Diffusion Theory. The Cytoskeleton (I)
") BME 42-620 Engineering Molecular Cell Biology Lecture 08: Review: Basics of the Diffusion Theory The Cytoskeleton (I) BME42-620 Lecture 08, September 22, 2011 1 Outline Background: FRAP & SPT Review: microscopic
BME 42-620 Engineering Molecular Cell Biology Lecture 08: Review: Basics of the Diffusion Theory The Cytoskeleton (I) BME42-620 Lecture 08, September 22, 2011 1 Outline Background: FRAP & SPT Review: microscopic
Neurite formation & neuronal polarization. The cytoskeletal components of neurons have characteristic distributions and associations
 Mechanisms of neuronal migration & Neurite formation & neuronal polarization Paul Letourneau letou001@umn.edu Chapter 16; The Cytoskeleton; Molecular Biology of the Cell, Alberts et al. 1 The cytoskeletal
References on Kinetics and Mechanisms
 References on Kinetics and Mechanisms Excellent reference for all aspects of enzyme kinetics including important elements of Metabolic Control Analysis of relevance to systems analysis of enzyme function
Bio 127 Section I Introduction to Developmental Biology. Cell Cell Communication in Development. Developmental Activities Coordinated in this Way
 Bio 127 Section I Introduction to Developmental Biology Cell Cell Communication in Development Gilbert 9e Chapter 3 It has to be EXTREMELY well coordinated for the single celled fertilized ovum to develop
Transport between cytosol and nucleus
 of 60 3 Gated trans Lectures 9-15 MBLG 2071 The n GATED TRANSPORT transport between cytoplasm and nucleus (bidirectional) controlled by the nuclear pore complex active transport for macro molecules e.g.
A Mathematical Model for Neutrophil Gradient Sensing and Polarization
 A Mathematical Model for Neutrophil Gradient Sensing and Polarization Matthew Onsum 1, Christopher V. Rao 2* 1 AstraZeneca R&D Boston, Waltham, Massachusetts, United States of America, 2 Department of
Chapter 16. Cellular Movement: Motility and Contractility. Lectures by Kathleen Fitzpatrick Simon Fraser University Pearson Education, Inc.
 Chapter 16 Cellular Movement: Motility and Contractility Lectures by Kathleen Fitzpatrick Simon Fraser University Two eukaryotic motility systems 1. Interactions between motor proteins and microtubules
Signal transduction by Cell-Cell and Cell-Matrix contacts
 Signal transduction by Cell-Cell and Cell-Matrix contacts - Integrins as central adhesion receptors - - Focal Adhesion Kinase (FAK) as a central signal molecule - Structure of Cell/Cell and Cell/Matrix