Development of the Wing Pigmentation Pattern in Lepidoptera. Neil Toussaint
|
|
|
- Jonas Campbell
- 5 years ago
- Views:
Transcription

1
2 Development of the Wing Pigmentation Pattern in Lepidoptera Neil Toussaint PhD University W Edinburgh 1987
3 Thanks are due to Viv Brown and Lesley Poulton for undertaking the painfull task of proof reading without openly grimacing Jane Mee for background hubub Mary Bownes and Mike Gaze for providing versions 1 cautery apparatus and 2 respectively of the Brian Goodwin for assistance with translation of Wilnecker (1980) Prof. Cotter for providing a healthy stock of the Ephestia b" mutant Paul Brakefield for enthusiasm, lab. space in University College Cardiff and manufacturing genuinely remarkable quantities of the lepidopterists answer to Drosophila Vernon French for supplying seemingly endless quantities of inspiration, performing the onerous duty of providing timely encouragement and enthusiasm with relative grace and for maintaining an air of prevailing optimism throughout, which occasionally verged on the convincing.
4 ABSTRACT The wing pigmentation pattern of Lepidoptera is constructed from a mosaic of differently coloured scales hence, scale cells in particular positions must reliably lay down specific pigments. The study of the development of the pigmentation pattern of the wing has concentrated largely on two common types of pattern elements, transverse bands and eyespots. This thesis contains experimental work on both systems, using Ephestia kuhniella and Bicyclus safitza. The pattern is laid down early in the pupal stage although the pigments are synthesised and deposited later, when the scales have formed. The technique used to investigate the formation of the pattern is microcautery performed at different stages and positions on the pupal wing. Cautery of the Ephestia wing early in pupal development (1-48h post-pupation) results in alterations to the pattern of transverse bands, the nature of which depends on the time of the operation. The nature and frequency of pattern modifications following early cautery (1-31h) depended on the site of the operation. Cautery marginal to the location of the bands had no effect on the pattern. Medially located operations resulted in the formation of ectopic rings of band-type scales. If placed adjacent to either band, a medial deflection of the band nearest the lesion resulted so as to exclude the lesion from the central field. Cautery performed between 31-48h resulted in the medial displacement of both transverse bands and this effect was independent of the location of the operation. Contrary to the assumptions made by previous workers, it was demonstrated that the extent to which the bands were displaced was not related to the age at cautery. Cautery of Bicyclus safitza pupae early in development (1-24h at 27 C) results in pattern modifications depending on the site of the operation and the age. Cautery of the centre of the prospective eyespot at 1-6h causes an increase in the area of the eyespot, at 12-18h there is no effect and at 24h the eyespot is reduced. Early cautery (1-18h) outside the eyespot can result in the formation of supernumerary, ectopic eyespots, at a frequency which depends on the proximal-distal position of the operation. Proximal cautery rarely results in the development of supernumerary ocelli around the location of the lesion, while distal cautery results in ectopic ocelli more frequently which are larger and their pattern more complete. The experimental results are discussed in terms of a currently popular model (Nijhout, H.F. (1985) Adv. Insect Physio/ ) in which the centre of the prospective eyespot (the locus) acts as a source of morphogen to which surrounding scale cells respond by depositing particular pigments, depending on the local concentration. The formation of bands could result from the activity of a number of adjacent foci. Many of the present results are incompatible with this model and an alternative is suggested in which the focus acts as a sink reducing the level of morphogen which is produced by all wing epidermal cells. 2
5 CHAPTER 1
6 INTRODUCTION The emergence of an organized pattern of different cell types from a single, specialized cell, the zygote, is the outcome of two separate developmental processes called pattern formation and differentiation. Pattern formation is concerned with instructing cells as to the particular developmental pathway they should follow (i.e. the specification of the fate of cells) and differentiation is the process whereby these instructions are expressed morphologically by the cells. It is implicit that pattern formation precedes differentiation. Since cells within a developing system form structures appropriate to their location, they must be informed about their relative position. In addition, these structures are appropriate to the age of the animal, for example, in an holometabolous insect such as Drosophila a series of larval instars precede metamorphosis to the adult. The morphology of these two stages of the life cycle is dramatically different. The temporal and spatial organization of developmental events are fundamental facets of pattern formation. The study of pattern formation is concerned with identifying the mechanism(s) by which cells acquire information about their location and the way in which this information is interpreted to specify a fate appropriate to that position. The techniques usually employed are to perturb development through surgical operations or by creating mutants and, from the nature of the pattern alterations, attempt to understand the mechanism by which they form. The formation of complex patterns is a continuous process through development which occurs by the gradual elaboration of existing structures. This study is concerned with the» development of the colour pattern of lepidopteran wings. It occurs late in development after, the completion of many other events. I shall begin by describing the development of structures upon which the formation of the pigment pattern depends and the mechanisms by which it is thought that these structures are formed. I shall then concentrate in detail upon the development of the lepidopteran wing and its pigment pattern and consider how this pattern is specified. Much of what follows describes the early developmental events in Drosophila because it has been so widely studied. This is justified as comparable work on other insect species has usually produced comparable results; examples from other insect species will be discussed where available. The development of the insect embryo begins with the formation of the germ anlage, a thickened region of cells on the ventral side of the egg (fig. 1.1). Which regions of the early Drosophila embryo give rise to particular larval and adult
7 germ anlage syncitial blastoderm nuclei pole plasm cellular blastoderm
8 Fig. 1.1 Development of a generalized insect embryo, (a) ventral view of early egg, a cross sectional view to show the formation of structures in the dorsal-ventral axis is shown also The egg consists of a large quantity of yolk in the central region, cytoplasm around the periphery which appears granular at the posterior (P) end (the pole plasm). Nuclei divide in the central region of the egg without the formation of cells, (b) Nuclear division continues in the absence of cellularization resulting in the formation of a syncitium. Nuclei populate the periphery of the egg to form the acellular blastoderm stage. Nuclei migrating into the posterior region of the egg which contains the pole plasm become cellularized by the infolding of the egg membrane to form characteristic pole cells. These cells are round in shape and their cytoplasm granular. Shortly after the formation of the pole cells the remaining nuclei become cellularized to form the cellular blastoderm. The embryo, and subsequently larva and adult, forms from those cells occupying the ventral region of the egg. The cells in this region appear thickened in cross section and this part of the blastoderm is referred to as the germ anlage. The region of the embryo destined to form mesodermal and ectodermal structures can be identified experimentally at this stage and depends upon the position of the cells in the circumferential axis. The cells occupying the more dorsal part of the germ anlage (stippled) form the ectoderm and cells in the medial position the mesoderm (solid shaded region). The germ anlage becomes segmented in the anterior-posterior axis (d). These segments form characteristic cuticular patterns and appendages depending upon their position along the anterior-posterior axis of the egg. Cells which occupy anterior (A) positions will form the head (H) or mouthparts (M). Thoracic (T) and anterior abdominal structures form from cells in MJorfJ the medial region of the egg and posterior abdominal embryonic/structures from cells which occupy the most posterior part of the germ anlage. At this stage the presumptive mesoderm has invagmated (gastrulation) and the ectoderm extends dorsally to enclose the yolk (dorsal closure). From Anderson (1972). 6
9 structures can be determined by removing or killing small numbers of blastoderm cells. This results in local defficiencies in the pattern of larval and adult structures which form suggesting that the cells which were removed normally give rise to the missing structures. By ablating small groups of blastoderm cells with a laser microbeam Lohs-Schardin et al (1979) constructed a defect map of the fate of blastoderm cells (fig. 1.2a). This picture has recently been confirmed by the injection of a small quantity of horseradish peroxidase (HRP) into the peripheral part of the late syncitial blastoderm (Technau & Campos-Ortega, 1985). On cellularization approximately 1-8 cells contained HRP as did all their daughters in subsequent cell divisions. HRP containing cells can be detected in histological preparations and hence the larval structures which a particular group of blastoderm cells gives rise to can be determined (fig. 1.2b). The mechanism by which blastoderm cells are informed as to their relative position in the dorsal-ventral axis, to form the ectoderm and mesoderm, and in the anterior-posterior axis, to form the segmental pattern, has been the subject of considerable investigation. The means whereby cells are informed of their location in the dorsal-ventral axis has been studied by examining mutants which alter the pattern of structures in this axis. These mutants are maternal-effect mutants, that is the genotype of the mother is responsible for the phenotype and that of the sperm or zygote is irrelevant (Nusslein-Volhard, 1979). The phenotype of the "dorsal" class of mutants is characterized by the absence of ventral structures and the development of dorsal ones in their place. Ablation of blastoderm cells in ventral positions results in omissions of particular pattern elements and shows that the cells which normally would make the ventral structures do not die but make structures which are inappropriate for their position; their fate is changed from making ventral structures to dorsal ones (Anderson & Nusslein-Volhard, 1984b). This suggests that the product of the wild type gene is involved with the specification of pattern in the dorsal-ventral axis. Cytoplasm (Santamaria & Nusslein-Volhard, 1983) or maternal mrna (Anderson & Nusslein-Volhard, 1984a) taken from any location from cleavage stage wildtype embryos and injected into similarly staged mutant embryos partially rescues most of the mutants in the "dorsal" class, that is, ventral structures are formed where they otherwise would not (fig. 1.3). The partial restoration of the pattern is consistent with the normal polarity of the egg (fig. 1.3e) except in the case of injection of wild type cytoplasm into Toll embryos where the location of the rescued ventral structures is dependent upon the site of injection of the cytoplasm. Only in the region around the site of injection do blastoderm cells form ventral structures and this is true even if the site is on the presumptive dorsal surface (fig. 1.3f). 7
10 V D D V Fig. 1.2 The prospective fate of Drosophila blastoderm cells as deduced from (a) cell ablation and (b) histological techniques, (a) shows the location of blastoderm cells which give rise to adult pro-, meso- and metathoracic structures. A, anterior; P, posterior; D, dorsal; V, ventral. The points refer to f, foreleg; msl, mesothoracic leg. w. wing; mtl mesothoracic leg; h, haltere (Lohs-Schardin et al, 1979). (b) snows the location of presumptive larval structures, the left half of the blastoderm is shown only. Abbreviations are as follows: depi, dorsal epidermis; ms, mesoderm; vnr ventral neurogenic region; C1-C3. gnathal segments; thoracic segments; A1-AW. abdominal segments (after Hartenstein et al, 1985). 8
11 f
12 Fig. 1.3 Formation of dorsal-ventral pattern in wild type and in rescued mutant Drosophila embryos, (a) simplified schematic drawing of the normal fate map of the wild type embryo showing the presumptive mesoderm (stippled), ventral epidermis (thick black lines) and dorsal epidermis (thin dotted lines), (b) fate map of the "dorsal" class of mutant embryos in which only dorsal structures form, (c), (d) & (e) show the fate maps of "dorsal" mutant embryos which have received an injection of wild type cytoplasm. The injection site is shown by the solid dot. In the case of Toll embryos blastoderm cells developing from positions around the site of injection form ventral structures even if the site is on the presumptive dorsal surface (f). a. From Anderson & Nusslein-Volhard (1984). 10
13 These experiments suggest that the wild type products of the "dorsal" genes are located throughout the cytoplasm of the egg laid by the female and are responsible in some way for the specification of the normal pattern of structures in the circumferential axis. In their absence ventral structures fail to develop, when reintroduced by cytoplasmic or mrima injection ventral structures do form. In the case of Toll embryos the most ventral structures from closest to the site of injection and further away more dorsal ones develop. This suggests that in Toll embryos there is no notion of dorsal-ventral polarity and implicates this gene in particular as having a central role in the specification of pattern in the circumferential axis. These results can be explained by a class of model frequently invoked in the study of phenomena in pattern formation in which the concentration of a substance (generally referred to as a "morphogen", in this particular case possibly the Toll gene product) determines the nature of the structures to be formed by the cells. Cells develop in particular ways according to the local morphogen concentration which is therefore said to specify 'positional information' (Wolpert, 1969; 1971). At high concentrations of the product cells respond by forming ventral structures and at lower concentrations dorsal ones. In the absence of any Toll product (in mutant embryos) information to specify the development of ventral structures is absent and hence none develop (fig. 1.4-). If the normal concentration gradient of the Toll* product is altered by "grafting" wild type cytoplasm (containing Toll product) into a Toll egg then ventral structures can be formed, even by cells whose normal fate is to produce dorsal structures (fig. 1.3e). Attempts to understand how the longitudinal segment pattern of insects is formed has also involved' investigation of abnormal patterns produced by mutants. Mutations affecting segmentation have been classified into four basic types according to the way in which the pattern is altered (Nusslein-Volhard & Weischaus, 1980). 1)Coordinate 2)Gap 3)Pair Rule 4)Segment Polarity Coordinate mutants are of major interest in the study of the mechanisms by which the germ anlage becomes segmented as they are maternal effect mutations which cause global alterations of the embryonic pattern. The dorsal class of mutants 11
14 Toll dorsal / mesoderm ventral epidermis
15 Fig. 1.4 Model to explain the development of dorsal-ventral pattern elements in the Drosophila embryo, (a) shows the supposed profile of the concentration of the Toll* gene product with respect to the circumferential axis of the embryo. The gradient profile shown here is schematic for the sake of simplicity; diffusion would result in the establishment of a monotonic concentration gradient (e.g. Crick, 1970). It is assumed that just before the cells read the local morphogen concentration to establish their relative position on the dorsal-ventral axis that the concentration of Toll product is highest on the ventral midline and it declines monotonically with respect to distance from this axis, (b) shows the the response by blastoderm cells to specific ranges in concentration of Toll product which results in the formation of a normal pattern. For example, if cells experience a concentration between [A] and [B] then they develop into extreme ventral structures, at lower concentrations more dorsal structures develop, (c) shows the gradient profile of an egg produced by a Toll mother. The gene product of the mother is either inactive, ineffective or insufficient product is synthesized hence the concentration of Toll product is low throughout the circumferential axis of the blastoderm. Cells only experience low concentrations of Toll* product which corresponds to the formation of dorsal structures. Consequently an embryo lacking ventral structures with dorsal ones in its place forms, (d) & (e) show gradient profiles following injection of cytoplasm containing Toll gene product into cleavage stage embryos. Injection into ventral regions of the egg (d) introduces a point of high Toll* product concentration which diffuses to form a near-normal gradient profile and hence a normal pattern develops. In (o) the site of injection is the dorsal side of the egg. As in (d) the concentration of the product diffuses smoothes over the circumferential axis of the embryo to form a near normal gradient profile, although in this case effectively reversing the dorsal-ventral axis. Consequently ventral structures form from cells which occupy the dorsal side of the egg (see fig. 1.3). 13
16 discussed above belong within this category. Only a limited number of coordinate mutants affect the longitudinal segment pattern and one which has been particularly well studied is /7/c<?{yflte/(Nusslein-Volhard, 1977). The phenotype of this mutant is variable but typically consists of a mirror image duplication of the last three abdominal segments, in extreme cases the last five, with head, thorax and anterior abdomen absent (fig. 1.5). Usually the duplication is symmetrical although asymmetrical patterns are observed in which case the anterior forms fewer segments (fig. 1.5c). Other embryonic patterns formed by homozygous bicaudal females included normal abdomen and thorax with the absence of some or all of the head structures (fig. 1.5d). In all cases fewer segments formed than normal although the segments that did develop were of normal size. The model proposed to explain the formation of this pattern is similar to that for development in the dorsal-ventral axis. It is supposed that cells develop in particular ways in accordance with the local concentration of a different diffusable substance which is produced at the posterior end of the developing egg (fig. 1.6). Cells which experience high concentrations of this substance develop into posterior segments, and at low concentrations into anterior structures. The development of the bicaudal mutant phenotype can be explained in terms of this model by assuming that the anterior pole of the egg is in some way labelled as a posterior pole during oogenesis and acts a source of the chemical in addition to the posterior pole (Nusslein-Volhard, 1979; reviewed Meinhardt, 1982). The result will be the formation of a U-shaped gradient profile (fig. 1.6, curve b) and hence a duplication in the range of concentration values which direct the development of posterior pattern elements. This in turn will result in the development of an embryo with a double abdomen pattern and a reduced number of segments. It is also predicted, but not observed, that since the gradient profile is "flatter" the size of the segment primordia would be larger than normal. The formation of asymmetrical patterns in which only the most anterior segments develop abnormally can be explained by assuming that the production of the substance at the anterior end of the egg is not as effective as that at the posterior. Consequently the concentration of the substance at the anterior pole will be less than that at the posterior (fig. 1.6 curves b-d). Patterns of this type therefore represent intermediates between the normal wild type pattern and the extreme double abdomen ^/cat/ote/phenotypes (fig. 1.5c) Another maternal effect mutant which alters the anterior-posterior axis is dicephalic (Lohs-Schardin & Sander, 1975; Lohs-Schardin, 1982) The most
17
18 o h- < LU LJ O Fig Simple gradient model to explain the development of bicaudal phenotypes. Horizontal scale represents anterior-posterior axis of the egg. The normal gradient profile is shown by the thick black line and the dotted lines the threshold concentrations or the formation of head, thorax and abdominal structures; high concentrations are assumed to direct the development of abdominal structures. In bicaudal embryos the anterior pole is assumed also to produce the substance specifying the development of the segmental pattern and hence a U-shaped gradient profile results. The curves labelled (b)-(d) represent the various gradient profiles which would lead to the development of the various bicaudal phenotypes (see fig. 1.5). From Nusslein-Volhard (1979). 16
19 common pattern formed by homozygous mutant female flies consists of a mirror symmetrical double anterior consisting of head, thoracic and between 1-6 abdominal segments. In principle this phenotype can be explained in terms of the gradient model, however it is difficult to understand how, in a system lacking any source, the low central peak can form leading to the development of the middle abdominal structures. Similar double abdominal and dicephalic patterns have been produced in a number of other Diptera by a range of experimental techniques performed on early eggs including centrifugation (Yajima, 1960; Kalthoff, 1979), pricking the egg (Schmidt, et al, 1975, Kalthoff, 1979), treatment with RNAase and UV-irradiation (Kalthoff, 1979). The way in which these abnormal patterns develop has also been explained in terms of the gradient-type model (Meinhardt, 1982). The other classes of mutations which affect the anterior-posterior pattern of segments of Drosophila all share the characteristic that the overall pattern is reduced (Nusslein-Volhard & Weischaus, 1980). The general phenotype of the gap mutants is one of an embryo which lacks a number of adjacent segments. The identity and number of missing segments depend on the mutant and on the allele of a given mutant. For example, there are a number of different alleles of Kruppel. The most extreme pattern deletions observed (that is, "strong alleles") consist of an apparently normal head and extreme posterior abdomen (A6-A8). The intervening thoracic and anterior abdominal segments are absent and are replaced by an abnormally large patch of denticles in reversed orientation which apparently corresponds to the sixth abdominal segment (Weischaus et al, 1984). Examination of these embryos in detail suggests that there is little or no cell death indicating that the cells which normally give rise to the missing structures do not die but produce alternative structures, that is there is a change in cell fate. Weak Kruppel alleles produce patterns which lack fewer segments, as few as only T3 and A1. The cuticular pattern of the adult produced by homozygous Kruppel individuals cannot be scored directly because the homozygote dies before the larva hatches. However the adult cuticular pattern formed by Kruppel embryos can be scored indirectly using the technique of clonal analysis. Mitotic recombination occurs normally but is a rare event. However, the frequency with whic i these events occur can be increased dramatically by irradiation with X-rays. The irradiation of heterozygous Kruppel individuals therefore results in an increase in the frequency with which homozygous Kruppel and wild type cells are created in a Kruppel/+ individual. By associating the Kruppel mutant with another which marks the adult cuticle, such as straw, the daughters produced by a recombinant Kruppel/Kruppel 17
20 cell can be observed directly. Kruppel clones made during larval development produce normal structures however by injecting Kruppel embryos into the abdomen of adult females, allowing growth and reinjecting the implants into larval hosts for metamorphosis, the adult structures made by cells homozygous for Kruppel from fertilization could be determined. Differentiation was normal, however dorsal thoracic structures were missing, ventral thoracic structures formed very rarely and an excessive number of head structures developed suggesting that the adult pattern produced by Kr 'ppel individuals corresponds directly to that of the larva (Weischaus et at, 1984). Cytoplasmic injection experiments similar to those performed on the class of "dorsal" mutations result in partial rescue of Kruppel embryos. Rescue of strong Kruppel alleles is observed only when cytoplasm is taken from the central region of a wild type embryo and results in the development of patterns characteristic of weak Kruppel alleles. This suggests that the wild type Kruppel gene product is synthesized in the central region of the embryo only, and at only this location is it essential for the normal development of the cells. These conclusions were confirmed by examining the position at which mrna transcripts of the Kruppel gene are normally synthesized in developing wild type embryos (Preiss et al, 1985). Radioactively labelled complementary DNA sequences which contain the Kruppel gene will hybridize onto mrna from the Kruppel gene. By examining the pattern of hybridization using autoradiographs of sectioned Drosophila embryos at various ages the location of the Kruppel mrna transcripts, and the time during development that they are synthesized in vivo, can be determined (Knipple et al, 1985; reviewed Gehring, 1985). The transcripts are detectable only in 2-5h old embryos and are restricted to the region corresponding to segments T3-A1. Since the transcriptional activity of Kruppel is patterned and is synthesized at the blastoderm stage, this strongly suggests that Kruppel (and other gap mutants such as knirps & hunchback) cannot have a primary role in the establishment of the segmental pattern. It has been suggested that such genes are normally involved in the translation and/or maintenance of particular regions of the maternal gradient of positional information which is established during oogenesis through the activity of genes such as bicaudal'1' and dicephalic (Nusslein-Volhard & Weischaus, 1980; Preiss et al, 1985; Gehring, 1985). Pair rule and segment polarity mutants also result in a reduction in the overall pattern. They differ from the gap mutants in that there is a periodicity associated with the pattern elements absent. In the pair rule mutants approximately one segment's worth of pattern is missing from every other segment and the 18
21 remainder fuse together. In the segment polarity mutants about one half of one segment's worth of tissue is missing from every segment and is replaced by a duplicate of the remaining half-segment in reversed polarity (Nusslein-Volhard & Weischaus, 1980). Each mutant is associated with the periodic deletion of a particular set of structures, but the function of these genes cannot be to define subsets of a pattern which fit together like a jigsaw because the domains deleted by the genes overlap (reviewed Coutler & Weischaus, 1986). As with the gap mutants the pattern of transcription of the wild type gene seems to correspond to the region of missing tissue (for example see Ingham et al, 1985a), although this is not always so (Kilchherr et al, 1986). In cases which have been examined carefully the regions of transcriptional activity correspond to regions of subsequent cell death which results in the pattern of deletions and duplications (Ingham et al, 1985a). This suggests that the successful development of each region of the segmental pattern requires the activity of a particular subset of these segmentation genes (Howard & Ingham, 1986). Transcription of these genes occurs in a strictly patterned fashion corresponding to double-segment or segmental domains suggesting that their role in che process of segmentation is secondary to the action of the maternal effect genes and is involved with the further interpretation and elaboration of particular regions of the maternal gradient of positional information (discussed Meinhardt, 1986). Surgical operations on early embryos of a wide range of insect species confirm that interactions between the anterior and posterior poles of the egg are important for the specification of the segmental pattern. Isolating the poles of pre-blastoderm Drosophila embryos by ligation causes the dorsal and ventral surfaces of the egg membranes to appose and, if applied for sufficient time (5 minutes for Drosophila), results in their fusion (Schubiger et al, 1977). This operation results in the formation of a gap in the normal segment pattern, such that a number of segments are not represented on the germ band (fig. 1.7). The identity of the missing segments depends on the site of ligation (see fig. 1.7) and the number of missing segments upon the stage at which the operation was performed. A similar result has been observed following comparable experiments on a wide range of different insect species (reviewed extensively, Sander, 1976). There is no evidence of cell death or degeneration which would provide a trivial explanation for the formation of a gap in the pattern, rather the fewer segments which form are larger than normal suggesting that the fate of nuclei throughout the developing embryo has been altered (Newman & Schubiger, 1980). 19
22 oz II q V
23 Fig Effect of ligation on the development of the segment pattern and the gradient model interpretation of these results. The normal embryo (ai) consists of, from anterior (A) to posterior (P) the extraembryonic structures (X) and a sequence of segments; head (A), mouthparts (B), thorax (C), and abdomen (D 8* E). The effect of ligation (the location of which is shown by the horizontal line) in the region of the egg corresponding to the presumptive gnathos results in the formation of a gap in the pattern whereby the gnathal and thoracic segments fail to form (aii). A more anterior ligation (aiii) results in the formation of a headless embryo. One explanation for these results is that a substance (a morphogen) is synthesized at the posterior end of the egg and diffuses anteriorly in a monotonic fashion; the gradient profile which is established is illustrated schematically in (bi). The concentration experienced by blastoderm cells directs their development. Ligation is presumed to restrict the process of diffusion (bii). Consequently in the posterior fragment the overall level of the morphogen increases and that in the anterior decreases (arrows). A range of concentrations are no longer represented along the anterior posterior axis thereby leading to the formation of a gap in the sequence of segments. Since the gradient profile is "flatter"* fewer segments form and each is larger than normal. Redrawn from Sander (1975) and French (1984). 21
24 This 'gap phenomenon' (Sander, 1976) has been explained in terms of a gradient model similar to that used to account for the formation of abnormal patterns in maternal effect mutations. The effect of ligation on the gradient profile is assumed to be one of interference, effectively providing a barrier to diffusion (e.g. Sander, 1975). The result is that a particular range of concentrations are no longer represented along the anterior-posterior axis of the embryo (fig. 1.7f & g). Evidence for this effect of ligation comes from an elegant series of experiments by Schubiger et al (1977) in which communication between the isolated anterior and posterior fragments of a ligated egg was restored by puncturing the transverse membrane which separated them. This operation dramatically increased the frequency with which normal patterns developed suggesting that communication between the poles of the egg had been restored and as a consequence a normal gradient profile was re-established. The importance of the posterior pole of the egg was demonstrated by translocating the material from the posterior pole of the Eucelis egg anteriorly (Sander, 1975). Cells which were closest to the grafted material formed posterior segments and further away more anterior structures developed. These observations are consistent with the notion that this region of the egg represents the source of a diffusable substance which specifies positional identity. The late Drosophila blastoderm represents an important stage in development. The maternal genes have defined the primary embryonic axes and their interaction with zygotic "segmentation genes" results in the determination of the periodic segment pattern. The progeny of a single blastoderm cell marked by mitotic recombination at and after this stage give rise to genetically labelled structures characteristic of the segment in which the cell was marked (Weischaus & Gehring, 1976). After the blastoderm stage the development of the segment pattern no longer requires interactions between the anterior and posterior poles of the egg as demonstrated by the fact that no gap forms in the segment pattern following ligation (although in other insect species this event occurs slightly later in development). The adult structures of holometabolous insects form from a small number of "imaginal cells" located at particular positions within every embryonic and larval segment. These cells form the cuticular structures of the adult and, owing to the preponderance of markers, the imaginal cells which give rise to the thoracic structures have been extremely well studied, particularly the imaginal leg and wing discs. 22
25 In Drosophila the technique of clonal analysis has been used to determine the number of precursor cells which form the adult wing. The X-ray dose can be adjusted such that the probability that a single clone is derived from two independently marked cells is extremely low (e.g. Lawrence, 1973). Assuming that the homozygous mutant cell and all its progeny grow as well as its phenotypically wild type neighbours, the proportion of the adult structure occupied by the clone indicates the number of cells which were present at the time the cell was marked. For example, following irradiation at 3h, progeny from the marked cell occupy approximately 13% of the adult leg indicating that at the blastoderm stage the imaginal leg disc comprised about 1/13 x 100 = 8 cells (Weischaus & Gehring, 1976). It was also found that the clone produced by a cell marked at this stage contributed to structures located in either the anterior or the posterior part of the leg but never to both, indicating that this compartmental lineage restriction was established very early in development. Recent evidence has suggested that the subdivision of the germ anlage into a series of anterior and posterior compartments may represent the primary periodic pattern and that the development of the segmental units may be secondary (Martinez-Aries & Lawrence, 1985; Ingham et al, 1985b). There is a large body of evidence to suggest that the development of the elaborate adult pattern involves interactions between the imaginal cells. The imaginal discs grow throughout larval life. There are approximately 38 cells in the imaginal wing disc in the early first instar larva. Shortly before moulting they grow rapidly and steadily to form the wing which contains approximately 50,000 cells (Bryant & Levinson, 1985). The presumptive fate of the cells in the imaginal disc can be deduced by injecting parts of the mature disc into final instar larvae. The implant undergoes metamorphosis along with the larval host and the structures formed by the injected fragment can be identified. This indicates that the presumptive pattern of differentiation has already been determined and allows a fate map of the wing disc to be constructed. If disc fragments are allowed to grow prior to metamorphosis the importance of local cellular interactions upon the formation of the final pattern can be demonstrated. Experiments performed on Drosophila and a range of other insect species, particularly Lepidoptera, in which disc fragments are allowed to grow prior to metamorphosis by implantation into a larval host demonstrate that fragments can develop more structures than would be expected from their prospective fate 23
26 A.C&B Fig. 1.8 Fate of mature disc fragments developing in isolation and when combined, (a) shows a simplified fate map of the Drosophila wing disc. Each of the -fragments [A], (B) & [C] when isolated from the mature disc and injected into mature larvae form structures which the other fragments do not. On mixing genetically marked [A] and (C) fragments and allowing this "graft" to grow, structures characteristic of [3] which neither fragment [A) nor (C) would form on their own, develop. Data from Haynie & Bryant (1976); Bryant (1976).
27 (Pohley, 1957; Rahn, 1972; Stenzhorn, 1975; reviewed Bryant, 1979). The initial size of the implant determines which additional structures form; in general large implants regenerate a complete complement of structures whilst small fragments produce a duplicate copy of the original implant. In Drosophila the importance of intercellular interactions can be demonstrated by mixing disc fragments from two genetically marked donor animals and allowing this "graft" to grow in a wild type host. It was found that structures, which in isolation neither fragment would, form did develop (fig. 1.8). Both disc fragments contributed to the new structures and various recent studies show that suggests that regulation in discs is epimorphic and cell divisions are restricted to the site of confrontation (Dale & Bownes, 1980; 1985; O'Brochta & Bryant, 1987). These regulative interactions occur only when cells which normally occupy disparate positions within the discs are confronted and it is possible that interactions of this nature could be responsible for establishing and maintaining pattern in the developing wing (reviewed, Held & Bryant, 1984). The detailed pattern of cellular differentiation such as the location of particular bristles seems to be determined by a combination of local cellular interactions and long-range instructions. This can be illustrated with reference to the spacing pattern of bristles and hairs. One common arrangement of cuticular bristles and hairs is an even spacing pattern. Models to explain the formation of such patterns are usually based in terms of local cellular interactions. One possible mechanism involves the chance decision by an epidermal cell to develop into a bristle precursor, whereupon such a cell synthesizes a diffusable inhibitor thereby precluding its immediate neighbours from forming bristles (Wigglesworth, 1940). Often, however, bristles are evenly spaced in rows and although local inhibitive interactions can explain the development of evenly spaced bristles within a row, the means whereby a particular row of epidermal cells becomes competent to form bristles requires additional information (Held, 1979; Held & Pham, 1983). The scales of Lepidoptera are homologous to the bristles of other insect species (e.g. Lawrence, 1966; 1973). The work in this thesis concerns the formation of the pattern of pigmentation of scales on the wing. This pattern is set up fairly late in development (at around the time of pupation) and clearly therefore depends on the successful completion of all the previous developmental events leading to the specification of a particular region of the blastoderm to form the epidermis of the mesothorax, the subsequent development of a small part of this embryonic epidermis into the wing imaginal disc, the controlled growth of the disc throughout larval life and the formation of the patterns of veins and rows of specialized cells which form the scales (see chapter 2). The experimental work in chapters 3 & 4 is 25
28 concerned with the way in which scale cells are informed of their location on the wing blade and the means whereby they acquire and interpret information to control the synthesis and deposition of the appropriate pigments in their cuticle. 26
29 CHAPTER 2 27
30 Development of the Lepidopteran Wing In many holometabolous insects, the wing develops from an imaginal disc, which is composed of a population of cells set aside during early embryonic life (see chapter 1). In Lepidoptera, the disc divides during larval life and the presumptive wing structures, which are derived from the distal part of the disc, become characteristically folded (fig. 2.1a-c). In the final larval instar the presumptive dorsal and ventral surfaces of the adult wing become discernable by the fusion of the basement membranes of the epidermal cells at opposite sides of the disc (fig. 2.1). Shortly before pupation the animal enters the prepupal stage during which time it ceases feeding and becomes immobile. In the prepupal stage the wing disc is everted and comes to lie beneath the larval cuticle (fig. 2.1d). The dorsal surface of the forewing secretes the pupal cuticle that covers the meso- and underlying metathoracic wings which are held tightly against the body. Development of the Vein Pattern The formation of the pattern of venation begins in late larval life at the time at which the presumptive dorsal and ventral surfaces of the wing disc fuse. In some species (for example, Samia cynthia) regions of the apposed surface separate, thereby forming haemolymph-filled spaces called lacunae, into which trachae migrate (Kuntze, 1935) but in others (for example, Ephestia kuhniella) trachea! migration precedes, and seems to initiate, the formation of the lacunae (Kohler, 1932; see fig. 2.2). The pattern of lacunae and trachae which develop at this time are called the primary lacunal and tracheal systems respectively. On pupation, the trachae fill with air and become visible as the pupal vein pattern. The venation does not correspond directly to the lacunal pattern of the final instar larva; the diameter of 28
31 larval cuticle B. imaginal disc epidermis wing evaginated wing disc V Fig. 2.1 Development of the larval wing disc in Lepidoptera. (a) to (c) represent a series of cross sectional views of the mesothoracic imaginal wing disc of Samia cynthia at various stages of development. The distal part of the disc, destined to give rise to the adult wing, is shown cross hatched ([b]-[d]). The imaginal wing discs are invaginated sac-shaped structures located in the dorsal parts of the meso- and metathorax (a). The presumptive wing (the wing an/age Kohler, 1932) first appears as a thickened region of epidermis in the proximal part of the imaginal disc (b). The growth of this part of the disc is directed into the lumen of the imaginal disc (b & c). Towards the end of larval life, the wing anlage develops as a two layered structure thereby delimiting the presumptive dorsal and ventral surfaces of the wing (D & V respectively; (c)). Shortly before pupation (in the prepupal stage) the wing disc everts so that it comes to lie immediately beneath the larval cuticle (d). After Kuntze (1935). 29
32 Early development of the vein pattern of Samia cynthia. The figure shows a dorsal view of the imaginal wing disc of a final instar larva. The presumptive dorsal and ventral surfaces of the adult forewing are apposed in most regions of the disc (unshaded) although in some areas the layers are separated (stippled). The lacunae are labelled according to Nijhout (1985c). Trachae invade the lacunae from the proximal end of the wing disc. The pattern of lacunae, therefore, seems to Sc+m " ^^XCttxy&^tg marginal lacuna M3 Fig determine the tracheal pattern (Kuntze, 1935).
33 the marginal lacuna (see fig. 2.2) becomes dramatically reduced and effectively disappears. No pupal vein which corresponds to the marginal lacuna develops, hence the pupal vein pattern is abbreviated with respect to the lacunal pattern. The position of the marginal lacuna is, however, important in determining the final shape of the adult wing as, during the pupal period, cells occupying positions distal to it degenerate (Suffert, 1929). There is a second period of tracheal growth in the middle of the pupal period which establishes the secondary tracheal system which then gives rise to the adult vein pattern. The primary tracheal system is torn as the wing expands (on adult emergence). The adult vein pattern of Ephestia differs slightly from that of the pupa; a medial vein is not represented and some cross veins (oriented parallel to the anterior-posterior axis) develop de novo (reviewed Nijhout, 1985c). On the basis of the descriptive morphology of the adult it seems likely that vein pattern it is specified according to the pattern of lacunae established in the late larva. The even spacing pattern of the lacunae and veins is highly conserved even following experimental interference. For example, surgical operations performed on young imaginal wing discs of Ephestia occasionally results in a reduction in the number of lacunae formed; they are however evenly spaced (Rahn, 19^1; fig. 2.3a, b & c). A number of mutants have been described which alter the number of adult veins of Ptychopoda but they remain evenly spaced (Kuhn, 1971; see fig. 2.3d & e). The mechanism by which the characteristically branched, periodically spaced pattern of veins and lacunae is formed is unknown. The wings of adult Lepidoptera are covered with scales within which pigments which constitute the colour patterns are deposited. The mature scale consists of a 31
34 ro
35 Fig Effect of altering the number of lacunae (a, b & c) or veins (d & e) on the lacunal and vein patterns respectively, (a) shows the normal pattern of lacunae in the final instar larva of Ephestia. Following a variety of surgical operations the wing disc usually regenerates a normal pattern (b), however in some cases an incomplete lacunal pattern forms (c). Even when fewer lacunae than normal develop they are evenly spaced (Rahn, 19^). (d) shows the normal adult vein pattern of Ptychopoda. The mutant Va commonly results in the failure of some veins (X) to develop. The remaining veins do not form in their normal location but the pattern as a whole remains evenly spaced (e). From Kuhn (1971). 33
36 Fig. 2.4 Scanning electron micrograph of the forewing of Ephestia kuhniella at low (a) and high (b) magnification to show the scales in which pigment is deposited.
37 flattened extension of a single, modified epidermal cell (figs.?4 & 2.5). The scale cells of Ephestia form early in the pupal stage at which time they are morphologically similar to the epidermal cells. The scale mother cells or primary order scale stem cells become enlarged at about 40h post-pupation at 18 C (Kohler, 1932; Stossberg, 1938) and at 12-20h post-pupation at 25 C (Esser, 1961; see fig. 2.6a). Following enlargement these scale stem cells undergo two characteristic cell divisions. The first is oriented perpendicular to the surface of the wing (the spindle axis of the normal epidermal cell divisions lies parallel to the wing surface) and results in the formation of a large second order scale stem cell at the wing surface and an inner, smaller cell which degenerates (Stossberg, 1938; see fig. 2.6b & c). A second differentiative division, also unequal, follows approximately 12h later at 18 C and 3-6h later at 25 C, is in a plane of about to the wing surface and produces the socket forming cell towards the basement membrane and the larger scale forming cell beneath it (fig. 2.6e). A club shaped projection extends from the scale-forming cell in a distal direction with respect to the longitudinal axis of the wing and is surrounded by the socket forming cell which secretes a chitinous collar around the neck of the scale (figs. 2.6e & 2.7a). The scale cell forms a flattened lamina which grows considerably in length and width. Whan the scale reaches its final form, cuticle is secreted by the cell, the cytoplasm degenerates and air enters the scale through holes in the lamina (see figs. 2.8 & 2.9). The formation of scales as described above is similar in all lepidopteran species examined and follows a comparable sequence and timing (Suffert, 1937; Kohler 8* Feldotto, 1937; Lipp, 1957; Braendle, 1965, Nijhout, 1980b) and seems to be homologous with the development of hairs and bristles in other insects (Henke, 1953; Lawrence, 1966).
38 Fig. 2.5 Scanning electron micrograph of the hindwing of Ephestia at low (a) and high (b) magnifications to show the scales covering the wing.
39 Development of scale cells in the pupal wing of Ephestia. The wing consists of two epidermal cell layers fused along their basement membranes (see fig. 2 1c) The figure shows the development of the scales in one of these surfaces only. The first visible sign of scale cell development is the enlargement of cells which otherwise appear identical to their neighbouring epidermal cells {a}. These cells are polyploid primary order scale stem cells which through two unequal and differently oriented cell divisions (b - e) produce the scale cell and the socket cell d LO CO f f Fig. 2.6 (f). After Stossberg (1938), Esser (1961) and Kuhn (1975).
40
41 Fig. 2.7 Scanning electron micrograph of the dorsal surface of the forewing of Ephestia at low (a) and high (b) magnifications. The wing has been scraped with a paint brush to remove most of the scales. At the base of each scale the width of the lamina is small (a) and at that point is surrounded by the "collar" of a socket cell (b). The cuticle secreted by the socket cell is continuous with that which is produced by the epidermal cells which lie between adjacent sockets (see also fig. 2.6). 36
.")
42 Fig. 2.8 Ultra-structure of individual scales in Ephestia. The distal region of a white tipped scale, characteristic of the white bands, shown at increasing magnification (a - c). ~he cuticle secreted by the scale cell has holes in its surface (b & c).
43 Throughout the period of scale cell development, the intervening epidermal cells divide, resulting in an increase in the surface area of the wing. This increase is accommodated by a corrugation of the epithelium of the wing beneath the pupal cuticle (Braun, 1936; Nijhout 1980b). It is within the flattened lamina of the scale that the pigments which constitute the colour pattern are deposited. In Precis coenia it seems that only five different pigments are involved, all are melanins and within a particular scale only a single melanin species is deposited (Nijhout, 1980b). Microscopic examination of individual scales suggests that this may be true also of Bicyclus safitza (for example see fig ). In some species, however, it is clear that within some scales more than a single pigment is deposited. In Ephestia the scales which constitute the white transverse bands are black proximally and only their distal tips appear white (fig. 3.10). In some species, the white scales result not from deposition of white pigments but as a consequence of the fine physical structure of the scale which causes constructive interference of light reflected from its surfaces (reviewed Nijhout, 1985<). It is possible, therefore, that in Ephestia the scales are monochromatic but their detailed surface structure differs in particular (that is, proximal and distal) parts of the scale. This seems unlikely however since examination of the distal tips of white-tipped and black scales of the Ephestia forewing indicated that their detailed surface structure is identical (figs. 2.8 & 2.9) suggesting that the scales appear white because of the local deposition of a white pigment. Within the wing scales vary in colour, size and shape. The dorsal surface of the Ephestia forewing bears four different types of scale. There are long scales along the distal tip (fig. 2.4) and there are three different size classes on the surface (fig 2.7). Normally only the largest of these scales (the cover scales) are visible and only within cover scales is pigment deposited; the other types of scale appear transparent. There is only one type of scale found on the hindwing of Ephestia 37
44 Fig. 2.9 Ultra-structure of b.ack-pigmented scale of Ephestia. The distal tip of the scale is shown at successively higher magnification (a - c).
45 (see fig. 2.5). It is colourless and appears to have the same structure as those scales on the ventral surface of the forewing. In Bicyclus most of the wing is covered with a single type of scale although along the distal margin there are elongated hair-like scales (fig. 4.6). Henke & Pohley (1952) suggested, from the appearance of histological preparations of Ephestia pupal wings, that the size a scale attains is directly related to the ploidy of the scale cell. The arrangement of scales on the wing is not random. The scale cells are evenly distributed amongst the epidermal cells (figs. 2.6 & 2.7) and are often arranged in rows which run parallel to the anterior-posterior axis of the wing, in butterflies, for example Bicyclus safitza, the scales are normally very precisely aligned in parallel rows. In species in which the scales do not extensively overlap their arrangement can be observed directly (fig. 4.6; see also Nijhout, 1980b). In Precis there are two different size classes of scales which constitute the cofour pattern jwnd Iftey occur alternately along each row (Nijhout, 1980b). In Ephestia however the scales overlap and the point of origin of individual scales on the wing surface cannot be directly discerned (fig. 2.4). Their arrangement can be inferred from that of enlarged scale forming cells within the epidermis of the developing pupal wing (Esser, 1961; Braendle, 1965). Alternatively, since each scale is associated with a single socket, the collar of which protrudes from the surface of the cuticle, the arrangement of scales can be deduced from the pattern of sockets on an adult wing devoid of scales. In Ephestia the rows are not precisely aligned (fig. 2.10), but as in Precis, the different types of scales alternate in occurrence along the rows (fig. 2.7). The mechanism by which rows of epidermal cells are instructed to form scales is unknown. Nijhout (1980b) observed that during the development of Precis scales, enlarged scale mother cells were never observed in the interrow regions (which were populated exclusively with epidermal cells), suggesting that rows of scale mother cells differentiate from epidermal cells in situ, rather than becoming aligned by 38
46
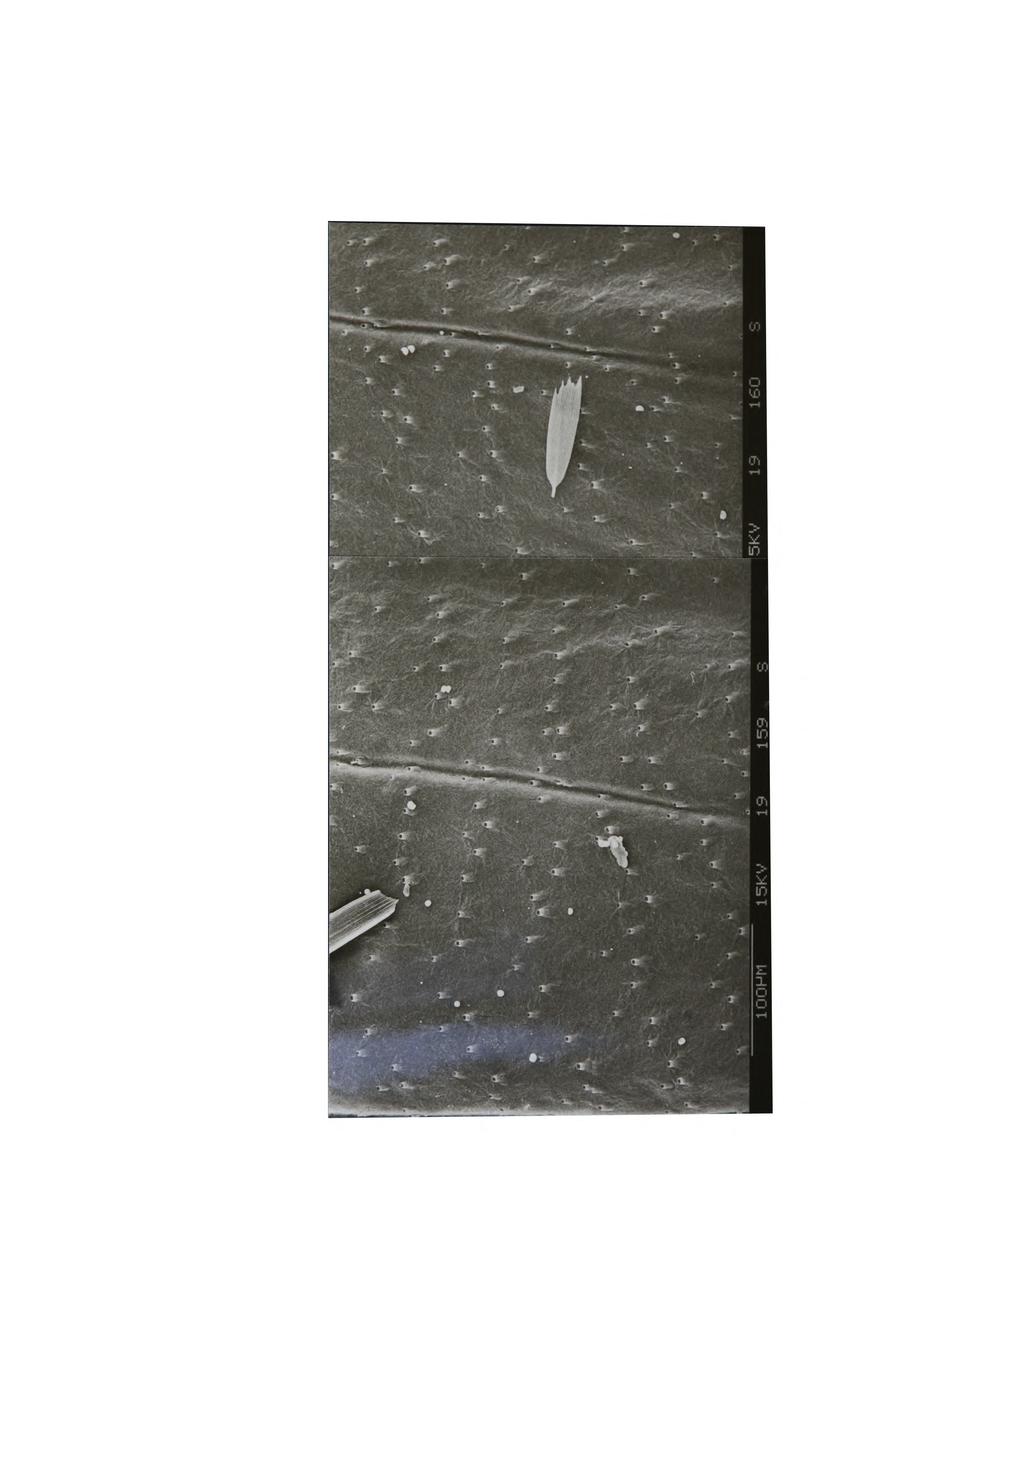
47 Fig Scanning electron micrograph of an adult forewing of Ephestia devoid of scales. Two veins are visible as creases in the cuticle running from distal (top of page) to proximal. Sockets are visible protruding from the surface of the cuticle. They are dispersed evenly throughout the wing and show a tendency to be in anterior (left) to posterior rows. 39
48 migrating into rows. However, in Manduca the initial spacing pattern of the scales in irregular and the regularly spaced rows are formed gradually during the early pupal stage by the rearrangement of presumptive scale cells (Nardi & Magee-Adams, 1986). The final colour pattern of Lepidoptera is constructed as a mosaic of pigmented scales and is, therefore, wholly dependent on the arrangement of the differently coloured scales on the wing. The aim of this work is to understand how this pattern is formed, that is to elucidate the means by which scales in particular positions are instructed to deposit one pigment and not another. The formation of two basic pattern elements are considered, firstly bands (presented in chapter 3) and eyespots (in chapter 4). 40
49 CHAPTER 41
 dependent pattern of black pigment over the wing veins and other markings located between the veins in Idea malabarica. (d) three large eyespots in Precis coenia.")
50 Fig.3.1 Types of patterns seen in the Lepidoptera as classified by IMijhout (1978). (a) large colour fields on the fore and hindwings of Catagramus sorama. (b) ripple pattern on Physcaeneura pione. (c) dependent pattern of black pigment over the wing veins and other markings located between the veins in Idea malabarica. (d) three large eyespots in Precis coenia. (e) two transverse bands on the forewing of Grammodes geomethca.
51 INTRODUCTION There are a number of attractive features of the lepidopteran wing as a system in which to study pattern formation. The Lepidoptera is a large, monophyletic group of insects in which the pigment pattern of the wings of most of the species is unique. The common phylogeny of the Lepidoptera suggests that the mechanism by which the pattern forms is common to the group, and one which can be modified in simple ways to form a variety of patterns (Nijhout, 1985c; Nijhout & Wray, 1986; Nijhout, 1986). Lepidopteran wing patterns have been classified into five basic types {Nijhout, 1978). Commonly the pigment pattern consists of a single colour, although a limited number of additional pigments are often distributed in large fields over the wing. The arrangement of these colour fields on the wing is usually unrelated to the pattern of venation or other structural features (fig. 3.1 a). Ripple patterns consist of irregular, rhythmical bands of pigment usually running perpendicular to the wing veins covering a large area of the wing (fig. 3.1b). Dependent patterns are those in which the pigment pattern is tightly correlated with some structural feature of the wing, often the wing veins. For example, in Physcaeneura pione the wing is white except for black scales in the immediate vicinity of, and some regions, between the wing veins (fig. 3.1c). The formation of dependent patterns has been explained by assuming that scales receive information about which pigment they should synthesize from cells located in the region of the structures on which the pigment pattern appears to be dependent '(e.g. Murray, 1981). Eyespots and bands are particularly common pattern elements in the Lepidoptera and are often 'superimposed' on a wing with a background ripple pattern or colour field. Eyespots consist of a series of concentric rings of different pigments and are almost always located at the mid-point between two adjacent wing veins. There can be from one to many eyespots on the wing and they are usually, but not always circular in shape (see chapter 4). When eyespots (or ocelli), are located
52 DS CSS Fig. 3.2 Hypothetical wing pattern from which the actual patterns of many Lepidoptera can be derived. WR, wing root, single band at the base of the wing. Absent in most species. BA, basal bands, a pair of bands in the proximal part of the wing. The sequence of colours from which these bands are constructed is symmetrical about the line drawn through their centre. CSS, central symmetry system, a set of (one or more) bands that run from the anterior to the posterior margins of the wing. The sequence of colours from medial to marginal is symmetrical about the midline of the CSS, but rarely is the shape of the bands symmetrical about this axis. The CSS is a common feature of many Lepidopteran wing patterns. In the centre of the CSS (the central field\ there is usually a discal spot (DS), a pigmented spot, stripe or eyespot. In the centre of each sector along the distal margin of the wing is an eyespot. These border ocelli (BO) are common but usually their shape is c, highly asymmetric. From Nijhout (1985). 43
53 in adjacent sectors (a sector is defined as the region enclosed by wing veins) the pigment rings fuse together (see below). Bands are typically orientated perpendicular to the wing veins and each may be restricted to a single sector or transect the entire wing. There may be more than one band on the wing and it/they may consist of a number of different colours. These basic types of pattern may occur together and often each pattern element is located in characteristic positions on the wing. This can be summarized by drawing a hypothetical wing which possesses all the pattern elements observed in their usual locations (fig. 3.2; Suffert, 1925; Schwanswistch, 1924). The actual wing pattern of many species of Lepidoptera can be derived from this composite "groundplan" by the selective deletion or exaggeration of the various pattern elements. The study of the formation of the pigment pattern of lepidopteran wings has concentrated on the development of the last two types of pattern; bands and eyespots. Banding and eyespot patterns are convenient systems to study because they exist in simple forms and are usually clearly defined. In principle, this allows relatively straightforward interpretation of experimental results. Thus understanding the way in which 'simple' patterns are formed is important as the principles learned can be applied to the way in which more complex systems develop. In this and the following chapter I shall examine the development of bands and eyespots separately and consider the mechanism by which each form. The technique of microcautery has been used to disrupt the pattern of both eyespots and bands. It is a useful technique since small numbers of cells in particular positions can be killed and, therefore, any region important for directing the development of the normal wing pattern can be identified. Two closely related species of Lepidoptera with banding patterns which have been studied are Ephestia kuhniella and Plodia interpunctella (Geometridae). Schematic drawings of the wing
54 patterns of each are shown in fig Kuhn & von Englehardt (1933) cauterised the pupal wing of wild type and a melanic mutant of Ephestia (b~) (fig. 3.3b) at various stages during pupal development. Provided the operation was performed between 0-70h after pupation (at 18 C) the banding pattern of the adult was altered, although the nature of the modifications depended upon the precise timing and location of the operation. Cautery early in development (6-36h post-pupation) resulted in a local, medial deflection of the transverse band nearest the site of the burn, the pattern of the other band was unaffected (fig. 3.4b & c). Operations located outside the central field had no effect on the banding pattern (fig. 3.4a). The same operation performed shortly after pupation in Plod/3 (Oh-16h post-pupation at 30 C: Wehrmaker, 1959; 0-35h at 18 C: Schwartz, 1962; Brandle, 1965; Wilnecker, 1980) produced comparable results (fig. 3.5). Since the pattern alterations are dependent on the location of cautery and occur in the region of the operation only, they are called 'local pattern modifications'. Following cautery later in pupal development (36h-70h post-pupation in Ephestia: Kuhn & von Englehardt, 1933; 16h-26h post-pupation for Plodia at 30 C: Wehrmaker, 1959; 30h-55h for Plodia at 19 C: Schwartz, 1962; Brandle, 1965; Wilnecker, 1980) the pattern of both bands is altered regardless of the site of the operation. Consequently alterations of this type are termed 'global pattern modifications'. The characteristic feature of global pattern.modifications is the reduction in the degree of separation between the proximal and distal bands as a result of the medial displacement of both transverse bands (fig. 3.6). Operations performed at or after 60h pupal development had no effect on the banding pattern. To explain the formation of the normal and locally modified banding patterns of Ephestia, Kuhn & von Englehardt proposed that a "determination wave", which originates from two sites on the anterior and posterior margins of the wing.
55 CtJ
56 Fig. 3.3 Pigment pattern of Ephestia kuhniella and Plod/a interpunctella. (a) shows pigment pattern of wild type Ephestia. The proximal and distal bands (P & D respectively) each consist of a white surrounded by two black bands. The pigmentation of the central, proximal and distal fields (see fig. 3.10b for nomenclature) is uniform grey. Within the central field there are three medial spots (Mi), one white and two black. At the distal margin of the wing, within the distal field, there are a series of black marginal spots (Ma). Redrawn from Kuhn & von Englehardt (1933). (b) pigment pattern of the melanic (b~) mutant of Ephestia which consists of two white transverse bands (stippled), one in a distal position, the other in the proximal part of the wing. The rest of the wing is covered with black scales. Redrawn from Kuhn 8* von Englehardt (1933). (c) pigment pattern of Plodia. There are two morphologically distinct types of scale located in particular regions of the wing The 'band scales' (located in the stippled region) are separated by areas covered with 'field scales' The band scales are clustered into groups called the proximal band (P), axial band (A) and the distal band (D). Redrawn from Schwartz (1962).
57 Fig. 3.4 Fffect of cautery performed shortly after pupation on the pigment pattern of the adult wing of Ephestia. The location of the burnt tissue following cautery is shown by the black spot, (a) normal pattern forms following cautery located outwith the central field. Cautery performed within the presumptive central field results in a local deflection of the pattern of the nearest transverse band (b) & (c). Data from Kuhn & von Englehardt (1933).
58 Fig. 3.5 Effect of cautery within the central field on the adult banding pattern of Plodia. Axial band is stippled, proximal and distal bands solid. The cross shows the location of the damaged tissue as a result of the operation performed at (a) 16-21h and (b)26-30h post-pupation. In (a) and (b) the proximal band is displaced medially with respect to the site of the lesion. Furthermore, in (b) the extent of the axial band (stippled) is reduced as compared to normal. From Schwartz (1962). 49
59 A B FJg. 3.6 Banding patterns of Ephestia and Plodia resulting from cautery performed late in pupal development. The proximal and distal bands of Ephestia (series A) are located in a more medial position than normal, although the degree of separation is variable. The location of the burnt tissue is shown by the solid shaded region. Redrawn from Kuhn & von Englehardt (1933). In Plodia (series B) a similar range of pattern alterations is observed. The site of cautery on the adult wing is shown by the X From Schwartz (1962) 50
60 spreads over the pupal wing early in development. Kuhn & von Englehardt gave no detailed explanation for the mechanism by which this wave was generated or propagated from cell to cell, or the effect of cautery on its progress. Wilnecker (1980) suggests that the nature of this determination wave is best considered in terms of switching of cell state from one alternative to another. For the sake of simplicity the formation of the normal pattern of the melanic form of Ephestia will be considered. The model assumes that the state of a cell at a particular time in development (committment) irreversibly specifies its eventual fate. Initially, all scale cells are assumed to be in the same state (state A), which directs cells, on committment, to deposit black pigment. At the anterior and posterior margins of the wing axis a small number of cells positioned midway along the proximal-distal axis switch state to B, which eventually leads to the synthesis and/or deposition of white pigment. After a period of time in the B state cells are able to trigger A neighbours to enter the B state, then B-cells revert irreversibly to the A state. The outcome of this switching of cell states, originating from the centre of the wing, will be a propagated wave of cells in the B state proceeding unidirectionally towards the proximal and distal ends of the pupal wing. The position of the white transverse bands on the adult wing is dependent on the extent of propagation of this wave at the time of committment (fig. 3.7a-d). To account for the development of local modifications to the pattern following cautery of the Ephestia wing, Kuhn & von Englehardt suggeste'd that the operation, which had been inflicted prior to wave generation, caused dead or unresponsive cells to lie in the path of the wave and locally block its propagation. Consequently, the wave was unable to extend beyond the cells around the site of cautery or to those in the lee of the cauterized tissue (figs. 3.4b & c and 3.7e). Operations more proximal or distal than the normal location of the proximal or distal bands respectively would not interfere with wave propagation and hence 51
61 Os] LO
62 Fig. 3.7 Model explaining the development of the normal and experimentally altered banding pattern of Ephestia. A propagatory wave emanates from two locations at the anterior and posterior margins of the pupal wing and travels (arrows) towards the proximal and distal margins of the wing (a)-(c). The final position location of this wave defines the position of the transverse white bands (d). For explanation of mechanism of propagation see text. The formation of local alterations to the pattern is explained by assuming that cauterized cells (X) are unable to ensure continued propagation of the wave hence, when located within the presumptive central field, locally interfere with the pattern of its propagation, (e) shows the extent of wave propagation at a series of different stages after pupation ([a] - [d] superimposed on one figure) and the effect of the cauterized cells on the progress of the wave. The final position of the wave (thick black lines) is altered in the region of the damaged tissue. Cautery outwith the central field will not interfere with propagation hence a normal banding pattern forms (f). 53
63 would not be expected to result in the development of an altered pattern (fig. 3.4a f). The banding pattern of Plodia is similarly modified following cautery shortly after pupation. Schwartz (1962) and Bra'ndle (1965) conclude that the formation of these pattern modifications can be explained in terms similar to those for Ephestia but they did not elaborate on the precise mechanism responsible. Plodia has an additional region of band scales when compared to Ephestia (fig. 3.3), the formation of which can be explained by assuming that cells, having switched from A->B->A, are able to continue to oscillate and hence to re-enter state B. In order that the wave proceeds unidirectionally from the medial to the proximal and distal margins of the wing it is essential to assume that A cells can be triggered to re-enter state B only after having spent a certain minimum time in the A state. Consequently A cells cannot be triggered to enter the B state by B cells in a more marginal position. In Plodia, cautery shortly after pupation results in comparable pattern modifications to those in Ephestia and can be explained if it is assumed that the operation has a similar effect on wave propagation. As with Ephestia, operations located outwith the normal domain of the proximal and distal bands do not affect wave propagation and therefore would be expected to have no effect on the pattern. The global pattern modifications of Ephestia and Plodia for.med in response to cautery later in pupal development (fig. 3.6) were explained by supposing that at this time cells had begun to cycle between the two alternative states; that is, wave propagation was in progress. The operation was assumed to cause the cessation of the switching of cell states throughout the wing. The development of the pigmentation characteristic of the bands depends upon the extent of the wave at the time of committment. Therefore, if wave propagation (which depends on the switching of cell state) is prematurely halted, the position at which the bands
64 ultimately develop reflects the degree to which the wave had progressed at the time the operation was performed. The range of pattern modifications which formed were assumed to result from arresting wave propagation at different stages of the completion of the sequence (a-d in fig. 3.7). To explain the formation of the banding pattern of Plodia and Ephestia, Wilnecker (1980) suggested an alternative model in which the position of the bands is determined by the final position of a kinematic (rather than a propagated) wave. He suggested that a morphogen is synthesized in the centre of the wing and diffuses proximally and distally to form a monotonic concentration gradient. The rate at which scale cells oscillate between two cell states A and B is supposed to be controlled by the concentration of the morphogen. At high concentrations the rate of oscillation is high and at lower concentrations the rate is low. As in the Kuhn & von Englehardt model the state of the cell at the time of committment is assumed to direct its eventual developmental fate. Cycling between these two states is assumed to begin at around 26h in Plodia (at the end of the time at which local responses are observed) and result in a series of kinematic waves of cells in the B state travelling proximally and distally from the location at which they oscillate at maximum rate (fig. 3.8). On committment the rapidly cycling cells have had time to complete two complete cycles and have re-entered the A state while cells at the extreme marginal regions of the wing have had insufficient time to complete the first half-cycle (see Wilnecker, 1980). The effect of early cautery is assumed to cause the local decline of the gradient, hence the local inhibition of oscillatory activity (fig. 3.9b). Consequently the fate of cells in the region of the lesion is altered to one characteristic of those of a more marginal fate, and results in the local deflection of the band nearest the site of the operation. Operations located outside the normal extent of the bands would be expected to have no effect on the pattern. 55
65 c CD O C O O position on P-D axis CELL STATE NO. CYCLES AAAAAAAAAAAAAAAAAAAAAAAAAAAAAAAAAAAAAAAAA ' 0 } CELL STATE NO. CYCLES r AAAAAAAAAAAAAAAABBBBBBBAAAAAAAAAAAAAAAA 0 1( -5» 0 CELL STATE NO. CYCLES CELL STATE NO. CYCLES AAAAAAAABBBAAAAAAABBBBBAAAAAAABBBAAAAAAA r 0 "-5M 1 " "-S7' 0 AAAABBBAAAAAABBBBBAAAAABBBBBAAAAAABBBAAAA 1»1-5 ir 2 " 1-5 n 1 i -stl O ' 56
66 Fig. 3.8 Kinematic wave theory explaining the development of the banding pattern of Plodia. The rate of cell cycling between two states is controlled by a gradient of positional information which is synthesized in the centre of the wing and diffuses proximally and distally to establish a concentration gradient (a). The concentration of this substance determines the rate at which cells oscillate between the two states A & B. In the time available between the onset of oscillation and commitment cells in the region of high concentration are able to complete two cycles and those on the region of lowest concentration are unable to complete the first. The banding pattern of Ephestia can be formed via this mechanism if it is assumed that the step from B to A is irreversible, in which case only those band scales in the extreme marginal positions deposit white pigment (see text). 57
67 o Illustration of the way in which the gradient profile might be affected by a lesion (stippled) in the region of the distal band of Plodia or Ephestia. Lines illustrate common concentrations of morphogen, the numbers on each indicating the relative concentration. It is assumed that a concentration level of 8 specifies the band. The lesion is assumed to create a 'hollow' in the gradient profile and hence the normal path of the contours' is deflected, including that which specifies the location of the band. 58
68 Fig. 3.9 Possible means whereby loops in the pattern of transverse bands may form following cautery, (a) shows a schematic drawing of the pupal wing of Plodia with the presumptive banding pattern. The star is the site of cautery and X & Y are the two lines for which the gradient profiles of the morphogen concentration are drawn (b & c). The morphogen specifies the rate at which cells cycle between the two states A & B. (b) shows the gradient profile along line X and (c) that along line Y. The concentration of the morphogen declines in the region of the damaged tissue and results in the formation of an abnormal profile (normal dotted). Therefore, cells around the operation complete fewer cycles than normal; the fate of these cells is altered to that of a more marginal fate. This effect is greatest closest to the site of the operation, hence the decline in the local concentration is more dramatic along line X as compared to line Y. In both cases, the positions at which cells on the developing pupal wings experience the ranges of morphogen concentration which direct the development of band scales are more medial than normal, but this is most pronounced along the line whicti passes through the site of the operation, thus a loop is formed in the transverse band nearest to the site of cautery, (d) shows the expected gradient profile following an operation in the middle of the central field. 59
69 Cautery during the phase in which the cells are alternating between their alternative states is assumed to stop further oscillation throughout the wing. Consequently, if cautery is performed prior to committment, the degree to which the kinematic wave will have extended over the wing will be reduced as compared to normal. Both models predict that, between the stage at which cell cycling begins and committment, a range of global pattern alterations would result, all sharing the characteristic that both bands are located more medially and each pattern reflecting the degree to which the wave, whatever the precise means of its generation, had extended. It would also be expected that operations performed early during this sensitive period should result in more extreme pattern modifications than those inflicted later in development. That is modifications in which the degree of separation of the bands is considerably reduced (such as those of fig. 3.6) should, on average, result from operations performed earlier than those which result in the formation of almost normal banding patterns. The observed global pattern modifications were arranged by Kuhn & von Englehardt into a continuous series. It was assumed that the more extreme modifications resulted from earlier operations but no attempt was made to compare the average size of the central field following cautery early and late within this period. Schwartz (1962) claimed that a temporal sequence was observed following cautery of Plodia, that is early cautery resulted in, on average, the development of more extreme global pattern modifications even though both early and late operations produced the full range of global pattern modifications. Wilnecker (1980) suggested that global pattern modifications were independent of the age of the animal at the time of the operation. However the accuracy with which the age of experimental animals was known by both of these authors was plus or minus four 60
70 hours, which is close to the duration of the period in which global pattern modifications can be observed. It is possible therefore, that the degree of resolution of these experiments was too coarse to determine whether there is a indeed a temporal sequence. By cauterizing cohorts of precisely aged animals at different stages in the period in which global pattern modifications can be formed, the relationship between the extent of the pattern alterations and age can be determined. The main aim of this work is to examine in detail the relationship between the pattern formed and the time of the operation. 61
71 METHODS Rearing animals Animals were maintained in food containers (Stewarts Plastics) under a 16:8h light:dark cycle and fed on a mixture of 10 parts heat sterilized (110 C for 2h) wholemeal flour : 2 parts glycerol : 1 part dried yeast newly emerged adults were used to set up population cages. After approximately 8 weeks, final instar larvae left the flour mixture to seek a site to pupate, spun a silk cocoon, formed the immobile prepupal stage and pupated 1-2 days later. Adults emerged roughly 3 weeks later. Experimental animals were isolated at the wandering final instar larval or prepupal stage and examined at regular intervals of between minutes to establish the time at which they pupated. This was sometimes observed directly and therefore known precisely or was allocated to be the mid-point of the interval in which pupation occurred. Timed animals were placed in labelled multidishes (Flow Laboratories) in a 20 ± 0.5 C incubator until required for operation. Microcautery The left wings of experimental animals were cauterised at specific times after pupation with an electrically heated tungsten needle. The needle was formed from fine gauge tungsten wire (Clark Electromedical Instruments) wrapped around the heating element of a variable power source. The needle was sharpened to form a fine point by electrolysis in a saturated sodium nitrite solution. The temperature of the tip of the needle was calibrated using histological waxes and water. The temperature of the needle was adjusted to 70 C for most experiments, although in one series it was heated to 50 C. The length of the needle was kept constant since the extent to which the heat was conducted from the element was related to the length of the wire. 62
72 For operation, animals were placed in a well of plasticine and secured in position with additional pieces of moulded plasticine in such a position that the left wing of the pupa was uppermost. No anaesthestic was used. Prior to any operation the power unit was switched on and left for 5s to allow the tungsten needle to warm. With the needle supported in a clamp attached to a micromanipulator (Micro Technique (Oxford) limited) the pupal cuticle was pierced, the needle held in place for 1-2s and carefully withdrawn. The site of the operation on the pupal wing was located with reference to the pattern of pupal veins (see below). Following the operation experimental animals were returned to the incubator at 20 C until adult emergence. Four series of control experiments were performed. The effect of handling was assessed by isolating aged pupae, and incubating at 20 C without performing an operation. The effect of puncturing the cuticle (and underlying epidermis) was examined by subjecting pupae to an operation with an unheated needle. The influence of a hot needle in close proximity to the cuticle was examined by holding a heated needle on or closely adjacent to the cuticle without piercing it. The needle with which the cautery experiments had been performed was used and, in addition, an extremely short, blunt needle, the tip of which reached a temperature well in excess of 100 C. The effect of a temperature shock was further investigated by placing pupae into an/oven to a range of different temperatures for various periods, The effect of cautery on the epidermal cells was examined by applying Trypan Blue which selectively stains dead cells. Pupae were sacrificed immediately or 24h after an operation and both wings disected out under insect saline and placed on a microscope slide. Excess saline was removed and the wing covered with a 4% Trypan Blue solution for 2-5 minutes. The stain was washed away with saline, the wing covered with a coverslip and examined under phase contrast. 63
73 Collecting animals and scoring patterns After approximately 16 days incubation at 20 C adults emerged from the pupal case. They were coaxed into a labelled petri dish and placed into a -20 C freezer as quickly as possible after emergence and wing extension. This ensured that as few scales as possible were lost from the surface of the wing. The wings were excised from the dead animal near to the wing hinge and glued onto microscope slides using Euparal without a coverslip. To emphasize the difference between the white scales characteristic of the transverse bands and scales elsewhere on the wing, the specimen was illuminated from the distal end of the wing only and the incident light was passed through a polarizing filter which reduced surface reflections from the scales. Camera lucida drawings at constant magnification (x18) were made of each wing on tracing paper to show the location of any damage following the operation and to illustrate the banding pattern of each wing. The difference between the banding patterns of the experimental and the control contralateral right wing was examined by reversing the tracing paper of one of the drawings and superimposing it on the other. Patterns were scored blind (see below) and the location and size of any lesioned tissue and/or hole on the wing were noted. The age at which the animal had been cauterised and the site at which the operation had been performed was then noted.
74 RESULTS Wing pattern in control animals There are two components of the adult wing pattern of the melanic form of Ephestia. The most obvious is the pattern of pigmentation consisting of two white bands on an otherwise black wing. There are also a number of veins which protrude from the surface of the lamina and form a branching network over the wing surface. a)description of the normal pigment pattern Fig. 3.10a shows a photomicrograph of the dorsal surface of the left forewing of a control animal to show the normal banding pattern. Most of the wing is covered with dark pigmented scales although two bands of white tipped scales extend from its anterior to posterior margin. Figure 3.11 shows a high magnification view of the scales characteristic of the transverse bands to illustrate the difference between them and those scales covering the rest of the wing. The white tipped band scales which comprise the two transverse bands are not found anywhere else on the wing surface (figs & 3.11). The distal tip of the wing is covered with an array of long scales which project beyond the wing margin. The proximal and distal bands diverge anteriorly and are vermiculate, particularly in the posterior region of the proximal band. b)the pattern of venation Fig shows camera lucida drawings of the pattern of venation superimposed on the pigment pattern of two individuals. The venation pattern is similar both within individuals (left versus right wing of a single animal; compare fig. 3.12a & b and fig. 3.12c & d) and between different animals (compare fig. 3.12a & c and fig. 3.12b & d). The most variable feature of the pattern was the extent of the cross 65
75
76 b distal transverse bands proximal marginal scales distal field central field proximal field Fig (a) is a photomicrograph of the left forewing of a control animal at x18 to illustrate the pigment pattern. There are two bands of white coloured scales, the proximal and distal bands, the remainder of the wing is covered with dark pigmented scales. (b) is a camera lucida drawing of the forewing of a control animal labelled fully to show the proximal and distal bands and the regions they enclose, the central field. From the distal band to the margin of the wing is the distal field and the most proximal domain, the proximal field. The distal margin of the wing has a fringe of long 'marginal scales' (the maximum extent of which is illustrated by the dotted line). The pattern of venation is illustrated also (the veins are named according to Kuhn & von Englehardt (1933); see also Nijhout, 1985) 66
77 Fig Photomicrograph (x40) of part of the distal band of a control animal to illustrate the difference between the white pigmented band-type scales and the scales characteristic of the rest of the wing (except the marginal scales).
78
79 Fig (a)-(d) are camera lucida drawings of the adult wing pattern of two individuals to illustrate the relationship between the pigment and venation patterns in control animals, (a) & (b) and (c) & (d) are right and left wings of two control animals respectively. The regions covered by the white band scales are indicated (the proximal and distal bands; see fig. 3.10) and the positions of the veins (dark lines) superimposed. For nomenclature of veins see fig. 3.10b. Scale bar represents 1mm. 68
80 Fig 3.13 Rigrv (a) and reversed left (b) wings of a control animal. If the pattern of the two.vmgs were perfectly symmetrical the reversed image of one should superimpose perfectly upon that of the other. Therefore, the degree of similarity of the two citterns was assessed by drawing at constant magnification (x18) right and left.-. ngs using a camera lucida onto tracing paper and constructing a composite of them both onto a single figure such that the anterior, posterior and distal margins of each were aligned (c) shows the two drawings superimposed in this way. Solid oandmg pattern of reversed-left wing. Bar represents 1mm. All camera : :a drawings are represented in this way. 69
81 vein X and the length and position of origin of veins R1 and R2 from vein R (e.g. fig 3.12c & d; see also fig ). The number of veins, the way in which particular veins branched and the even spacing pattern were consistent features. It appeared that there was some degree of correlation between the venation and pigment patterns in that the positions at which the transverse band changed direction was often at the point at which the it was transected by a vein. For example the location at which the proximal band was crossed by vein A (fig. 3.12a & b). The deflection in the proximal band just anterior to vein A was, however, not associated with the presence of an adult vein although this does correspond to the position of a lacuna which is not represented in the pupal vein pattern (see chapter 2). (c)comparing banding patterns on left and right wings Operations in the experimental series were performed on the left forewing of the animal; the contralateral wing was untouched and provided a control with which the experimental wing could be compared. To justify the use of the banding pattern of the right wing as a control for the experimental, it was necessary to demonstrate that in the non-cauterized control animals the right and left wings were normally symmetrical. The degree of similarity between the left and right banding patterns was assessed firstly by direct observation (fig. 3.13) and, secondly, by measuring the size of the central field of each wing which provided an indication of the degree of separation of the two bands (fig. 3.14). 70
82 71 a " ~ b..,, '" ""... C, I \ I I, " :... Fig 3.14 Diagram illustrating way in which the measurement of the degree of separation between the two bands was calculated. The linear distance between the two bands along the medial axis of the wings was measured. (a) and (b) show right and reversed left wings respectively of a control animal, (c) shows these two drawings superimposed; solid line is the banding pattern of the left wing, bar represents 1 mm. Linear separation of bands in (a)3.9mm, (b)3.8smm.
83 Composite drawings of right and left wings of 96 control animals were superimposed examined and the degree of similarity of the banding patterns scored. The precise position of the bands on the wing was remarkably consistent both within (that is, comparing patterns on right and left wings of the same individual) and between animals. The majority were recorded as being 'almost identical' ":11:> (7..,6/96 cases; fig. 3.15). The greatest difference between wing pairs was recorded as 'very similar' (19/96 cases; fig. 3.16). l wo. s N \:::>. -qb The mean size of the central field of 96 control left wings was 3.85.:!: 0.06mm (variance=0.2smm) and that of the right 3.89 ~ O.OSmm (variance=0.20mm). The ranges of values of the size of the right and left central fields overlap (including the 95% confidence limits) and there is no significant difference between these values (P < ), indicating that according to this criterion the patterns are indistinguishable. The relative size of the central field of the left and right wings can be expressed as a ratio. It would be predicted that if right and left banding patterns were perfectly symmetrical the ratio of the size of the left central field to the right would equal 1.0 (i.e. 100 % ). The percentage reduction/increase in size of the central field of the left wing with respect to that of the the right for control animals was 98.9! 1.24%. Two minor categories of patterns were observed in opercfted and unoperated animals, non-scorable (NS) and non-developing (NO). NS patterns were characterized by a. banding pattern which was poorly developed, typically because of loss of scales or gross deformation of one or both of the wings making it Impossible to accurately superimpose drawings of right and reversed-left wing patterns. Such animals were discarded. NO patterns were characterized by a complete banding pattern on one of the wings whereas that of the other wing was only partially formed (figure 3.17). Rarely both transverse bands of the wing failed 72
84 Fig 3.15 (a)-(d) show four camera lucida drawings of superimposed right and reversed left control wings which formed 'almost identical' banding patterns. Solid line is oanding pattern of left wing. Bar represents 1mm. 73
85 to develop normally. In ND patterns, scales form in the location at which a band would be expected to form but they are characteristic of the central/proximal/distal fields rather than the band (that is, the scales lack any trace of white pigmentation). The ND class cannot be attributed to scale-loss because the complement of scales on both wings was complete. Nature of the physical damage to the wing The effect of cautery on the epidermal cells immediately following and 24h after the operation was examined by staining the pupal wing with Trypan Blue (see methods). The stained area was extremely variable in size but typically corresponded to about cells. 24h after the operation the stained area was always smaller than that immediately after cautery, although still variable in size. Cautery of the pupal wing at various times during early development usually resulted in damage to the adult wing, although more commonly a lesioned patch of cuticle lacking scales developed. Holes in the adult wing were often surrounded by a lesion. Figure 3.18 shows the frequency with which lesions and/or holes developed in animals cauterised at ages between 1-72h. The proportion of animals which suffered damage to the experimental wing following an operation was relatively constant, suggesting that there was no relationship between the ages at cautery and the likelihood of a hole or a lesion forming in the wing. At 24h two series of experiments were performed using nee'dles heated to two different temperatures (50 C & 70 C) but the frequency of wings which formed a hole or lesion is similar. Fig. 3.19a shows a scanning electron micrograph of a lesion on a wing. The cuticle is distorted and there are no scales or sockets present suggesting that it was derived from epidermal cells rather then scale cells (see chapter 2). Figure 74
86 Fig 3.16 (a)-(c) show examples of 'very similar' patterns from unoperated animals. Each drawing shows a pair of right and reversed left wing patterns superimposed, the banding pattern of the left is drawn with a solid line. Bar represents* 1mm. In (a) and (c) the proximal band of the left wing is displaced medially as compared to the right; the distal bands of each are similar. In (b) both proximal and distal bands of the left are slightly displaced proximally and distally respectively. Percentage reduction of size of central field (left with respect to right; see fig. 3.14) are (a)98.4%, (b) 106.0%, (c)94.4%. 75
87 d 76
88 Fig 3.17 (a)-(d) show examples of patterns falling into the 'non-developing' class. Figures are camera lucida drawings of composite right and reversed-left wings; banding pattern of left wing solid, right dashed; bar is 1mm. The animal illustrated in (a) was cauterised at ± 0,16h post-pupation which resulted in the development of a large hole (solid shaded region) and a lesion (stippled area). The distal band of the left wing failed to form, the proximal band was enlarged and occupies a more medial position than in the control (b) cauterised at 0.59 ± O.OOh post-pupation resulted in the formation of a small distal lesion. The proximal bands was almost identical to the control. The posterior half of the distal band was normal; anterior to the lesion, band scales failed to form, (c) a medial lesion formed following cautery at 24,01 + 0,11h post-pupation. The distal band was identical to the control, the proximal formed only a few band scales anteriorly and they were located in a slightly more medial position than the control. The posterior part of the experimental wing failed to form band scales, (d) Animal cauterised at 48,37 _* 0,15h post-pupation resulted in a proximal lesion. The distal band almost completely failed to develop, the proximal was enlarged and more medial than the control. 77
89 proportion of animals with lesion/hole, percent. g 8 1h 24hl 1 ( '.. ', ' ' iiiiijaiij * J _A =:^:::M::;:;i:;::i::;::;i::!: :i::::j: J 0 * Si 24hl 26h 1 CJ 10) 31h 36h 42h 48h 60h 1 PIgJ "" "^,. 1^..,,, ,._,.,... Jff :;:,, ; ;,:: -,-::;-:J 00 ] -*j '..'.,...' '.':,. '..-:; '.- :":>: :.::: i.;^j O1 1 t ' : ". ;- : l : ; :;:; :::;: ; :V;::;;^'^ :: : ;! :'^. :.;. :.:. :;:.:.;;j J» 72h ::...:..:.: ;:;:::;::-:..:::;::...: :J 1 3 D d
90 Fig 3.18 Figure shows percentage of animals with a lesion and/or hole in the experimental wing following an operation. The number of animals in each age class is given at the top of each bar. 79
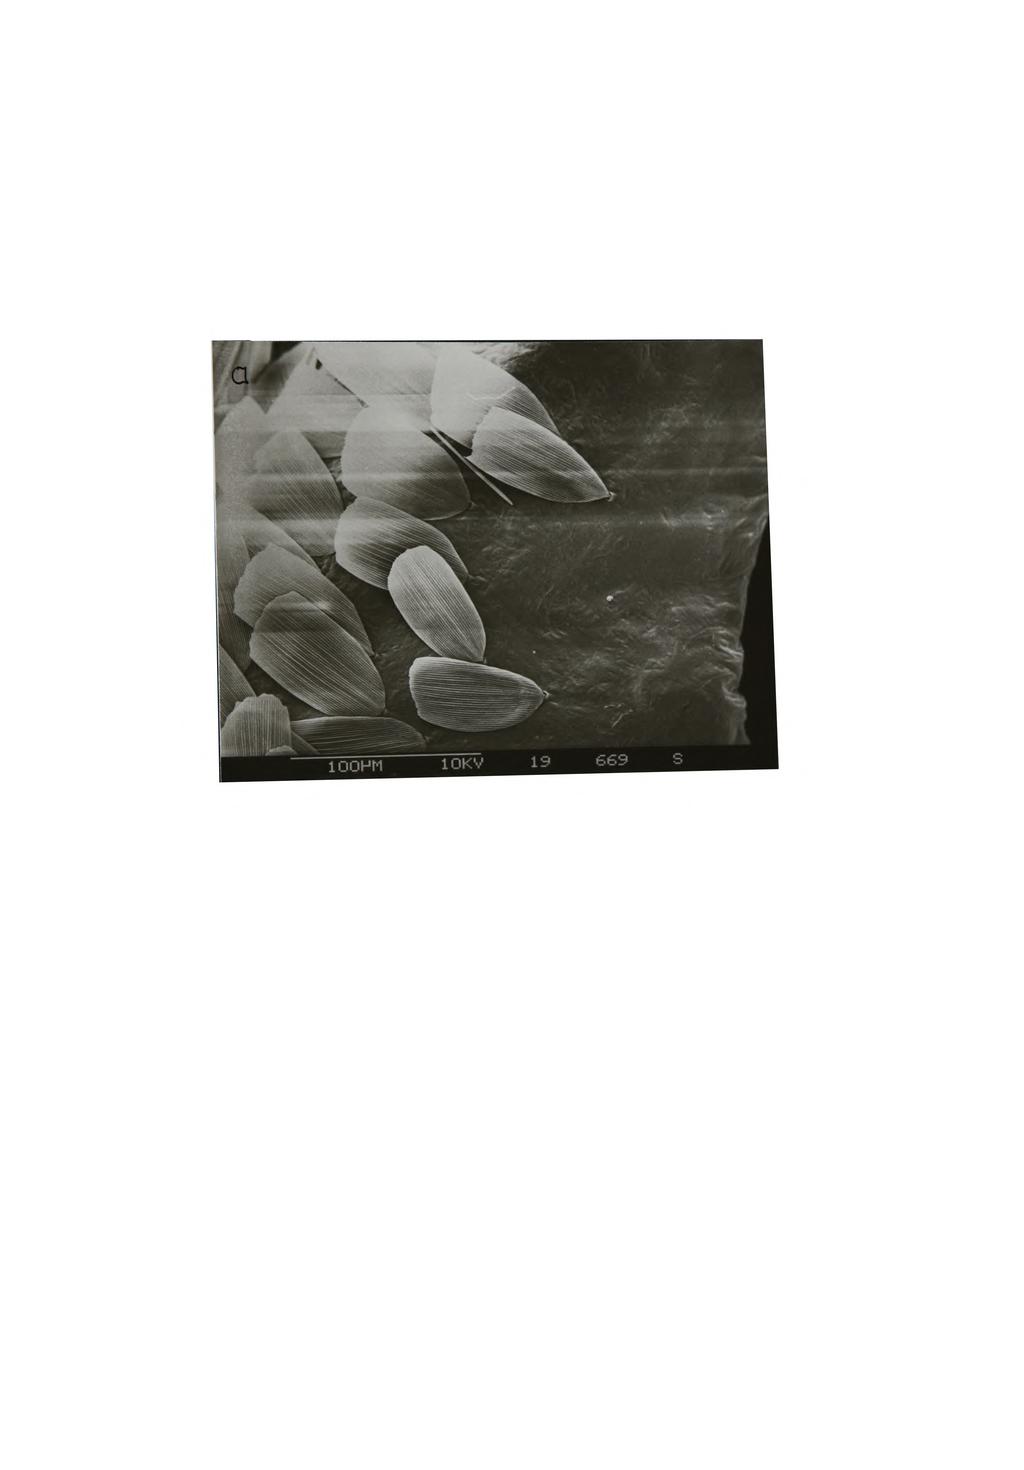
91
92 b 30 E 20 jg C n age at operation, h. Fig 3.19 (a) shows scanning electron micrographs of a lesion on a wing and (b) the mean area of lesion (mm ) with respect to the time at which the operation was performed. Bars indicate standard deviation. At 24h operations were performed at two different needle temperatures. I-50 C; II»70 C. 80
93 3.19b shows the mean area of the lesion following cautery at ages from 1-72h post-pupation. Although operations were performed with the needle heated to a standard temperature and were of constant duration the area of the lesion on the wing was exceptionally variable. There seemed to be no relationship between the ages at which the operation was performed or the temperature of the needle (see 24h I and II) and the size of the lesion which formed as a result. Location of the lesion with respect to site of operation By noting the location at which the pupal wing was cauterised and the site of the resulting lesion on the adult wing, a correspondence map of pupal-adult wings was constructed. Figure 3.20 shows the sites at which lesions were located on the adult wing following cautery at four specific positions on the pupal wing which were located with reference to the pattern of venation on the pupal wing (see methods). The location of the lesions from a series of operations was variable, but tended to be restricted to a fairly specific region on the wing; cautery at distal locations (for example, in the distal region of sector M- -M2) produced lesions located in distal positions on the adult wing. The least variability was observed following cautery on vein M at the point of separation into veins M-j and M2- Effect of cautery on the banding pattern Following operations at some stages of pupal development, the pattern of the adult wing was modified with respect to the control contralateral wing. The frequency with which the pattern was modified depended principally upon the time of the operation (but at some stages the location of cautery was also important). That is, there was a sensitive period during which cautery could alter the wing pattern and outside which no effect on the banding pattern was observed. The precise nature of the modification, was not constant but depended upon the timing 81
94 distal anterior OD ho
95 Fig 3.20 Defect map relating site of cautery inflicted on pupal wing to the location of the lesion on the adult wing. The central figure shows the left wing of a pupa in situ; nomenclature for venation follows Kuhn & von Englehardt (1933). The four outer figures show the left wing of an adult animal with the banding pattern. Lines from centre to outer figures indicate the location of a lesion following cautery at the indicated position on the pupal wing. The four sites to illustrate this figure are, from anterior to posterior, (a) between veins a-an at an antero-posterior level equivalent to the distal end of vein B. (b) between veins Cu-M proximal to the separation of vein Cu into Cu-j and Cu2 (c) at the point of separation of vein M into veins M-j and M2 and (d) between veins M^-M2 at the mid-point between the separation of vein M and the posterior margin of the wing. The location of defects on the adult wing following operations at each of these sites on the pupal wing is shown In the four outer drawings. The number on the outer figures indicate the number of times that the position of the lesions on the adult wing coincided. 83
96 of the operation and, at some stages also upon the location of cautery. The effect of cautery on the pattern is described in two sections, firstly considering the period of pupal development during which the pattern is susceptible to modification following cautery and secondly a description of the resulting pattern alterations. a)sensitive period To identify the ages at which the banding pattern was altered following an operation pairs of wings were examined and any differences between superimposed right and reversed-left drawings were scored on a scale as follows: I. Almost identical (as above) II. Very similar (as above) III. Patterns similar (figure 3.21) IV. Patterns different (figure 3.22) V. Patterns distinctly different (figure 3.23) To assess the reliability with which animals could be classified, 141 individuals were re-scored blind. 107 were reassigned to the same class, 28 differed by only one class from their original score (e.g. V-IV, HI), and only two differed by two classes. The remaining four animals differed in that, because of having few white scales, they were scored as non-developing on one occasion and classified V, V, IV, and II on the other. Whether cautery resulted in an alteration of the wing pattern depended upon the time at which the operation was performed during pupal development. The results are summarized in table 3.1 which shows, for each age group, the percentage of animals falling into each category of pattern alteration. In control animals the poorest match of the banding pattern of right and left wings was class II ('very similar'; see above). It follows that any pattern classified as III-V represents a
97 85
98 Fig 3.21 (a)-(c) show examples of 'similar' patterns. Figures are camera lucida drawings of superimposed right and reversed left wings; the banding pattern of the left is drawn with a solid line, that of the right is dashed. The bar indicates 1mm. The left wing of (a) was cauterised at 36,03 ± 0,15h post-pupation in an anterior-distal location, although no lesion was visible on the adult wing. The posterior part of the distal and the entire proximal band of left and right wings correspond precisely; the anterior part of the distal band of the experimental wing is displaced medially, (b) was cauterised at 36,02 t 0,22h post-pupation in a proximal location. A lesion (stippled area) was visible as a naked patch of cuticle (see fig. 3.19a). The proximal band of the left wing is displaced medially in this location; the distal band is as in the control wing. The animal illustrated in (c) was cauterised at 42,10 ±_ 0,17h post-pupation in a distal location. A hole (solid region) was observed. The distal band was located more medially than the control and was fragmented. In addition, the position of the proximal band does not accurately match the control.
99 87
100 Fig 3.22 (a)-(c) show examples of wing patterns classified as 'different', (a) cauterised at 1,04 +_ 0,14h post-pupation in a medial location. Wing has a hole (solid shaded area) and a large area of cuticle lacks scales (stippled). The anterior part of the distal band of the experimental wing is absent, although posteriorly the experimental and control patterns coincide. The proximal band is displaced medially with respect to the control and a few ectopic scales are located between the lesion and the proximal band, (b) following cautery at 36,14 ±. 0,17h post-pupation a small patch of cuticle lacks scales (stippled region). The distal band is rudimentary and in a more medial location than the control. The proximal band is enlarged and extends medially. Ectopic band scales are located between the proximal band and the lesion, (c) animal cauterised at 24,00 *, 0,14h post-pupation has a small medial lesion (stippled). The bands of experimental and control wings coincide but the left wing has a number of ectopic band scales around the site of the lesion.
101 b Fig 3.23 Two examples of 'distinctly different' patterns. The nature of the modifications fall into two categories illustrated by (a) and (b). (a) animal cauterised at 23,59 ± 0,14h post-pupation has a lesion located in a position corresponding to the distal band of the control. The anterior region of the distal band of the experimental wing is deflected medially in the region of the lesion. The posterior part of the distal band and the entire proximal band are as the control, (b) following cautery at 36,36 t 0.25h post-pupation both the proximal and distal bands are located in a more medial position. Lesioned cuticle is indicated by the stippled region. Bar represents 1mm 89
102 U Table shows the percentage of animals cauterised at each age class falling into the categories of pattern modification. Bottom row (N) indicates the total number CONTRO 1.0 -jp 3rTj CLASS OF PATTERN MODIFICATION ND I II III IV V la.o U u.u 5.9 5o.o 31 U ACE AT OPERATION (h) U U2 7-U U U U.I CD O N Table 3.1 of animals in each age class.
103 departure from the range of normal variation in the degree of symmetry of the banding pattern of right and left wings. Operations at all times resulted in an increase in the number of animals in classes III-V with respect to the control, but the precise frequency varied according to the age of the animal at the time of the operation. Cautery performed on animals aged 60h or older only rarely resulted in pattern modifications (< 5%). Younger animals, particularly aged 26-42h post-pupation, frequently produced altered patterns and the number in categories I & II was correspondingly reduced. Following operations at 1h, and particularly at 48h post-pupation, more patterns classified as III-V were observed but the frequency was lower than that for other age groups. At all age classes the proportion of non-developing patterns was increased with respect to the control, although the difference was not dramatic at 72h post-pupation. There was, however, no obvious relationship between age at operation and the proportion forming ND patterns. b)nature of pattern modifications According to the exact timing of the operation and the precise location of the lesion the banding pattern was altered in particular ways. The different types of modification to the pattern were classified as follows:- (1)Position dependent Banding pattern of control and experimental wings differed (classes III - V). The way in which the patterns were altered was dependent upon the location of the lesion. Pattern modifications were of two types according to the site of cautery. Cautery inflicted outside the central field never resulted in the formation of position dependent pattern modifications. I. Loops The common characteristic of this class of result was that the pattern of either the proximal or the distal transverse band was affected In any 91
104 particular individual the pattern of the band nearest the lesion was altered while the other was as the control. The affected band always looped medially to isolate the lesion from the central field, thereby restricting it to either the proximal or the distal field. Loop patterns were variable in nature. Occasionally the deflection was restricted to a localized region of one of the bands (figure 3.24a & c); more often most or all of the band was displaced (figure 3.24b & d). 113/loop patterns were observed following cauteries at 1h (N=8), 24h (N=33), 26h (N=20), 31h (N=32), 36h (N=13) and 42h (N=7). Fig shows four wings which were cauterised in two different locations over the range of ages which, resulted in the formation of loop patterns following operations. The nature of the pattern modifications formed were similar (compare fig. 3.25a & b and fig. 3.25c & d) indicating that although the patterns of loops were diverse (fig. 3.24) the exact age at which the operation was performed was not the factor responsible for the variability. Which band was affected depended on the location of the lesion on the wing. Figure 3.26a shows the distribution of lesions on wings which formed loop patterns with a modified distal band, and figure 3.26b those which resulted in an effect on the location of the proximal band. The age at which a particular lesion was inflicted was irrelevant in determining which of the bands was affected: a lesion located in the proximal part of the pupal wing affects the proximal band over all of the ages at which these patterns may be formed. Fig shows two loop patterns formed after cautery at (a) 26h and (b)24h post-pupation in a proximal location. Although the operation resulted in a dramatically different size of lesion the loops formed were similar, indicating that the severity of the operation, as judged by the size of the lesion/hole, was unimportant in influencing which of the bands was affected and the nature of the loop patterns formed. 92
105 0) o CD CO
106 Fig 3.24 (a)-(d) show four examples of position-dependent loops. Right and reversed left camera lucida drawings are superimposed. Banding pattern of left wing is shown by solid line, that of right dashed. Bar represents 1mm. (a) animal cauterised in medial location at 35,45 + 0,20h post-pupation. Proximal band of experimental wing loops medially to exclude lesion (stippled area) from the central field. Distal band is as the control, (b) animal cauterised at 26,33 ± 0.15h post-pupation in proximal location. Proximal band of experimental wing is displaced medially, distal is as the control, (c) pattern resulting from distal cautery at ±. 0,12h post-pupation. Proximal band is as the control, distal band locally displaced medially, (d) hole formed in wing (solid shaded region) rn distal location following cautery at 24,07 ± 0,12h post-pupation. Proximal band is as control, distal band scales are scattered and in a more medial location than control.
107 Fig Figure shows four loop patterns resulting from cautery at different ages, (a) was cauterised at 1,06 + 0,11, (b) 24,31 + 0,16 (c) 26,35 + 0,15 and (d) 30,56 * 0.50h post-pupation in distal (a & b) and proximal (c & d) locations The stippled area shows the location of the lesion formed in each case 95
108 Fig 3.26 Figure shows the location of lesions (shaded region) on the wings which formed (a) distal loops (N=39), (b) proximal loops (N=34) and (c) rings (N = 40). 96
109 Fig Figure shows two similar loop patterns formed following cautery at (a) 26,05 ± 0,15 and (b) 23,59 ± 0,14h post-pupation which resulted in the formation of very differently sized lesions, (a) was cauterised on the posterior margin of the wing and resulted in the absence of a large region of the cuticle in the corresponding region of the adult wing (solid shaded region). A patch of the wing in this region also lacked scales (stippled), (b) was cauterised in a proximal location resulting in the formation of a hole surrounded by a lesion. In each of the pairs of wings the distal transverse band was identical to the control the proximal band loops distally and is incomplete posteriorly. S7
110 II. Rings Pattern modifications in which both transverse bands were as the control and a ring (often incomplete) of white band-type scales developed in the central field surrounding the lesion. 40 ring pattern modifications were observed following cautery at 1h (N=2), 24h (N=4), 26h (N=15), 31h (N=14), 36h (N=3) and 42h (N=2). Rings were variable in shape and diameter (fig. 3.28). In figure 3.28a & b the lesion was located quite close to the distal transverse band and the ring of ectopic scales around the lesion "fused" with those of the distal band whereas in fig. 3.28c & d cautery in a more medial position resulted in the development of isolated rings in the central field. This suggests that the nature of the ring pattern formed depends on the location at which the lesion was inflicted (see also fig. 3.26c). At each age class in which cautery could produce rings, the full range of variability in the nature of the pattern was observed. For example, in the patterns illustrated in fig. 3.29a & c the animals were cauterised at 31h post-pupation yet (c) formed a more complete ring than (a). The pattern in fig. 3.29b is more similar to fig. 3.29a than fig 3.29c yet the individual illustrated in (b) was cauterised at 25h post-pupation. That of (d) differs from (a), (b) & (c) yet follows an operation at the same stage as (b). This indicates that the position of the lesion and not the precise age at cautery was the most important factor determining the nature of the ring pattern formed. The severity of the operation, as judged by the size of the lesion, also did not influence the diameter or location of the rings or whether they fused with the transverse bands. 'Ring' and 'loop' pattern modifications were both observed between 1 to 42h pupal development. Whether a loop or a ring was formed depended solely on the location of the site of cautery. The temperature of the needle (50 or 98
111 99
112 Fig (a)-(d) show examples of position dependent "ring" patterns. Each was cauterized in a medial location and a small lesion developed (stippled region) as a result. The pattern shown in (a) was the result of cautery at 26,15,±_0,12h post-pupation and consists of an arc of ectopic band scales which formed around the anterior region of the lesion and "fused" with the distal band. Apart from the point of fusion the transverse bands were as the control, (b) followed cautery at 24,32 ±_ O.OOh post-pupation and a similar pattern was formed although the ectopic ring of band scales was more complete, (c) & (d) were cauterised at 26,56 ±_ 0,07 and 24,04 ± 0,09h post-pupation respectively and formed dramatic rings of band scales around the lesions; the transverse bands were as the control. 100
113 101
114 Fig Figure shows four ring patterns, (a) and (b) were cauterised in a medial location and formed a similar pattern modification consisting of a half ring posterior to the lesion (lesion is stippled). These two wings were cauterized at (a) 31,15 t.0,50 and (b) 25, ,12h post-pupation, (c) was cauterised at 31,10 ±_0.10h post-pupation and formed a more complete ring of band type scales around the lesion. The ring formed in (d) followed cautery at ±_ 0,12, was located more proximally and the ectopic band scales had "fused" with the proximal transverse band. 102
115 Fig 3.30 The two wings illustrated are the results from wings cauterised during the period of pupal development in which 'position-dependent' alterations in the pattern are known to occur. In each case the position of the lesion is outside the central field of the overlaid control and the banding pattern formed is as the control, (a) was cauterized at ,32 and (b) at 31,05 + 0,50h post-pupation. Lesioned region is stippled, bar represents 1mm. See also fig. 3.34b. 103
116 70 C) did not influence the nature of the pattern modification formed (ring or loop) or the extent of the alteration. For example, rings formed following cautery at 70 C were not of a larger diameter than those from operations at 50 C. Lesions inflicted in the proximal and distal regions of the pupal wing formed proximal and distal loops respectively (fig. 3.26a & b) whereas cautery located in the medial part of the wing resulted in the formation of loops (fig. 3.26c). There was however, a considerable overlap in the region of the wing the lesion was located and the pattern which formed as a result. Position-dependent patterns were not observed when the lesion was located outside the central field of the control wing (fig. 3.30). (2)Position-independent Pattern of the experimental wing altered with respect to the unoperated control but the nature of the modification was unrelated to the site of cautery. The characteristic feature of this class was that the position of both proximal and distal bands was altered. The location of the transverse bands was always more medial than those of the control; the proximal band, often enlarged, occupied a more distal position and the distal band was displaced proximally (figure 3.31). (i)effect of location To investigate whether there was any relationship between the site of cautery and the degree to which the transverse bands were displaced, individuals which formed positional-independent pattern modifications were placed into three categories according to the location of the lesion on the wing (in circumstances where it was visible). The mean percentage reduction in the size of the central field of animals with lesions in the 'proximal', 'medial' and 'distal' region of the wing was compared and no significant differences could be demonstrated, suggesting that the nature of the modifications was truely 104
117 independent of the site of cautery (fig. 3.32). In contrast to the position-dependent (or local) pattern modifications global alterations to the banding pattern were observed even when the lesion was located outside the presumptive central field (figure 3.31b & d), (ii)effect of age Position-independent patterns were frequently observed following operations at 36, 42 and 48h and were rare at 31, 60 and 72h post-pupation. The nature of the position-independent (or global) modification to the pattern, regardless of the precise age of the animal at the time of the operation, was exclusively one of medial displacement of both transverse bands. The reduction in the size of the central field was quite variable (from 32.9% to 88.6% of the size of the control). To test whether there was any relationship between age at cautery and the extent to which the pattern was altered, the pattern modifications were divided into the three age classes at which they most frequently occurred and the mean distance of separation of the bands measured. The degree of separation of the bands, that is, the size of the central field, was assessed by measuring the linear distance across the central field. Table 3.2a shows the mean size of the right and left wings and gives the percentage mean reduction in the size of the central field of the experimental wing as compared to the contralateral control for each age class (control data is shown also). At each age class the reduction in the size of the central field was variable but the degree of variation for each was similar (table 3.2a, last column). Table 3.2b shows the result of a statistical analysis of this data and indicates that the central field of the cauterised left wing was significantly different from that of the control untouched animals and the corresponding contralateral wing (for example, the experimental wing of an animal cauterised at 36h post-pupation has a central field which, on average, is smaller (P<0.001) than that of its contralateral wing or that of either the right or the left wing of a control animal [column 4, rows 1-6]). There was however no significant difference in the 105
118 901
119 Fig Four examples of 'position-independent' patterns following cautery in different locations, (a) cauterised at *. 0.15h post-pupation formed a small hole (solid shaded region) surrounded by a lesion (stippled) in a medial location. Both proximal and distal bands were displaced medially. Reduction in the size of the central field was 61.7%. (b) shows a similar pattern modification following cautery at 36,23 ± 0,30h post-pupation in a location proximal to that corresponding to the proximal band of the control wing. In addition the proximal band of the experimental wing was considerably enlarged. The central field was reduced by 54.1% as compared to the control. The wing shown in (c) was cauterised at 48,05 * 0,25h post-pupation in a medial location. A small hole was surrounded by a lesioned area. Both transverse bands of the experimental wing were located in a more medial location than the control. The central field was 71.1% of that of the control. Following cautery in an extreme distal location at ± 0.22h post-pupation (d) formed a similar pattern (percentage reduction of central field, 74.5%) 107
120 g *3E M D 108
121 Fig Relationship between the site of cautery (proximal (P), distal (D) or medial (M)) and the extent to which the bands delimiting the central field (CF) were displaced. The degree of medial displacement of the transverse bands is expressed as a ratio of the size of the central field of the right with respect to the left wing. The bars on each of the columns represent the standard deviation and N is shown at the top of each bar. Animals were placed into each of the classes according to the position of the lesion on the wing in relation to the position of the transverse bands. When located within the proximal or distal fields they were placed into the proximal and distal respectively, otherwise the medial group. There is no significant difference between the relative sizes of the central fields of any of the classes (P > 0.05). 109
122 Size of central field field (1/r. 100#) % reduct: 98.9*1.2 6j.l*U.U 69.5* *U.5 RIGHT T=0.90 PX).0$ U8h LEFT T=6.8U P<0.001 P>0.05 PO.001 T=6.96 PX).0$ PO.OOI T=O.52 PO.001 P>0.05 T=:1.08 PXD.05 PO.001 T=7.08 T=0.1U PO.001 P>0.0$ T=6.$8 PO.001 A Time of Operation (hours) *; N Mean size of central field (mm * 9$# C.L.) RIGHT LEFT LS 36 l 2 U U 3.89*0.07 U.01* *0.10 U. 01* * * * *0.18 o B CONTROL RIGHT LEFT CONTROL RIGHT LEFT T=O.U2 P>O.05 36h RIGHT LEFT T=1.30 T=7.00 P>0.05 PO.001 P>0.05 P<0.001 RIGHT LEFT p>o.o5 po.ooi T=0 T=7-71 p>o.o5 PO.OOI 36h RIGHT LEFT PO.001 T=1.20 T=7.59 p>o.o5 PO.OOI T=6.Ui T=O.68 PO.OOI PX>.05 U2h RIGHT LEFT T=6.79 PO.OOI U8h RIGHT LEFT
123 Table 3.2 Data giving the reduction in the size of the central field of animals with 'position-independent' pattern modifications and a statistical analysis of that data to examine whether the size of the central field has been significantly reduced as compared to the controls group and the contralateral wing. Table 3.3a gives the mean size of the central field (C.F.) of right and left wings and the percentage reduction in size calculated as the size of the left divided by that of the right, expressed as a percentage (plus or minus 95% confidence limits). Animals are treated separately according to their age group (whether operated at 36h, 42h or 48h post-pupation), the number in each class (N) is given and the data for the control (untouched) group is given also. Table 3.3b presents the results in terms of a series of pairwise comparisons of the size of the central field of right and left wings both within and between each category. The value of the Students' t-test (T) is shown with the probability (P) that there is NOT' a genuine difference between the two values under comparison. 111
124 degree to which the two bands were medialized in each of the age classes (compare experimental wings of animals cauterised at 42h and 36h; column 6, rows 7 & 8). Therefore, given a position independent pattern modification it would be impossible to attribute it to a particular age class. To illustrate this point, figure 3.33 shows four patterns resulting from cautery at 42h post-pupation. The degree of difference in the patterns ranges from being relatively similar (3.33a) to dramatically different (3.33d); the full range of intermediates were observed (3.33b & c for example). (iii)effect of lesion size It is possible that the degree to which the transverse bands were displaced was related to the amount of damage inflicted to the pupal wing. Since it was not possible to determine the area of tissue damaged following an operation without sacrificing the animal it was necessary to assume that the size of the lesion on the adult wing provided a reasonable measure of the severity of the operation. This is likely to be true provided that the rate of healing in all individuals following an operation is similar. Fig. 3.34a-c show scatter-diagrams of lesion size plotted with respect to the reduction in the size of the central field, and demonstrates that there is no relationship between the percentage reduction in the size of the central field for any age class which formed position-independent pattern modifications and the lesion size suggesting that variations in the amount of damage inflicted was not responsible for differences in the nature of pattern alterations. 112
125 113
126 Fig 3.33 (a)-(d) show four examples of patterns resulting from operations at 42h post-pupation. Figure shows camera lucida drawings of right and reversed left wings. Stippled area is the site of the lesion; solid line shows banding pattern of experimental left wing, fine dashed is that of the control, right wing. Bar represents 1mm. (a) medial lesion inflicted 42,30 ± 0.15h post-pupation, size of central field of left wing 86.5% that of control, (b) proximal lesion inflicted ±. 0,17h post-pupation, reduction in central field 80%. (c) medial lesion inflicted 42,08 ± 0,50h post-pupation, reduction in central field 73.1%. (d) medial lesion inflicted 42,53 ± 0,15h post-pupation, reduction in central field 55.9%. 114
127 a 240 T 36h h c ' c ratio h Fig Scatter diagrams to show the relationship between the size of the lesion and the degree to which the pattern was modified (ratio of size of the central field of experimental to control wing) following cautery at (a) 36h, (b) 42h and (c) 48h post-pupation. 115
128 (3)Miscellaneous Patterns A number of patterns were observed which were inconsistent with the categories of modifications described above (fig. 3.35). Miscellaneous patterns fell into two major categories. There were truly eccentric patterns which deviated from the other classes of modifications described (fig. 3.35a & b) and modifications which seemed to represent 'composites' of two classes of pattern modification. Figs 3.35c & d show examples of composite non-developing and 'position-dependent' pattern alterations. 'Miscellaneous' pattern modifications were rare (< 2%) and are not considered further. (4)No effect The operation failed to influence the banding pattern of the experimental wing and there was no significant difference in the size of the central field of left and right wings (corresponding to classes I & II above; see fig for three examples). Sometimes part of the pattern of the experimental wing was obscured slightly by the lesion (figure 3.36c). Operations which had no effect were observed following cautery performed at all ages of pupal development (see table 3.1). (5)Non-developing Part or all of the banding pattern of the experimental wing failed to form. This class of result could not be explained on the basis of scale loss since the pattern of the control wing was fully developed (as* described above). Non-developing patterns were observed following operations at all ages of pupal development and formed a fairly constant proportion of the resulting pattern modifications (table 3.1). The patterns were extremely variable, ranging from a fairly small part of the band or the entire band, occasionally both, failing to develop. The band affected by the operation was related to the location of the lesion. Figure 3.37 shows the location of lesions on wings which formed ND patterns and illustrates that although lesions in extreme proximal and distal 116
129 o
130 Fig Four examples of pattern modifications classified as 'miscellaneous' following cautery at (a)24.00 * 0,29h; (b)23,58 ± O.OOh; (c)26.17 _+ 0.15h; (d)36.02 * 0.16h post-pupation. The pattern in (a) consists of a highly modified proximal band which extends towards the lesion rather like an incomplete loop. The scattered band-type scales immediately distal to the lesion (stippled) form a whorl shaped pattern apparently linked to the posterior region of the distal band rather than the proximal as would be expected from a 'loop' type modification. The distal band of the experimental wing is as the control. In (b) a large medial lesion (hole is solid shaded region, lesion stippled) located on the anterior margin resulted in the development of a large region of ectopic band scales which formed a "bridge" extending across the central field from the anterior of the proximal band to the posterior of the distal. In addition, the experimental distal band is displaced slightly medially, (c) consists of a pattern which is extremely poorly developed proxtmally. The few band scales which did form in this region are located more medially than those of the contralateral wing. The distal band is as the control, (d) shows complete failure of the development of the distal band; the proximal band is enlarged and located medially with respect to the control. 118
131 Fig fa)-(c) show three examples of wing patterns forming control-type patterns following operations at (a) 72,16 t 0,22 in a medial location (the lesion which formed is stippled), (b) 25,15 t 0,12 in which a hole (solid shaded region) formed in a distal position and (c) 1.04 * O.OOh post-pupation. 119
132 Fig 3.37 Figure shows the location of lesions (shaded region) on wings which formed non-developing patterns, (a) location of lesions on wings in which the distal and (b) the proximal band failed to form (N» 168, 51 respectively). 120
133 Age Class controls Dependent 18 (100%) 46 (100%) (100%) (90.8%) (24.5%) (5.4%) (3.3%) (0%) (0%) (0%) Independent No. altered patterns N 0 (0%) (0%) ( 2 ( 0 (0%) (9.2%) (75.5%) (94.6%) (96.7%) 100%) 100%) Table 3.3 Distribution of position dependent and position independent pattern alterations following cautery at various ages during pupal development. For each age class the total number of individuals, the number which developed modified wing patterns and the number which developed pattern dependent and independent alterations (with percentage shown in brackets) is given. 121
134 Fig Three figures illustrating the relationship between the vein and pigment patterns following cautery at (a) 35,45 t 0,20h post-pupation in a medial location, (b) 24,07 ± 0,12h post-pupation resulting in a distal lesion (stippled area) and (c) 31,00 + 0,17h post-pupation medially. For clarity the left experimental wing is shown only, m each case the pattern of the right was as normal controls (see fig. 3.12). Following the operation the pigment pattern was altered to form loops (a & b) or a ring (c) The pattern of venation was sometimes completely unaltered (a) although typically local disturbance around the cauterized region was observed (b & c). 122
135 positions tended to affect the nearest band, at more medial locations the relationship between lesion position and affected band was poor. NO patterns seemed to be unrelated to the intensity of the cautery (as judged by the incidence of non-developing patterns with respect to the size of the lesion and size of the hole, if present, in the wing). The frequency with which operated animals fell into each of these classes was related principally to the age at which they were cauterised. Following cautery at 1, 24, & 26h post-pupation pattern modifications were always 'position-dependent'. At 31h post-pupation most patterns were 'position-dependent' (90.8%), at 36h the ratio of patterns falling into 'position-dependent' and 'position-independent' was approximately 1:3 (table 3.3). At 42h predominantly 'position-independent' patterns (94.6%) were formed and similarly at 48h (96.7%). Venation and modified pigment pattern Some features of the venation and pigment patterns in control animals seem to be correlated (see above, fig. 3.12). However, following operations which resulted in alterations in the location of the transverse bands, the pattern of venation was normal. Abrupt changes in the position of the bands were not correlated with the vein pattern (fig. 3.38; compare fig. 3.12). Controls To assess the importance of physical damage inflicted by the needle in influencing the pattern modification produced by an operation, a series of 'sham cauteries' were performed. 24h old animals were used and an operation was performed that was identical in all respects to the experiments above except that the needle was not heated. Of the 4/60 individuals which formed patterns differing from the 123
136 control, all were rings as would be expected following medial cautery at 24h post-pupation (see above). The diameter of these rings was equivalent to the smallest which formed following cautery (see fig. 3.28b). No animals subjected to a sham cautery developed a lesion. The effect of a hot needle placed next to the cuticle was examined in two ways. 68 individuals aged 42h were isolated and a heated needle was placed in close proximity to the cuticle which was not pierced (unlike the experiments above). 16/68 adults had altered wing patterns of which 12 were 'position independent', 3 'position dependent' and 1 'miscellaneous'. 3/68 animals had a lesion on the wing, although none of these individuals had an altered wing pattern. This experiment was repeated having increased the temperature of the needle (» 100 C) and there was an increase in the frequency with which pattern modifications were observed. However, out of 76 animals only 13 survived (compared to the normal success rate of 66.7%) and all of these had large lesions and all but one had a hole on the wing. 7/13 had position-independent pattern modifications, in 5 cases the pattern failed to develop and in one case a miscellaneous pattern modification formed. The other means of mimicing the effect of a hot needle close to the epidermis was by placing groups of 42h old animals in an oven at 45 C for 5 mins. (N=41), 48 C for 15 mins. (N=24), 60 C for 1 min. (N=24), and 64 C for 1 min. (N=24). The wing pattern of all surviving animals was normal. 124
137 DISCUSSION Evaluation of the banding pattern The banding pattern of right and left wings of Ephestia was compared by linear measurement and by comparison of camera lucida drawings. The linear distance separating the transverse bands of right and left wings of a given individual was remarkably constant (table 3.2). Comparing camera lucida drawings of the two wings confirmed this result and justified the use of an unoperated wing as a control for experiments performed on the contralateral side (see fig. 3.15). Comparison of the drawings of the wings was a useful technique because some operations produced pattern modifications which would not have been scored as different by measuring the separation of the bands in the midline. Either the banding pattern was affected only at the extreme anterior and posterior margins (e.g. fig. 3.24c) or the location of the bands was normal but there was a genuine difference in the overall pattern of the two wings (e.g. figs. 3.28c & d). Vein and pigment patterns In control animals the pigment and venation patterns seemed to be correlated (fig. 3.10b & 3.12). However, operations which altered the pigmentation pattern did not alter the location of the veins on the adult wing (fig. 3.38). This suggests that the venation pattern is determined at the time of the operation, although it is possible that cautery is an inappropriate means to perturb the mechanism responsible for its formation. The lacunal pattern in the late larval imaginal disc seems to be instrumental in directing the development of the pupal and adult vein patterns (chapter 2). Since the lacunal pattern is determined late in the final instar it seems likely that the adult vein pattern is determined by the time that cautery can produce modifications to the pigment pattern. Consequently the correspondence between the vein and pigment patterns probably reflects the superposition of two relatively constant patterns rather than the formation of each by a common 125
138 mechanism. Damage inflicted to the adult wing Microcautery of the pupal wing of Ephestia typically results in the formation of lesions and occasionally holes in the adult wing. Scanning electron microscopy of cauterized wings shows that 'lesions' are patches of cuticle without scales (fig. 3.19a). Piercing the epidermis with an unheated needle did not cause lesions to form, suggesting that it was either the heat or the extent of the cell death which was largely responsible for causing their formation. This view is supported by the observation that a hot needle placed next to the cuticle can result in the formation of lesions (and holes). Staining pupal wings shortly after an operation with Trypan Blue demonstrated that cautery kills cells. Lesion formation is, therefore, probably the result of epidermal cells migrating into the wounded area, covering it, repairing the discontinuity and subsequently secreting cuticle. The absence of scales (or sockets; see fig. 3.19) indicates that these epidermal cells do not develop into scale cells. This observation is similar to the situation in hemimetabolous insects in which regenerating structures are only sparsely covered with hairs as compared to normal structures because epidermal cells make a developmental decision to form a bristle cell only at the beginning of the moult after regeneration was stimulated (Lawrence, 1973) There was considerable variability in the size of lesions and holes formed at all ages despite the attempt to perform a "standard operation" in terms of the temperature and duration of cautery. The factors likely to affect the severity of the operation are the temperature of the needle and the duration of cautery. The temperature at the tip of the needle used to pierce the cuticle and cauterize the underlying epidermal cells depends upon the temperature of the heating element. 126
139 the length and diameter of the needle. The element was always allowed to heat for a few seconds prior to each operation hence temperature differences are unlikely to be responsible for variations in the extent of damage, as altering the temperature (from 50 to 70 C) of the needle did not influence the size of or frequency with which holes and lesions formed (fig & 3.19). The diameter and length of the needle was constant, (the latter to within 1mm) although the effective length and diameter of the needle will depend on the depth to which the needle was inserted into the epidermis. Slight, unintentional differences in the duration and depth of cautery could be responsible for variations in the extent of damage to the epidermis. Location of lesions Examination of the location at which lesions formed following cautery at four particular positions on the pupal wing demonstrated a degree of correspondence between the pupal and adult wings (fig. 3.20). Variability in the location of lesions probably reflected variation in the site at which the operations were performed on the pupal wing, since when they were performed in close proximity to a reliable marker (the division of vein M) the distribution of lesions was very consistent. This suggests that there was no major migration of epidermal cells between the pupal and adult stages and, therefore, that the location of presumptive adult pattern elements on the pupal wing can be deduced by comparison of adult and pupal wings. Modifications to the pigment pattern Cautery of the pupal wing can result in modifications to the pigment pattern of the adult. Whether pattern alterations were observed depended on the age of the animal at the time the operation was performed and, at some stages, the location of cautery. Given that a particular operation was located in a position that could 127
140 result in a pattern modification, the time at which alterations were no longer observed defines the point at which scale cells became committed to a particular fate (table 3.1). Operations performed at or later than 60h post-pupation rarely resulted in pattern alterations suggesting that, as assessed by the response to cautery, committment occurred between 48-60h post-pupation (at 20 C). This is in broad agreement with the data of Kuhn & von Englehardt (1933) who suggested that the pigment pattern was determined at 70h (at 18 C). Within the period of development during which the pigment pattern was sensitive to cautery, the precise timing of the operation had a profound effect on the nature of the modification to the pattern (table 3.3). The alterations can either be dependent (observed between 1-31h) or independent (31-48h) of the site of cautery, which is comparable with the data of Kuhn & von Englehardt (dependent 6-36h; independent 36-70h at 18 C), Schwartz (1962), and Wilnecker (1980) in Plodia (dependent 0-35h; independent 30-55h at 18 C). Dependent patterns formed only when the lesion was located within the central field and were essentially of two types; loops and rings. The band affected by a loop depended on the location of the lesion (fig. 3.26). Proximally located lesions affect the proximal band and distally placed lesions the distal band. Loops which formed from medially located lesions were more extreme than those positioned on or close (proximally or distally) to the band (fig. 3.24). The range of loop patterns were comparable to those observed by Kuhn & von Englehardt in Ephestia and following cautery of Plodia (Schwartz, 1962; Wehrmaker, 1959; Wilnecker, 1980). Kuhn & von Englehardt did report that ectopic rings developed following cautery in medial positions but they were rare and not described in detail. Comparable modifications were not formed following cautery of Plodia. The rings varied considerably in form from relatively complete, large rings to groups of rather few ectopic band type scales around the lesion (figs & 3.29). The position of the 128
141 Fig Nature of dependent pattern modifications formed following cautery at different positions relative to the proximal band, (a) site of cautery (solid dot) sufficiently far from the band (vertical line) that the band develops normally and a complete ring forms (b) when located closer to the band the ring of band scales "fuses" with those of the band, (c) is in a more proximal position and a loop develops. Band scales were not induced to form in either of the marginal (proximal or distal) fields (d) nor did a normal band with incomplete (bisected) ring form (e). 129
142 lesion in the anterior-posterior axis did not influence the probability of ring formation, although the nature of the modification was affected. At the extreme anterior and posterior margins of the wing lesions resulted in the induction of an arc of white scales. The range of pattern modifications seen suggest that the formation of the normal banding pattern and the development of loops and ectopic rings occurs via the same mechanism. Rings "blend" with the bands when they formed in close proximity (fig. 3.39b) and around lesions in even more marginal locations loops form (fig. 3.39c). If rings were formed by a completely different mechanism from that responsible for the development of the normal banding pattern, it would be predicted that lesions located close to one of the bands would form a ring overlying a normal band (fig 3.39d). Alternatively, if for some reason scales in the marginal fields were not competent to synthesize white pigmentation then patterns such as that shown in fig 3.39e would develop. Modifications of this kind were never observed, suggesting that interference of developmen. through cautery brings about the formation of white scales in ectopic locations through the same mechanism as that normally responsible for the formation of the bands. The frequency of animals developing position-dependent modifications following cautery at 1h post-pupation was lower than at other stages within this period (see tables 3.1 & 3.3). This is probably best explained in terms of reduced sensitivity to cautery, since operations which were located within the central field, and therefore expected to produce pattern alterations, frequently failed so to do (see fig. 3.36c). The low sensitivity at this stage may be a consequence of the greater length of time between the operation and pattern determination enabling cells to restore a configuration which permits the development of a normal pattern. This is, however, unlikely to be a complete explanation since some individuals formed normal patterns but had holes in the adult wing and dead cells were still detectable with Trypan Blue 24h after the operation. Furthermore, there was no 130
143 Age Class controls Dependent 18 (100%) 46 (100%) 42 (100%) 69 (90.8%) 12 (24.5%) 3 (5.4%) 1 (3.3%) 0 (0%) 0 (0%) 0 (0%) Independent No. altered patter 0 (0%) 18 0 (0%) 46 0 (0%) 42 7 (9.2%) (75.5%) 53 (94.6%) 29 (96.7%) (100%) 3 2 (100%) ns N Table 3.3 Distribution of position dependent and position independent pattern alterations following cautery at various ages during pupal development. For each age class the total number of individuals, the number which developed modified wing patterns and the number which developed pattern dependent and independent alterations (with percentage shown in brackets) is given. 131
144 ANTERIOR..... AAAAAA AAAAAA AAAAAA AAAAAA AAAAAA AAAAAA.. AAAAAR.. AAAAAB.... AAAAAB....AAAABB....AAAABB.... AAAABB.... AAABBA....AAABBA....AAABBA....AAABBA....AAABBA....AABBAA..... A ARRA A..AABBAA..... A A ODA A A A RRA A A ARRA A f..... AAAAAA AAAAXA AAAAXA AAAAXA AAAAXA AAAAAA.. g * f\f\/\f\f\d h f\f\f\f\dd i A A A DD A A A A RY A AAAAYA AAAAYA A A Any A..AAABBA.. j A ARRAA AARRVA A ARRV A A ARR YA A A RR Y A..AABBAA..... POSTERIOR Fig Progression of the propagated wave over part of the pupal wing. Initially all cells are assumed to be in the A state (a), cells in the centre of the wing change state to B and trigger their neighbour to switch to B as well, and then re-enter the A Mate The wave travels unidirectionally from central to marginal position (from right to left in figure)as shown in (b)-(e). Cauterized cells (X) are unable to Darticipate in this process. However their neighbours are normal and wing generation proceeds largely unaffected. Furthermore, cells medial to the ruterized cells are not stranded in the B state, these scales should not form white igment and thus band scales ought not form in ectopic locations (f)-(j). 132
145 difference in the frequency with which lesions and holes formed at 1h post-pupation as compared to other stages (figs & 3.19). The model proposed by Kuhn & von Englehardt to account for the formation of loops suggested that cauterized cells presented a barrier to the propagation of a wave responsible for the specification of the location of the white transverse bands. They did not however give a detailed account of the mechanism by which the wave was supposed to be propagated from cell to cell or the effect of cauterized cells on wave propagation. Wilnecker (1980) suggested that the switching of cells from one state to another offered the best explanation of the philosophy behind the model of Kuhn & von Englehardt, and that cauterized cells were unable to switch state or trigger their neighbours so to do (see fig. 3.7). If examined in detail however this model is unable to explain the development of loops or rings. Fig shows schematically the state of cells in a part of the wing to illustrate the way in which the wave is propagated. Initially all cells are in the A state (fig. 3.40a) and can therefore be triggered by any adjacent B cell to enter the B state. B cells from a more distal position trigger A cells to switch state (fig. 3.40b). After a period of time in the B state they are competent to trigger their proximal neighbours (fig. 3.40c) and subsequently return irreversibly to the A state. Consequently B cells can trigger only more proximal A cells to enter the B state and so the wave is propagated from a medial to marginal direction (fig. 3.40b-e). Fig. 3.40f-j shows the effect that cells which are unable to switch state (X cells) have on wave propagation. In all positions medial to the presumptive transverse bands cells return to the A state as normal (fig. 3.4CH & h). Medial scales are not held in the B state hence band scales would not be expected to form in positions medial to the lesion. In both rings and loops, white scales form in a more medial position than normal and hence their formation cannot be explained on the basis of this model. 133
146 The Wilnecker (1980) model can explain the development of loops by assuming that cautery causes a local "hollow" in the concentration of the agent which provides developing scale cells with information regarding oscillatory activity (see above). The cycling of cells between the two states is altered such that cells in locations around the lesion complete fewer oscillations than normal, hence their fate is altered to one characteristic of more marginal locations (see fig. 3.8b & c). The development of rings can similarly be explained (see fig. 3.8d). These explanations for the development of local pattern modifications require that the gradient profile is labile shortly after pupation. It might be predicted, therefore, that cautery In the medial region of the wing, which corresponds to the putative source of the morphogen would result in the development of a dramatically altered or reduced pattern. However, extra band scales (i.e. rings) form around medial lesions. This can be explained only if it assumed that there are a number of sources along the midline of the pupal wing and that the bands may be located appropriately even in the absence of one (or more) of them. To account for the development of the normal banding pattern and the local pattern modifications following cautery, it is unnecessary to assume that the gradient controls the rate at which cells oscillate and it is their eventual state which determines whether scales deposit white or black pigment. All that is required is that the gradient of positional information specifies the fate of cells directly; that is, low concentrations of the morphogen instruct cells to develop into white scales (e.g. Wolpert, 1969). The additional regions of band scales in Plodia could be formed if cells responded to two separate ranges of morphogen concentration to form band scales. Assuming cautery caused a local decline in the gradient profile, loops and rings could result from cautery at different positions within the central field. Kuhn & von Englehardt explain the formation of the global (i.e. independent) pattern modifications by assuming that during this period the propagation of the 134
147 wave is in progress and is arrested in response to cautery. It would be unambiguously predicted that operations performed early within the sensitive period would result in modifications in which the separation of the two bands is, on average, smaller than from animals cauterized towards the end of this period (see above). A similar outcome would be predicted from the model of Wilnecker (1980) since cell cycle arrest at successively early stages in the process of oscillation would cause cells in more medial positions to develop into band scales (fig. 3.7). If it is supposed that a morphogen provides positional information directly to developing scale cells, one explanation for the formation of global pattern modifications within this period is that the profile is in the process of being established, and cautery prevents further synthesis of the morphogen. Consequently, the development of the gradient profile will be arrested at various stages depending on the time of the operation (see fig. 3.41). This model also predicts that the degree of separation of the bands will be directly related to the age of the animal at the time of cautery. In the experiments described above, the age of animals was known, on average, to within plus or minus 20.0 minutes (N=881; range ± 0 mins to ± 85 mins.; standard deviation = mins.). There was no significant difference between the separation of the bands at the ages at which global pattern modifications were observed; the bands were not closer together following early cauteries. The sequence of global pattern modifications expected on the basis of all of the models was not observed. The two other factors (apart from age) which may be responsible for variations in the extent to which the bands were displaced are the location of the damaged tissue on the wing and the size of the lesion. However, neither of these factors appear to influence the nature of the global pattern modifications (figs & 3.34). 135
148 concentration o
149 Fig Model in which gradient of positional information codes directly for the fate of cells. The morphogen is assumed to be synthesized in the centre of the wing from approximately 31-36h (from the time at which the local pattern modifications are no longer observed), and the final profile is built up gradually through development until commitment (a)-(c). The morphogen concentration at the time the gradient is read determines the subsequent developmental fate of the scale cells; those experiencing a particular range of concentrations deposit white pigment, otherwise black is synthesized (cross hatching indicates the position on the proximal distal axis at which band scales form). The formation of the global pattern modifications can be explained if it is assumed that cautery causes the cessation of morphogen synthesis, hence operations inflicted prior to commitment lead to gradient profiles equivalent to those at other stages in development. The concentration of morphogen leading to the formation of the transverse bands will be in a more medial location than normal (a & b). 137
150 One possible explanation for the absence of an apparent temporal sequence is that the time at which developmental events specify the pattern varies between individuals. However, this does not provide a satisfactory explanation because the data suggest that the timing of developmental events is synchronous: there is a rather sudden switch in the frequency with which position-dependent and position-independent pattern modifications form (fig. 3.43). Between 31-36h post-pupation there is a three-fold reduction in the degree with which position-dependent patterns form and a concommittent seven-fold increase in the occurrence of position-independent alterations suggesting that in the majority of animals the change in developmental state associated with an altered response to cautery occurs relatively synchronously; furthermore, the time at which there is no longer any alteration in the pattern following cautery (committment) occurs in most animals between 48-60h post-pupation implying that in most individuals the pattern-forming process lasts for a similar duration; in addition, a cohort of animals all emerge within 2-3 days of each other (approximately 16 days after pupation at 20 C) suggesting that even over a relatively long period of time developmental events occur synchronously. This data does not suggest a significant variability between animals in the rate of development and it is therefore unlikely that there is any relationship between the timing of the operation and the nature of the global pattern modification. Even if developmental events did occur more rapidly in some animals (see fig. 3.44) it would still be predicted that, on average, earlier cauteries would result in more extreme pattern modifications. For there to be no temporal relationship it Is necessary to assume that the pattern is formed via a series of discrete events which are randomly distributed throughout the period in which the patterns can be modified. Although possible, this seems an improbable means of forming patterns. If administered at an appropriate time in development, cautery results in the global alteration of the banding pattern. In terms of the models presented above, these 138
151 loor age at operation (h) Fig Frequency with which pattern independent (I) and dependent (D) modifications occur with respect to age of operation. 139
152 modifications can be explained by assuming that the operation causes an arrest in the developmental events responsible for forming these patterns. The site of cautery was unimportant for the formation of global pattern modifications, suggesting that the operation affected the pattern-forming mechanism throughout the wing, causing a change in fate of cells at a distance. Although the effect of cautery had been communicated in some way it can not be truely systemic because the contr-alateral wing develops normally. These observations on the effect of cautery are not entirely consistent with the notion that only a small area of epidermal tissue is affected and it is difficult to envisage a means whereby local cautery can exert a global influence. In terms of the models discussed, it is particularly difficult to understand how cautery might cause developmental arrest of cellular activities throughout the wing rather than being restricted to the site of the operation, c One possible mechanism was proposed by Nijhout (1985). He noted that sub-lethal stress inflicted at particular stages of development in a wide range of different animals resulted in the formation of abnormal patterns. Such abnormalities were called phenocopies by Goldschmidt (1938) as, in Drosophila, many aberrations bore a phenotypic resemblance to known mutants. Mitchell & Lipps (1978) linked the development of phenocopies to the change in metabolic activities following environmental stress. Heat treatment, for example, causes the induction of transcriptional activity at a small number of specific chromosome loci and there is an associated, general reduction in RNA synthesis. After a period in which developmental activity is suspended, general transcription is restored, coincident with the cessation of synthesis of heat-induced mrna species. The kind of phenocopy formed depends critically on the timing of the stress but seems to be independent of the stimulus used. Mitchell & Lipps explain this by assuming that the development of particular pattern elements requires the activity of certain sets of genes at specific times in development. In the absence of the gene product an abnormal pattern forms. Phenocopies could form following heat shock 140
153 (and other insults) as a result of inhibition of transcriptional activity at the time when particular gene product(s) were essential for the development of a given pattern element. Exposing a number of species of Lepidoptera to abnormally high or low temperatures at the early pupal stage results in the formation of abnormal patterns, and it was suggested by Goldschmidt (1938) that these alterations are equivalent to the phenocopies observed in Drosophila. Nijhout (1984) demonstrated that administering a standard treatment (-2 C for 24 and 72h) to 3-5h old pupae of Precis coenia, Vanessa cardui and V. virginiensis resulted in the formation of a range of different pattern abnormalities; the patterns were modified to different degrees. Nijhout (1985) suggested that these alterations were phenocopies and that the global pattern alterations observed in Ephestia and Plodia following cautery were also phenocopies. The variability of the extent of the pattern modification was then a feature of the phenocopy. However, this is unlikely to be the correct explanation for the development of global pattern modifications in Ephestia since a range of heat treatments administered at a time when the pattern is susceptible to modification via cautery fails to alter the pattern, and a hot needle placed adjacent to the pupal cuticle affects the pattern only relatively infrequently. A satisfactory explanation for the development of the global pattern modifications remains elusive. The relationship between the severity of the operation as judged by the size of the lesion and/or hole on the adult wing and the likelihood with which pattern modifications occurs is obscure. Cautery results in the formation of larger lesions and holes than merely pricking the epidermis with an unheated needle suggesting a causal relationship. However, there is no relationship between the size of lesions and the frequency with which pattern modifications form or the degree of the pattern alterations (fig. 3.34). In particular, there were cases in which the 141
154 L. G pupation cautery committment >mr time Fig One possible explanation for the formation of different types of global pattern modification following cautery of different individuals at a particular stage in development. The diagram shows the hypothetical timing of developmental events from pupation (solid vertical line) to commitment (double vertical lines) of two individuals The time in development at which animals pupate is the same but in (a) the period in which developmental events which, when interupted by cautery, lead to the development of local pattern modifications (L) takes longer than in (b). Consequently, cautery performed at a precise time after pupation in both individuals (dotted vertical line) lies at different stages in the completion of the process which gives rise to global pattern alterations (G). 142
155 pattern was modified but no lesion was visible on the adult wing. Individuals with modified wing patterns but no lesion may, at the time when a complete cell sheet (possibly cell-cell interactions) was essential for the development of normal pattern, have sufficient damage to interfere with the process of pattern formation. Assuming this to be true, then the difference between the size of lesions on the adult wing may not be a measure of the severity of the operation, rather a reflection on the rate of healing. By staining cauterized pupal wing with Trypan Blue at different times after cautery the rate of healing of different individuals could be compared, although an investigation of this kind would probably be inconclusive because of the considerable variability in the extent of damage immediately and 24h after cautery. 143
156 CHAPTER 144
157 INTRODUCTION Eyespots are a particularly common element of lepidopteran wing patterns. They are usually circular in shape, although elliptical eyespots are quite common, and consist of from one to five concentric rings of differently coloured scales. The centre of the eyespot is invariably located at a point equidistant from the veins bordering a wing sector and the axis of symmetry passes through th'e centre of the eyespot (fig. 4.1a-f). Eyespots are usually restricted to the sector in which their centre lies, they may be truncated at the extreme anterior and posterior by the wing veins, and sometimes they extend into neighbouring sectors (fig. 4.1d 8* e). Usually there is only one eyespot in each sector although in some circumstances there can be two. The most common situation in which two eyespots are found is where eyespots develop in the medial and distal region of the same sector (fig. 4.1f). Ocelli develop "side-by-side" only in a composite sector that originates from the fusion of two pupal sectors in which the central vein is not represented on the adult (fig. 4.1g). The occurrence of eyespots in all Lepidoptera complies with these general principles and, on this basis, Nijhout (1978) formulated a model to explain the mechanism by which they develop. He suggested that the concept of Positional Information (Wolpert, 1969; 1971) provided the best framework in which to construct a model and that, although the precise mechanism by which cells acquire information about their relative position in a field is unknown, a gradient mechanism was conceptually easiest to understand (see chapter 1). Nijhout suggested that scale cells measure the local concentration of a morphogen and respond to the level they experience by synthesizing and/or depositing a particular pigment. In a two dimensional field of homogeneous cells it is straightforward to explain the development of a circular pattern, since a morphogen produced by a small number of cells (perhaps only one) would diffuse equally in all directions. A ring of cells at an equal distance from the source will experience the same concentration of morphogen and will therefore deposit the same pigment in their scales (fig. 4.2). 145
158 CT O cn (Q
159 Fig. 4.1 The range of eyespot morphologies observed in the Lepidoptera. In all cases proximal is towards the top of the page, (a) shows a simple eyespot consisting of three concentric rings of differently pigmented scales. The centre of the eyespot is positioned midway between the adjacent wing veins. The most common non-circular eyespot pattern is that of an ellipse (b & c). Regardless of the precise form of the ellipse, the axis of symmetry almost always passes through the origin and runs parallel to the adjacent wing veins. Eyespots can be restricted to a single sector and truncated anteriorly and posteriorly by the wing veins (d) although it is quite common for the eyespot to transgress the veins (e). Occasionally two eyespots form in a single sector, in which case they are usually located at the distal margin and the other is medial or proximal (f). Since not all larval lacunae form pupal veins and not all pupal VBins are represented on the adult wing (see chapter 2), adult sectors may represent a composite of two sectors from the larval or pupal wings. Eyespots developing "side-by-side" in the same sector (g) always lie on opposite sides of the position at which the pupal vein or larval lacuna would be located on the adult wing had it formed (indicated by the dotted line). 147
160 cone. a-p p-d Fig. 4.2 Gradient model to explain the formation of concentric rings of pigments in eyespots. The vertical axis represents the concentration of a morphogen produced by a small number of cells located at a point along the midline of the sector. Assuming the morphogen diffuses monotonically (although the gradient profile is represented diagramatically by a straight line in the figure) and at the same rate in all directions a "cone-shaped" profile will be established. If it is assumed that the response of all wings cells to a low concentration of morphogen (below [X]) is to synthesize white pigment, to produce brown pigment at intermediate concentrations (above (X] but lower than [Y]) and black pigment at high concentrations (above [Y]), then an eyespot consisting of black:brown:white will form 148
161 a b proximal Fig. 4.3 Dislocated pattern elements, (a) and (b) show patterns in which the path of the band is altered at the intersection of successive veins. Dislocated pattern elements can be "translocated" proximally or distally. In (c) a row of eyespots is apparently interrupted (after Nijhout, 1978). 149
162 A change in the way in which cells interpret a particular concentration of morphogen would lead to the deposition/synthesis of a different pigment, so different sequences of pigment rings can be generated. For example, if scale cells responded to high concentrations of morphogen by depositing blue pigment instead of black (see fig. 4.2) then an eyespot consisting of the pigment rings blue:brown:white would develop. The formation of differently-structured eyespots in different species could be explained by differences in interpretation and some preliminary evidence from interspecies grafts suggests that this may be the case (Nijhout, 1986). In some species the sequence of colours differs between different eyespots on the wing, suggesting that the pattern of interpretation of positional information within each sector may differ. Two phenomena support this view. Nijhout (1985) analysed variations in the pattern and relative size of eyespots in two lepidopteran species, Ceryonis pegala and Smyrna blomfildia, and demonstrated that variations in the pattern in one sector tended not to be correlated with variations in adjacent sectors. The phenomenon of "dislocation" in which pattern elements such as transverse bands are interupted by wing veins (fig. 4.3) also supports the suggestion that interpretation of positional signals is independent in different sectors (Nijhout, 1978). The colour pattern of the wing as a whole may, therefore, be best thought of as a mosaic of independent sectors each of which forms a pigmentation pattern in precise spatial relationship to discrete reference points within each. On the basis of these observations Nijhout (1978) proposed that the development of eyespots was dependent upon the activity of small groups of cells (termed foci) located in each sector. Foci act as sources of morphogen to which scale cells respond and, according to the precise concentration and the mode of interpretation, synthesize particular pigments. Species and sector specific interpretations of the positional information would offer an explanation for differences in the detailed pattern of eyespots. Sectors lacking eyespots may do so either because a focus is inactive (producing no morphogen) or the scale cells do not respond to its signals 150
163 host eyespot veins graft-induced eyespot Fig The pigment pattern of an ectopic eyespot induced to form following a graft of the presumptive focus from another animal into a region close to the host eyespot. The pigment rings formed by the influence of the graft correspond to the two outer rings of the normal eyespot. The oucer pigment ring of ectopic and normal eyespots often fused (drawn from Nijhout, 1980a). 151
164 This model enables a number of predictions to be made as to the results of experimental manipulations. It should be possible, by eliminating or moving a small number of cells (the focus), to influence the development of pattern in a large number of surrounding scale cells. In an elegant series of experiments Nijhout (1980a) demonstrated the existence of a focus on the dorsal surface of the forewing of Precis. Cautery performed over most of the surface of the pupal wing produced only minor defects in the pigment pattern of the resulting dorsal forewing of the adult however, after killing approximately 300 cells at the presumptive centre of the large posterior eyespot, the diameter of the ocellus which eventually formed was dramatically reduced. From the published photomicrographs, it appears that the effect of the operation on the pattern of the eyespot was principally in the proximal-distal axis (Nijhout 1980a; figure 2), and only in extreme cases was the size of the ocellus in the anterior-posterior axis affected. The extent to which the diameter was reduced depended upon the age of the animal at the time the operation was performed. The sooner after pupation the presumptive centre of the eyespot was cauterized, the greater the effect on the size of the resulting ocellus. Operations after two days at 29 C and five days at 19 C had no influence on the diameter of the eventual eyespot and resulted only in the development of a lesion at the site of cautery. Nijhout (1980a) also performed a series of grafting experiments in which he transplanted small squares of cuticle with underlying epidermis into a different location. Grafting the region of tissue corresponding to the putative focus into a more posterior sector resulted in the development of an ectopic, supernumerary ocellus in the tissue surrounding the graft, although the size of the resulting eyespot was always smaller than normal. Grafts taken from other (non-focal) locations on the wing never altered the pigment pattern of the surrounding host tissue in this way. The ectopic pigment rings of the supernumerary eyespot were characteristic of the the outer two (of four) rings of the normal eyespot suggesting that the strength of the signal emanating from a grafted focus was less than normal or that the signal emanating from a grafted focus into the surrounding host was attenuated by the presence of wounding at the graft-host interface. The site in which the graft was placed was close to the normal eyespot and occasionally the outer pigment rings of the host and ectopic eyespots fused (fig. 4.4), which was taken to indicate that 152
165 the pigment pattern of the ectopic and host eyespots was homologous and that their mechanism of formation is equivalent (Nijhout, 1980a), These grafting and cautery experiments provide rather convincing evidence that the eyespot of Precis coenia is formed as a result of the activity of a small group of cells located at its centre and the predictions of the gradient model are in reasonable accord with the observations (fig. 4.5). (L However, in a subsequent series of experiments, Nijhout (1985) reported an apparently contradictory set of results following cautery. The normal pattern of the dorsal hindwing of Precis consists of two eyespots surrounded by a large area of brown pigment. Operations performed on the dorsal surface of the hindwing (as opposed to the forewing in the experiments described above) resulted in the induction of supernumerary eyespots surrounding the lesion, provided the location of the operation was within the presumptive brown pigmented region of the wing. The period in which this response to cautery could be demonstrated was identical to that which resulted in the diminution of the forewing eyespot. Nijhout suggested that the size of the ectopic eyespot(s) formed in response to cautery was directly related to the severity of the operation. Cautery inflicted for a short duration and apparently resulting in relatively little cell death, lead to the development of only a black ring of pigment whereas more severe cauteries induced large supernumerary ocelli resembling the eyespots normally found on the hindwing. Hindwing ocelli were usually unaltered following cautery of their central region although occasionally a slightly smaller eyespot developed. The simplest explanation of these results, that the effect of cautery somehow mimics a focus and causes morphogen to be produced in the region of the lesion, is unlikely, not least because it is inconsistent with the earlier results in which eyespot formation is inhibited and sometimes abolished following removal of what was taken to be the morphogen source An alternative explanation of these results is that the fore and hind wings develop in different ways, and the formation of eyespots on each occurs via completely different mechanisms which respond differently to cautery. The model developed by Nijhout (1978) proposed that the formation of pattern in different sectors is independent but relies on the same basic mechanism. Differences in the detailed pattern of sectors within an individual are frequently of a minor nature and Nijhout (1986) suggested that they reflected 153
166 13 X 'OUOO LO enssi.i
167 Fig. 4.5 Gradient model interpretation of the grafting and cautery experiments of (Nijhout 1980a). In each figure the way in which one half of the eyespot pattern is specified is shown; the eyespot is symmetrical and the formation of the remainder occurs by precisely the same mechanism. Diffusion of morphogen from a focal source would establish a monotonic gradient, illustrated diagramatically, for the sake of simplicity by, a straight line, a shows the normal gradient profile and the sequence of pigment rings specified. Following cautery (indicated by the asterisk) of most or all of the cells synthesizing the morphogen, the concentration gradually declines (b) and an abnormal gradient profile becomes established (c). The eyespot is reduced in size in all dimensions, the ce.itral pigment ring is absent and, if the operation is performed sufficiently early during the establishment of the gradient, it can be virtually eliminated (assuming that morphogen-producing cells are unable to regenerate or neighbours to assume their role), d shows the gradient profile produced following grafting the region corresponding to the focus into a part of the wing not normally destined to form an eyespot. The grafted tissue is shown cross-hatched (XX) and acts (as normal) as a morphogen source. Assuming perfect communication between graft and host cells a normal gradient profile would be expected to form and result in the formation of a normally sized and patterned eyespot (as a). The formation of supernumerary eyespots which are reduced in size can be explained if the concentration of morphogen reaching the host tissue is lower than normal because of the presence of wounded tissue. 155
168 subtle variations in the expression of a common pattern forming mechanism. Considering the monophyletic origin of the Lepidoptera, Nijhout (1978; 1986) further proposed that the formation of wing pattern throughout the group could be explained on the basis of the same model. It is unlikely therefore that homologous structures (eyespots) in the same individual are formed via different mechanisms. Many phenomena resulting from experimental interference with developmental systems have been explained using a gradient based model implicating a small number of cells as having a special, organizing role in the formation of pattern. The cautery and grafting experiments of Nijhout are particularly important in that some of them provide convincing evidence of the existence of an organizing region (the focus). It is of value therefore to determine whether this phenomenon can be observed in other Lepidopteran species and to resolve the apparent contradiction in the results following cautery. 156
169 MATERIALS AND METHODS a)rearing Livestock was kindly provided and maintained by Dr. Paul Brakefield, University College Cardiff, from stock originally derived from fertilized female Bicyclus safitza (Lepidoptera; Rhopalocera; Satyrnae) caught at in Kenya in August For experimentation, eight to twelve adult Bicyclus safitza, including four to five females, were kept in cages (0.5m x 0.5m x 0.2m) at a temperature of 28 C, were maintained at high humidity under a light.dark cycle of 14:10 and provided with moistened, rotting banana as a food source (Brakefield, pers. comm.). Tropical broad-leaved grass species were used as food plant for emerging first instar larvae; late first and subsequent instars were provided with fresh grass (temperate species) daily. Approximately four to five weeks after egg laying, final instar larvae changed colour from bright green to a rusty-brown colour, ceased feeding, sought a site to pupate, and entered the immobile prepupal stage. Pupation was controlled photoperiodically and in mosts cases occurred two to six hours after "dark". Adults emerged approximately seven to ten days later. b)experimental Animals Experimental animals were.isolated at the prepupal stage and observed at regular intervals, particularly during the early part of their subjective night, to determine accurately the time at which they pupated (see chapter 3). Individuals were cauterized as described in chapter 3; the site of cautery was located wfth reference to the pupal veins (see below). i c)examination of Results For examination the wings were glued onto microscope slides using Euparal and the pattern scored using a binocular microscope. The area of eyespots and lesions were determined by measurement with a He/vlett Packard Image Analyser and the results analysed using the MINITAB statistical package. 156
170 RESULTS Normal Wing Pattern Fig. 4.6 shows the normal wing pattern of Bicyclus safitza. The dorsal surface of the forewing bears a clearly defined eyespot located towards the anterior margin of the wing (fig. 4.6a). The centre of the eyespot is white and is surrounded by concentric rings of black and gold pigmented scales. Proximal to the anterior eyespot was a band of gold pigmented scales which extended from the anterior margin of the wing to sector M3 (see fig. 4.7a for vein nomenclature). In the posterior part of the wing there is a small region of white pigmented scales which is usually surrounded by a large ring of darkly pigmented scales, although often the dark background colouration in this part of the wing makes this outer ring obscure (particularly on the proximal side in males). The underside of the forewing has a small anterior eyespot and a large posterior one (fig. 4.6b). The sequence of concentric pigment rings is the same as that of the anterior eyespot on the dorsal surface. The outer concentric rings of the large posterior eyespot always extend into the sectors adjacent to that in which its centre is located. Occasionally additional eyespots developed on the dorsal and ventral surface of the forewing. They usually formed in an equivalent position on right and left wings of the individual, were typically small and, although occasionally lacking the white pupil, the sequence of colours was as normal. Most experiments were performed on the dorsal anterior eyespot because of the relative ease with which its extent could be discerned. In the anterior eyespot the outer gold pigment ring is always present and sharply contrasts the brown pigmentation in that region of the wing (fig. 4.6a). The background colour of the wing in the vicinity of the posterior eyespot and the fact that almost all operations in this region resulted in the suppression of the outer gold ring, made the limit of the posterior eyespot extremely difficult to score. The ventral forewing eyespot is usually the largest of all the ocelli (fig. 4.6b). The inner pigment ring is formed of white scales, the area of which is usually equal to that of the posterior dorsal eyespot (see fig. 4.8c). Well developed black and gold rings surround the central white spot. There are usually two additional outer pigmented rings of dark and light brown scales, although they are typically more diffuse than the inner three rings. 157

171 Fig. 4.6 The pigment pattern of the adult wing of Bicyclus safitza. a shows the dorsal surface of the forewing, b the ventral forewing. The dorsal surface of the hindwing is uniformly pigmented light brown with no banding or eyespotting pattern and is not shown. The pattern of the ventral surface of the hindwing differs between the two seasonal forms of the animal, c shows the wet seasonal form and d the dry seasonal morph.
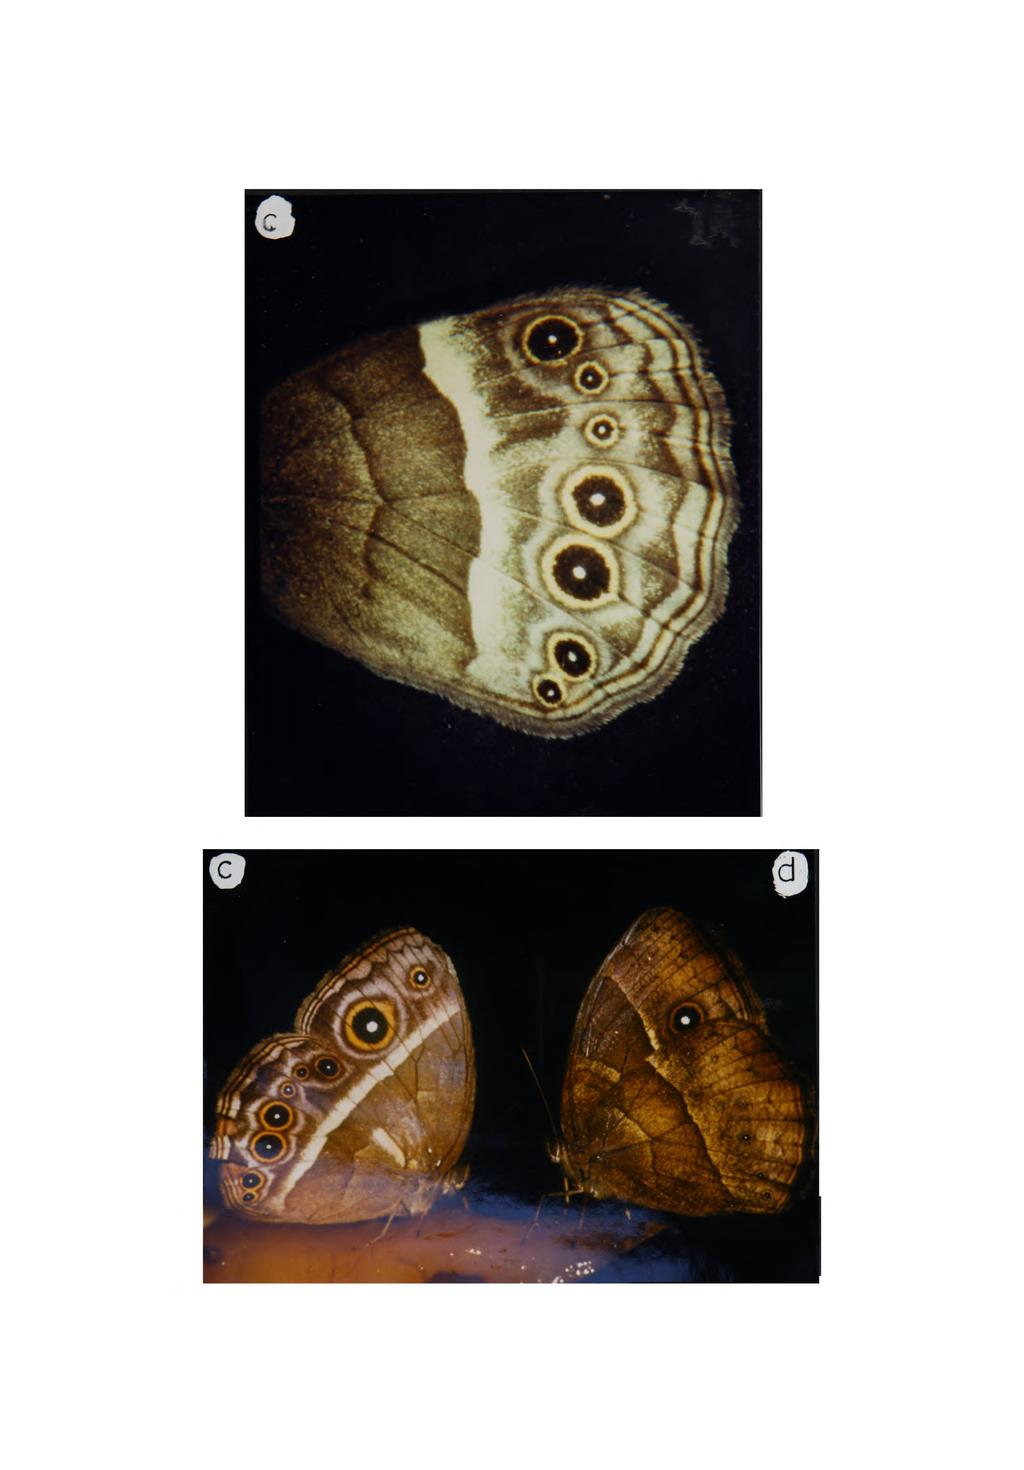
172
173 The dorsal surface of the hindwing is uniformly gold in colour whereas that of the ventral surface has a series of up to seven eyespots and a number of transverse bands (fig. 4.6c). When fully developed, the pigmentation of successive pigment rings of each eyespot is the same as that on the forewing; white, black, gold, however, the number, size and detailed pattern of the ventral hindwing eyespots varies according to the seasonal form of the animal. The difference between the two seasonal forms is expressed in pattern differences of the ventral hindwing only; extreme "wet season" forms have a full complement of large eyespots whereas in the "dry season" form often only 4-5 ocelli are represented each of which is considerably smaller than usual (fig. 4.6d). The sectors lacking eyespots usually have a small number of white scales in the position at which wet season ocelli would torm. A range of intermediate forms are observed (Brakefield, pers. comm.). The epidermis which forms the dorsal surface of the forewing is responsible for the secretion of the overlying pupal cuticle and, shortly after pupation, adheres tightly to the cuticle it has secreted (Kuhn, 1971; see chapters 2 & 3). The experiments below are mainly concerned with the more accessible dorsal wing surface and, since the anterior eyespot can be scored more reliably, most work concentrates on this ocellus. Location of the presumptive eyespot on the pupal wing To examine the effect of disturbing the focus of a developing eyespot upon the resulting pattern of the adult it was important to determine the position at which the presumptive centre of the developing eyespot was located on the pupal wing. The correspondence defect mapping of the Bphestia adult and pupal wings (chapter 3) suggests that there was a good correlation between the relative position of cells on the oupal wing and that of structures which they give rise to on the adult. Assuming that this relationship is true also of Bicyclus it would be predicted that the developing eyespot on the pupal wing would occupy the same relative position as the fully developed eyespot on the adult wing. The anterior eyespot of the dorsal forewing of Bicyclus is reliably located in the Mj-M2 sector of the wing (figs. 4.7 & 4.8). Its relative position on the adult wing was assessed by measuring the distance from the pupil to the distal and proximal extent of the sector and expressing the distances as a ratio. The mean position for 34 unoperated control animals is shown together 158
174 159 CM
175 Fig. 4.7 Determination of the relative position of the anterior eyespot in its sector, (a) shows a camera lucida drawing of the forewing of Bicyclus illustrating the position of the centre of the anterior eyespot in sector M-J-M2 with respect to c the pattern of venation (labelling of the veins after Nijhout, 1985). X is the distance from the wing margin to the centre of the eyespot and Y that from pupil to the point on the vein which closes the sector proximally (CV1). The ratio of the two distances (X/Y) was 0.72 (n=34, standard deviation=0.056). The closed circle in sector M-J-M2 marks the mean position of the eyespot and the bars extending proximally and distally represent 99% confidence intervals. (b) is a camera lucida drawing of a pupal wing showing the vein pattern labelled to illustrate the relationship between pupal and adult veins. In sector Mj-M2 the distances X and Y and the 99% confidence limits are precisely equivalent to those of the adult wing (a). The proximal extent of the sector, since vein Mj is angled proximally, was defined as the point at which a line drawn along the midline of tha sector and vein M-\ crossed. Assuming there is no allometric growth, this should mark the position at which the presumptive centre of the eyespot will develop in the pupal wing. 160
176 o 161
177 Fig. 4.8 (a) & (b) are Camera lucida drawings of the anterior portion of the forewing of Bicyclus\Q show the position of the eyespot in sector M- -M2 (see fig. 4.7 for vein nomenclature). The drawing of the right wing has been reversed, is shown by the dotted lines and is superimposed on that of the left. The close correspondence in the position of the ocelli of right and left wings indicates that the eyespot is located symmetrically, (c) shows part of the left wing of an individual indicating the anterior and posterior eyespots (solid lines). The pattern of the ventral eyespots has been overlaid and drawn in dotted lines. Both dorsal eyespots are positioned immediately above those on the ventral surface of the wing. 162
178 with 99% confidence limits in fig. 4.7a. The limited extent of the confidence interval and the low variance (0.003) indicates that there is very little variability in position of the eyespot between right and left wings of an animal and between different individuals. Given a direct correspondence between the pupal and adult wings the centre of the developing eyespot should be located at the same relative position on the pupal wing, as shown in fig. 4.7b. Examination of this region of the wing in recently pupated Bicyclus pupae demonstrated that the predicted position of the centre of the eyespot was sometimes coincident with a small area of white pigmentation midway between the wing veins (although the ease with which this marker could be discerned depended critically on the age of the pupa and the morph, both factors which affect the pigmentation of the pupal cuticle). In individuals in which this pigmented patch developed (c. 40% cases) it was used as a marker to identify the prospective focus; in cases where the white spot was absent the predicted position of the eyespot was calculated from the measurements of the pupal wing (as fig. 4.7b). Symmetry of pattern on Right and Left Wings Operations were performed on the left wing only as it was hoped that the right wing pattern would provide a control for any alterations to the left caused by an operation. For this assumption to be justified it was necessary to demonstrate that the pattern of right and left wings is symmetrical. Pattern symmetry was assessed by comparing the relative position, size and the composition of the anterior eyespot of 34 unoperated animals. a)position of the Eyespot The relative position of the eyespot was determined, as above, by calculating the ratio between the pupil-proximal margin and pupil-distal margin of sector M-J-M2 for left and right wings. 34 unoperated individuals wece examined and no significant difference in the ratio could be demonstrated (P > 0.001). This was confirmed by superimposing camera lucida drawings of the anterior part of the wing of right and left wing of a number of individuals (fig. 4.8a & b). In all cases the position of the eyespot corresponded, indicating that the eyespot was located symmetrically on the two wings of an individual. Comparison between the patterns of dorsal and ventral forewing shows that the eyespots occur in the same sectors and their precise positions 163
179 a) Right Left Proportion of eyespot White Black Gold N = SD = N = SD ^ Diameter of eyespot in axis Proximal-Distal Anterior-Posterior b) Students-t Significance NS NS NS 0.80 NS 0.10 NS Area of annulus M (unshaded) = />/(m 2 - n 2 ) where m = diameter of unshaded annulus n = diameter of stippled central circle Area of annulus 0 (cross-hatched) - /7/(o2-m2 ) where o - diameter of cross-hatched annulus m = diameter of unshaded annulus Table 4.1 Table shows the results of measuring size and constitution of the anterior eyespot of left and right control wings. Diagram illustrates the way in which eyespot size and constitution was calculated. The eyespot consists of three concentric rings of different pigments. The diameter of the central ring (n) and outer two annuli (m & o respectively) was measured parallel to the proximal-distal axis for left and right wings of 34 unoperated individuals. Table 4.1a shows the proportion of the eyespot formed by white, black and gold pigmented rings and the mean diameter (in mm) of each of the pigment rings of 34 control animals for left and right wings. Table 4.1b shows the results of comparing the diameters of each of the concentric pigment rings for right and left wings. The figures given are the value of t and the p r obability of a significant difference between the diame er of a ring on the right and left wing. 164
180 correspond; the ventral ocelli (although derived from a different cell layer) are located immediately beneath the dorsal ones (fig. 4.8c). b)size and Composition of the Ocellus The camera lucida drawings of the right and left wings suggest that the overall size (diameter) and the contribution made by each of the three pigment rings of the eyespot was consistent within and between individuals (fig. 4.8a & b). Measuring the diameter of each of the pigment rings of 34 control animals demonstrated that there was no significant difference between o-c?5 the diameter of ocelli on right and left wings of an individual (P >,&00T; table 4.1). Furthermore, there was no significant difference between the percentage contribution made by the three constituent pigments rings of the eyespot 0-0$ between right and left wings of an individual (P > JJUW1; see table 4.1). These results suggest that that the eyespot pattern of right and left wings is symmetrical with respect to both location and constitution. The striking degree of symmetry between patterns of right and left wings of an individual was further demonstrated in animals which formed additional pattern elements (fig. 4.9) on the forewing (either dorsally or ventrally). These were scored for their degree of symmetry and only rarely were asymmetric patterns observed (typically a rudimentary ocellus developed on one wing and was absent on the other). These observations justify the use on the contralateral wing as a control in the experiments described below. Location of Operation Sites on Pupal and Adult Wings To examine the effect of cautery on the development of the wing pattern of Bicyclus five sites on the pupal wing were chosen. Since the eyespot in sector Mj-M2 was more distinct than that in Cu2~Cu3 the prospective anterior eyespot was selected as the major focal site, although some operations were also performed on the presumptive posterior, eyespot. Three non-focal positions were selected as controls (fig. 4.10). To examine the effect of non-focal cautery in a sector which normally supports eyespot formation, animals were cauterized at site A located in the proximal part of sector M-J-M2 Two sites were selected in sectors in which eyespots do not normally develop; site B was at the same proximal-distal level as A but located in the immediately posterior sector (M2~M3). Site C was in the same sector as B but located towards the distal margin of the wing. 165
181 CD CD
182 Fig. 4.9 Symmetry between the pattern of right and left wings, a-e show pairs of camera lucida drawings of right and left ventral anterior eyespots from five individuals. In b-e an additional small ocellus developed in the anterior sector which was confluent with the main eyespot; in each case the pattern was symmetrical. White pigmented regions are stippled, gold unshaded and black is cross hatched. 167
183 Fig The location at which cautery was performed on the pupal wing and the position at which lesions formed on the adult. Upper figure shows the five sites at which pupae were cauterised and the lower figure shows the position at which lesions formed on the adult wing following each cautery in the upper diagram. Scale bar is 5mm 168
184 The location of a lesion on the adult wing corresponded to the region cauterised on that of the pupa; proximal operations resulted in the formation of lesions located in the proximal part of sector M-J-M2 of the adult. There was some variation in the location of the lesions from operations judged to be at a constant position on the pupal wing (fig. 4.10b). One possible explanation for this variation is error in determining the precise location on the pupal wing, although errors matching corresponding points on pupal and adult wings are likely to be exaggerated because a large lesion can form following cautery directed at a precise point. At every site animals were cauterized at a range of ages from 1h to 24h post-pupation and a few experiments were also performed on older animals. The age of every individual was known to within 1h (see methods; see also chapter 3). I. Effect of Focal Cautery on the Pigmentation Pattern Most of the cauteries were performed on the prospective anterior eyespot on the dorsal forewing hence the following analysis concentrates on this ocellus unless otherwise stated. The operation usually resulted in the formation of a patch of naked cuticle lacking scales (a lesion), the scale density around the lesion was almost always reduced and in some cases the operation caused the formation of a hole (< 2%). Sometimes, particularly in individuals in which a large lesion formed, the positions of veins M-j and/or M were altered, being deflected towards the lesion. Quite commonly in the area immediately surrounding the lesion, there was a region sparsely covered with small, transluscent scales. These are found throughout the wing but lie beneath the larger pigmented scales from which the colour pattern is constructed. Consequently these small scales are not normally visible. Occasionally the lesioned area was quite extensive and in such instances it was impossible to determine the effect of the operation on the pigment pattern. The cuticle in the immediate vicinity of the operation was usually distorted, although the small area of damage relative to the size of the dorsal eyespot rarely prevented the pigment pattern from being scored (c. 5% were unscorable). Lesions only rarely developed ventrally, however, because the two wing surfaces are tightly apposed, distortions of the dorsal surface are mirrored ventrally. Consequently the pattern of the ventral anterior eyespot, which is 169
185 90 N 45 0 * - *1»*!>' ' f *&* i;'sy Kiv, i 1!/'''^'..-.#.-; ^1 *ij'.i?«ft ^ *r $«$ *t m «I* A-* KSfe s ^ ^g t'as ivgv^ >.'- >: H.K ^i^**r ^B-'r»: if «fi rf ^ 90 N 45 area (u3 xio"6 ) Fig The relationship between lesion and eyespot size. Upper figure shows the ranges of sizes of lesion observed following cautery and the lower diagram the variation in the area of control eyespots. The number of animals falling into each class (N) is shown on the ordinate and the abcissa shows the area (u 3 x 10~ 6 ). 170
186 considerable smaller than the dorsal was usually difficult to score accurately and is not considered in detail below. Following focal cautery a lesion developed on the adult wing in all except one animal and in only 8/226 individuals white scales were observed in the centre of the dorsal anterior eyespot. The absence of the white scales partly reflects the large lesion size relative to the area normally covered by white scales (average control area of white scales and mean lesion size were 64.5 x 10 u o 2 and 439 x 10 u respectively) but also the accuracy of the location of the operation indicating that the centre of the prospective eyespot was reliably cauterized. o o To assess the effect of the operation on the eyespot, the overall size of the control and experimental eyespots were compared and the total area of each of the three constituent pigment rings was measured. To calculate the area of the experimental eyespot the area of the lesion was included. This was justified because of the relatively small area of the lesion relative to the normal eyespot size (19.1%; see fig. 4.11). For example, if it is assumed that a particular operation had no effect on the eyespot size, provided that the lesion was centrally located, it would be totally enclosed within the eyespot. Consequently, measuring the overall area of the experimental eyespot including the lesion would produce a result identical to the control. The effects on the pattern following focal cautery were classified as follows: 1)No effect There was a local patch of damage at the site of the lesion but no influence on the overall size and/or pattern of the eyespot. 2)Partial Eyespot A partial eyespot formed either proximal or distal to the lesioned tissue. It is likely that this category of pattern modification results from inaccuracies with which the site of cautery was located because the lesion was usually eccentric and white pigmented scales developed. This class of pattern alteration was observed only extremely rarely (2 individuals at or after 24h post-pupation, 2 at 6h and 1 at 1h) and is not considered further. 171
187 Fig Focal cautery at 18±0,08h post-pupation resulting in a reduction in size of anterior and posterior eyespots. Scale bar is 1mm. a shows the experimental wing and b the control.
188 3)Reduction The area of the eyespot was reduced as compared to the control (fig. 4.12). 4)Enlargement The area of the experimental eyespot was larger than that of the control (fig. 4.13). Care had to be taken scoring this category of pattern modification because of the inclusion of the area of the lesion (see above). For example, if an operation had no effect on the development of the pattern but resulted in the formation of a lesion larger than the control eyespot the animal would be scored as having an enlarged ocellus, however there was not a single individual in which the lesion area exceeded that of the control eyespot. Another potential source of error would arise if the lesion was located eccentrically such that most of its area lay outside the domain of the eyespot. However, since almost all operations lead to the elimination of the white pigmented region of the ocellus (and the area of the lesion was small relative to the control eyespot), this is unlikely to be a major source of error. Relationship Between Age and Pattern The effect on the dorsal anterior eyespot pattern following cautery was correlated with the precise age at which the operation was performed (figs & 4.15). Cauterizing the prospective centre of the eyespot early in pupal development (1h to 6h post-pupation) resulted in a significant increase (P < 0.05) in the area of the eyespot formed, operations performed between 12h and 18h had no effect on the size of the ocelli (P > 0.05) whereas operations inflicted at or after 24h resulted in a reduction in eyespot area (P < 0.05). The average increase in eyespot size following cautery at 1h post-pupation was larger (P < 0.05) than following operations performed at 6h post-pupation (fig. 4.15). The eyespots which developed following focal cautery consisted of a central lesion surrounded by black and gold scales and typically lacked the white central pigmentation (that region of the eyespot was occupied by lesion). Furthermore, the relative contribution of the pigment rings to the eyespot seemed Comparable to a control ocellus although it was difficult to quantify the constitution of the eyespot following an operation because 172
189 Fig Focal cautery at 1tO,08h post-pupation resulting in an increase in the area of the anterior eyespot on the experimental (a) wing. In addition a partial eyespot formed at site C. b shows the control pattern. Scale bar is 1mm.
190 20 O- 0 1 f ratio expt/ctrl area 4=1 173
191 Fig The relationship between age at the time of the operation and the the size of the anterior eyespot. In each diagram the ordinate shows the number of animals and the abcissa the ratio between the area of the experimental and the control eyespot. The scale is drawn only for a but is identical for each figure, a shows animals cauterised at 1h (n=53) b 6h (n=49), c 12h (n=52), d 18h (n=41), e 24h (n=26). The arrow on the x-axis of each figure shows the mean ratio of experimental/control eyespot area. The distribution of the ratio of areas for control animals is not shown because on this scale it would consist of only a single bar (mean ratio left/right wing with 95% confidence limits = 1.05 ± 0.32). 17A
192 2 T o *"'.Q +-» age at operation 24 Fig The relationship between the change in area of the anterior eyespot and the age at which the operation was performed. The ordinate shows the ratio of the area of the experimental eyespot relative to the control and the bars are 95% confidence limits. The abcissa shows the age of the animal at the time of the operation (hours). ** 175

193 Fig The effects of cautery on the ventral posterior eyespot following an operation performed at 1±0,00h post-pupation, b shows the control pattern.
194 of the presence of the lesion, which occupied a part of the wing where white and some black scales would be expected to form. Although difficult to score reliably, the pattern of the anterior ventral eyespot seemed to be affected by cautery in a similar way to the other ocelli; increases and decreases were observed at low frequency. Relatively few operations were performed on the posterior focus because of the difficulty scoring the pattern (see above). In all cases the area of white pigmentation of the dorsal eyespot was replaced by a lesion indicating that the pigmented patch on the pupal cuticle corresponds precisely with the prospective centre of the eyespot. Of the 22 scorable animals which were cauterized between 1 and 30h post-pupation, in only 2 cases was there an increase in the area of the eyespot (at 1h and 30h) and in only 2 animals (both cauterized at 1h) was there no effect on the eyespot area relative to the control. In all other cases there was a reduction, up to 50%, in the area of the eyespot (see fig. 4.12). The ventral posterior eyespot never bore a lesion, in 15/22 cases (68.2%) its area was reduced by up to 50% in extreme cases (e.g. fig. 4.16) although more typically the eyespot was about two thirds of the size of the control. Enlargement of the ventral eyespot was not observed. The effect on the dorsal and ventral patterns of the posterior eyespot was not always correlated. For example, the two individuals which had increased eyespots dorsally both had reduced ventral eyespots and in both cases in which there was no effect on the dorsal eyespot the size of the ventral eyespot was reduced. There seemfed to be no correlation between the pattern modification formed following cautery of anterior and posterior eyespots. Of 21 cases in which the pattern modification to anterior and posterior eyespots could be scored, 9 resulted in the reduction of both ocelli but in 8 instances the posterior eyespot was reduced and the anterior enlarged. In 1 case both were enlarged and in 2 instances the posterior was unaffected and the anterior reduced. 176
195 a) AGE > 24 DAMAGE/ NO EFFECT 10 (31.2) 11 (42.3) 18 (60.0) 13 (56.5) 34 (89.5) BAND BROADENED ECTOPIC POOR ECTOPIC INDUCED ECTOPIC DRAWN TO LESION SCALES OCELLUS OCELLUS 12 (37.5) 5 (15.6) 3 (9.4) 2 (6.3) 14 (53.8) 1 (3.8) 0 (0.0) 0 (0.0) 4 (13.3) 6 (20.0) 2 (6.7) 0 (0.0) 7 (30.4) 2 (8.7) 1 (4.3) 0 (0.0) 4 '(10.5) 0 (0.0) 0 (0.0) 0 (0.0) N N 86 (57.7) 41 (27.5) 14 (9.4) 6 (4.0) 2 (1.3) 149 Total number of altered patterns = 63 (42.3%) b) % altered patterns occurring by:- i AGE >24 PERCENT NATURE OF PATTERN ALTERATION Band broadened/drawn Ectopic scales Poor ectopic eyespot Well developed ectopic PERCENT Table 4.2 Table shows the effect on the pigment pattern following non-focal cuatery (at site A), a shows the classes of pattern modifications observed and the relationship between the particular alteration and the age at which the animal was cauterised (hours post-pupation). N shows the total number of animals which formed each pattern modification and the number cauterised at each age. The figures in brackets are percentages, b gives data for animals which formed altered patterns only (N=63). bi illustrates the relationship between age and the formation of altered patterns and bii the frequency with which each type of pattern modification formed. 77
196 II. Effect of Non-Focal Cautery on the Wing Pattern a) Cautery at site A 149 animals were cauterized at site A from 1 to 24h post-pupation and some also at ages greater than 24h. Most commonly there was no effect on the dorsal pigmentation pattern at A (86/149 cases; see table 4.2) and the ventral pattern was very rarely affected, in only 7/149 animals (with allowances made for slight distortions and reductions in scale density in the region of the lesion). The most common alteration in the dorsal pattern was a broadening of the transverse band of gold scales located just proximal to the site of cautery and/or the extension of the band towards the lesion (observed in 65% of animals showing an alteration to the pattern; see fig. 4.17). The only class of pattern alteration to the ventral pattern was the drawing of the white transverse band towards the lesion. Sometimes there were ectopic gold scales around the lesioned tissue which seemed to be isolated from the transverse band (this class constituted 22% of animals with altered patterns) although it was often difficult to distinguish the occurrence of truly isolated gold scales in individuals in which the transverse band was also drawn towards the lesion, and particularly when the density of scales in the region was low. In a few cases however (8 individuals) the ectopic gold scales formed a clearly isolated supernumerary ring around the lesion and in one individual the lesion was surrounded by an inner ring of black and an outer ring of gold scales, both of which were isolated from the band which was normal (fig. 4.18). The frequency with which any effect on the pattern was observed was related to the age at which the operation was performed. At 24h post-pupation only 4/38 individuals cauterized produced, patterns which differed from the control whereas at 1 and 6h post-pupation the majority of operations resulted in pattern abnormalities (22/32 and 15/26 cases respectively; see table 4.2). Furthermore, the degree to which the pattern was altered was related to age; the earlier the operation was performed the more likely that more extreme effects on the pattern would be observed (see table 4.2). 178
197 + * * * * c Fig 4.17 Pattern modification following cautery at site A in 'which the transverse pigment band is drawn towards the lesion, a) shows the experimental wing following cautery at 6±0,00h post-pupation and b) the control. The lesion is illustrated by the stippled region, the "background" colour of the wing is the region shaded with the + + symbols and the gold coloured scales characteristic of the transverse band (and the outer pigment ring) is unshaded. In the experimental wing, the transverse band extends more proximally towards the lesion as compared to the control. 179
198 b Fig Pattern modification following cautery at site A at 1+0,15h post-pupation in which ectopic, pigmented scales developed around the lesion in which ectopic pigmented scales developed around the lesion, a) shows the experimental wing and b) the control. Scale bar represents 1mm. The position of the transverse band is unaffected although an ectopic ring of black (cross hatched) and gold (unshaded) pigmented scales formed around the lesion (stippled). In most cases in which ectopic scales formed around a lesion black scales did not develop. 180
199 a) AGE >24 DAMAGE/ NO EFFECT 11 (45.8) 17 (70.8) 10 (50.6) 15 (68.2) 9 (75.0) BAND BROADENED DRAWN TO LESION 4 (16.7) 3 (12.5) 0 (0.0) 5 (22.7) 3 (25.0) N 62 (62.0) 15 (15.0) ECTOPIC POOR ECTOPIC INDUCED ECTOPIC SC:A,LES OCELLUS OCELLUS 3 ( 12 5) 4 ( (8.3) 1 (4 2) 3 (12 0 (0.0) 8 ( 44 4) 0 (0 0 (0.0) 2 (9 1) 0 (0 0 (0.0) 0 (0 0) 0 (0.0 0 (0.0) 14 ( 14 0) 7 (7.0) N (2.0) 100 Total number of altered patterns = 38 (38.0%). b) i AGE >24 % altered patterns occurring by:- ii PERCENT NATURE OF PATTERN ALTERATION Band broadened/drawn Ectopic scales Poor ectopic eyespot Well developed ectopic PERCENT Table 4.3 Effect on the pigment pattern following non-focal cautery at site B. Layout of table is as table
200 b) Cautery at site B 100 animals were cauterized at site B and, as those at site A, very few were unscorable. The effects of the operation on the pattern were classified exactly as for site A in terms of the effect on the band, induction of ectopic pigmented scales and the formation of supernumerary eyespots. The results are presented in table 4.3. Following cautery 38% developed a pattern which was not symmetrical with that of the contralateral wing. A similar proportion of A cauteries (42.3%) resulted in asymmetric patterns. In common with A cauteries the most frequent pattern alteration was a broadening of the transverse band (fig. 4.19), there was a relationship between the frequency of pattern alterations and the age of the animal at the time of the operation (table 4.3) and extreme pattern alterations were observed only following the early cauteries Although effects on the ventral pattern were relatively rare as compared to the dorsal pattern alterations (17% compared to 38%) they were equivalent, usually consisting of the extension of the transverse band towards the lesion. The pattern alteration on dorsal and ventral surfaces did not always correspond. For example one individual formed an ectopic ventral eyespot in which the banding pattern on the dorsal surface was altered. Alterations in the ventral pattern were never observed after 18h post-pupation. c) Cautery at site C Following C cauteries an additional type of pattern alteration was observed; a partial eyespot in which only the proximal half of an ectopic eyespot developed (fig. 4.20a & b). These partial eyespots almost always formed an inner semicircle of black and an outer one of ectopic gold scales. The transverse band (running in a proximal-distal direction in this region of the wing) was very rarely drawn towards the lesion as described for operations located at A and B and consequently this category of pattern modification was omitted in the analysis of the effects of cautery at site C (table 4.4). 52 animals were cauterized at site C, only one of which was unscorable because of extreme distortion in the wing pattern. The frequency with which abnormal patterns formed following cautery was drammatically increased as compared to other non-focal sites on the wing (except for 182
201 Q) o 183
202 Fig The range of effects observed on the pattern following cautery at site B. In a) the transverse band is slightly wider proximal-distally and in the region of the lesion (stippled) is drawn towards the damaged tissue. Cautery was performed at 6+X),30h post-pupation, b) shows the control pattern (of specimen a), c & d show examples in which an ectopic ring of dark scales (cross hatched) formed around the lesion and the transverse band was drawn towards the lesion. The region indicated by the upwardly directed arrows (in c) lacks the large pigmented scales and is covered with small transluscent scales normally found beneath the larger pigmented scales. These animals were cauterised at c 6+0,00 and d 1±0,10h post-pupation respectively, e shows an individual in which an isolated ectopic ocellus formed around the lesion. The position of the band was altered slightly and extended more proximally than in the control. Cautery was performed at 1+0,00h post-pupation. The scale bar represents 1mm. The control pattern for c-e is not shown but but is as b. 184
203 operations performed at or after 24h post-pupation which never produced a pattern which differed from the control; table 4.4). In addition the nature of the pattern alterations were consistently more extreme than those formed following cautery at other sites and were usually more clearly defined (although this may simply reflect the fact that the background pigmentation in this region of the wing makes the patterns easier to discern). There seemed to be more pigment rings in supernumerary eyespots induced following C cautery than those which occasionally formed at other sites. Ectopic ocelli developing at sites A or B only extremely rarely formed more than a ring of gold scales whereas those which formed at C (including partial eyespots) almost always formed both black and gold scales (fig 4.20). The ventral pattern was affected by the operation less frequently than the dorsal, although the alterations were more extreme than those observed at other ventral sites. 9/10 individuals cauterized at 1h post-pupation formed ventral supernumerary ocelli (very rarely observed at other ventral sites), 4 formed following 6h cautery and 1 at 18h. The partial eyespots which formed at the C site were interesting because it is possible that they were the result of operations located slightly more distally than those at C which lead to the formation of complete supernumerary ocelli. It might be that it is possible to locate some point along the proximal-distal axis at which more distally located scale cells lack the competence to form an eyespot. Consequently, only those scale cells in an appropriately proximal site formed pigmentation normally characteristic of the eyespot. To determine whether there was any correlation between the production of partial eyespots and proximal-distal site of cautery, the distance from the centre of the lesion to the distal margin of the wing was measured for animals which formed partial and those which formed complete ectopic eyespots. To control for variations in the overall size of the individual (for example differences in size between males and females) the proximal-distal distance from lesion to wing margin was expressed as a ratio of the anterior-posterior length of sector The number of animals available for comparison is small, but using a t-test designed for use with small samples (Parker, 1979) no significant 185
204 b
205 Fig Examples of pattern modifications following early cautery at site C. a is a partial ectopic eyespot in which the only area in which ectopic pattern elements formed is proximal to the lesion (stippled). Both black (cross hatched) and go'd scales (unshaded developed. The animal was cauterised at 1+0,20h post-pupation. In the control wing (not shown) this area was covered with brown pigmented "background" scales only {+ +). The partial eyespot illustrated in b is more complete; the area of gold pigmentation extends more distally. Immediately proximal to the lesion there is an area in which the large pigmented scales are absent hence the smaller transluscent scales normally found beneath are visible (shaded with upwardly directed arrows), cautery was performed at 6+0,47h post-pupation. As a, the control wing was covered with the background coloured scales. The animal shown in c, was cauterised at 6+0,47h post-pupation and a more complete ectopic eyespot formed, although the area of black pigmentation did not completely surround the lesioned area. Proximal and posterior to the area of background pigmentation is an area covered by gold scales (the distal extent of the band, fig. 4.6). The position of the band is unaffected by the presence of the ectopic eyespot. However, in d, cauterised at 12+0,25h post-pupation, the band fuses with the outer ring of the supernumerary. No lesioned area was visible in this individual; that is, large pigmented scales were fully developed, although their density was reduced in the central region of the eyespot. The centre of the eyespot was covered with a mixture of two differently pigmented scales in roughly equal proportions; the gold coloured scales normally characteristic of the outer pigment ring of eyespots and transverse band and black pigmented scales usually found towards the centre of ectopic eyespots and the middle ring of normal ocelli. Scale bar in all cases is 1mm. 187
206 a) DAMAGE/ AGE NO EFFECT 1 2 (20..0) 6 1 (8.3) 12 0 (0.0) 18 0 (0.0) >24 9(100.0) ECTOPIC SCALES 0 (0.0) 1 (8.3) 3 (21.4) 1 (14.3) 0 (0.0) PARTIAL ECTOPIC 2 (20.0) 2 (16.7) 6 (42.9) 3 (42.9) 0 (0.0) GOOD OCELLUS 6 (60.0) 8 (66.7) 5 (35.7) 3 (42.9) 0 (0.0) N N 12 (23.1) 5 (9.6) 13 (25.0) 22 (42.3) 52 Total number of altered patterns = 40 (76.9%). b) % altered patterns occurring by:- i 11 AGE PERCENT NATURE OF PATTERN ALTERATION No effect Ectopic scales Partial ectopic eyespot Good ectopic > PERCENT Table 4.4 Effect on the pigment pattern following non-focal cautery at site C. Layout of table is as table
207 difference (P > 0.05) between the ratio of the distances could be demonstrated between animals forming partial eyespots (mean = 1.4, sd = 0.26) and those that resulted in the development of complete ectopic ocelli (mean = 1.6, sd = 0.32). That there is not some boundary, distal to which ectopic ocelli can not be induced to form, is consistent with a series of cautery experiments performed by Brakefield (pers. comm.) in which operations located near to the distal margin of the wing resulted in the development of supernumeraries at high frequency. 189
208 DISCUSSION Normal Colour Pattern of Bicyclus safitza The wing pattern of Bicyclus is almost always perfectly symmetrical in control animals in terms of the pattern elements which form, their position, size and constitution. The most common variation between the dorsal forewing pattern of right and left wings of control animals was where small ocelli formed on one wing and were not represented in the corresponding sector of the contralateral wing although in most cases in which more than two ocelli developed they formed on both wings. Asymmetric patterns were observed in less than 1% cases, the extra ocelli were always in a sector other than those which normally bore eyespots (M-J-M2 & Cu-j-Cu2) and they were usually rudimentary. Consequently an untouched control wing provides a reliable control for patterns which form following experiments performed on the contralateral wing. The pattern formed by different control animals was remarkably consistent although there were sex-specific and seasonal differences. In females the 'background' colouration of the posterior forewing region is lighter in colour. Seasonal polymorphism in Bicyclus is expressed only on the ventral hindwing. In the wet seasonal form there is a series of large eyespots which are dramatically reduced in the dry seasonal morph (fig. 4.6c & d). Correspondence between Pupal and Adult Wing Pattern Operations performed on the pupal wing result in the development of lesions on the adult, the location of which depends on the site of cautery. This indicates that there is a direct correspondence between the epidermal cells which form the pupal and adult wings as has been observed for Philosamia cynthia (Kuhn, 1971), Precis coenia (Nijhout, 1980a), Ephestia kuhniella (Kuhn & von Englehardt, 1933; and see above), Plodia i'merpuncte//a'(br3er\d\e, 1965; Wilnecker, 1980). The correspondence between pupal and adult wings makes the lepidopteran wing a useful system on which to study pattern formation because a reliable defect map of the prospective adult wing can be \ constructed and therefore the site at which operations must be performed to experimentally manipulate particular parts of the presumptive adult wing may be readily located. 190
209 The obvious exception to this rule is that the pattern of venation of pupa and adult is different in detail (fig. 4.7). None of the experiments performed on the wing of Bicyclus affected the pattern of venation in any way that could not be accounted for by a damage explanation. For example, veins were sometimes drawn closer together when a lesion was located between them. One possible explanation for this observation is that the fate of prospective cells is determined at the time of the operation, that cautery causes the removal of tissue and that cells at the wound edge migrate over the cauterised cells and draw their neighbours (including prospective scales) with them (Wright & Lawrence, 1980a; 1980b; Wigglesworth, 1937; Campbell, 198?). The other common alteration to the vein pattern was the absence of small patches of vein at the lesion site which can simply be explained in terms of the removal of epidermal cells whose fate is determined irreversibly as wing vein. This suggests that the pattern of venation is determined at the time of pupation, despite the fact that its final form is not visible. This is consistent with work on the vein pattern of Ephestia (Rahn, 1972) in which it seems probable that it is determined in the final instar imaginal disc (see chapter 2). Effects of cautery on the pigmentation pattern The reduction in ocellus size on the dorsal forewing and the induction of supernumerary eyespots on the hindwing in Precis have been explained in terms of different models (Nijhout, 1980a; 1985c) but it is more likely that pigment pattern formation operates via a common mechanism. Consequently the ability of a single model to account for both the development of enlarged ocelli and ectopic eyespots is considered and an explanation for the means whereby reductions in eyespot size is proposed. Wing Pattern following Non-Focal Cautery Following cautery at each non-focal site (proximal Mj-M2 [A], proximal M2~M3 [B] and distal M -MS [C]) a range of pattern alterations were observed. The minimum effect was the formation of a region of local damage at and around the lesion site with no alteration to the pigmentation pattern. The pattern of the transverse band of gold scales located in the region of the A and B sites was frequently altered by the operation in that it was either increased in proximal-distal extent (broadened) and/or was drawn towards the lesion. There are two possible explanations to account for this effect on the pattern. It might be that the location of the lesion somehow disturbs the normal interactions responsible for the specification of the pattern or 191
210 alternatively that the pattern changes are a consequence of the presence of nearby wounded tissue, that is a simple damage effect. Fig shows a model which can account for the formation of an enlarged transverse band following cautery. The normal pattern could be specified by a morphogen source located either proximal or distal to the band (fig. 4.21a-c). If the operation results in a reduction in the local morphogen concentration, cautery adjacent to the transverse band will result in the formation of an abnormal gradient profile in which a larger area of the wing would experience a morphogen concentration which will direct the synthesis of pigmentation characteristic of the transverse band (fig. 4.21d). Consequently, a broader band (in the proximal-distal axis) will develop. There are however, a number of complications to this model when examined in detail. If the morphogen was released from a source equally in all directions it would be predicted that an eyespot would form rather than a band. The restriction of the gold scales to sectors M^-M3 might be explained by assuming that only these three sectors are competent to respond to the. s /Lor signal released from the focus. The reason that a symmetrical band/(forming distally and proximally to the focus) might be because the position at which the appropriate range of morphogen concentration is situated lies outside the domain of the wing (as illustrated in figs. 4.21b & c). An alternative model is that the scale cells which form the band are already determined. The altered path of the band could be explained if cautery in the region of the prospective transverse band stimulates wound healing, and the subsequent migration of pre-determined band scale cells towards the lesioned tissue (as described above for operations which resulted in the displacements of the veins). Scale cells would come to occupy positions intermediate between their normal location in the band and the lesion as a result of which the band would appear to be drawn towards the lesion and broadened. These two explanations are not mutually exclusive and from the cautery experiments described above it is not possible to conclude which constitutes the most likely explanation. Since following caujery the density of scales in the enlarged band was almost always lower than normal it seems likely that there is some damage effect but it is not possible to conclude that the operation has not perturbed the mechanism by which the pattern forms. 192.
211 193
212 Fig Possible gradient model to explain the formation of the transverse band of gold pigmented scales on the dorsal forewing. a shows the normal pattern in the region of the band (stippled) and two possible locations of foci (X & Y) that could specify the banding pattern, b illustrates a possible mechanism by 2.\ which the band n ight form assuming focus x of fig. 4>25a exists (if y exists then the model is reversed (c) but symmetrical). The vertical axis represents morphogen concentration and the horizontal, distance on the wing surface. The dashed horizontal lines on the upper part of b & c illustrate the range on concentrations over which cells will deposit pigmentation characteristic of the band and the pattern specified is shown in the lower part of each figure. The position of the band is illustrated by the stippled region, d shows the effect on the profile of the morphogen following an operation close to the site of the transverse band. The concentration of morphogen is assumed to be effectively lowered by the presence of the damaged tissue. This will result in a larger band as the area of the wing over which the range of concentrations appropriate for the formation of band scales is larger, e illustrates the effect on the gradient profile following an operation located further from the prospective transverse band which results in the development of an isolated patch of scales with pigmentation characteristic of the band. 194
213 The gradient model explanation for the formation of the broadened and drawn bands has some appeal in that it can also account for the development of isolated ectopic scales (fig ). The development of ectopic ocelli which also contain black pigmented scales can, however, not be explained because they do not normally form any part of the band. The induction of black and gold scales is more consistent with the formation of an ectopic eyespot than with any influence on the band. Given a model to explain the development of ectopic eyespots the isolated patches of induced gold-only scales can be accounted for by assuming that they are, for some reason, less well developed. Following cautery of most of the hindwing of Precis (IMijhout, 1980a) observed that ectopic eyespots developed (see introduction). He suggested three possible explanations for the induction of eyespots. 1. Cautery in some way mimics the effect of a focus. Cells are, in some way, stimulated to synthesize morphogen following cautery. Nijhout proposed that this was unlikely because it was known that cauterising the focus of the posterior eyespot of the forewing of Precis inhibited its development (Nijhout 1980a). It is also difficult to understand how damage can cause cells to adopt a special role, normally characteristic of only those at the focus. 2. Cautery affects the sensitivity of cells to morphogen. An ectopic eyespot can be induced to form if cells become abnormally sensitive to morphogen as a result of cautery, that is if a lower morphogen concentration that normal will cause scale cells to form an ocellus. It would be expected that cells closest to the operation will be the most sensitised to morphogen and form structures normally characteristic of the highest concentration of morphogen, that is white and black pigmentation. There is some evidence which can be taken to support the suggestion that the increase in sensitivity to morphogen is proportional to the severity of the operation. Nijhout (1985c) observed that the size of ectopic eyespots was proportional to the amount of damage inflicted. Cautery performed for a longer period of time (which presumably caused more damage) gave rise to larger eyespots. 195
214 Ectopic ocelli can be induced to develop in sectors which do not normally form eyespots (Nijhout, 1985a; see above). Clearly therefore, these sectors are competent to support eyespot development. If it is assumed that cautery sensitises cells to morphogen it follows that these sectors normally contain active foci. Presumably, therefore, the absence of eyespots in these sectors is as a result of an excessive threshold requirement of morphogen by scale cells before pigmentation characteristic of the eyespot is synthesized. This model can not provide a complete explanation, however, since cautery in the distal part of sector M2~M3 results in a dramatically higher frequency of ectopic eyespot formation than when located more proximally (sites C and B). This would mean that either distal cautery lowers the threshold more effectively or that the extent to which the threshold of response of cells is lowered is graded proximal-distally and is normally higher proximally. 3.The operation causes a local reduction in the developmental rate. The formation of ectopic eyespots in Bicyclus could be explained if it is assumed that all epidermal cells synthesize morphogen and that the normal role of the focus is to act as a sink (rather than a source as suggested by Nijhout, 1978; 1980a; but see Nijhout, 1985a). During the early pupal stage the morphogen concentration would gradually rise throughout the wing except in the region of the prospective eyespot where a 'V shaped gradient profile would become established as a result of the activity of the focus. If the effect of cautery and subsequent wound healing in non-focal sites is to cause a temporary arrest in development, the extent of which is dependent on the severity of the operation, a V-shaped gradient profile will result around the lesion which will lead to the formation of an ectopic ocellus (see fig. 4.22). The ectopic eyespot will be larger than normal if either the time at which the operation is performed, and hence the point at which the levels of morphogen are held constant, is earlier than the time at which a focus normally begins to degrade morphogen (fig 4.22d & e). Alternatively, if the number of cells in which the morphogen concentration is held constant is greater than the normal number of focal cells then the resulting ectopic ocellus would be larger than the control anterior eyespot (fig. 4.22f & g). In either case it would be predicted that the time that the operation was performed (and 196
215 Z.6L morphogen (P (J) 5' O O C o
216 Fig Model to explain the formation of ectopic eyespots following non-focal cautery, a-c show the way in which the normal gradient profile becomes established from pupation (a) to the time at which the gradient profile is read by scale cells and their fate specified (c). The role of a focus is assumed to be a sink (see text) which locally degrades morphogen (b & c). A monotonic gradient profile would become established but is illustrated by straight lines for simplicity. The background colour pattern of the wing is specified by a high concentration of morphogen and the rings of the eyespot by successively lower concentrations. Cautery causes a temporary halt to the development of epidermal cells, hence in the region of the operation morphogen synthesis ceases and for a period of time is held at a lower level than elsewhere on the wing (assuming the rate of diffusion from neighbouring cells is relatively low). Consequently at the time at which the gradient is read by the cells and their fate specified, there is a local hollow in the gradient profile which leads to the formation of an ectopic eyespot. An ectopic eyespot larger than the normal ocellus (c) would develop if either the effect of cautery operates earlier than normal focus (d & e) or the region affected by the operation covers a larger area of the wing (f & g). Cautery at a later stage of development when the morphogen is approaching the normal maximum (f) can only depress the gradient profile by a small amount and hence the extent to which the pattern is modified becomes increasingly limited (g). 198
217 hence the concentration of morphogen attained throughout the wing) would be an important factor in determining the eventual size of the ectopic eyespot. Early cautery should produce larger ectopic eyespots than operations performed later in pupation and, although preliminary and based on only a few animals, examination of supernumeraries formed at C from cautery at 1, 6, 12 and 18h post-pupation indicates that the size of the ectopic is smaller at successively later stages. This model is logically equivalent to, and provides a possible mechanism by which, cautery can act as a sink and lead to the local degredation of a morphogen. Nijhout (1985c) dismissed the possibility that cautery can cause a local delay in development as he observed no difference in the time at which projections began to protrude from the scale cell in the region of cautery and elsewhere on the wing. However, simply because developmental synchrony is observed at the time the scales appear does not prove that the scale cells were synchronous earlier in development at the time at which the pigmentation pattern is specified. It is possible, for example that scale cells do not produce projections until the prospective fate (with respect to their pigmentation) of scales throughout the wing has been specified. A comparable phenomenon is observed in many insect species during the regeneration of damaged or extirpated tissue. For example Dewes (1975) examined regeneration of the Ephestia genital disc and the duration of larval development following implantation of disc fragments into final instar larvae. Disc fragments usually regenerated a complete pattern. If two halves of a disc were transplanted into a single host, sometimes both formed a complete set of genital structures. In instances Where fragments failed to regenerate, or if complete discs were implanted, larvae pupated on cue. If one fragment regenerated, the time at which the larvae pupated was delayed, and this delay was extended if both fragments regenerated. In this instance larval cells do not enter their next stage of development (pupation) untij all (including regenerating cells) are in an appropriate state. It is possible, therefore, that the synchrony of the appearance of scale cell projections in Precis is as a result of a wait by wing cells for the fate of those delayed in the region of the lesion to be specified. This model may provide some explanation for the difference in the frequency with which ectopic eyespots form in different positions on the wing and the relationship between the age of the animal at the time of the operation and 199
218 the nature of the pattern formed. In an exhaustive electron and light microscopic investigation of the development of the epidermis of the wing of Manduca sexta, Nardi & Magee-Adams (1986) demonstrated that cells in the proximal part of the wing were consistently at a more advanced state of development than those in the distal region of the wing. Epidermal cells throughout the wing pass through a series of developmental changes. The characteristically larger prospective scale cells (see chapter 2) become morphologically distinguishable from generalized epithelial cells of the wing and the two epidermal cell layers which give rise to the dorsal and ventral wing surfaces, which are initially fused along the basal lamina, gradually separate. In addition there are a large number of detailed cytological changes associated with the development of the epidermis. Nardi & Magee-Adams demonstrated that these changes occur in proximal cells first and in the distal epidermis approximately 24h later. Greenstein (1972) reported that in Hyalophera cecropia the projection of scale cells in the proximal-distal axis of the wing followed a temporal sequence. Esser (1961) observed that the cell divisions which result in the formation of the scales and sockets of Ephestia kuhniella occur in proximal-distal sequence. If distal scale cells are developmentally "younger" than proximal ones in Bicyclus it is possible that the pigmentation of cells in the proximal part of the wing could be specified prior to that in the distal region. It is possible therefore that the different frequency with which eyespots can be induced to form reflects an underlying difference in the stage of development of scale cells and that on average the fate of proximal scale cells is determined before pupation. Consequently, it would be predicted that the fate of proximal scale cells could not be altered by an operation early in 'the pupal stage whereas that of distal scales would still be labile. This hypothesis gains some support from the observation that at each age class the frequency of ectopic pattern element formation following cautery (in which ectopic scales, a poor supernumerary ocellus or a complete/partial eyespot developed) at sites A & B was lower than that after operations at C. It would be predicted therefore that operations performed at a number of sites ranging from extreme proximal to distal would support the formation of ectopic pattern elements at increasingly later stages of development and that at any given stage distal cautery should result in the development of supernumeraries at a higher frequency than from proximal operations. Indeed, Brakefield (pers. comm.) observed that cautery at 3h post-pupation on the 200
219 distal margin of the wing in a range of sectors (R4-2A) gave rise to a complete supernumerary ocellus in 77% of cases, that in a position equivalent to the anterior eyespot gave rise to supernumeraries in 73% of cases, that at proximal-distal locations equivalent to the transverse band results in the formation of extra pattern elements in 42% cases and that more proximally placed operations induced the formation of ocelli in only 8% of cases. Early cautery at any site produced pattern alterations more frequently and abnormalities which did develop were more extreme than those resulting from cautery at the same position performed later in development. Early ectopic ocelli showed a tendency to be larger and usually consisted of more complete pigment rings than those resulting from a later operation and focal cautery at 1h resulted in a significantly larger increase in the size of anterior eyespots compared to that following later cauteries. This observation can be explained in terms of the same model, as it would be expected that cautery performed late in the period in which the morphogen profile was being established could only result in the suppression of the final concentration by a relatively small amount. However at earlier stages when the morphogen concentration over the surface of the wing was relatively low, suppression of synthesis could result in the formation of an appreciable "hollow" in the gradient profile (fig. 4.22; compare d & e and f & g). Wing Pattern Following Focal Cautery Following focal cautery of the prospective centre of the eyespot, the white scales consistently failed to develop. Since the area of the lesion was small 4 relative to the normal (control) eyespot this indicates that operations designed ;, to eliminate the centre of the developing ocellus were accurately placed on the wing. The effect of the operation on the eyespot pattern depended on the age of the animal at the time of the operation. Cautery performed at 1 6h post-pupation resulted in a significant increase in the size of the anterior eyespot, at 12 and 18h there was no effect and when cauterised at or after 24h the ocellar area was significantly reduced. The effect on the pattern of the posterior eyespot (dorsally and ventrally) was exclusively one of reduction in area. Although it is possible that the ocellar pattern is susceptible to modification at early (1-6h) and later (24h) stages, but passes through an insensitive period (12-18h post-pupation^ it is more likely that the apparent insensitivity is an artefact caused by averaging as the effect changes from one of causing genuine increases to decreases in the area of the ocellus (fig and 201
220 r I 4 v}5c & d). The increase in anterior eyespot size was not an artefact caused by the inclusion of the lesion in the calculation of the area of the eyespot as a)the lesion was almost always surrounded by black pigmented scales normally characteristic of the eyespot, therefore the lesion could not artificially increase the area apparently occupied by the ocellus b)the increase in the size of the eyespot was large compared to the area of the lesion and could not be accounted for by inclusion of an eccentrically located lesion. Furthermore, most lesions were not located outside the domain of the ocellus. There are two possible explanations for decreases in the eyespot size; they may result from effects on the mechanism by which the pattern is normally formed or, alternatively, from damage. Nijhout (1980a) observed decreases in the size of the posterior eyespot of Precis following focal cautery early in pupal development and, by determining the area of the lesioned tissue relative to the extent of reduction in area, concluded that a damage explanation would not fully account for the reductions. In Bicyclus, the average lesion size was larger than that for Precis (439u 2 compared to 300u 2 [Nijhout, 1980a]), sometimes holes formed in the wing, the density of scales surrounding the lesion was usually reduced and commonly the wing veins were drawn towards the lesion. These observations are consistent with the notion that cautery results in damage to the adult wing and that, at least in some cases, particularly on the dorsal wing surface, it seems that tissue is effectively being removed from the 4 epidermis. It is difficult therefore to eliminate the possibility that reductions in eyespot size in Bicyclus can not be simply explained by the removal of pre-determined scale cells. For example, it Is possible that at about h post-pupation the pigmentation pattern of scale cells is determined. Eliminating cells by cautery and p/ovoking wound healing will result in a migration of cells towards the centre of the eyespot. Consequently cells will come to occupy positions intermediate between their normal location and the lesion. If the fate of scale cells was already determined the area of the eyespot would be reduced. It is unlikely however, that this explanation can account for reductions in the the size of the ventral posterior eyespot, which never developed a lesion. The decreases in ventral posterior eyespot size were dramatic (up to 50% e.g. see 202
221 fig. 4.16) and often resulted in the formation of eyespots which were enclosed by the wing veins. The reduction in ventral posterior eyespot size can not, therefore, be explained by a coherent migration of pre-determined scale cells. The increases in the area of the eyespot can not be attributed to an artefact of damage (see above). It is difficult to explain the result in terms of Nijhout's model in which foci are suggested to act as sources of positional information as it would be predicted that their removal would inhibit the development of the structure it normally specifies. It might also be expected that if the normal role of a focus was to act as a sink then its function would also be lost, which might similarly lead to the elimination of the eyespot. An alternative explanation, however, is that an enlarged eyespot is equivalent to an induced ectopic eyespot (as observed following non-focal cautery) rather than a genuinely enlarged eyespot. The fact that the enlarged ocellus is at the normal position at which an eyespot develops reflects the site of cautery being coincident with the normal location at which an eyespot forms rather than any special property of those epidermal cells. If this hypothesis is correct it could simply be assumed that the development of enlarged ocelli occurs by the same mechanism by which ectopic eyespots form following non-focal cautery. A number of observations provide preliminary evidence that support this model. It would be predicted that the eyespots formed would be equivalent to those which formed following non-focal cautery; indeed the size and pattern of ectopic (C) and enlarged anterior eyespots were more similar than were enlarged ocelli and their control. This model would also account for the relationship between the age of the animal at the time of the operation and the average size of the eyespot formed following focal and non-focal cautery large ocelli form following earlier operations. Since the F-j site is more proximal than the C position it would be predicted that the time at which enlarged eyespots were no longer observed at F-j following cautery would precede that at which C cauteries resulted in the formation of supernumeraries. Indeed, FI cautery at 12h post-pupation caused no significant difference in the size of the control and experimental eyespots and at 18h there was a decrease in the area of the ocellus formed, whereas at site C supernumeraries continued to develop. The posterior eyespot, both dorsally and ventrally is almost always reduced in size following cautery until approximately 24h post-pupation. Since posterior eyespot reductions were up to 50%, the effects on the nearby wing veins 203
222 were usually negligible and the lesion size was small relative to the decreases in area it seems likely that a damage explanation can not account for this result. An alternative explanation is that cautery completely eliminates the original eyespot and leads to the induction of an ectopic ocellus de novo. One reason to explain the reduction in size could be that the extent to which the gradient profile is decreased by the presence of the lesioned tissue is lower than that normally maintained by the posterior focus. This explanation implies that the difference between anterior and posterior eyespot size is attributable to differences in the activity of the foci (either the extent to which they deplete morphogen or the number of focal cells active; c.f. fig. 4.22) rather than by differences in interpretation of the morphogen landscape by surrounding cells. This model predicts that the size of increased ectopic ocelli would be equal to that of reduced posterior eyespots which, at a preliminary level, is consistent with the results, although it was usually difficult to determine the limit of the posterior focus. It would also be predicted that supernumerary eyespots induced by anterior and posterior focal grafts would lead to the development of differently sized ocelli. Nijhout suggested that the formation of pattern on dorsal and ventral wing surfaces occurs independently, but in accordance with the same developmental rules, because cautery resulting in reductions in the size of the posterior eyespot in Precis and grafting operations did not alter the pattern in the underlying ventral wing surface. In Bicyclus, cautery only rarely resulted in the development of a lesion in the ventral surface and only occasionally affected the pattern. The low frequency with which lesions formed ventrally suggests that the two epidermal layers are not tightly apposed during the early pupal stage which is in accordance with the description of wing development in Manduca (Nardi & Magee-Adams, 1986). Furthermore, since different alteration to the dorsal and ventral patterns can result from a single operation, this suggests that pattern formation in each surface is independent. The age of the animal at the time of the operation had a profound effect on the nature of the pattern formed following cautery at all sites on the wing. The pattern was largely unaffected by operations at or after 24h post-pupation although the area and severity of damage inflicted was usually greater and the rate of successful emergence dramatically reduced. The highest frequency with which the wing pattern was altered (the rate at which supernumerary ocelli and enlarged eyespots formed) was following cautery 204
223 performed at 1h post-pupation. There was a steady decline in the effectiveness of later cautery in altering the pattern. In addition, the degree to which the pattern was affected (the completeness of supernumerary pattern elements and the increase in area of enlarged eyespots) was correlated with the age of the animal at the time of the operation. This can be explained in terms of the same above model as the steady increasing levels of morphogen throughout the wing after pupation would render the pupal wing increasingly insensitive to cautery until specification of the pattern which presumably occurs around 24h post-pupation (at 27 C). Pattern Formation and Polymorphism The major factor controlling which morph develops is temperature. Incubation at constant 28 C results in the development of the wet seasonal form and at 10 the dry. By transferring larvae at various stages of development between these two temperatures Brakefield (pers. comm.) has been able to show that the critical period in which the adult wing pattern is affected by incubation temperature is during the last larval instar. Transferring final instar larvae at successively later stages results in the development of adults with intermediate wing patterns which become increasingly characteristic of the pattern which would be expected had the larva not been temperature shifted. The mechanism by which this environmental trigger exerts its effect upon the pattern formed is not known. A range of patterns which are intermediate between the two extreme seasonal morphs are observed in which the size and number of eyespots varies from 4 small to 7 large. Whatever physiological mechanism is responsible for effecting the switch between the two morphs, it affects only the ventral hindwing ocelli, presumably by inhibiting in some way the mechanism responsible for generating the eyespot pattern. In terms of Nijhout's (1978) model the way in which eyespot development could be suppressed (or enhanced) could be either by reducing the strength of the signal emanating from the foci or by changing the response of the surrounding scale cells to that signal. Thus the formation of the dry season form could be explained by assuming the foci were no longer producing any morphogen or that neighbouring scale cells no longer responded to its presence. The 'dry-season ocelli' consist of a small white spec of white 205
224 pigmented scales, normally characteristic of the highest levels of morphogen, suggesting firstly that the focus is active and secondly that it is synthesizing a normal or near normal level. It is likely therefore, that cells surrounding the focus will experience morphogen concentrations which normally direct the development of pigmentation characteristic of the outer two rings of the eyespot. That these cells do not develop in this way suggests that their interpretation of the signal is different. This could be tested by grafting between wet and dry seasonal morphs. If the focus of a dry seasonal form was inactive it would not be expected to result in the formation of an ectopic eyespot when grafted into part of the wing of a wet seasonal form (demonstrated to be competent to support supernumerary eyespot formation). Conversely if the reason an eyespot does not develop is because of the unresponsiveness of surrounding scale cells then a focal graft into a wet season animal should result in the development of a supernumerary eyespot. Unfortunately for technical reasons it is not possible to evaluate the mechanism by which Bicyclus eyespot formation is switched on and off by an environmental trigger as only the dorsal surface of the forewing is readily accessible for grafting (until apolysis occurs at c. 6-12h post-pupation, see chapter 2). The pattern of the forewing of Bicyclus is unaffected by the environment in which the animal is reared. A species in which polyphenism is expressed on the dorsal forewing would provide an excellent system in which to study the mechanism used by cells to control the development of eyespot formation. Conclusions Non-focal cautery of Bicyclus results in the formation of ectopic eyespots, the frequency and extent of which depends on the time and position of the operation. Cautery early in development and in a distal location produces a high frequency of complete supernumeraries as compared to late proximal cautery. A model to account for this result is that, firstly, the normal role of the focus is to act as a sink and that cells throughout the wing synthesize morphogen and, secondly, that cautery causes a developmental arrest in the wing cells and cessation of morphogen synthesis. A "hollow" in the gradient profile forms, equivalent to that which normally specifies an eyespot, hence an ectopic ocellus develops. The time dependence can be explained if the morphogen concentration increases gradually during early pupation and the final "depth" of the hollow is proportional to the morphogen concentration at 206
225 the time of the operation. If the proximal part of the wing is developmental^ more advanced than the distal, then the effects on the pattern following a proximal operation would be more limited and the frequency of any pattern modifications would be lower. The development of enlarged anterior ocelli following focal cautery shortly after pupation can be explained by assuming that they are equivalent to induced ectopic ocelli. This provides an explanation for the observation that enlarged anterior eyespots are more similar (size and pattern) to induced supernumerary ocelli than the control eyespots. The formation of reduced posterior ocelli can be explained in the same way if it is assumed that the posterior focus is larger or capable of maintaining the morphogen concentration at a lower level (i.e. is a more effective sink) than a cautery-induced effect. In terms of this model the reduction of anterior eyespot size following late cautery is difficult to explain unless it is assumed that at that stage the pigmentation pattern is determined. If this is the case, then the operation will remove specified scale cells from the centre of the ocellus and the subsequent migration of scale cells during wound healing will reduce the eyespot area. It seems however that in Precis and ventral hindwing ocelli in Bicyclus there is little evidence of sufficiently extensive damage following focal cautery to account for the reduction in the area of eyespots (Nijhout, 1980a). On balance there is good evidence that the focus acts as an important boundary for pattern formation but, because it can be mimiced by damage, it is more likely to act as a sink for, rather than a source of, morphogenetic activity. 207
226 CHAPTER 5 208
227 o f o> o o o Fig. 5.1 Model to explain the development of bands in terms of Nijhouts (1978) model formulated to account Tor the formation of eyespots. a shows a series of eyespots in two adjacent sectors, of each of which is formed by a focus located at its centre. If each focus releases a higher concentration of morphogen or alternatively the threshold concentration required by surrounding scale cells to synthesise pigment is reduced, then larger eyespots will form (b). Assuming pattern formation in each 'sector is independent (Nijhout, 1978; 1985b) then each ocellus will be truncated at its anterior and posterior margins. Further increases in morphogen concentration (or reductions in threshold) result in the formation of patterns which more closely resemble bands than eyespots (c), particularly if the highest concentration does not specify a central pigmented ring (d). 209
228 One major aim in the study of development is to understand the mechanism(s) by which pattern is formed and to apply the principles learned from the investigation of one system to account for the formation of patterns in a range of different systems. Historically, experimental study of the formation of the pigment pattern of Lepidoptera has concentrated on the development of bands and eyespots, largely because of their relative simplicity and therefore the ease with which experiments can be designed and results scored. It might be expected that these two types of pattern would be specified by common mechanism, and that this mechanism could account for the development of a wide range of other patterns in the Lepidoptera (Nijhout, 1978; 1985c). Formation of bands and eyespots: a common mechanism? In a comprehensive, comparative study of the wing patterns of many Lepidoptera, Nijhout (1978) proposed a model to explain the development of both eyespots and bands. He suggested an eyespot forms in response to the presence of a discrete morphogen source, (a focus) located at the centre of the prospective ocellus. The fate of surrounding scale cells is specified with reference to the local concentration of morphogen. Assuming the diffusion of the morphogen to be equal in all directions, a series of threshold responses to particular ranges of concentration by the scale cells will lead to the formation of a series of concentric rings of different pigmentation (see fig. 4.2). Nijhout proposed that foci could be located proximally, distally and medially in every sector of the wing, and that the formation of each eyespot was an independent response to a focus (fig. 5.1; see also fig. 4.3). He noted that the i outer pigment rings of adjacent eyespots frequently fuse together (see fig. 4.6; see also fig. 4.4) and suggested that this observation provided a general explanation for the development of bands. If the proximal and distal elements of a band were equivalent to the outer pigment rings of an eyespot, then a band which occupied several sectors could be constructed from a series of foci located in each (fig. 5.1b-d). Bard & French (1984) explained the formation of some of the major features of the complete patterns of a limited number of species by a model in which a morphogen specified the fate of scale cells directly in a similar way as Nijhout (1978) proposed for individual pattern elements. However, the patterns described by the model were critically dependent on the precise location of 210
229 the sources and it was necessary to assume that local sinks were present at some locations around the wing margin to produce good approximations to the actual wing patterns being modelled. Small alterations in the position (even the displacement of a focus or "sink" by a single cell) resulted in dramatic differences in the pattern formed, suggesting that the direct specification of the pigment pattern by a morphogen may be an inappropriate mechanism, although the specification of discrete pattern elements (e.g. individual eyespots) was feasible (Bard & French, 1984; Nijhout, 1980a). Murray (1982) presented a detailed mathematical model to explain the formation of the banding pattern of Ephestia in which a pulse of morphogen is released during early pupation from two sources located in the middle of the wing at the anterior and posterior wing margins. The morphogen diffuses across the wing surface and when over a particular range of concentrations, activates a gene to synthesise product. A positive feedback loop ensures that when activated the gene remains in the activated state. All cells which receive between-threshold concentrations of morphogen will be activated and therefore, synthesis of the gene product will be restricted to two regions of the wing located towards the proximal and distal margins. If the gene product causes cells to synthesise/deposit pigment characteristic of the bands, two transverse bands will develop. Clearly, the formation of both banding and eyespot patterns can be explained formally in terms of the same model mechanism. The best generic model will be that which can account for the majority of experimental results from operations performed on both banding and ocellar patterns. \ In terms of the focus acting as a morphogen source (Nijhout, 1978; 1980a; 1985c) a small central region of the prospective ocellus is responsible for the formation of the wjiole eyespot. If a source is placed in a region of the wing normally lacking morphogen it would be expected that the formation of a supernumerary ocellus in the host tissue surrounding the graft would result. This is indeed the case following grafting the posterior focus of Precis (Nijhout, 1980a) and Bicyclus (French, pers. comm.). Attenuation of the focal region would be expected to reduce the strength of the signal and thereby reduce the diameter of the eyespots or the distance between proximal and distal bands. This prediction was borne out following focal cautery of Precis (Nijhout, 1980a), however in Bicyclus the diameter of eyespots could be increased. Furthermore medial cautery of Ephestia and Plodia at a site where 211
230 the foci would be predicted to be located (Nijhout, 1978; 1985a & c) had no effect on the location of the bands (Kuhn & von Englehardt, 1933; Wilnecker, 1980; see also chapter 3). The focus as a source is also inconsistent with the observation that non-focal cautery in Precis (Nijhout, 1985c) and Bicyclus (see chapter 4) can result in the development of ectopic eyespots and medial cautery of Ephestia also leads to the formation of ectopic rings of band-scales (see chapter 4; see also Kuhn & von Englehardt, 1933). Consequently, the formation of bands (and rings and loops following cautery) in Ephestia can not be explained in terms of a single mechanism (e.g. fused rings of ocelli; Nijhout, 1978; 1980a) because ectopic pattern elements only form inside the bands, whereas in Bicyclus and Precis, supernumerary eyespots form outside the ocelli. Nijhout (1985a) proposed that the development of ectopic band scales in Ephestia could be explained if cautery acts as a local sink, but this can not account for the development of supernumerary eyespots in Bicyclus. It is difficult to understand how damage can lead to the development of pattern elements normally specified by a few specialist cells located in particular parts of the wing; that is, that cautery can switch the fate of scale cells to act as a focus. A comparable example in which damage can lead to the formation of pattern elements is seen in the dipterans, Chironomis (Yajima, 1960) and Smittia (Kalthoff, 1979; 1983), in which the segment pattern can be altered following a number of experimental treatments. UV-irradiation or physical damage (puncturing) inflicted at the anterior pole, or centrifugation of the early egg results in the formation of mirror imaged symmetrical embryos in which the anterior segments are replaced by a number of posterior ones. The pattern formed following experimental manipulation was reliably one of / duplicated abdominal segments although the frequency with which they developed was variable (Kalthoff,, 1979). Since various treatments were effective Kalthoff suggested that the formation of double abdomen patterns could be best explained by the destruction of an 'anterior determinant', located at the anterior pole and normally responsible for the specification of anterior segments. The development of posterior segments in the absence of the anterior determinant suggests that there must also be a posterior determinant at the anterior pole but that it is normally present in insufficient quantities to specify the formation of posterior segments (Kalthoff, 1983, Rau & Kalthoff, 1980). 212
231 o c o proximal distal Fig. 5.2 Meinhardt model to explain double abdomen formation in Diptera. a shows the relationship between the activator and inhibitor produced by a cell. + indicates a positive feedback loop on the synthesis of the product indicated at the head of the arrow and - a negative feedback (inhibition) loop, b illustrates the gradient profile of activator and inhibitor. Following cautery (*) the inhibitor concentration is locally reduced and, if it falls below that of the activator, the autocatalytic properties of the activator can establish a secondary peak, a symmetrical gradient profile and hence specify a double abdomen pattern (c). d illustrates an application of this model to the specification of the Ephestia wing pattern and shows the inhibitor gradient profiles which would form if both proximal (and distal margins of the wing were activated. 213
232 Meinhardt (1982) suggested an alternative mechanism in which changes in cell fate resulting from non-specific damage could be explained in terms of the destruction of an inhibitor of pattern development. He proposed that two substances play a role in the specification of the segment pattern, the activator and the inhibitor, the essential difference between them being that the diffusion constant for the inhibitor is greater than that of the activator. The synthesis of activator by a cell is autocatalytic and any cell producing the activator also produces inhibitor. The inhibitor inhibits the synthesis of activator (fig. 5.2a). When the inhibitor is at a higher concentration than activator, cells suspend synthesis of activator and therefore also inhibitor. To specify the metameric pattern cells at the posterior pole synthesize activator and hence this region of the embryo will also act as a source of inhibitor synthesis. Activator and inhibitor diffuse from the activated site, the precise gradient profiles of each being determined by their relative rates of diffusion (fig. 5.2b). That of the activator is steep and short-range and the concentration of the activator at the focus exceeds that of the inhibitor because the rate of diffusion is lower. The gradient profile of the inhibitor is responsible for specifying the positional information to developing cells (high concentrations lead to the specification of abdominal structures). If it is assumed that the inhibitor is more sensitive to the effects of experimental interference than the activator, then an operation will cause the local decline of inhibitor which, if it falls below the concentration of activator will, because of the autocatalytic properties of the activator, the formation of a secondary activated region and hence lead to the development of a double abdomen (fig. 5.2c). The formation of ectopic ocelli in Bicyclus can be explained in terms of the Meinhardt model. If cells at the focus act as the activated region, a concentration gradient of activator and inhibitor will become established from the focus. The concentric pigment rings of the ocellus can be specified by the interpretation of particular threshold concentrations of inhibitor. The remainder of the wing will remain in an inactive state and remain supressed by the highly diffusable inhibitor released from the focus. If the inhibitor is degraded following cautery and its concentration falls below that of the activator, a secondary activated region can become established and lead to the formation of an ectopic eyespot surrounding the lesion (c.f. fig. 5.2c). This model can explain the development of an ectopic ocellus following 214
233 grafting the focus into a region of the wing which does not normally form an eyespot. The graft will contain a high concentration of activator which, if it exceeds the local concentration of inhibitor will allow the establishment of an activated region and hence the formation of a supernumerary eyespot. It might also be expected, therefore, that even a non-focal graft, provided it contained a reasonably high concentration of activator (and probably, therefore taken from a site close to the focus) would produce the same result. The formation of ectopic pattern elements in Ephestia can also be explained in terms of the Meinhardt model, but in this case it must be assumed that the activated regions are located at the extreme proximal and distal margins of the wing. The reason for this is that a secondary peak can only be induced to form in a region of low inhibitor concentration. Since the additional pattern elements form only in the medial part of the wing, the margins must represent the activated regions (fig. 5.2d). If the site of the operation was close to one of the bands, a loop of band scales could be formed if the inhibitor level (which specifies the positional information in some way) was depleted but not such that its concentration was below that of the activator (see fig. 3.9). However, it would be predicted that cautery located outside the bands would also cause a local reduction in the concentration of the inhibitor and therefore result in the formation of loops which extend outside (proximal and distal to) the normal position of the bands. Such pattern modifications were not observed (see chapter 3). Extreme proximal or distal cautery would have no effect on the pattern because the high activator concentration would ensure that the region remained in an activated state. These predictions are on the whole in general agreement with the experimental results following cautery of Ephestia (Kuhn & von Englehardt, 1933; see chapter 3). Although the Memhardt model can explain a number of the experimental results, it is difficult to understand the way in which cautery of the focus of Bicyclus can have any effect on the size of the eyespot because this model has strong regulative properties. Cautery has been assumed to primarily affect the inhibitor. At the activated site(s) the activator concentration is higher than that of the inhibitor. Reducing the level of inhibitor in this region would not result in the loss of the activated state of the focus and hence there should be little long-term effect on the gradient profile of the inhibitor which is responsible for specification of the pattern. Even if the activator concentration was reduced also, the region should remain activated as the 215
234 * c * c Fig. 5.3 Model to explain the formation of eyespot and banding patterns assuming the «role of the focus is a sink, f indicates the location of the focus and *c the site of cautery. The gradient profiles are illustrated diagramatically by straight lines, a shows the gradient profile which might specify the eyespot pattern and b that of a band (assuming that the foci are located at the proximal and distal margins of the wing), c shows the gradient profile and resulting patterns following non-focal cautery of the wing and d that following medial cautery of Ephestia 216
235 lower diffusion rate of the activator should ensure that the rate of depletion of activator from the site would be lower than that for the inhibitor. Consequently, it is difficult to explain either the reductions in the posterior eyespot size following cautery of Precis (Nijhout, 1980a) or increases in Bicyclus (see chapter 4). If it is assumed that the role of a focus is one of a sink rather than a source then the induction of ectopic eyespots in Precis and Bicyclus and rings in Ephestia must be explained in terms of creating a "hollow" in the gradient profile. Figs 5.3a & b show the way in which the normal eyespot and banding patterns might be specified. Non-focal cautery will result in a decline in the local concentration of morphogen (either by causing a temporary cessation of synthesis of morphogen (see chapter 4) or by directly degrading it) and hence the induction of an eyespot (fig. 5.3c) or ectopic rings of band-type scales (fig. 5.3d). The formation of ectopic eyespots following the graft of the prospective focus to various parts of the wing can be explained if it is assumed that the sink retains its function. Consequently a "hollow" will be formed in the gradient profile and an eyespot specified. If this model is correct, care must be taken in interpreting the results following grafting as in Bicyclus, cautery can lead to the development of ectopic eyespots. For example, the development of a supernumerary following a graft could result from the damage provoked by cutting the epidermis rather than the successful transplantation of an organizer of the pattern. This is unlikely to be true of Precis because control grafts had no effect on the pattern and cauterising the dorsal forewing did not produce ectopic eyespots (Nijhout, 1980a). In Ephestia, cautery located at the extreme proximal and distal margins of the wing would be expected to have little or no effect on the pattern because it is normal for the morphogen concentration to be low in that region as a result of the activity of the foci, whereas operations in close proximity to the bands \ would cause local deflections in their path and hence the formation of loops (see fig. 3.9). Following focal cautery of a prospective eyespot it would be predicted that a pattern characteristic of an ectopic ocellus would form as the normal activity of focal cells was replaced by the effect of cautery (compare figs. 5.3a & c). Thus the size of the cauterised eyespot, relative to the control, might increase or decrease but it would be expected to be comparable in size and pattern to ectopic ocelli. It is difficult to develop any model which can satisfactorarily explain the 217
236 Ring/loop Ephestia wing pattern of Bicyclus, Ephestia, Plodia and Precis following cautery (see text for details). These models rely on the specification of positional information from the gradient profile of a morphogen established by the activity (source or sink) of the focus and includes models in which cells read C l) (2), fifm*lh.'1 *5<j (fcj the gradient directly (Bard & French, 1984; Nijhouut, 1978) or indirectly (Cooke (3) C+) tel * & Zeeman, 1976; Wilnecker, 1980; Murray, 1982). N N N Global Response Ephestia N N N N N N TABLE rj.1 Normal Role of focus Location of focus in Ephestia Effect of cautery Increase eyespot Decrease Ectopic eyespot eyespot SOURCE { MEDIAL -DEGRADE MCRPHOGSN N T N SCII KG 13 MARGINAL DEGRADE KORPHOG3N N N ho ACTIVATION CENTRE Os) ACTIVATION CENTRE (5) MEDIAL MARGINAL DEGRADE INHIBITOR DEGRADE INHIBITOR N N N SINK MEDIAL DEGRADE MCRPHGG^ SINK ( s<?<? MARGINAL DEGRADE Y* Table 5.1 Mutually exclusive Summary of the ability of a range of models to explain the effects on the
237 formation of increases and decreases in eyespot size following an apparently identical operation. Although it seems reasonable to assume that decreases in the size of Bicyclus dorsal eyespots can be attributed to damage (see chapter 4), this explanation apparently can not account for reductions in Precis ocelli (Nijhout, 1980a) or those of the posterior ventral eyespot in Bicyclus. The later cauteries of Ephestia, regardless of their location, result in the medial displacement of both proximal and distal bands. It is difficult to understand why this class of pattern modification occurs after the period in which rings and loops can be formed, since the local effects are consistent with the disturbance of an established gradient of positional information whereas the global pattern alterations would best be explained by interference with the formation of this information. It would be expected, however, that if was the effect of late cautery that the extent to which the bands are displaced would be correlated with the age of the animal at the time of the operation, which was not the case (see chapter 3). The model which can explain most of the experimental results following cautery and grafting experiments in Bicyclus, Precis, Plodia and Ephestia is one in which it is assumed that the focus degrades the morphogen which is normally synthesized by all cells and that the effect of cautery causes a reduction in the concentration of morphogen (see table 5.1). Formation of wing pattern in the Lepidoptera A model to explain the formation of both bands and eyespots provides an explanation for mechanism by which a large number of lepidopteran wing patterns are formed. There are however common variations of these basic pattern elements, the formation of which a general model ought to be able to explain. The simplest variation in eyespot pattern is one of size. Many species have more than one ocellus on the wing and they are frequently of different size. In Bicyclus and Precis for example, the pigmentation pattern of each ocellus is comparable although the posterior eyespot is larger than that of the anterior. Although it is possible to explain this difference in terms of the different degree to which each focus can degrade morphogen, Nijhout (1978) suggested that a more elegant explanation might be that the interpretation of positional information in each sector may differ (see Wolpert, 1969; 1971). Thus cells in 219
238 Fig. 5.4 Gradient model to account for the development of eliptical eyespots assuming the rate of diffusion is greater in the proximal-distal than anterior-posterior axis, a shows the gradient profile in the proximal-distal axis. The high diffusion rate ensures that the profile is relatively "flat" a/id the influence of the focus extends over a large area of the wing. Consequently an eyespot with a large area and extending a considerable proximal-distal distance is specified, b shows the gradient profile in the anterior-posterior axis where it is assumed that the diffusion rate is lower and hence an eyespot with a smaller diameter will form. The overall eyespot shape will therefore be an elipse elongated in the proximal-distal axis. 220
239 the anterior sector require a higher concentration of morphogen before they will deposit equivalent pigmentation. Since in both Precis and Bicyclus the posterior eyespot extends into the neighbouring anterior and posterior sectors and the eyespot is circular it must be assumed that the pattern of interpretation in all three sectors is identical and that there is free communication of morphogen between them. The partition of the wing into domains in which the interpretation of the signal from a focus differs can also explain the formation of eyespots with different patterns of pigmentation in different sometimes adjacent, sectors. For example, in Smyrna blomfildia there are a series of four ocelli in adjacent sectors on the ventral surface of the hindwing, each consisting of a different pattern of pigmentation. It would be possible to investigate whether there are differences in interpretation in different sectors by grafting anterior Bicyclus foci into the sector containing the posterior focus and vice versa and comparing the size of the supernumerary ocelli which form. Clearly therefore cells must receive information as to the way in which they interpret the gradient profile; the sector specific interpretation of information must be specified in some way to enable cells in one sector to respond in a different fashion to those in another. To specify this pattern a coordinate system must exist to uniquely label each sector, although it is unclear as to precisely how this can be achieved (see below). Furthermore the way in which positional information is interpreted may be position-dependent. For example, in many Nymphalid butterflies a single sector may have both an eyespot and part of a band, the pigmentation pattern of each of which is usually different. If it is supposed that bands and eyespots are formed by the same basic mechanism it must be assumed also that the way in which the focal signals are interpreted differs in the two parts of the same sector. Clearly, therefore,,the specification of detailed interpretational information is \» required. The simplest pattern which can be explained in terms of a focus acting as a sink (or source) is a circle. Eyespots are however frequently non-circular, one common example being eliptical ocelli (see fig. 4.1). The development of eliptical eyespots can be explained either in terms of a differential rate of diffusion of the morphogen in anterior-posterior and proximal-distal axes (fig. 5.4) or a different threshold of response by cells equidistant from the focus in the two axes. It has been suggested that the rapid rate of diffusion of 221
240 morphogens over relatively long distances during the development of pattern could be achieved through gap junctions (Wolpert, 1978; Lane & Skaer, 1980). It is possible therefore that if the distribution of gap junctions is asymmetrical (as has been observed in Drosophila imaginal discs (Ryerse, 1982), a greater rate of morphogen transfer could be achieved proximal-distally than anterior-posteriorly. Alternatively cells in the anterior-posterior axis may require a higher morphogen concentration than those located the same distance from the focus in the proximal-distal axis; that is there is an interpretation landscape within the sector (Nijhout 1978). These explanations for the formation of non-circular patterns clearly requires that information specifying the detailed distribution of gap junctions or the pattern of interpretational information is specified prior to the activity of the foci, which also complicates the model. The specification of non-circular patterns requires additional information to control the positional interpretation of that information. To explain the development of symmetrical patterns (e.g. an elipse) is relatively straightforward, however, there are a large number of ocellar patterns which are asymmetrical (Sibatani, 1980). Sibatani proposed that an ocellus might be a mosaic of several pattern elements, the formation of each of which was independent and together they constituted an eyespot. Although this can explain the formation of an asymmetric pattern, it presents the problem of providing an account by which the separate (also asymmetrical) components of the eyespot develop. In addition, to regard an ocellus as a mosaic is inconsistent with the results in which the complete eyespot is eliminated (Nijhout 1980a) or enlarged (chapter 4) by cautery and complete ectopic ocelli develop following focal grafts (Nijhout 1980a; French, pers. comm). The adult wing pattern of some species varies according to the conditions in which it was reared. Polyphenism is usually expressed in terms of the full development of patterns in one morph and a reduction in the other (for example, Bicyclus; see fig. 4.6). Although the precise way in which the environmental trigger exerts its influence on the pattern is unknown, it is relatively straightforward to understand in terms of model mechanisms. The reduction of the ocellar pattern of Bicyclus can be explained in terms of changes in the thresholds required by cells before their fate will be directed towards one of synthesising eyespot pigmentation. Other polymorphic 222
241 patterns involving the apparent suppression of the full pattern of one morph can be explained in similar terms. Clearly a model which depends on the activity of a small number of organisers for determining the fate of a large number of cells requires that the location of these organisers of these patterns be reliable. Small variations in the position in which foci develop will have a major effect on the resulting pattern, particularly if other information gradients (such as the means by which focal signals should be interpreted) are already established. The reliability with which foci are positioned on the wing is demonstrated by the striking symmetry between right and left wings and the similarity in the pigment pattern of different individuals. Since the pattern forming activity can be altered by cautery immediately after pupation (Nijhout, 1980a and above) the location of foci on the pupal wing must be determined at some stage during the larval or prepupal stage. The Drosophila wing disc is a system which has been extensively studied to gain understanding of the mechanism by which imaginal cells in particular positions receive information directing their fate. By transplanting small fragments of mature wing (and other) discs into mature host larvae a detailed fate map of.the disc can be constructed, since each fragment forms,a discrete part of the final wing pattern (Bryant, 1975). By subjecting immature discs to immediate metamorphosis in final instar larvae it is found that a partial pattern is formed, suggesting that the complete complement of prospective adult structures is built up gradually, in a specific sequence, during growth (Bownes & Roberts, 1979).. The intercellular interactions responsible for the development of the pattern seem comparable to those which regulate the pattern during regeneration In experiments in which mature fragments from opposite ends of the disc undergo intercalary regeneration to form structures that neither would form in isolation (see chapter 1). Comparable results are seen during the regeneration of single disc fragments in Drosophila and also in Ephestia (Rahn, 1972). Thus the location of particular structures on the wing such as specific bristles and the wing hinge of Drosophila, the veins of Ephestia (Rahn, 1972) and perhaps also the site of foci and domains of interpretation in butterfly wings could be specified via the intercalary interaction of parts of the immature disc which possess positional values. Initially, however, the immature disc must acquire at least a limited subset of positional values to support intercalation and the means whereby trus information is specified remains elusive. Since the centre 223
242 Fig. 5.5 Activator-Inhibitor model to explain the formation of ripple patterns (Meinhardt, 1982). The diagram shows the concentration of inhibitor which specifies positional information over part of the wing. 224
243 of dorsal and ventral eyespots of Bicyclus directly overlie one another it is possible to speculate that the specification of the foci occurs at the same time by the same mechanism which can act on cells on both epidermal layers (c.f fig. 2.1). The coincidence of the pigmentation of the pupal cuticle and the prospective centre of the dorsal ocellus lead Nijhout (1980a) to suggest that the same cells might specify both patterns. Although the pigment pattern of many lepidopteran species is based on bands and eyespots, there is considerable diversity in the range of patterns observed (see chapter 4). Dependent patterns (Schwanswitsch, 1924; Nijhout, 1978) are those in which the pigment pattern is directly related to some structural feature of the wing, usually the wing veins (see fig. 3.1). Murray (1982) suggested that the simplest explanation for the development of dependent patterns was that the veins acted as a source (or sink) of a morphogen to which scale cells respond (see above). Ripple patterns (Suffert, 1929) are those in which bands of two pigment types alternate in occurrence over the surface of the wing akin to the pattern of ripples seen in wind-swept sand dunes. The ripples may cover the entire wing surface or be restricted to specific regions. The precise morphology of ripple pattern in the Lepidoptera is extremely diverse although they are all probably manifestations of a similar process (Nijhout, 1978). One possible mechanism for the formation of repeating patterns of this type is the model formulated by Meinhardt (1982). If it is assumed that a high inhibitor concentration leads to the development of one component of the ripple pattern and that low concentrations the other, a gradient profile consisting of a series of activated regions could specify the ripple pattern. If the range over which the inhibitor can diffuse (and hence also the activator) is small relative to the overall size of the field, there will be sufficient space in the field to allow adjacent activated regions to become established (fig. 5,5). The final major class of pigment pattern seen in the Lepidoptera is that of colour fields in which large areas of scales in particular regions of the wing are pigmented in contrast to the "background" pigmentation. It is difficult to understand how these patterns are formed as the pigmented regions typically are not related to any structural feature of the wing (as dependent patterns) and they usually bear no resemblence to regular geometric patterns (e.g. circles or ellipses). Presumably, the scales in the colour fields must be instructed to develop in a particular way, however, the location or nature of any point(s) of reference responsible for specifying the positional Information is unclear. It is possible that the position of colour 225

244 Fig. 5.6 Photomicrograph of Cryestis sp..
Midterm 1. Average score: 74.4 Median score: 77
 Midterm 1 Average score: 74.4 Median score: 77 NAME: TA (circle one) Jody Westbrook or Jessica Piel Section (circle one) Tue Wed Thur MCB 141 First Midterm Feb. 21, 2008 Only answer 4 of these 5 problems.
Axis Specification in Drosophila
 Developmental Biology Biology 4361 Axis Specification in Drosophila November 2, 2006 Axis Specification in Drosophila Fertilization Superficial cleavage Gastrulation Drosophila body plan Oocyte formation
Axis Specification in Drosophila
 Developmental Biology Biology 4361 Axis Specification in Drosophila November 6, 2007 Axis Specification in Drosophila Fertilization Superficial cleavage Gastrulation Drosophila body plan Oocyte formation
Axis Specification in Drosophila
 Developmental Biology Biology 4361 Axis Specification in Drosophila July 9, 2008 Drosophila Development Overview Fertilization Cleavage Gastrulation Drosophila body plan Oocyte formation Genetic control
Drosophila Life Cycle
 Drosophila Life Cycle 1 Early Drosophila Cleavage Nuclei migrate to periphery after 10 nuclear divisions. Cellularization occurs when plasma membrane folds in to divide nuclei into cells. Drosophila Superficial
Unicellular: Cells change function in response to a temporal plan, such as the cell cycle.
 Spatial organization is a key difference between unicellular organisms and metazoans Unicellular: Cells change function in response to a temporal plan, such as the cell cycle. Cells differentiate as a
Chapter 18 Lecture. Concepts of Genetics. Tenth Edition. Developmental Genetics
 Chapter 18 Lecture Concepts of Genetics Tenth Edition Developmental Genetics Chapter Contents 18.1 Differentiated States Develop from Coordinated Programs of Gene Expression 18.2 Evolutionary Conservation
Chapter 11. Development: Differentiation and Determination
 KAP Biology Dept Kenyon College Differential gene expression and development Mechanisms of cellular determination Induction Pattern formation Chapter 11. Development: Differentiation and Determination
Lecture 7. Development of the Fruit Fly Drosophila
 BIOLOGY 205/SECTION 7 DEVELOPMENT- LILJEGREN Lecture 7 Development of the Fruit Fly Drosophila 1. The fruit fly- a highly successful, specialized organism a. Quick life cycle includes three larval stages
Development of Drosophila
 Development of Drosophila Hand-out CBT Chapter 2 Wolpert, 5 th edition March 2018 Introduction 6. Introduction Drosophila melanogaster, the fruit fly, is found in all warm countries. In cooler regions,
Developmental genetics: finding the genes that regulate development
 Developmental Biology BY1101 P. Murphy Lecture 9 Developmental genetics: finding the genes that regulate development Introduction The application of genetic analysis and DNA technology to the study of
MOLECULAR CONTROL OF EMBRYONIC PATTERN FORMATION
 MOLECULAR CONTROL OF EMBRYONIC PATTERN FORMATION Drosophila is the best understood of all developmental systems, especially at the genetic level, and although it is an invertebrate it has had an enormous
The formation of pattern on the wing of the moth, Ephestia kuhniella
 Development 13, 77-718 (1988) Printed in Great Britain The Company of Biologists Limited 1988 77 The formation of pattern on the wing of the moth, Ephestia kuhniella NEIL TOUSSAINT and VERNON FRENCH Department
MCB 141 Midterm I Feb. 19, 2009
 Write your name and student ID# on EVERY PAGE of your exam MCB 141 Midterm I Feb. 19, 2009 Circle the name of your TA Jessica Lyons Alberto Stolfi Question #1 Question #2 Question #3 Question #4 TOTAL
Chapter 4 Evaluating a potential interaction between deltex and git in Drosophila: genetic interaction, gene overexpression and cell biology assays.
 Evaluating a potential interaction between deltex and git in Drosophila: genetic interaction, gene overexpression and cell biology assays. The data described in chapter 3 presented evidence that endogenous
Drosophila melanogaster- Morphogen Gradient
 NPTEL Biotechnology - Systems Biology Drosophila melanogaster- Morphogen Gradient Dr. M. Vijayalakshmi School of Chemical and Biotechnology SASTRA University Joint Initiative of IITs and IISc Funded by
Developmental Biology 3230 Midterm Exam 1 March 2006
 Name Developmental Biology 3230 Midterm Exam 1 March 2006 1. (20pts) Regeneration occurs to some degree to most metazoans. When you remove the head of a hydra a new one regenerates. Graph the inhibitor
BILD7: Problem Set. 2. What did Chargaff discover and why was this important?
 BILD7: Problem Set 1. What is the general structure of DNA? 2. What did Chargaff discover and why was this important? 3. What was the major contribution of Rosalind Franklin? 4. How did solving the structure
Axis determination in flies. Sem 9.3.B.5 Animal Science
 Axis determination in flies Sem 9.3.B.5 Animal Science All embryos are in lateral view (anterior to the left). Endoderm, midgut; mesoderm; central nervous system; foregut, hindgut and pole cells in yellow.
Gradients and insect segmentation
 Development 104 Supplement, 3-1,6 (1988) Printed in Great Britain @ The Company of Biologists Limited 1988 Gradients and insect segmentation VERNON FRENCH Department of Zoology, University of Edinburgh,
Supplementary Materials for
 www.sciencesignaling.org/cgi/content/full/6/301/ra98/dc1 Supplementary Materials for Regulation of Epithelial Morphogenesis by the G Protein Coupled Receptor Mist and Its Ligand Fog Alyssa J. Manning,
Spatial sequences of structures under the control of a morphogen gradient
 Chapter 7 Spatial sequences of structures under the control of a morphogen gradient 7.1 Intercalating versus non-intercalating sequences The concentration pattern formed by autocatalysis and lateral inhibition
Segment boundary formation in Drosophila embryos
 Segment boundary formation in Drosophila embryos Development 130, August 2003 Camilla W. Larsen, Elizabeth Hirst, Cyrille Alexandre and Jean Paul Vincent 1. Introduction: - Segment boundary formation:
MCB 141 Midterm I Feb. 14, 2012
 Write your name and student ID# on EVERY PAGE of your exam MCB 141 Midterm I Feb. 14, 2012 Question #1 Question #2 Question #3 Question #4 BONUS / 28 pts / 27 pts / 25 pts / 20 pts / 1 pt TOTAL / 100 pts
Biology 340 Comparative Embryology Lecture 4 Dr. Stuart Sumida. Overview of Pre-Metazoan. and Protostome Development (Insects)
") Biology 340 Comparative Embryology Lecture 4 Dr. Stuart Sumida Overview of Pre-Metazoan and Protostome Development (Insects) Plants Fungi Animals In1998 fossilized animal embryos were reported from the
Biology 340 Comparative Embryology Lecture 4 Dr. Stuart Sumida Overview of Pre-Metazoan and Protostome Development (Insects) Plants Fungi Animals In1998 fossilized animal embryos were reported from the
Development Team. Developmental Biology Axis Specification in Drosophila. Head, Department of Zoology, University of Delhi
 Paper No. : 11 Module : 6 Development Team Principal Investigator: Prof. Neeta Sehgal Head, Department of Zoology, University of Delhi Paper Coordinator: Prof. Namita Agrawal Department of Zoology, University
Principles of Experimental Embryology
 Biology 4361 Developmental Biology Principles of Experimental Embryology September 19, 2006 Major Research Questions How do forces outside the embryo affect its development? (Environmental Developmental
Replacement of posterior by anterior structures in the Drosophila wing caused by the mutation apterous-blot
 J. Embryo!, exp. Morph. Vol. 53, pp. 291-303, 1979 291 Printed in Great Britain Company of Biologists Limited 1979 Replacement of posterior by anterior structures in the Drosophila wing caused by the mutation
!!!!!!!! DB3230 Midterm 2 12/13/2013 Name:
 1. (10 pts) Draw or describe the fate map of a late blastula stage sea urchin embryo. Draw or describe the corresponding fate map of the pluteus stage larva. Describe the sequence of gastrulation events
Life Sciences For NET & SLET Exams Of UGC-CSIR. Section B and C. Volume-08. Contents A. BASIC CONCEPT OF DEVELOPMENT 1
 Section B and C Volume-08 Contents 5. DEVELOPMENTAL BIOLOGY A. BASIC CONCEPT OF DEVELOPMENT 1 B. GAMETOGENESIS, FERTILIZATION AND EARLY DEVELOPMENT 23 C. MORPHOGENESIS AND ORGANOGENESIS IN ANIMALS 91 0
Embryogenesis of an insect nervous system II: A second class of neuron precursor cells and the origin of the intersegmental connectives
 J. Embryol. exp. Morph. Vol. 61,pp. 317-330, 1981 3J7 Printed in Great Britain @ Company of Biologists Limited 1981 Embryogenesis of an insect nervous system II: A second class of neuron precursor cells
MBios 401/501: Lecture 14.2 Cell Differentiation I. Slide #1. Cell Differentiation
 MBios 401/501: Lecture 14.2 Cell Differentiation I Slide #1 Cell Differentiation Cell Differentiation I -Basic principles of differentiation (p1305-1320) -C-elegans (p1321-1327) Cell Differentiation II
BIS &003 Answers to Assigned Problems May 23, Week /18.6 How would you distinguish between an enhancer and a promoter?
 Week 9 Study Questions from the textbook: 6 th Edition: Chapter 19-19.6, 19.7, 19.15, 19.17 OR 7 th Edition: Chapter 18-18.6 18.7, 18.15, 18.17 19.6/18.6 How would you distinguish between an enhancer and
AP Biology Gene Regulation and Development Review
 AP Biology Gene Regulation and Development Review 1. What does the regulatory gene code for? 2. Is the repressor by default active/inactive? 3. What changes the repressor activity? 4. What does repressor
Early Development in Invertebrates
 Developmental Biology Biology 4361 Early Development in Invertebrates October 25, 2006 Early Development Overview Cleavage rapid cell divisions divisions of fertilized egg into many cells Gastrulation
Morphogens in biological development: Drosophila example
 LSM5194 Morphogens in biological development: Drosophila example Lecture 29 The concept of morphogen gradients The concept of morphogens was proposed by L. Wolpert as a part of the positional information
Chapter 10 Development and Differentiation
 Part III Organization of Cell Populations Chapter Since ancient times, people have wondered how organisms are formed during the developmental process, and many researchers have worked tirelessly in search
Genetic Lab 3. Drosophila Fly
 Genetic Lab 3 Drosophila Fly An Introduction to fruit or vinegar fly Drosophila Melanogaster Is a small (about 3mm long), common fly found near unripe and rotted fruit, so that it called fruit or vinegar
Principles of Experimental Embryology
 Biology 4361 Developmental Biology Principles of Experimental Embryology June 16, 2008 Overview What forces affect embryonic development? The embryonic environment: external and internal How do forces
Mesoderm Induction CBT, 2018 Hand-out CBT March 2018
 Mesoderm Induction CBT, 2018 Hand-out CBT March 2018 Introduction 3. Books This module is based on the following books: - 'Principles of Developement', Lewis Wolpert, et al., fifth edition, 2015 - 'Developmental
Role of Organizer Chages in Late Frog Embryos
 Ectoderm Germ Layer Frog Fate Map Frog Fate Map Role of Organizer Chages in Late Frog Embryos Organizer forms three distinct regions Notochord formation in chick Beta-catenin localization How does beta-catenin
Extranuclear Inheritance
 Extranuclear Inheritance Extranuclear Inheritance The past couple of lectures, we ve been exploring exceptions to Mendel s principles of transmission inheritance. Scientists have observed inheritance patterns
Sonic hedgehog (Shh) signalling in the rabbit embryo
 signalling in the rabbit embryo") Sonic hedgehog (Shh) signalling in the rabbit embryo In the first part of this thesis work the physical properties of cilia-driven leftward flow were characterised in the rabbit embryo. Since its discovery
Sonic hedgehog (Shh) signalling in the rabbit embryo In the first part of this thesis work the physical properties of cilia-driven leftward flow were characterised in the rabbit embryo. Since its discovery
1. What are the three general areas of the developing vertebrate limb? 2. What embryonic regions contribute to the developing limb bud?
 Study Questions - Lecture 17 & 18 1. What are the three general areas of the developing vertebrate limb? The three general areas of the developing vertebrate limb are the proximal stylopod, zeugopod, and
Cellular Division. copyright cmassengale
 Cellular Division 1 Cell Division All cells are derived from pre- existing cells New cells are produced for growth and to replace damaged or old cells Differs in prokaryotes (bacteria) and eukaryotes (protists,
Developmental Biology Lecture Outlines
 Developmental Biology Lecture Outlines Lecture 01: Introduction Course content Developmental Biology Obsolete hypotheses Current theory Lecture 02: Gametogenesis Spermatozoa Spermatozoon function Spermatozoon
Cell Reproduction Mitosis & Meiosis
 Cell Reproduction Mitosis & Meiosis Outcomes 1. Describe mitosis in detail (460-465) interphase, mitosis and cytokinesis (the cell cycle) explain the importance of maintaining chromosome number through
Cautery-induced colour patterns in Precis coenia (Lepidoptera: Nymphalidae)
") /. Embryol. exp. Morph. 86, 191-203 (1985) Printed in Great Britain. Company of Biologists Limited 1985 Cautery-induced colour patterns in Precis coenia (Lepidoptera: Nymphalidae) H. F. NIJHOUT Department
/. Embryol. exp. Morph. 86, 191-203 (1985) Printed in Great Britain. Company of Biologists Limited 1985 Cautery-induced colour patterns in Precis coenia (Lepidoptera: Nymphalidae) H. F. NIJHOUT Department
Chromosome duplication and distribution during cell division
 CELL DIVISION AND HEREDITY Student Packet SUMMARY IN EUKARYOTES, HERITABLE INFORMATION IS PASSED TO THE NEXT GENERATION VIA PROCESSES THAT INCLUDE THE CELL CYCLE, MITOSIS /MEIOSIS AND FERTILIZATION Mitosis
18.4 Embryonic development involves cell division, cell differentiation, and morphogenesis
 18.4 Embryonic development involves cell division, cell differentiation, and morphogenesis An organism arises from a fertilized egg cell as the result of three interrelated processes: cell division, cell
Chapter 18 Regulation of Gene Expression
 Chapter 18 Regulation of Gene Expression Differential gene expression Every somatic cell in an individual organism contains the same genetic information and replicated from the same original fertilized
Chromosome Chr Duplica Duplic t a ion Pixley
 Chromosome Duplication Pixley Figure 4-6 Molecular Biology of the Cell ( Garland Science 2008) Figure 4-72 Molecular Biology of the Cell ( Garland Science 2008) Interphase During mitosis (cell division),
Reading: Chapter 5, pp ; Reference chapter D, pp Problem set F
 Mosaic Analysis Reading: Chapter 5, pp140-141; Reference chapter D, pp820-823 Problem set F Twin spots in Drosophila Although segregation and recombination in mitosis do not occur at the same frequency
Cell lineage of the Drosophila abdomen: the epidermis, oenocytes and ventral muscles
 J. Embryol exp. Morph. Vol. 72, pp. 197-208, 1982 197 Printed in Great Britain Company of Biologists Limited 1982 Cell lineage of the Drosophila abdomen: the epidermis, oenocytes and ventral muscles By
BIOLOGY 111. CHAPTER 5: Chromosomes and Inheritance
 BIOLOGY 111 CHAPTER 5: Chromosomes and Inheritance Chromosomes and Inheritance Learning Outcomes 5.1 Differentiate between sexual and asexual reproduction in terms of the genetic variation of the offspring.
10/15/09. Tetrapod Limb Development & Pattern Formation. Developing limb region is an example of a morphogenetic field
 Tetrapod Limb Development & Pattern Formation Figure 16.5(1) Limb Bud Formation derived from lateral plate (somatic) & paraxial (myotome) Fig. 16.2 Prospective Forelimb Field of Salamander Ambystoma maculatum
Homeotic genes in flies. Sem 9.3.B.6 Animal Science
 Homeotic genes in flies Sem 9.3.B.6 Animal Science So far We have seen that identities of each segment is determined by various regulators of segment polarity genes In arthopods, and in flies, each segment
Exam 1 ID#: October 4, 2007
 Biology 4361 Name: KEY Exam 1 ID#: October 4, 2007 Multiple choice (one point each) (1-25) 1. The process of cells forming tissues and organs is called a. morphogenesis. b. differentiation. c. allometry.
LAB 8 EUKARYOTIC CELL DIVISION: MITOSIS AND MEIOSIS
 LAB 8 EUKARYOTIC CELL DIVISION: MITOSIS AND MEIOSIS Name: Date: INTRODUCTION BINARY FISSION: Prokaryotic cells (bacteria) reproduce asexually by binary fission. Bacterial cells have a single circular chromosome,
Genes controlling segmental specification in the Drosophila thorax (homeosis/insect segments/determination/clonal analysis)
") Proc. NatL Acad. Sci. USA Vol. 79, pp. 7380-7384, December 1982 Developmental Biology Genes controlling segmental specification in the Drosophila thorax (homeosis/insect segments/determination/clonal analysis)
Proc. NatL Acad. Sci. USA Vol. 79, pp. 7380-7384, December 1982 Developmental Biology Genes controlling segmental specification in the Drosophila thorax (homeosis/insect segments/determination/clonal analysis)
PRACTICE EXAM. 20 pts: 1. With the aid of a diagram, indicate how initial dorsal-ventral polarity is created in fruit fly and frog embryos.
 PRACTICE EXAM 20 pts: 1. With the aid of a diagram, indicate how initial dorsal-ventral polarity is created in fruit fly and frog embryos. No Low [] Fly Embryo Embryo Non-neural Genes Neuroectoderm Genes
Evolutionary Developmental Biology
 Evolutionary Developmental Biology a.k.a. EVO-DEVO Paedomorphosis is common among salamanders. Note how this hellbender (top) and mudpuppy (bottom) both have gills, paddle tails, and weaker limbs... Top:
Butterfly wing patterns: how good a determining mechanism is the simple diffusion of a single morphogen?
 J. Embryol. exp. Morph. 84,255-274 (1984) 255 Printed in Great Britain The Company of Biologists Limited 1984 Butterfly wing patterns: how good a determining mechanism is the simple diffusion of a single
5. As compared to the human sperm cell, the human egg cell contains more... a) cytoplasm c) centrosomes b) mitochondria d) chromosomes
 cytoplasm c) centrosomes b) mitochondria d) chromosomes") BIOLOGY - 3201. Quiz: Cell Reproduction. NAME : Multiple Choice. (1% each) 1. Which of the following is NOT true of mitotic cell division? a) It involves nuclear division. b) It involves division of the
BIOLOGY - 3201. Quiz: Cell Reproduction. NAME : Multiple Choice. (1% each) 1. Which of the following is NOT true of mitotic cell division? a) It involves nuclear division. b) It involves division of the
Introduction to Animals
 Introduction to Animals Characteristics of Animals multicellular Except for sponges, animal cells are arranged into tissues. Tissues are necessary to produce organs and organ systems. Tissues, organs,
Solutions to Problem Set 4
 Question 1 Solutions to 7.014 Problem Set 4 Because you have not read much scientific literature, you decide to study the genetics of garden peas. You have two pure breeding pea strains. One that is tall
Biology 4361 Developmental Biology The Genetics of Axis Specification in Drosophila November 2, 2006
 Biology 4361 Developmental Biology The Genetics of Axis Specification in Drosophila November 2, 2006 EARLY DROSOPHILA DEVELOPMENT Fertilization 1) Drosophila egg activation occurs at ovulation - eggs are
Mitosis and Meiosis for AP Biology
 Mitosis and Meiosis for AP Biology by Mark Anestis Practice problems for these concepts can be found at : Cell Division Review Questions for AP Biology Mitosis During mitosis, the fourth stage of the cell
Biology, 7e (Campbell) Chapter 13: Meiosis and Sexual Life Cycles
 Chapter 13: Meiosis and Sexual Life Cycles") Biology, 7e (Campbell) Chapter 13: Meiosis and Sexual Life Cycles Chapter Questions 1) What is a genome? A) the complete complement of an organism's genes B) a specific sequence of polypeptides within
Biology, 7e (Campbell) Chapter 13: Meiosis and Sexual Life Cycles Chapter Questions 1) What is a genome? A) the complete complement of an organism's genes B) a specific sequence of polypeptides within
Topic 8 Mitosis & Meiosis Ch.12 & 13. The Eukaryotic Genome. The Eukaryotic Genome. The Eukaryotic Genome
 Topic 8 Mitosis & Meiosis Ch.12 & 13 The Eukaryotic Genome pp. 244-245,268-269 Genome All of the genes in a cell. Eukaryotic cells contain their DNA in long linear pieces. In prokaryotic cells, there is
Drosophila Somatic Anterior-Posterior Axis (A-P Axis) Formation
 Formation") Home Biol 4241 Luria-Delbruck 1943 Hershey-Chase 1952 Meselson-Stahl 1958 Garapin et al. 1978 McClintock 1953 King-Wilson 1975 Sanger et al. 1977 Rothberg et al. 2011 Jeffreys et al. 1985 Bacterial Genetics
Home Biol 4241 Luria-Delbruck 1943 Hershey-Chase 1952 Meselson-Stahl 1958 Garapin et al. 1978 McClintock 1953 King-Wilson 1975 Sanger et al. 1977 Rothberg et al. 2011 Jeffreys et al. 1985 Bacterial Genetics
Meiosis. Bởi: OpenStaxCollege
 Meiosis Bởi: OpenStaxCollege Sexual reproduction requires fertilization, a union of two cells from two individual organisms. If those two cells each contain one set of chromosomes, then the resulting cell
Genetics word list. the molecule which contains genes. This will be looked at in more detail. it is shaped in a double helix (spiral)
") Genetics word list DNA the molecule which contains genes. This will be looked at in more detail. it is shaped in a double helix (spiral) Chromosomes X-shaped objects found in the nucleus of a cell. The
Genetics word list DNA the molecule which contains genes. This will be looked at in more detail. it is shaped in a double helix (spiral) Chromosomes X-shaped objects found in the nucleus of a cell. The
SOALAN ULANGKAJI BAB 5 BIOLOGI TINGKATAN 4
 SOALAN ULANGKAJI BAB 5 BIOLOGI TINGKATAN 4 SECTION A: OBJECTIVES QUESTIONS. Diagram shows the phases in a cell cycle. Diagram 3 Diagram What is V? A Mitosis B Cytokinesis C Stage S D Stage G What is the
Autonomous concentration-dependent activation and repression of Krüppel by hunchback in the Drosophila embryo
 Development 120, 3043-3049 (1994) Printed in Great Britain The Company of Biologists Limited 1994 3043 Autonomous concentration-dependent activation and repression of Krüppel by hunchback in the Drosophila
Cell Division. Mitosis 11/8/2016
 Cell division consists of two phases, nuclear division followed by cytokinesis. Nuclear division divides the genetic material in the nucleus, while cytokinesis divides the cytoplasm. There are two kinds
STUDY UNIT 1 MITOSIS AND MEIOSIS. Klug, Cummings & Spencer Chapter 2. Morphology of eukaryotic metaphase chromosomes. Chromatids
 STUDY UNIT 1 MITOSIS AND MEIOSIS Klug, Cummings & Spencer Chapter 2 Life depends on cell division and reproduction of organisms. Process involves transfer of genetic material. New somatic (body) cells
Mitosis, development, regeneration and cell differentiation
 Mitosis, development, regeneration and cell differentiation Mitosis is a type of cell division by binary fission (splitting in two) which occurs in certain eukaryotic cells. Mitosis generates new body
SCIENCE M E I O S I S
 SCIENCE 9 6. 1 - M E I O S I S OBJECTIVES By the end of the lesson you should be able to: Describe the process of meiosis Compare and contrast meiosis and mitosis Explain why meiosis is needed MEIOSIS
The effect of lethal mutations and deletions within the bithorax complex upon the identity of caudal metameres in the Drosophila embryo
 /. Embryol. exp. Morph. 93, 153-166 (1986) 153 Printed in Great Britain The Company of Biologists Limited 1986 The effect of lethal mutations and deletions within the bithorax complex upon the identity
SIGNIFICANCE OF EMBRYOLOGY
 This lecture will discuss the following topics : Definition of Embryology Significance of Embryology Old and New Frontiers Introduction to Molecular Regulation and Signaling Descriptive terms in Embryology
Why Flies? stages of embryogenesis. The Fly in History
 The Fly in History 1859 Darwin 1866 Mendel c. 1890 Driesch, Roux (experimental embryology) 1900 rediscovery of Mendel (birth of genetics) 1910 first mutant (white) (Morgan) 1913 first genetic map (Sturtevant
Genes, Development, and Evolution
 14 Genes, Development, and Evolution Chapter 14 Genes, Development, and Evolution Key Concepts 14.1 Development Involves Distinct but Overlapping Processes 14.2 Changes in Gene Expression Underlie Cell
Developmental processes Differential gene expression Introduction to determination The model organisms used to study developmental processes
 Date Title Topic(s) Learning Outcomes: Sept 28 Oct 3 1. What is developmental biology and why should we care? 2. What is so special about stem cells and gametes? Developmental processes Differential gene
EDWIN L. FERGUSON and KATHRYN V. ANDERSON
 Development 11, 58-597 (199) Printed in Great Britain The Company of Biologists Limited 199 58 Localized enhancement and repression of the activity of the TGF-fi family member, decapentaplegic, is necessary
Meiosis and Sexual Life Cycles
 13 Meiosis and Sexual Life Cycles Lecture Presentation by Nicole Tunbridge and Kathleen Fitzpatrick CAMPBELL BIOLOGY TENTH EDITION Reece Urry Cain Wasserman Minorsky Jackson Variations on a Theme Living
Fertilization of sperm and egg produces offspring
 In sexual reproduction Fertilization of sperm and egg produces offspring In asexual reproduction Offspring are produced by a single parent, without the participation of sperm and egg CONNECTIONS BETWEEN
Introduction to Meiosis Many organisms pass their genes to their offspring through.
 MEIOSIS NAME DATE 1 Introduction to Meiosis http://vcell.ndsu.nodak.edu/animations/meiosis/movie-flash.htm Many organisms pass their genes to their offspring through. This begins when two gametes unite
Drosophila. The wingless signalling pathway and the patterning of the wing margin in. Juan Pablo Couso*, Sarah A. Bishop and Alfonso Martinez Arias
 Development 120, 621-636 (1994) Printed in Great Britain The Company of Biologists Limited 1994 621 The wingless signalling pathway and the patterning of the wing margin in Drosophila Juan Pablo Couso*,
THREE MITOSIS AND MEIOSIS OVERVIEW OBJECTIVES INTRODUCTION
 THREE MITOSIS AND MEIOSIS OVERVIEW In this lab you will investigate the processes of mitosis and rneiosis: 1. You will use prepared slides of onion root tips to study plant mitosis and to calculate the
CELL REPRODUCTION. Unit 20 LEARNING OBJECTIVES:
 Unit 20 CELL REPRODUCTION LEARNING OBJECTIVES: 1. Be able to distinguish the differences between mitotic and meiotic cell division. 2. Learn the role that both mitotic and meiotic types of cell division
Unit 6 Test: The Cell Cycle
 Name Date Class Mrs. Knight Biology EHS Unit 6 Test: The Cell Cycle 1. What are the four main stages of the cell cycle (correct order)? A. G 1, S, G 0, M C. G 2, S, G 1, M B. G 1, S, G 2, M D. M, G 2,
Chapter 2 Cells and Cell Division
 Chapter 2 Cells and Cell Division MULTIPLE CHOICE 1. The process of meiosis results in: A. the production of four identical cells B. no change in chromosome number from parental cells C. a doubling of
Multiple steps in the localization of bicoid RNA to the anterior pole of the Drosophila oocyte
 Development 1989 Supplement, 13-19 Printed in Great Britain The Company of Biologists Limited 1989 13 Multiple steps in the localization of bicoid RNA to the anterior pole of the Drosophila oocyte DANIEL
Cellular Reproduction = Cell Division. Passes on Genes from Cells to Cells Reproduction of Organisms
 Cellular Reproduction = Cell Division Passes on Genes from Cells to Cells Reproduction of Organisms Genes DNA Chromatin fiber Chromosomes Fig. 9.6 Genes, the segments of DNA, are part of chromatin fiber
Sexual Cell Reproduction Chapter 17
 Sexual Cell Reproduction Chapter 17 1 The Importance of Meiosis Meiosis is a two stage cell division in which the chromosome number of the parental cell is reduced by half. Meiosis is the process by which
178 Part 3.2 SUMMARY INTRODUCTION
 178 Part 3.2 Chapter # DYNAMIC FILTRATION OF VARIABILITY WITHIN EXPRESSION PATTERNS OF ZYGOTIC SEGMENTATION GENES IN DROSOPHILA Surkova S.Yu. *, Samsonova M.G. St. Petersburg State Polytechnical University,
DIFFERENTIATION MORPHOGENESIS GROWTH HOW CAN AN IDENTICAL SET OF GENETIC INSTRUCTIONS PRODUCE DIFFERENT TYPES OF CELLS?
 DIFFERENTIATION HOW CAN AN IDENTICAL SET OF GENETIC INSTRUCTIONS PRODUCE DIFFERENT TYPES OF CELLS? MORPHOGENESIS HOW CAN CELLS FORM ORDERED STRUCTURES? GROWTH HOW DO OUR CELLS KNOW WHEN TO STOP DIVIDING
Thoracic Patterning by the Drosophila Gap Gene hunchback
 Developmental Biology 237, 79 92 (2001) doi:10.1006/dbio.2001.0355, available online at http://www.idealibrary.com on Thoracic Patterning by the Drosophila Gap Gene hunchback Xuelin Wu,* Vikram Vasisht,*
Meiosis and Fertilization Understanding How Genes Are Inherited 1
 Meiosis and Fertilization Understanding How Genes Are Inherited 1 How does a child inherit one copy of each gene from each parent? Compare what you already know with this flowchart. 1. Fill in each blank