MORPHOLOGICAL CHARACTERIZATION AND DIVERSITY ANALYSIS IN BITTER GOURD (Momordica charantia L.)
|
|
|
- Christina Shana Bell
- 5 years ago
- Views:
Transcription

1 MORPHOLOGICAL CHARACTERIZATION AND DIVERSITY ANALYSIS IN BITTER GOURD (Momordica charantia L.) MD. MARUFUR RAHMAN DEPARTMENT OF GENETICS AND PLANT BREEDING SHER-E-BANGLA AGRICULTURAL UNIVERSITY DHAKA-1207 June, 2015
2 MORPHOLOGICAL CHARACTERIZATION AND DIVERSITY ANALYSIS IN BITTER GOURD (Momordica charantia L.) MD.MARUFUR RAHMAN REGISTRATION NO A Thesis submitted to the Faculty of Agriculture, Sher-e-Bangla Agricultural University, Dhaka in partial fulfillment of the requirements for the degree of MASTER OF SCIENCE IN GENETICS AND PLANT BREEDING SEMESTER: January - June, 2015 Approved by: (Dr.Naheed Zeba) Professor Supervisor (Dr.Md. Shahidur Rashid Bhuiyan) Professor Co-supervisor (Dr. Md. Sarowar Hossain) Chairman Examination Committee
3 Dr. Naheed Zeba Professor Department Genetics and Plant Breeding Sher-e-Bangla Agricultural University Dhaka-1207, Bangladesh Tel: Mobile: CERTIFICATE This is to certify that the thesis entitled, MORPHOLOGICAL CHARACTERIZATION AND DIVERSITY ANALYSIS IN BITTER GOURD (Momordica charantia L.) submitted to the Faculty of Agriculture, Sher-e-Bangla Agricultural University, Dhaka, in partial fulfillment of the requirements for the degree of MASTER OF SCIENCE in GENETICS AND PLANT BREEDING, embodies the result of a piece of bona fide research work carried out by Md. Marufur Rahman, Registration No under my supervision and guidance. No part of the thesis has been submitted for any other degree or diploma. I further certify that such help or source of information, as has been availed of during the course of this investigation has duly been acknowledged. Dated: June, 2015 Place: Dhaka, Bangladesh Dr. Naheed Zeba Supervisor
4 DEDICATED TO MY BELOVED PARENTS
5 ACKNOWLEDGEMENTS All the praises are due to the almighty Allah, who blessed the researcher to complete this work successfully. With sincere gratitude and appreciation to his reverend supervisor Professor Dr.Naheed Zeba, Department of Genetics and Plant Breeding, Sher-e-Bangla Agricultural University, for her scholastic supervision, helpful commentary and unvarying inspiration throughout the field research and preparation of this thesis. The earnest indebtedness to his Co-supervisor Professor Dr.Md. Shahidur Rashid Bhuiyan, Department of Genetics and Plant Breeding, SAU for his continuous support, constructive criticism, and valuable suggestions. The author expresses his sincere respect to the Chairman of the Department, Professor Dr.Md. Sarowar Hossain, and also grateful to all other teachers of his department for their excellent guidance. The author would like to thank all the staffs of his department, the staffs of the SAU library and the farm workers for their nice cooperation. The author have received endless encouragement from his beloved friend Golam Muktadir,Zunaid Habib,Kayum Mazumder, Ashikul Islam, Samanur throughout their honour s and masters life. Also thankful to his junior friend Faria Naz,Muktadir Rashid Bhuiyan and Brother Golam Robanni for their support. The author, indeed, proud and delighted for his father and mother for their unparallel affections and for numerous sacrifices they have made for his research. This work is dedicated to his beloved parents. June, 2015 SAU, Dhaka The Author
6 Some commonly used abbreviations Full Word Abbreviation Full Word Abbreviation Advanced Adv. Veterinary Vet. Agricultural Agril. Research Res. Agriculture Agric. Bangladesh Agricultural BADC Development Corporation And others (at elli) et al. Bangladesh Agricultural BARI Research Institute As for example e.g. Agronomy Agron. Biology Biol. Heritability in broad sense h b Biotechnology Biotechnol. Horticulture Hort. Botany Bot. Particular pages pp. Brasleira Bras. Bangladesh BD Breeding Breed. Economy Econ. Bulletin Bull. Phenotopic variance p Centi-meter cm Analysis Of Variance ANOVA Company Co. Physiology Physiol. Degree (Latitude and Proceeding proc. longitude) Degree Celsius C Science Sci. Environment Env. Opinion Opin. Environmental variance e International Intl. Etcetera etc. Journal J. Genetic Advance GA Degrees of freedom df Genetics Genet. Applied Appl. Genotype G Meter m Genotypic coefficient of GCV Economy Econ. variation Genotypic variance g Environmental Environ. Gram g Hour h Hectare ha University Univ. Leaf area index L.A.I. Percent % Mean sum of square MS Newsletter Newsl. National Natl. Chronica Chron. Percentage of CV% Completely Randomized CRD Coefficient of Variation Design Phenotypic coefficient PCV Improvement Improv. of variation Progress Prog. Current Currr. Sher-e-Bangla SAU Agriculturist Agricult. Agricultural University Technical Tech. Ecology Ecol. i
7 I II III List of plates List of appendices Abstract Introduction Review of literature LIST OF CONTENTS CHAPTER TITLE PAGE NO. Acknowledgements i Some commonly used abbreviations ii Table of contents iii-v List of tables List of figures vi 2.1 Origin and domestication of bitter gourd 2.2 Variability, heritability and genetic advance 2.3 Correlation co-efficient and path analysis 2.4 Genetic diversity Materials and methods 3.1 Experimental site 3.2 Geographic location 3.3 Climate 3.4 Characteristics of soil 3.5 Design and layout of the experiment 3.6 Plantingmaterials 3.7 Seed selection for sowing 3.8 Seed sowing in the pot and raising of seedlings 3.9 Land preparation Pit preparation 3.11 Manure & fertilizers application 3.12Transplanting of seedlings ii vii vii viii ix
8 CHAPTER IV LIST OF CONTENTS (Cont d) TITLE 3.13 Inter cultural Operation Weeding Irrigation and after-care Pesticide application Stalking and tying 3.l4Harvesting 3.15 Data recording 3.16 Statistical analysis 3.17Selection of varieties for future hybridization programme Results and discussion 4.1 Morphological characterization Fruit character Ovary character Seed character 4.2 Genetic variability, heritability and genetic advance Vine length Branch per vine Nodes per vine Days to first flower (male ) Days to flower (female) Fruit Length Fruit Breadth Fruit weight Number of fruits per plant Fruit yield (kg) per plant 4.3. Correlation studies 4.3.lVine length Days to first male flowering Days to first female flowering Fruit characters 4.4. Path analysis iii PAGE NO
9 4.4.1 Vine length Days to first male flowering Days to first Female flowering Fruit character 4.5 Multivariate analysis Cluster analysis Principal component analysis (PCA) Principal coordination analysis Non-hierarchical clustering Conical variate analysis Selection of genotypes as parent for hybridization programme Summery and Conclusion References Appendices iv
10 01 Table No. List of Tables Title Name of Fifteen Bitter gourd Genotypes used in the present study Page No Dose of Manure and fertilizers used in the study 34 Frequency distribution of genotypes belonging to different phenotypic classes of leaf character 56 Frequency distribution of genotypes belonging to 04 different phenotypic classes of fruit character 58 Frequency distribution of genotypes belonging to 05 different phenotypic classes of ovary and seed character 59 Estimation of genetic parameters in twelve characters of 06 eighteen genotypes in bitter gourd Genotypic correlation coefficients among different pairs of yield and yield contributing characters for different genotypes of bitter gourd Phenotypic correlation coefficients among different pairs of yield and yield contributing characters for different genotypes of bitter gourd Path coefficient analysis showing direct and indirect effects of different characters on Fruit/Plant (kg) of bitter gourd Distribution of genotypes in different clusters 77 Eigen values and yield percent contribution of charactersof15 genotypes of bitter gourd 78 v
11 15 12 PC scores of fifteen genotypes of bitter gourd Ten highest and ten lowest inter genotypic distance among thefifteen genotypes ofbitter gourd Cluster mean values of 10 different characters of 15 genotypes of bitter gourd. Intra (Bold) and inter cluster distances (D 2 ) for 15 genotypes of bitter gourd List of Figures Figure Title No. 1. Scatter distribution of fifteen genotypes of bitter gourd based on their principal component scores super imposed with cluster. 2. Diagram showing intra and inter cluster distance of fifteen genotypes of bitter gourd Page No. vi
12 LIST PLATE Plate No Title Page No 01 Different steps of seed preparation, sowing and raising of seedlings Different steps of land preparation and planting of seedlings Different steps of intercultural operations Different stages of mature bitter gourd plant in the 55 experiment. 05 Phenotypic variation of leaf on vine of bitter gourd 62 genotypes 06 Phenotypic variation in female flower of bitter gourd 65 genotypes. 07 Phenotypic variation in male flower of bitter gourd genotypes Phenotypic variation in individual fruits of bitter gourd genotypes. 68 vii
13 LIST OF APPENDICES Appendix No. 01 Title Map Showing the experimental site under the study 100 Page No Monthly records of air temp., RH, rainfall and sunshine hours during the period from October 2015 to May Soil characteristics of the experimental site as observed prior to experimentation at (0-15 cm depth Layout and design of the experimental plot Mean performance of various growth parameter andyield components of 15 genotypes of bitter gourd Analysis of variance for different plant characters of fifteen bitter gourd genotypes. 105 viii
14 MORPHOLOGICAL CHARACTERIZATION AND DIVERSITY ANALYSIS IN BITTER GOURD (Momordica charantia L.) BY MD. MARUFUR RAHMAN ABSTRACT An experiment was conducted inthe experiment field of Sher-e-Bangla Agricultural University, Dhaka-1207, Bangladesh during the period from November 2015 to February 2016 to study themorphology and genetic diversity of bitter gourd. Fifteen genotypes of bitter gourd were used in the experiment. The genotypes were G1, G2, G3, G4, G5, G6, G7, G8, G9, G10, G11, G12,G13, G14 and G15.Data were recorded on vine length (m), branch per vine, node per vine, days to first flower (male), days to first flower (female), fruit length (cm), fruit breadth (cm), fruit weight (g), number of fruit per plant (kg). G9 gave the best performance on vine length, branch per vine, early flowering and number of fruit per plant. G4 performed best for highest fruit length and fruit weight. G11 performed excellent for early flowering and fruit yield per plant and G13for maximum number of fruit per plant and higher yield. The fruit yield per plant showed highest range of variation ( Kg) with the mean value (1.61 Kg). The significant positive correlation was found between yield and fruit length and fruit weight at genotypic and phenotypic level. Path co-efficient analysis indicated that fruit length, fruit weight and number of fruit per plant had direct positive effect on yield. Positive indirect effect also found by vine length, branch per vine and days to flowering on yield of bitter gourd. The accessions were also tested for genetic divergence utilizing the multivariate analysis. The accessions were grouped into four clusters. The maximum inter-cluster distance (31.35) was presented between cluster II (contained two genotypes) and cluster III (contain sevengenotypes). The minimum inter cluster distance (9.79) presented between cluster I (contained 4 genotypes) and cluster III (contain 7 genotypes). Highest intra- cluster distance in cluster I (0.938) and lowest intra-cluster distance cluster II (0.102) was presented. Considering the magnitude of cluster mean and agronomic performance G4,G9, G11, and G13, considered promising and might be recommended for future hybridization program. x

15
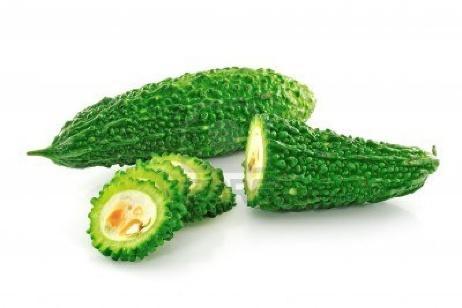
16 CHAPTER I INTRODUCTION Bitter gourd (Momordica charantia L.) is one of the most important and popular cucurbit vegetable grown in Bangladesh(Raja et al., 1984).The origin of this important crop is probably India with a secondary centre of diversity in china (Grubben,1977). It is adapted to a wide range of environments and can be grown tropical and sub tropical climate (Lim,1998).It is a fast growing warm seasonal climbing annual vine of the Cucurbitaceous family. It is grown for edible fruit which is among the most bitter of all vegetables. Momordica is a large genus with many species of annual or perennial climbers of which Momordica charantia L. is widely cultivated. The crop is highly cross pollinated due to monoecy.the somatic chromosome number of Momordica charantia is 2n=2x=22. Other speciesbelonging to this genus are M.dioca, M.cochin chinenesis, M.balsamina and M.trosa. The tendril-bearing vine grows to with simple, alternate leaves 4-12 cm across, with 3-7 deeply separated lobes. Each plant bears separate yellow male and female flowers(rashid, 2004).Compared to other cucurbits, bitter gourd has relatively high nutritional value in respect to iron and ascorbic acid contents (Rashid, 1999). Bitter gourd contains a reasonable amount of different nutrients such as proteins, carbohydrates, fats, minerals and vitamins (A, B2, and C)(Raja et al.,1984).it was also reported that very high amount of vitamin C (95mg/100g) and protein (930mg/100g) is present in some Indian bitter gourd varieties. It contains considerable amount of water (83-92%), carbohydrates ( %), protein ( %), fat ( %), minerals ( %) and fiber ( %). Ripe fruits are rich in vitamin A. Among all cucurbit vegetables, bitter gourd contains the maximum amount of minerals and vitamins. The fruits are bitter to taste due to the presence of a substance called cucurbitacin. Bitter gourd is also reported as 1
17 beneficial against diseases like paralysis, indigestion and vomiting pain and diabetes(mier and Yaniv, 1985). Placenta or aril(seed membrane) is an excellant source of bio accessible carotenoids(lycopene and beta carotene) (Vuong,et al. 2006).These phytochemicals are beneficial to health as they can reduce the risk of several disease such as postrate cancer,colon cancer, stomach cancer and cerebral thrombosis (Ishida et al., 2009). Bitter gourd may contribute to the nutritional shortage of the people of Bangladesh. Particularly, it can provide added proteins, minerals and vitamins to the diet.in Bangladesh vegetables are grown in 0.2 million hectares of land which is about 1% of the cultivated.winter vegetables are usually grown in 58.96% of the total land area while 41.04% area is covered by summer vegetables(bbs, 2012).The nutritional problems and vegetables scarcity in Bangladesh can be reduced to some extent through improvement of production technology of cucurbitaceous crops like bitter gourd.yet no comprehensive systematic research has been done in this crop in Bangladesh. present harvestable yield of bitter gourd is very low due to unavailability of high yielding varieties. There are a lot of variability s among the existing bitter gourd germplasms of Bangladesh. An understanding of the nature and magnitude of the variability among the genetic stocks of bitter gourd is of prime importance for the breeder. A good knowledge of genetic wealth might also helps in identifying desirable cultivars for commercial production. The basic key to a breeder is to develop high yielding varieties through selection, either from the genotypes or from the segregants of a crop. Expression of different plant characters are controlled by genetic and environmental factors. So, the study of genetic parameters is necessary for a successful breeding program which will provide valuable information on the mode of inheritance of different characters which would be useful in selecting plants having desirable characters to develop new varieties. In a hybridization program knowledge of interrelationship between yield and yield components is 2
18 necessary. Estimation of genetic diversity is considered as an important factor, which is also essential pre-requisite for hybridization program for developing high yielding variety(ghosh et al., 2015). Genetic diversity is one of the important tools to quantify genetic variability in both cross and self-pollinated crops and also important for crop improvement as well as variety development programme. Multivariate analysis by means of Mahalanobis D 2 statistics is an useful tool in quantifying the degree of genotypic divergence among biological populations and to assess the relative contribution of different components to the total divergence both at inter and intra-cluster levels, (Banik, 2003; Das and Gupta, 1984; Jatasra and Paroda, 1978; Sachan and Sharma, 1971; Ram and Panwan, 1970; Murty and Arunachalam, 1966). Many researchers have adopted this D 2 technique for measuring divergence among genotypes of pumkin, (Masudet al., 1995),cucumber (Rashid, 2000), and snake gourd (Prasad et al., 1993). Very few research efforts related to estimate the variability in bitter gourd have been conducted in the country. Considering the scope of study and available genetic resources of bitter gourd the present investigation was under taken with a view to estimate genetic diversity using multivariate techniques.the present study was undertaken with the following objectives. To characterize the morphological traits of different genotypes To know the nature of association of traits, direct and indirect relation between yield and yield contributing characters To assess the magnitude of genetic divergence in genotypes for identifying the genetically divergent parents to use them in future breeding programme. 3

19
20 CHAPTER II REVIEW OF LITERATURE The conservation of wild species, local varieties and traditional genotypes in seed gene bank has become a useful tool of gene maintenance. The accessions in gene banks should be characterized and evaluated in order to determine the magnitude of genetic diversity which would allow the identification of redundant accessions and genotypes of interest in breeding program. Only a few previous reports are accessible now for its research which can lead to uprising in evaluation of bitter gourd biology. Few studies have been done using different genes to examine its genetic variability. Literature available concerning to the present study has been presented below. 2.1 Origin and domestication of bitter gourd The vegetable Momordica charantia L., cucurbitace is known variously as bitter gourd, balsam pear, bitter melon, bitter cucumber and African cucumber (Heiser, 1979). The center of bitter gourd domestication likely lies in eastern Asia, possibly eastern India or southern china (Miniraj et al., 1993; Walters and Decker Walters, 1988). Uncarbonized seed coat fragments have been tentatively identified from spirit cave in northern Thailand. However there have been no archaeological reports of bitter gourd remains in China (Marr et al., 2004). Moreover, a comprehensive compilation of plant remains from 124 Indian archaeological sites does not include bitter gourd (Kajale, 1991). Wild or small fruited cultivated forms however are mentioned in Ayurvedic texts written in Indian Sanskrit from 2000 to 200 BCE by members of the Indian Aryan culture (Decker Walters, 1999).The most modern Hindi (Indian language) term "karela" may ultimately be of Dravidian origin (Turner, 1966). The earliest reference to M. charantia in China was made in 1370 CE (Yang and Walters, 1999). Both the domesticated and putative wild bitter gourd progenitors of bitter gourd are listed in floras of India, 4
21 tropical Africa and Asia as well as the new world tropics, where it first arrived in Brazil via the slave trade from Africa and then spread into central America (Marr et al. 2004). Based on both historical literature (Miniraj et al., 1993, Chakravarty, 1990, Walters and Decker Walters, 1988) and recent random amplified polymorphic DNA (RAPD) (Dey et al., 2006), inter simple sequnce repeats (ISSR) (Singh et al., 2007) and amplified fragments length polymorphism (AFLP) (Gaikwad et al., 2008) molecular analysis, eastern India may be considered as a probably primary center of diversity of bitter gourd, where a wild feral form M. charantia var. muricata (Chakravarty, 1990) currently exist. 2.2 Variability and genetic parameter The assessment of variability present in any crop species is an essential prerequisite for formulating an effective breeding program, as the existing variability can be used to enhance the yield level of cultivars following appropriate breeding strategies (Patil et al., 2012). Sreelathakumary and Resmi (2015) observed that the characters of 33 bitter gourd genotype showed ample variation as the wide range obtained for days to seedling emergence, vine length and internodal length. Days to first male and female flower plays an important role in deciding the earliness or lateness of the crop. The early and late female flower appearance helps in occurrence of early or late flush of the crop. Days to first male flower showed wide range of variations among the genotypes. Parameters of genotypic phenotypic coefficients of variation (GCV and PCV) are useful in detecting the amount of variability present in the available genotypes. High phenotypic co-efficient of variation than the genotypic co-efficient of variation indicates more influence of environment on the expression of genes controlling the trait. Therefore, it can be referred that selection based upon phenotypic expression of the particular character wouldn t be productive for the improvement of that crop (Bhuiyan, 2014). If the genotypic co-efficient of 5
22 variation and phenotypic co-efficient of variation are close to each other, it suggests environmental influence is minor on the expression of the genes controlling the trait. So, selection based upon phenotypic expression of that character would be effective for the improvement of the specific crop. Evaluation of 18 genotypes of ridge gourd for growth, earliness, and yield and fruit quality parameter showed that PCV was higher than GCV for most of the trait (Koppad et al., 2015). An experiment was conducted by Pathok et.al. (2014) to determine the variability among eight characters of bitter gourd hybrid. High genotypic (GCV) and phenotypic co-efficient of variation (PCV) was observed for number of fruit per plant, fruit weight and fruit length whereas, low GCV and PCV was observed for days to first male and female flower anthesis. In another study, genetic variability was estimated in fifty genotype of snake gourd. The phenotypic co-efficient of variation was found higher than the genotypic coefficient of variation for most trait studied. The GCV obtained for various yield and yield attributing characters ranged from (5.08 to 47.15) (Devi and Mariappan, 2013). From variability studied of bottle gourd germplasm with 13 quantitative traits showed continuous variation among accessions, primarily due to fruit and seed size and shape. A wide range of variation was also recorded in the quantitative traits for other fruit, leaf and seed characters plant height, fruit circumference handle length, leaf blade width and leaf blade length (Mladenovic et al., 2012). Guffar (2008) was conducted an experiment with 15 sponge gourd genotypes. Among the characters the highest GCV recorded for yield per plant followed by top fruit perimeter and average fruit weight. Kabir (2007), conducted an experiment on variability and estimation of genetic parameter, of 24 accessions of pointed gourd with respect of different parameter such as days to flower, fruit length, fruit breadth, single fruit weight, pulp seed 6
23 ratio, and number of fruits per plant, weight of fruit per plant and yield of fruit. The accession PG020 showed the highest performance in weight of fruits per plant, single fruit weight and yield. The highest genotypic and phenotypic coefficient of variation were recorded in the parameters, number of fruits per plant and second highest was recorded from yield of fruits ton per hectare. However, days require to first flowering, fruit length, fruit breadth, single fruit weight and weight of fruit per plant recorded moderate GCV and PCV. Zaman et al. (2004); reported the performance of three sponge gourd lines. Two lines produced the highest number of fruits per plant and lower were recorded in Local. Maximum individual fruit weight was obtained form Local. The line Sg gave the highest yield (20.0 t/ha) closely followed by Sg (19.4 t/ha). Banik (2003), conducted an experiment on variability and genetic advance of 26 genotypes of snake gourd with respect of 15 quantitative yield contributing characters and found significant difference among the characters like vine length at harvest, number of primary branches, days to first male flowering, days to first female flowering, node number of first male flower, fruit length, seeds per fruit. Banik (2003), also found that significant differences in first female flower, node number (mean value 19.28) and fruits per plant. The highest phenotypic co-efficient of variation was observed for fruiting node on main vine, fruit yield per plant, fruit length and first male flower node. The PCV was lowest for days to maturity, 100 seed weight and days to first male flower opening. The GCV along with heritability was high for the above characters High heritability coupled with high genetic advance was noticed for fruit yield per plant (GCV and PCV and 30.96, h 2 b 98.64%), fruit length (GCV and PCV and 30.04, h 2 b 99.19%) and first female flower node number (GCV and PCV and 26.59, h 2 b 94.63%) and number of fruits per plant (GCV and PCV and 20.59; h 2 b 92.67%). 7
24 Chowdhury and Sharma (2002), were studied genetic variation, heritability, genetic advance for yield and yield components (vine length, number of nodes, node on which the first flower appeared, number of fruits per plant, fruit length, fruit girth and fruit weight) in 12 Luffa acutangula cultivars. The genetic coefficient of variation (GCV) was higher than the phenotypic co-efficient variation (PCV) for all the characters. High values of variability, PCV, GCV and genetic advance have recorded for vine length, yield per hectare and fruit weight indicating that these characters were controlled by additive gene effects. Singh et al. (2002); conducted an experiment on 80 ridge gourd genotypes to determine variability and heritability of nineteen yield contributing characters. High PCV and GCV were observed for node number for appearance of 1 st male flower, male flowers per plant, sex ratio main axis and branches, fruit per plant, fruit weight, seeds per fruit, and yield per plant. The GCV and PCV values were almost equal for most of the characters studied. The broad sense heritability estimates were high for all the characters. Miah et al. (2000); studied 30 genotypes of bitter gourd and observed the highest genotypic as well as phenotypic coefficient of variation were found for fruit length followed by days to female flowering, fruit yield per plant, fruit weight and nodes per vine. Sharma et al. (2000); evaluated 10 cucumber lines and testers under different environmental conditions and reported that day to first female flower, nodal position of fruits per plant, marketable yield per plant, fruit length and fruit diameter had wide range of variation. In case of seed germination there was a wide range of variation. Robinson and Decker-Walters (1997) reported that male flowering was earlier than female flowering in several genotypes of bottle gourd. Mathew and Khader (1999), conducted an experiment on genetic studies in snake gourd (Trichosanthen anguina) and observed the genetic variability and heritability of 12 traits in 34 Trichosanthen anguina in Kerela, India and reported 8
25 that the genotypic co-efficient of variation (GCV) and phenotypic co-efficient of variation (PCV) were almost equal for all characters. The highest GCV and PCV were recorded for mean fruit weight, seed per fruit, fruit yield per plant and fruit length. High heritability was observed for mean fruit weight, seeds per fruit, fruit length, days to first male flower and fruit yield per plant. Rumaran et al. (1997); was conducted 30 pumpkin genotypes in a field trial and reported that genotypic co-efficient of variation was smaller than phenotypic coefficient of variation for most of the traits studied. However, GCV was high for mean fruit weight, number of fruits per plant, number of seeds per fruit, yield per plant and fruit, total soluble solids content. High heritability coupled with high genetic advance were observed for vine length, mean fruit weight, number of fruits per plant, number of seeds per fruit, fruit yield per plant and total soluble solids content of fruits. Walkers (1997), found variation in the duration of germination of cucumber seed. He reported that cucumber germinated from two days to two weeks. Rahman (1988), noted that in pointed gourd it took two to three weeks for sprouting and three months for flowering or fruiting after planting of vine or roots. Hossain (1996), was conducted an experiment on floral biology of ridge gourd. Male, female and hermaphrodite flower buds appeared days after seeding. The male flower buds developed earlier and in lower nodes than the female and hermaphrodite ones. The first male, female/hermaphrodite flowers were produced an average in the 10 th to 21 st node. Saha et al. (1992); studied the variability of pumpkin, reported that phenotypic coefficient of variation (PCV) was higher than the genotypic coefficient of variation (GCV). High genotypic variance and phenotypic variance were found for fruit length (30.34 and 31.76), fruit weight (39.55 and 41.00) and low for fruit diameter (8.87 and 10.23) among the pumpkin genotypes. They also reported high heritability estimate for both length (91.27) and diameter (75.07) of fruits indicating effectiveness of selection based on good phenotypic performances in pumpkin. 9
26 Varghese (1991), reported an experiment on the variability among 48 snake gourd genotypes in respect of different yield contributing characters and found significant differences among the characters. Main vine length varied from to 7.85 m with high heritability (97.0%). In case of number of branches per vine, heritability was 91.0%. Moderate GCV and PCV in fruit length and breadth (32.15 and 32.51; and 21.23) was also observed in snake gourd germplasms. Narrow differences between (GCV and PCV in fruit weight with high heritability (h 2 b) were also observed. GCV and PCV for yield per plant were 30.0 and respectively. 100 seed weight varied from 20.0 to 41.0 g with high heritability 97.8% in snake gourd. Rahman et al. (1991); reported that male flower were earlier than female flower in several genotypes of bottle gourd, ribbed gourd and sweet gourd. They reported significant variations for that character among the genotypes of bitter gourd, sweet gourd, ribbed gourd and bottle gourd. Significant variation for it length and diameter were also observed. Abusaleha and Dutta (1990), carried out a study with 65 genetic stocks to assess the genetic variation and heritability in ridge gourd. Significant variability was observed for all the characters at phenotypic as well as genotypic level with a very wide range of values. It was observed by Rahman et al. (1990) in a study that significant variation for days to first flowering among the genotypes of bitter gourd, ribbed gourd and sweet gourd. Rahman et al. (1990, 1991); also concluded that days to male flowering was earlier than days to female flowering in several genotypes of ribbed gourd, bitter gourd, bottle gourd and sweet gourd. They also reported that bitter gourd, sweet gourd, ribbed gourd and bottle gourd genotypes differed significantly for fruit breadth and weight per fruit. Sharma and Dhankar (1990), reported that almost similar estimates of (GCV and PCV (13.54 and 14.00) for days to first female flower opening in bottle gourd. They also observed high heritability (93.47%) with considerably high genetic advance for days to flowering in bitter gourd. Mondal et al. (1989); studied the 10
27 genetic variability of 31 watermelon genotypes and observed a wide range of variability for days to first fruit harvest, fruit length, fruit diameter, number of fruits per plant and fruit yield per plant. Doijode and Sulladmath (1988), found high GCV and PCV (30.2 and 36.4), high heritability (h 2 b) with high genetic advance for average fruit in pumpkin. Narrow difference between (GCV and PCV observed for fruit weight in bitter gourd indicating less environmental influence on this character. Significant difference was also found among bitter gourd genotypes for seeds per fruit. Bose and Som (1986), stated that the sex ratio in cucurbits varied from 5:1 to 25-30:1, the ratio of male: female flower was changed by the climate and environmental factors. Rahman et al.(1986); reported high GCV and PCV for both length (31.73 and 33.75) and diameter (39.23 and 41.96) of fruits in bottle gourd. They also observed minimum difference between GCV and PCV. The variability for yield per plants and significant variations were also recorded for fruit length and diameter in bottle gourd. Mangal et al.(1981); noticed that in bitter gourd significant variation for fruit length and diameter present and high heritability in bitter gourd for vine length. Joseph (1978), conducted an experiment on variability among 25 lines of snake gourd and found that main vine length varied from 4.01 to 6.17 m. Days to first male flower anthesis (3622 to days) and days to first female flower opening (45.00 to days). Nodes number for 1 female flowering was recorded to be to Haque (1971), stated that petiole length for bottle gourd, sweet gourd; white gourd and watermelon were cm, cm and cm, respectively. He also noted that node for first male flower in bottle gourd, sweet gourd; white gourd and melon were 19th, 25th, 14th and 14 th days respectively. Node for first female flower in bottle gourd, sweet gourd, white gourd and water melon were 28th, 34th, 21 and 19 th days respectively. 11
28 2.2 Correlation co-efficient and path analysis Correlation between the characters is an estimate to evaluate the inter-relationships between the characters which will help the breeders to choose selection techniques. In most cases, correlation between yield and yield contributing characters was studied because yield is one of the main targets of most of the breeders. The yield contributing characters are also interrelated among themselves. So, association of characteristics with yield and among its components is important for planning effective selective breeding programme for maximization of yield. Such correlation studies may vary due to agro-climatological variations from year to year. If any component of yield has higher heritability than yield itself and there is positive correlation between these, then there may be some possibility to increase in the total yield by selecting that component. But, negative correlation co-efficient among yield components were generally observed indicating selection for any component might not bring improvement for yield. Many authors have studied correlation between yield and yield contributing characters of cucurbits. Some pertinent recent literatures are reviewed in this section. From eighteen genotypes of ridge gourd characters showed that 90 days after sowing (DAS) (R=0.8659), average fruit weight (R=0.9298), tendril length (R=0.4955) had positive and significant correlation with yield but sex ratio (R=0.4606) and days to first male flowering (R=-0.512) had the negative significant association with the fruit yield per vine (Koppad et al., 2015). In another study, among 20 bitter gourd hybrid characters correlation analysis revealed that number of fruit per plant hand significant positive correlation for yield. Further, path co-efficient analysis partitioned the correlation into direct and indirect effects. Yield was found to be directly correlated with fruit weight, number of fruits per plant and fruit length (Pathok et. al., 2014). 12
29 Bottle gourd characters studied that a positive correlation between plant height and fruit length (R=0.33). The correlation between fruit weight and all other variables was positive (R= ). The correlation between fruit weight and all other variables was positive (R= ) (Mladenovic et. al., 2012). Among the yield contributing characters days to male flower, days to female flower, fruit length, fruit diameter, average fruit weight and total number of fruits per plant were found to have highly significant and positive genotypic and phenotypic association with fruit yield per plant. Results indicated that these characters have major contribution towards the fruit yield per plant in snake gourd (Podder et. al., 2010). In an experiment of Kabir (2007) correlation coefficient indicated that fruit yield per plant was highly significant and there was a positive association with weight of fruit per plant, number of fruits per plant and single fruit weight. Path analysis indicates fruit breadth, number of fruits per plant and weight of fruits per plant, directly contributed to the yield of pointed gourd accessions. Singh and Ram (2003), conducted an experiment on 28 musk melon genotypes to determine the correlation among fruit characters. The simple correlation among fruit traits showed that polar diameter, latitudinal diameter, flesh thickness and seed cavity size were positively correlated with fruit weight. Eleven pointed gourd (T. dioica) selections were assessed to estimate genetic variability and correlation for yield and its attributes. High genetic co-efficient of variation (GCV) estimate was observed for the characters such as node at which first female flower appeared, length of vine, number of nodes per plant and number of fruits per plant. The heritability estimate was high for all the characters. The character having high (GCV also exhibited high genetic advance. Yield per plant had significant positive correlation with number of fruits per plant (Dora et al., 2003). Shah and Kale (2002), conducted an experiment on correlation co-efficient analysis of yield components of 55 genotypes of ridge gourd. The fruit weight per vine was 13
30 positively and significantly correlated with number of fruits per vine, average fruit weight, number of female flower per vine and vine length, indicating the close association and dependency of yield with these characters. The fruit length was negatively correlated with fruit diameter and fruit number per vine, while it was positively correlated with average fruit weight. Singh et al. (2002); were carried out 98 hybrids of cucumber derived from crosses involving 14 male and 7 female parents found that fruit weight, fruit girth and fruit length had high correlations with fruit yield. Genotypic correlation coefficient were higher than phenotypic co-efficient which indicated strong association among these traits. Path coefficient analysis also indicated that fruit weight had the highest direct effect on fruit yield. Badade et al. (2001); conducted an experiment to study the correlation of 20 bottle gourd (Lagenaria vulgaris) genotypes. Yield was found significantly and positively correlated with number of branch per vine, number of fruits per vine and significantly and negatively correlated with days to first male and female flower appearance and weight of deformed fruits per vine at both phenotypic and genotypic levels. Fruit length showed positive but non significant correlation with fruit yield. Rao et al. (2000); conducted an experiment on the segregating population of ridge gourd for correlation and path coefficient analysis. Path analysis revealed that yield improvement could be achieved by direct selection for days to 50% flowering, girth of fruit, fruits per plant or vine, fruit per branch and length of the vine of ridge gourd. Miah et al. (2000); noted that fruit yield in bitter gourd showed significant positive association with average fruit weight, fruit breadth and number of nodes per vine in genotypic and phenotypic correlation with days to male flowering. Path analysis revealed that average fruit weight, number of fruits per plant, days to male flowering and fruit length had positive direct effect on fruit yield. Sarker et al. (1999); studied correlation and path co-efficient of 16 divergence types of pointed gourd indicated that fruit weight, fruit diameter and 14
31 number of primary branches per plant were positively and significantly correlated with yield per plant followed by fruit weight and fruit diameter had maximum positive direct effects on yield. Li et al. (1997); noted that number of fruits per plant, average fruit per plant, average fruit weight, fruiting rate and leaf area of cucumber genotypes were positively correlated to yield. Days to flowering and vine length were negatively correlated. From path analysis, they also concluded that fruits per plant and average fruit weight affected the yield directly. Ananthan and Pappoah (1997), reported that fruit number per vine and seed number per fruit were positively correlated with total yield while days to first female flowering, days to first male flowering, sex ratio, fruit girth, pulp thickness and total, soluble solids content were negatively correlated with total yield in cucumber. Abusaleha and Dutta (1990), carried out a study with 65 genetic stocks to assess the genetic variation and heritability in ridge gourd. Significant variability was observed for all the characters at phenotypic as well as genotypic level with a very wide range of values. Sych (1990), conducted path co-efficient analysis in 150 genotypes of watermelon and found that fruit weight and number of fruits per plant had considerable direct effects on yield. Rastogi et al. (1990); conducted an experiment with 25 diverse cucumber cultivars found that general genotypic correlation co-efficient were higher than those related to phenotypic or environmental factors. However, both genotypic and phenotype co-efficient for fruits per plant gave positive and significant association with number of primary branches, number of female flower, fruit weight and number of fruits per plant. Female flower per plant showed highly significant positive correlations with number of primary branches, fruit yield and fruit per plant. Longer vine length increased the number of male flowers and produced heavier fruits. Mondal et al.(1989); studied path co-efficient in 31 genotypes of watermelon and observed that the number of fruits per plant 15
32 and fruit diameter affected fruit yield directly. Path co-efficient analysis revealed that for increasing fruit yield selection should be based on plant having more number of fruits with larger diameter. Kumaran et al. (1998); carried out an experiment on correlation and path analysis studies in pumpkin. They found that positive and significant correlation of vine lenght, mean fruit weight, number of fruit per plant and number of seeds per fruit with fruit yield per plant. They also found that number of fruit per plant exhibited the highest direct effect on yield. High positive indirect effects were exerted by number of fruit per plant and mean fruit weight. In another study, Abusaleha and Dutta (1989) found that the yield of cucumber is positively correlated with vine length (r = 0.35), branches per vine (r = 0.29), fruits per vine (r = 0.48), fruit length (r = 0.60) and fruit girth (r = 0.43). Days to first male and female flowering, nodal position female flower, percentage of misshapen fruits and non-marketable yield were negatively correlated with yield Path coefficient analysis revealed that fruits per vine and fruit length had the greatest direct effects on yield. Prasad et al. (1988); in a study found that phenotypic and genotypic co-efficient of variation of water melon were high for fruit per plant, average fruit weight, seed per fruit, 100 seed weight and fruit yield per plant. They also reported that fruit yield was correlated with vine length (r = 0.47), branches per plant (r = 0.75), fruit weight (r = 0.88), length (r = 0.63) and girth (r = 0.61). Vijay (1987), worked with nine agronomic characters of 95 diverse musk melon stocks and found that fruits per vine, flesh thickness and yield per vine showed the greatest genotypic coefficient of variation. Heritability and genetic advance were high for fruit per vine, total soluble solids content, flesh thickness and yield per vine. Fruits per vine and fruit weight were positively correlated with yield. In a similar study, Chawdhury and Mandal (1987) conducted a study on 30 diverse cucumber genotypes and found high positive correlations at the genotypic and phenotypic levels between yield per plant with number of fruits and female flowers per plant, fruit length and 16
33 weight. Path co-efficient analysis revealed that the above characters and fruit diameter were the most important characters determining yield. According to Singh et al. (1986); fruits per plant, fruit length and yield showed high heritability and genetic advance in pointed gourd. According them, yield was positively and significantly correlated with fruits per plant (r = 0.60) and days to flowering, days to fruit set and days to ripeness were negatively correlated with all the other characters with the exception of a positive correlation between days to flowering and fruit weight. Reddy and Rao (1984), observed negative and nonsignificant correlation between these traits (r = ) in ribbed gourd. 2.3 Genetic diversity Genetic diversity is one of the important tool for crop improvement (Gaur et al. 1978; Anand et al. 1975; Marani and Avieli, 1973; Murty, 1965; Matzinger et al., 1962). Those characters may be given high emphases which have more contribution in divergence during selection the lines for hybridization programme to generate large variability and will provide immense scope for the improvement of yield through selection. Many scientists have studied genetic divergence of bitter gourd on the basis of Mahalanobis D 2 -statistics based on multivariate analysis. Among them most relevant recent publications are reviewed below. In a study, the principal component analysis was carried out with 17 genotypes of bitter gourd. PCA produce. Eigen values of principle component axes of coordination of genotypes with the first axes totally accounted for 88.12% variation, precise information about the extent of genetic divergence is crucial for an effective breeding programme (Ghosh et. al., 2015). To evaluate the nature and magnitude of genetic divergence in 30 bitter gourd genotypes results revealed the presence of wide genetic diversity. The genotypes were grouped into 6 clusters. Among the 12 quantitative characters studied, individual fruit weight constituted a maximum of 64.14% contribution to the divergence, followed by days to first 17
34 female flower appearance intra-cluster mean performance are major contributors of genetic diversity (Singh et al., 2013). Distance analysis classified parents in four well separated cluster DC 1, ( ) was highly diverse class and DC 4 ( ) was low diverse class while DC 2 ( ) and DC 3 ( ) were optimum divergence classes. Higher frequencies of heterotic hybrids were produced by parents with moderate diversity than the parents with high diversity (Laxuman et. al., 2012). Genetic divergence of twenty bitter gourd genotypes was studied on the basis D 2 and PCA. The genotypes under study fall into four clusters. Inter and intra cluster distances in all cases were larger than intra cluster distances suggesting wider genetic diversity among the genotypes of different groups (Islam et. al., 2010). Quamruzzaman et al. (2008); were studied the genetic divergence among thirty genotypes of ridge gourd (Luffa acutangula) using D 2 and principal component analysis. The genotypes were grouped into six clusters. The highest intra cluster distance was noticed for the cluster II(0.882) and the lowest for the cluster III (0.220). The highest inter-cluster distance was observed between cluster I and II (15.045) where as the lowest was observed between cluster IV and V (3.402). Khan et al. (2008); were assessed the genetic diversity among 64 pointed gourd genotypes through multivariate analysis from an experiment conducted. The genotypes were grouped into twelve clusters. The cluster V consisted of highest number of genotypes and it was nine, the cluster VI and cluster VIII contained the lowest number of genotypes and it was two in each. The clustering pattern of the genotypes under this study revealed that the genotypes collected from the same location were grouped into different clusters. The highest inter genotype distance as observed between the genotypes P0022 and P0007 and the lowest 2.6 as observed between the genotypes P0043 and P0044 Cluster V had the highest cluster mean value for internode length, fruit weight per plant and yield the highest 18
35 inter-cluster distance was noticed between cluster III and II (45.71) and the lowest between cluster VII and VI (3.33). The highest intra cluster distance was computed for cluster III and that was lowest for the cluster II. The first five axes accounted for 77.65% of the total variation among the 13 characters describing 64 pointed gourd genotypes. Fruit weight, seeds per fruit and fruit weight per plant contributed maximum to the total divergence. Sanwal et al. (2008); were evaluated thirty eight indigenous collections of chowchow for eight quantitative and quality traits. High values of genotypic coefficient of variance along with high heritability and genetic advance were recorded for number of fruits/plant, fruit yield per plant, TSS, acidity and ascorbic acid. Number of fruits per plant and average fruit weight showed positive and significant correlation with fruit yield per plant. The number of fruit/plant and average fruit weight had high direct effect towards the fruit yield/plant. Hence, these characters should be given more emphasis while making selection for high yielding genotypes On the basis of genetic divergence, relative magnitude of D 2 values thirty-eight genotypes were grouped into seven clusters. The maximum genetic divergence was observed between cluster III and VII followed by cluster II and VI. The cluster V and VI displayed lowest degree of divergence. The minimum intra-cluster distance was exhibited for cluster VI followed by cluster V. However, it was highest for cluster III. The mean values were higher in cluster I and IV for two characters i.e. fruit length and average fruit weight, while cluster II had high mean values for number of fruits/plant. Guffar (2007), conducted a research and found, genotypes included in cluster I were suitable for yield per plant (6 55), cluster III for having the highest mean value for inter node length (17.62), cluster V for leaf length (30.43), leaf breadth (24.65), petiole length (13.28), days to first male flower (103.28), days to first female flower ( ) and other characters. Masud et al. (2001); studied genetic 19
36 divergence in 19 genotypes of sponge gourd (Luffa cylindrica) collected from local and exotic resources. The genotypes were grouped into five clusters. The genetic divergence of the genotypes did not follow their geographical distribution and was fairly at random. There was no evidence of close relationship between geographical distribution and genetic divergence as estimated by D 2 statistics. Maximum intercluster distance (45.9) was observed between cluster II and V and minimum (10.3) between cluster II and IV. Fruit length and diameter were significant contributors to genetic divergence. Kabir (2007), reported that genetic divergence studied 24 accessions of pointed gourd. The accessions were grouped into five clusters. The cluster I and III had the highest number of accessions (6) followed by cluster V (5), cluster IV (4) & Cluster III (3). The highest intra cluster distance was computed for cluster IV (35.80) followed by cluster I(28.12) and Cluster V (26.63). The minimum intra cluster distance was found in III (18.87). Hazra et al. (2003); reported that genetic divergence studied on 167 accessions of pointed gourd and grouped in eight nonoverlapping clusters, with cluster IV comprising of the highest number of accessions (37 accessions) and cluster VI comprising of the lowest number of genotypes (6 accessions). Inter cluster distance ranged from 1.25 in cluster Ito 1.65 in cluster VII. Cluster VIII and V were the most diverse as indicated by the maximum inter cluster distance between them (6.04). Banik (2003), studied 26 genotypes of snake gourd were tested using multivariate analysis and the genotypes were grouped into seven distinct cluster. No relationship was found between genetic divergence and geographical distribution of genotypes. The highest inter genotypes distance was observed between genotypes SG 026 and SG 010 (1.897). The inter cluster distance was maximum between cluster II and IV (17.74). Main vine length, first female flower node number, nodes on main vine, fruit length and number of seeds per fruit had the highest contribution towards the divergence. Harshawardhan and Ram (2003), 20
37 conducted an experiment on severity germplasms of musk melon lines to elucidate genetic divergence using a non-hierarchical cluster analysis for yield and its components. The genotypes were grouped into 11 clusters irrespective of geographic and genetic diversity. Group VIII contained the largest number of 11 genotypes. The maximum genetic distance occurred between cluster II and X. Dora et al. (2003); conducted an experiment on eleven genotypes of pointed gourd to find out genetic divergence following Mahalanobis s D 2 statistics. The eleven genotypes were grouped into four clusters. Cluster I and II comprised of four genotypes each, cluster III comprised of two genotypes and cluster IV comprised of only single genotype. Genetic draft and natural selection in different environment can cause high diversity among genotypes that is geographical isolation (Updhaya and mutry, 1970). Raseed et al. (2002); studied the genetic divergence of 47 pumpkin genotypes collected from different parts of Bangladesh using Mahalanobis s D 2 and principal component analyses. The genotypes were grouped into seven clusters. Cluster III had the maximum (11) and cluster IV and VII had the minimum number (4) of genotypes. The characters like fruit weight yield per plant contributed maximum towards total divergence. More and Seshadri (2002), studied the genetic divergence in muskmelon. After evaluation, based on statistical analysis they classified 98 genotypes into 12 cluster. The crosses involving parent belonging to medium divergent cluster may also exhibit significant and positive heterosis (Miah and Bhal, 1989). Dora et al. (2001); studied eleven genotypes of Trihosanthes dioica and the genotypes were grouped into four clusters based on Mahalanobis s D 2 statistics and found that inter cluster distances were greater than intra cluster distances, indicating considerable genetic diversity among genotypes. The highest D 2 value (984.3) was recorded between cluster II and IV. In a different study, Ram et al. 21
38 (2001) performed cluster analysis in 167 pointed gourd genotypes (Trihosanthes dioica) collected from different ecogeographic region of India. On the basis of different yield contributing agro morphological traits, the genotypes were grouped into eight clusters which were non-overlapping. Cluster IV comprising the most number of genotypes (37 accessions) and cluster VI comprising the lowest number of genotypes (6 accessions). Intra cluster distance ranged from in Cluster I and in cluster VII. Cluster VIII and V were the most diverse as indicated by maximum inter cluster distance between them (6.049). The results indicated the potential for wide scope of varietal improvement through hybridization and selection due to the wide genetic diversity present in the accession studied. Principal component and grouping analyze of data on 31 plant morphological traits were used to estimate genetic divergence in 15 accessions of Cucurbita by Choer et al. (2000). It was observed that the accessions dispersed in a bidirectional space way, forming three groups, each on having two subgroups. Grouping analysis by the Ward method showed similar results to those obtained from principal component analysis. The traits that mostly contributed to genetic divergence were presence of thorns on the petiole internode number of the main vine up to the first female flower, fruit shape, fruit diameter, skin texture, predominant skin colour and number of days to the first male flower on the main vine. Ramos et al. (2000); were evaluated the genetic diversity of 40 squash accessions collected from distinct areas of the Northeast region of Brazil. The data were analyzed using canonic variable and Tocher cluster analysis adopting Mahalanobis D 2 general distance. It was observed that 65% of the accessions were clustered in a group. The disperse results based on the first four canonic variables (71% of total variability) did not permit a correlation between genetic diversity and eco-geographical origin. Rashid (2000), found that no relationship between geographic distribution and genetic diversity in pumpkin. The result suggested that geographic isolation is not 22
39 the only factor causing genetic diversity and this point should be considered in selecting parents for hybridization. Varalaksmi et al. (1994); conducted an experiment with 48 genotypes of ridge gourd collected from different regions of India to analyze genetic divergence. Nineteen (19) quantitative characters were selected to study genetic divergence using Mahalanobis D 2 statistics and Tocher method to form cluster. The 58 genotypes were grouped into five clusters but, in general there was no association between geographical distance and genetic divergence. There was substantial variation in cluster means for whole plant sex ratio, fruit number per plant, fruit weight and yield per plant. The inter cluster D 2 value indicated that cluster III was most divergent from the other clusters. 23

40
41 CHAPTER III MATERIALS AND METHODS This chapter explainsthe information concerning methodology that was used in conducting the experiment. It contains a brief description of location of the experimental site, characteristics of soil, climate, materials, layout and design of the experiment, land preparation, manuring and fertilizing, transplanting of seedlings, intercultural operations, harvesting, data recording procedure and statistical analysis etc. which are presented as follows Experimental site The research work relating to determine the genetic diversity of bitter gourds was conducted at the Sher-e-Bangla Agricultural University Farm, Dhaka-1207 during October2015 to February Geographical Location The experimental area was situated at N latitude and E longitude at an altitude of 8.6 meter above the sea level. The experimental field belongs to the Agro-ecological zone of the Madhupur tract, AEZ-28. This was a region of complex relief and soils developed over the Madhupur clay, where floodplain sediments buried the dissected edges of the Madhupur tract leaving small hillocks of red soils as islandssurrounded by floodplain. The experimental site was shown in the map of AEZ of Bangladesh in (Appendix I). 3.3 Climate The experimental area has subtropical climate characterized by high temperature, high relative humidity and heavy rainfall in Kharif season (April-September) and scanty rainfallassociated with moderately low temperature during the Rabi season (October-March). Weather information regarding temperature, relative humidity, 24
42 rainfall and sunshine hours prevailed at the experimental site during the study period was presented in Appendix II. 3.4 Characteristics of soil Soil of the experimental site belongs to the general soil type, shallow red brown terrace soils under Tejgaon Series. Top soils were clay loam texture, olive-gray with common fine to medium distinct dark yellowish brown mottles. Soil ph ranged from and had organic matter 0.84%. Experimental area was flat having available irrigation and drainage system and above flood level. Soil samples from 0-15 cm depths were collected from experimental field. The analyses were done by Soil Resource and Development Institute (SRDI), Dhaka. Physicochemical properties of the soil are presented in (Appendix III). 3.5 Design and layout of the experiment The experiment was laid out in Randomized Complete Block Design (RCBD) with three replications. The genotypes were distributed into the every plot of each block of the prepared layout of the experiment. The individual plot was 3 m x 1 m in size. The fifteen genotypes of the experiment were assigned at random into plots of each replication. The distance maintained spacing row to row 50 cm and plant to plant 2 m. The distance maintained between two blocks was 1 m. Appendix IV showing layout of the experimental plot. 3.6 Planting materials Fifteen genotypes of bitter gourd were used for the present research work. The purity and germination percentage were leveled as around 100 and 80 respectively. The genetically pure and physically healthy seeds of these genotypes were collected from the Department of Genetics and Plant Breeding and from local market. The experimental genotypes are presented in Table 1. 25
43 Table 1. Name of fifteen bitter gourd genotypes used in the present study Sl. No. Genotypes No. Identification No. 01 G 1 MC G 2 MC G 3 MC G 4 MC G 5 MC G 6 MC G 7 MC G 8 MC G 9 MC G 10 MC G 11 MC G 12 MC G 13 MC G 14 MC G 15 MC 1015 Source: Department of Genetics and Plant Breeding 26
44 3.7 Seed selection for sowing To ensure better germination healthy seeds were selected and before sowing seeds were soaked for 24 hours in water (Plate 1A). 3.8 Seed sowing in the pot and raising of seedlings Seeds of different accessions were sown in the plastic pot. In each pot three seeds were sown and germination of seeds were completed within twelve days and the soil around the plant was firmly pressed by hand. The steps of seed sowing to raising of seedling for transplanting in the main land is illustrated in Plate 1 (B-F). 3.9 Land preparation The experimental plot was prepared by several ploughing and cross ploughing followed by laddering and harrowing with tractor and power tiller to bring about good tilth in the middle first week of October, Weeds and other stables were removed carefully from the experimental plot and leveled properly (Plate 2A) Pit preparation After final land preparation, pits of 50 cm 50 cm x 45 cm were prepared in each plot with a spacing of 3 m 1.25 m. Pits were kept open in the sun for 7 days to kill harmful insect and microorganisms (Plate 2B). To control field cricket 5 mg Furadan was also mixed with the soils of each pit before making it ready for dibbling Manure and fertilizers application The manure and fertilizers were applied to the plots for bitter gourd cultivation according to the doses in Table 1. Total cow dung, half of TSP and one third MOP were applied in the field during final land preparation. Remaining TSP, one third MOP, whole gypsum, zinc oxide and one third of urea were applied in pit one week prior to transplantation Remaining urea and MOP were applied as top dressing in four installments at 20, 40, 60 and 75 days after transplanting. Table 2 is showing dose of manure and fertilizers used in the study. 27
 Soaking of seed in water before sowing, B) preparation of small plastic pots for seed sowing, C) sowing of seed, D) emergence of seedlings, E)")
45 A C D B E F Plate 1.Different steps of seed preparation, sowing and raising of seedlings. A) Soaking of seed in water before sowing, B) preparation of small plastic pots for seed sowing, C) sowing of seed, D) emergence of seedlings, E) growing of seedlings, F) seedlings ready for transplanting. 28
 Land preparation, B) pit preparation, C) seedling transplanting, D) transplanted seedling after")
46 Plate 2.Different steps of land preparation and planting of seedlings. A) Land preparation, B) pit preparation, C) seedling transplanting, D) transplanted seedling after 3 days of transplanting. 29
47 Table 2. Dose of manure and fertilizers used in the study Sl. No. Fertilizer/Manure Dose 1 Cowdung 10 ton/ha 2 Urea 150kg/ha 3 TSP 100kg/ha 4 MOP 150kg/ha 5 Gypsum 80kg/ha 6 Zinc Oxide 8kg/ha 3.12 Transplanting of seedlings Healthy and vigorous seedlings of one month old were selected for transplanting in the main land. The seedlings were removed carefully from the small plastic pots by avoiding any injuries and sown one seedling per pit in the evening time. Slight watering was provided after transplantation (Plate 2C and 2D) Intercultural operations The following intercultural operations were done from time to time throughout the cropping season for proper growth and development of the plants. Different intercultural operations provided are shown in Plate Weeding Several weeding were done as per requirement. At the very first stage weeding was done for ease of aeration and less competition seedling growth and mulch was provided after an irrigation to prevent crust formation and facilitate good aeration Irrigation and after-care In the early stage irrigation was done twice daily by water cane. In mature stage flood irrigation was done whenever it was necessary. 30
 Fertilizer application (top dressing), B)stalking, C) tying, D) creeping on bamboo")
48 A B C D E Plate 3.Different steps of intercultural operations. A) Fertilizer application (top dressing), B)stalking, C) tying, D) creeping on bamboo pandal, E) flood irrigation. 31
49 312.3 Pesticide application At the seedling stage red pumpkin beetle attacked tender leaves and gradually attacked the whole plant. Malathion and Ripcord was sprayed in the field to reduce the infestation of insect pests. In mature stage fruit fly caused damage to the fruit. Ripcord, sevin powder were sprayed for controlling this insect Stalking and tying Mechanical support was provided to the growing plants by dhaincha sticks to keep them erect and support the plant before flowering.the vines were tied with thin rope with the dhaincha sticks. A bamboo pandal(macha) was then preparedand allowed the vine to creep on the pandal. The bamboo pandal was prepared using bamboo, plastic rope and metallic wire Harvesting Fruits were picked on the basis of horticultural maturity, size, colour and age being determined for the purpose of consumption as the fruit grew rapidly and soon getbeyond the marketable stage, frequent picking was done throughout the harvesting period. Fruits were picked with sharp knife and care was taken to avoid injury of the vine Data recording Data were recorded on the following parameters from the studied plants throughout their life cycle. Therecordeddata were on the individual plant basis Morphological data The morphological data were recorded based on visual assessment by single observation on a group of plants or part of plants. Measurement on a number of individual plant or part of plant was also used for morphological data. Leaf character (number of leaf lobes, depth of lobing and blade length), fruit 32
50 character(fruit ridge and tubercles), ovary length and seed characters (indentation of margin and seed colour) were assessed Yield and yield contributing data The data on different yield contributing characters are recorded as follows Days to first male flowering The number of days required for first male flowering was counted forthree replications separately and average data was recorded Days to first female flowering The number of days required for first female flowering was recorded for threereplication separately and average data was recorded Vine length (m) Vine length measured in meter in main vine and average data was recorded Number of nodes per vine The number of nodes per vine was counted and average data was recorded Branches per vine Branches per vine per vine were counted and average data was recorded Fruit length (cm) Fruit length was measured in 3-5 fruits of different plants in cm and average data was recorded during fruit harvest for vegetable use Fruit diameter (cm) Fruit diameter was measured in 3-5 fruits of different plants in cm and average data was recorded during fruit harvest for vegetable use. 33
51 Number of fruit per plant The number of fruit per plant was counted and average data was recorded Weight per fruit (g) Weight of 3-5 fruits of different plants during harvest for vegetable use was measured in gram (g) Yield per plant (kg) Weight of edible fruit fruits of selected plants from each accession was weighted in kilogram (kg) Statistical analysis Mean data of the characters were subjected to multivariate analysis. Univariate analysis of the individual character was done for all characters under study using the mean values and was estimated using MSTAT-C computer programme. Duncan s Multiple Range Test (DMRT) was performed for all the characters to test the differences between the means of the genotypes. Mean range and coefficient of variation (CV %) were also estimated using MSTAT-C. Multivariate analysis was done by computer using GENSTAT 5.13 and Microsoft Excel 2000 software through four techniques viz., Principal Component Analysis (PCA), principal Coordinate Analysis (PCO), Cluster Analysis (CA) and Canonical Analysis (CVA) Estimation of genotypic and phenotypic variances Genotypic and phenotypic variances were estimated according to the formula of Johnson et al. (1955). a. Genotypic variance, δ 2 g MSG MSE r Where, MSG = Mean sum of square for genotypes 34
52 MSE = Mean sum of square for error, and r = Number of replication b. Phenotypic variance, p g e Where, 2 g = Genotypic variance, 2 g = Environmental variance = Mean square of error Estimation of genotypic and phenotypic co-efficient of variation Genotypic and phenotypic co-efficient of variation were calculated by the following formula Burton (1952). δ GCV δ PCV g p x x Where, GCV = Genotypic co-efficient of variation PCV = Phenotypic co-efficient of variation δ g = Genotypic standard deviation δ p = Phenotypic standard deviation x = Population Estimation of heritability Broad sense heritability was estimated (Lush, 1943) by the following formula, suggested by Johnson et al. (1955). Heritability, h 2 b%= Where, 2 g 2 ph 100 h 2 b = Heritability in broad sense 2 g = Genotypic variance 2 ph = Phenotypic variance 35
53 Estimation of genetic advance The expected genetic advance for different characters under selection was estimated using the formula suggested by Lush (1943) and Johnson et al. (1955). Genetic advance, GA = K. h 2. p 2 Or Genetic advance, GA = K. 2 g ph. ph Where, K = Selection intensity, the value which is 2.06 at 5% selection intensity ph = Phenotypic standard deviation h 2 b= Heritability in broad sense 2 g = Genotypic variance 2 ph = Phenotypic variance Estimation of genetic advance mean s percentage Genetic advance as percentage of mean was calculated from the following formula as proposed by Comstock and Robinson (1952): Genetic Advance Genetic advance ( of mean) = (GA) 100 Population mean ( x ) Estimation of simple correlation co-efficient Simple correlation co-efficient (r) was estimated with the following formula (Singh and Chaudhary, 1985; Clark, 1973). [{ x. y xy N 2 ( x) ( y) 2 2 x }{ y N N r 2 Where, = Summation x and y are the two variables correlated N = Number of observation }] 36
54 Path co-efficient analysis Path co-efficient analysis was done according to the procedure employed by Dewey and Lu (1959) also quoted in Singh and Chaudhary (1985) using simple correlation values. In path analysis, correlation co-efficient is partitioned into direct and indirect independent variables on the dependent variable. In order to estimate direct & indirect effect of the correlated characters, say x1, x2 and x3 yield y, a set of simultaneous equations (three equations in this example) is required to be formulated as shown below: r r r yx1 yx2 yx3 P P P yx1 P r yx1 x1x2 r yx1 x1x3 r yx2 x1x2 P P yx2 P P r yx2 x2x3 r yx3 x1x3 r yx3 x2x3 P yx3 Where, r s denotes simple correlation co-efficient and P s denote path co-efficient (Unknown). P s in the above equations may be conveniently solved by arranging them in matrix from. Total correlation, say between x1 and y is thus partitioned as follows: P yx1 = The direct effect of x1 on y. P yx2 r x1x2 = The indirect effect of x1 via x2 on y. P yx3 r x1x3 = The indirect effect of x1 via x3 on y. After calculating the direct and indirect effect of the characters, residual effect (R) was calculated by using the formula given below (Singh and Chaudhary, 1985): P 2 RY 1 Where, P iy. riy 2 P RY = (R 2 ); and hence residual effect, P iy = Direct effect of the character on yield Riy = Correlation of the character with yield. R 2 ( P RY ) 1/ 2 37
55 3.15.8Estimation of Genetic Diversity The genetic diversity among the genotypes was assessed by Mahalanobis s(1936) general distance (D 2 ) statistic and its auxiliary analyses. The parents selection in hybridization programme based on Mahalanobis s D 2 statistic is more reliable as requisite knowledge of parents in respect of a mass of characteristics is available prior to crossing. Rao (1952) suggested that the quantification of genetic diversity through biometrical procedures had made it possible to choose genetically diverse parents for a hybridization programme. Multivariate analysis viz. Principal Component analysis, Principal Coordinate analysis, Cluster analysis and Canonical Vector analysis (CVA), which quantify the differences among several quantitative traits, are efficient method of evaluating genetic diversity. These are as follows Principal Component Analysis (PCA) Principal component analysis, one of the multivariate techniques, is used to examine the interrelationship among several characters and can be done from the sum of squares and product matrix for the characters. Therefore, principal component were computed from the correlation matrix and genotype scores obtained from the first components (which has the property of accounting for maximum variance) and succeeding components with latent roots greater than the unity. Contribution of the different morphological characters towards divergence is discussed from the latent vectors of the first two principal components Principal Coordinate Analysis (PCO) Principal coordinate analysis is equivalent to principal component analysis but it is used to calculate inter-unit distances. Through the use of all dimensions of P it gives the maximum distances between each pair of the n point using similarity matrix, Digby et al. (1989). 38
56 Clustering To divide the genotypes of the study into some number of mutually exclusive groups clustering were done using non-hierarchical classification. Starting from some initial classification of the genotypes into required groups, the algorithm repeatedly transfers genotypes from one group to another so long as such transfers improve the criterion, the algorithm switches to a second stage which examine the effect of swapping two genotypes of different classes and so on Average Intra-cluster Distances The average intra-cluster distances for each cluster was calculated by taking possible D² values within the member of a cluster obtained from the Principal Coordinate Analysis (PCO). The formula used was D²/n, where D² is the sum of distances between all possible combinations (n) of the genotype included in the cluster. The square root of the average D² values represents the distances (D) within cluster Canonical Vector analysis (CVA) Canonical vector analysis (CVA) finds linear combination of original variabilities that maximize the ratio of between group to within group variation, thereby giving functions of the original variables that can be used to discriminate between the groups. Thus, n this analysis a scres of orthogonal transformation sequentially maximizing of the ratio of among groups to the within group variations. The canonical vector are based upon the roots and vectors of WB, where W is the pooled within groups covariance matrix and B is the among groups covariance matrix Selection of varieties for future hybridization programme Divergence analysis is usually performed to identify the diverse genotypes for hybridization purposes. The genotypes grouped together are less divergent among 39
57 themselves than those, which fall into different clusters. Clusters separated by largest statistical distance (D 2 ) express the maximum divergence among the genotypes included into these different clusters. Variety (s) or line(s) were selected for efficient hybridization programme according to Singh and Chuadhury (1985). According to them the following points should be considered while selecting genotypes for hybridization programme: 1. Choice of cluster from which genotypes are selected for use as parent (s) 2. Selection of particular genotype(s) from the selected cluster(s) 3. Relative contribution of the characters to the total divergence 4. Other important characters of the genotypes 40
58
59 CHAPTER IV RESULTS AND DISCUSSION The experiment was conducted to perform the diversity analysis of different genotypes of bitter gourd (Momordica charantia L.) using yield contributing and morphological traits. This chapter comprises the presentation and discussion of the findings obtained from the experiment. The data were collected from the seedling stage to after harvest stage. The gradual change of active vegetative growth, flowering, fruiting and harvesting is presented in Plate 4.The data pertaining to ten morphological characters and ten yield contributing characters have been presented and statistically analyzed with the possible interpretations given under the following headings. 4.1 Morphological characterization Phenotypic expression of morphological characters in bitter gourd genotypes showed wide range of variation under studied. The morphological traits of all cucurbitaceous species was reported by Hutchinson et al. (1954). In the present study, only the characters showing variation are explained. Phenotypic traits like seed color is the effect of genetic factor exhibited to synthesis or pigment in seed coat. Above all the described characters are stable and are not influenced by environment. Thus, selection on the basis of these traits will be effective Leaf characters The leaf characters of 15 genotypes were studied based on their number of lobes, depth of lobbing and length of leaf blade (Table 3). The lobes were characterized based on their number and depth. The leaves of seven genotypes (G1, G3, G6, G8, G11, G12 and G15) had 5 lobes and the leaves of eight genotypes (G2, G4, G5, G7, G9, G10, G13 and G14) had 7 lobes. Depth of lobing of leaves was classified as shallow, medium and deep. G2, G9 and G4 showed shallow depth lobed leaves. G3, G5, G7, G8, 41
 Active vegetative stage, B)flowering stage, C)fruiting stage, D) Harvesting of")
60 Plate 4.Different stages of mature bitter gourd plant in the experiment. A) Active vegetative stage, B)flowering stage, C)fruiting stage, D) Harvesting of fruits. 42


 8 G3, G4,")
61 Blade length Depth of lobing No. of lobes Table 3. Frequency distribution of genotypes belonging to different phenotypic classes of leaf character Traits Category Total genotypes Genotypes Phenotype 5 lobes 7 G1, G3, G6, G8, G11, G12, G15 7 lobes 8 G2, G4, G5, G7, G9, G10, G13, G14 Shallow 3 G2, G9, G4 Medium 8 G3, G5, G7, G8, G10, G12, G13, G15 Deep 4 G1, G6, G1, G14 Short (<6cm) 3 G2, G9, G10 Medium (>6-9 cm) 8 G3, G4, G7, G8, G11, G12, G13, G14 Long (>9 cm) 4 G1, G5, G6, G15 43
62 G10, G12, G13 and G15 genotypes showed medium depth lobed leaves. Deep lobed leaves were found in G1, G6, G11 and G14 genotypes. Short leaf blade (<6cm) leaves were found in G2, G9 and G10 (Table 3). Medium length (>6-9cm)of leaves were found in G3, G4, G7, G8, G11, G12, G13 and G14 genotypes. The leaves having long (>9cm) type of leaf blades were found in G1, G5, G6 and in G15 genotypes. De wilde and Duyfjes (2002) were found deep and palmate 5-9 lobed leaves in M. Charantia L Fruit character The fruit characters in study were classified in fruit colour and fruit texture (Table 4). Different fruit color was found in two stages. One stage is marketable maturity color where the fruits showed light green color genotypes (G2, G3, G6 and G9), green color genotypes (G1, G4, G5, G7, G10, G11 and G14) and dark green color genotypes (G8, G12 and G13). Another stage was ripening stage where yellow color genotypes (G1, G3, G5, G6, G7, G12, G13 and G15) and orange color genotypes (G2, G4, G9, G11 and G14) were found. Two types of fruit texture were found in the genotypes (Table 4). Fruit ridge were of two types, continuous and discontinuous. Continuous ridge was found in the genotypes G4, G5, G6, G8, G9, G11 and G14) and discontinuous type of ridge was found in the genotypes G1, G2, G3, G10, G13, G14 and G15). Medium number of tubercles was found in genotypes G5, G6, G11, G12 and many tubercles found in Genotypes G1, G3, G4, G7, G8, G9, G10, G12, G13, G14 and G15) Ovary character Two type ovary of bitter gourd genotypes were found on the basis of length (Table 5). One was short ( cm) type which was found in the genotypes G5, G7, G8, G9, G13 and G14.Another was long (>2.5 cm) type genotypes G2, G3, G4, G6, G10, G11 and G13). 44


63 Tubercles Fruit texture Fruit ridge Ripe stage colour Fruit colour Marketable maturity colour Table 4. Frequency distribution of genotypes belonging to different phenotypic classes of fruit character Traits Category Total genotypes Genotypes Phenotype Light green 4 G2, G3, G6, G9 Green 7 G1, G4, G5, G7, G10,G11, G14 Dark green 3 G8, G12, G13 Yellow 10 G1, G3, G5, G6, G7,G12,G13,G15 Orange 5 G2, G4, G9, G11, G14 Continous 7 G4, G5, G6, G8, G9, G11, G14 Discontinous 8 G1, G2, G3, G10, G13, G14, G15 Medium 4 G5, G6, G11, G12 Many 11 G1, G3, G4, G7, G8, G9, G10, G12, G13, G14, G15 45


64 Seed Colour Seed Indentation of Margin Ovary Types Table 5. Frequency distribution of genotypes belonging to different phenotypic classes of ovary and seed character Traits Category Short Cm Total genotypes 6 Genotypes G5, G7, G8, G9, G13, G14 Phenotype Long >2.5 Cm 9 G2, G3, G4, G6, G10, G11, G13 Small 3 Medium 8 G7, G9, G10, G12,G13, G14 G2, G5, G6, G11 Large 4 G1, G3, G4, G8 Small medium large Light brown 3 G1, G5, G11, G14 Brown 8 G3, G6, G8, G9, G12 Dark Brown 4 G2, G4, G7, G10, G13, G15 46
65 4.1.4 Seed character Genotypes showed morphological variation in seed character (Table 5). Seed indentation and seed colour are the two main characters. Seed indentation was small type, medium type and large type. Small type indentation was found in G7, G9, G10, G12, G13 and G14 genotypes. Medium type indentation was found in G2, G5, and G6and G11 genotypes. Large type indentation was found in G1, G3, G4 and G8 genotypes. Three types of seed color were found, light brown, brown and dark brown. The seeds of genotypes G1, G5, G11 and G14 showed light brown color. Genotypes G3, G6, G8, G9 and G12 showed brown color seed and G2, G4, G7, G10, G13 and G15 showed dark brown color seed. 4.2Genetic variability, heritability and genetic advance Variability and estimation of genetic parameter in order to different plant characters are discussed below. The mean performance of different traits of 15 genotypes of bitter gourd is presented in Appendix V and the analysis of variance is presented in Appendix V Vine length For all genetic parameter among fifteen genotypes had adequate variation presented in Appendix VI. There were significant differences in vine length among the genotypes. The maximum value of vine length (4.32 m) was recorded in G2 (Appendix V). This genotype was statistically similar with genotypes G1, G2, G3, G6, G7, G8, G11 and 14. The minimum value(3.28) of vine length was found in G15. Robinson and Decker walters (1997) were also found similar significant variation for vine length. The phonotypic expression of plant characters depend on the interaction between genotypic characters and environment. The more environmental effect inhibits the expression of genetic characters. Vine length genotypic and phenotypic variances were high presented in (Table6). The phenotypic co-efficient of variation was higher than genotypic one which indicated more influence of environment. Less difference 47
66 Table 6: Estimation of genetic parameters in twelve characters of fifteen genotypes in bitter gourd Traits MSG MSE Mean ơ 2 g ơ 2 P GCV PCV ECV h 2 b GA (5%) GAPM CV(%) VL 0.286** B/V ** N/V ** DFFM ** DFFF ** FL ** FB 1.073** FW ** NF/P ** F/P 0.786** * Significant at 5% level of probability ** Significant at 1% level of probability VL= Vine Length (m), B/V= Branch/Vine, N/V= Node/Vine, DFFM= Days to 1st flower (male), DFFF= Days to 1st Flower (Female), FL= Fruit Length (cm), FB= Fruit Breadth (cm), FW= Fruit Weight, NF/P= No. of Fruit/Plant and F/P= Fruit/Plant (kg) 48

67 Plate 5. Phenotypic variation of leaf on vine of bitter gourd genotypes 49
68 between PCV (10.9%) and GCV (8.88%) took the advantage of vine length at final harvest. High values of heritability and low values of genetic advance and genetic advance in percent of mean have recorded for vine length, indicating that this character was controlled by non-additive gene effects. So, selection of this character wouldn t be effective. The result of Chowdhury and Sharma (2002) contradict with the present findings where the high heritability is coupled with high genetic advance for this character. The variation in leaves morphology present on vines is presented in Plate Branch per vine Number of branch per vine in bitter gourd genotypes indicated significant variations. The maximum number of branches was and the minimum number of branches was The mean value was for number of branches (Appendix V). G9 showed that maximum number of branches pursued by genotypes G1, G2, G3, G4, G5, G6, G8, G10, G11, G12, G13, G14 and G15. The minimum branches per vine (13.89) recorded in G7.There was minor environmental influence on the exposure to the character, because the difference between phenotypic (20.69) and genotypic (20.27) co-efficient of variation was very close to each other (Table 6). Suggesting environmental influence is minor on the expression of genes controlling this trait. So, selection based upon phenotypic expression of this character would be effective for the improvement of this crop. High heritability with low genetic advance and moderate genetic advance in percent of mean indicates non-additive gene action controlling this trait. Variation in branch per vine was also observed in snake gourd genotypes by Banik (2003) Nodes per vine Significant differences in nodes per vine were found from to among the genotypes (Table 6). The mean value was recorded for nodes per vine. The maximum number of nodes per vine observed in genotype G11followed by genotypes G9 and G15. The genotypic (97.00) and phenotypic (101.07) variance with phenotypic co-efficient of variation (15.37%) and 50
69 genotypic co-efficient of variation (15.05%) were indicated the minor environmental impact on the expression of the character(table 6). The heritability estimates for this trait was high (95.98), genetic advance was (19.88%) and genetic advance in percent of mean (30.38) were found moderate, this trait was governed by non additive gene. High heritability and low genetic advance for this character was also observed by Banik (2003) Days to first flower (male) The variance due to days to first flowering showed that the genotypes differ significantly. The range of days to first male flowering were varies from days to days with mean value days (Appendix V). The genotypic co-efficient of variation and phenotypic co-efficient of variation were 6.61 and 6.72 respectively (Table 6). The phenotypic variance and genotypic variance suggested minor influence of environment on the expression of genes controlling the trait. Therefore, selection based upon phenotypic expression of this character would be effective for the improvement of the crop.a similar finding was reported by Singh et al.(2002) in ridge gourd Days to flower (female) Significant variation was found for days to female flowering and it ranged from DAT in G11 to DAT in G4 with the mean value days (Appendix V). The genotypic and phenotypic variance was and respectively. The PCV was 8.76% and the GCV was 8.74%.(Table 6). The phenotypic variance and genotypic variance advised less environmental influence on the expression of genes governing days to flower (female). Many author also found similar result (Miah et al. 2000; Sharma et al. 2000).The heritability estimates was high (99.56%) with the low genetic advance (9.63%) and genetic advance in percent of mean 17.97%, indicating this trait was controlled by non additive genes. Guffar (2008) support the findings. Plate 6and Plate 7 illustrates the morphological variation in female and male flower. 51

70 Plate 6.Phenotypic variation female in flower of bitter gourd genotypes. 52

71 Plate7. Phenotypic variation in male flower of bitter gourd genotypes. 53
72 Fruit Length The fruit length was noticed as cm with a range of 7.67 cm to 17.02cm. The genotype G11 showed the maximum fruit length and the genotype G5 showed the minimum fruit length (Appendix V). The genotypic variance (7.69) and phenotypic variance (7.95) with the co-efficient of variation genotypic (22.06) and phenotypic (22.43) were closed to each other (Table 6), indicating minor environmental influence on this character that would be effective for improvement of this crop. High heritability estimates 96.76% with low genetic advance (5.62%) over percent of mean (44.71%) (Table 6) indicate that effective selection may be made for fruit length. Sharma et al. (2000), Krisna Prasad and Singh (1994), Hormuzdi and More (1989) were reported the similar findings for bitter gourd. The phenotypic variation of fruit character is illustrated in Plate Fruit Breadth The mean fruit breadth was 3.83 cm with a range of 2.92 cm (in genotype G15) to 4.81 cm (in genotype G7) (Appendix V). Sharma et al. (2000), Krisna Prasad and Singh (1994), Hormuzdi and More (1989) were found similar results. The genotypic variance (0.51) and phenotypic variance (0.56) with coefficient of variation genotypic (18.69%) and phenotypic (19.56%) was found respectively (Table 6) were closed to each other, indicating minor environmental influence on this character that would be effective for the improvement of bitter gourd. High heritability estimates (91.28%) with low genetic advance (1.41%) over moderate percent of mean (36.78%) (Table 6) indicate that effective selection may be made for fruit breadth. High heritability coupled with low genetic gain for this character was observed by Sahaet al. (1992) Fruit weight The highest single fruit weight was found g in genotype G4. where the minimum fruit weight was recorded 28.55g in genotype G5 with the mean value 58.71g (Appendix V). Prasad and Singh (1992) was found more variation 54

73 Plate 8.Phenotypic variation in individual fruits of bitter gourd genotypes. 55
74 among bitter gourd genotypes in case of fruit weight. The genotypic (670.22) and phenotypic (678.87) variance for fruit weight was high (Table 6). The coefficient of variation genotypic (44.10%) and phenotypic (44.38%) were found respectively and closed to each other, proved that environment has little influence of the expression of this character (Table 6). Therefore, selection based upon phenotypic expression of this character would be effective for the improvement of this crop. High heritability (98.73%) associated with high genetic advance in percent of mean (90.26%) and high genetic advance (52.99%) (Table 6) was observed indicating fruit weight governed by additive gene. Chowdhury and Sharma (2002), Rumaran et al. (1997) also reported similar findings in respect to average fruit weight in ridge gourd and pumpkin, respectively Number of fruits per plant From the present study we observed that the highest number of fruit per plant was recorded in genotype G11 and the lowest number of fruit per plant recorded in genotype G15 (Appendix V). Anonymous (2000) reported that number of fruits per plant varied significantly among the studied cucumber lines. The difference between the genotypic variance (19.81) and phenotypic variance (20.67) indicates less environmental influence (Table 6). The coefficient of variation genotypic (15.94%) and phenotypic (16.28%) level was moderate, which indicated presence of low variability among the genotype (Table 6). The heritability estimates for this strait was high (95.85%), genetic advance (8.98%) and genetic advance in percent of mean (32.14%), revealed that this character was governed by additive gene and selection for this character would be effective (Table 6). Chowdhury and Sharma (2002) also reported similar findings in respect to average fruit weight in ridge gourd Fruit yield (kg) per plant The fruit yield per plant was found 2.27 kg in genotype G11 which is highest and the lowest was recorded 0.73 kg in genotype G5 with the mean value 1.61 kg (Appendix V). The genotypic variance (0.38) and phenotypic (0.41) 56
75 variance (Table 6) suggested less influence of environment on the expression of the genes controlling this character which gives idea about selection. Estimation of high heritability (93.28%) with low genetic advance (1.23%) and high genetic advance of percent (76.10%) (Table 6) revealed that this character was governed by additive gene and provides opportunity for selecting high valued genotypes for breeding program. Abusaleha and Dutta (1990) found similar result for this character in bitter gourd. 4.3 Correlation studies Determination of correlation co-efficient was provided the information how yield depends on different yield contributing characters. The correlation coefficient, values of r and the parameter correlated were shown in Table (7 and 8). Simple correlation was divided into phenotypic (directly observed) and genotypic (inherent association between character) Vine Length Vine length had non significant and positive correlation with branch per vine (0.399 and 0.372), node per vine (0.215 and 0.194), number of fruits per plant (0.267 and 0.259) at genotypic and phenotypic level (Table 7 and 8). This finding was supported by Abusaleha and Dutta (1988). Vine length of bitter gourd had non significant and negative correlation with days to first male flower ( and ), days to first female flower (-0.080) and (-0.073), fruit length ( and -0.83), Fruit breadth ( and ), fruit weight ( and ) and fruit yield per plant ( and ) at genotypic and phenotypic level (Table 7 and 8) Days to first male flowering Days to first flowering male had significant positive correlation with days to first female flowering (0.830 and 0.822) at genotypic and phenotypic level (Table 7 and 8). This character also significant negatively correlated with number of fruit per plant ( and ) at genotypic and phenotypic level. Days to first male flowering also non significant negatively correlated with fruit length ( and ), fruit breadth ( and ), fruit weight 57
76 Table 7. Genotypic correlation coefficients among different pairs of yield and yield contributing characters for different genotypes of bitter gourd Traits B/V N/V DFFM DFFF FL FB FW NF/P F/P VL B/V 0.798** ** N/V ** ** DFFM 0.830** * DFFF * FL 0.528* 0.581* ** FB * 0.517* FW ** NF/P * Significant at 5% level of probability ** Significant at 1% level of probability VL= Vine Length (m), B/V= Branch/Vine, N/V= Node/Vine, DFFM= Days to 1st flower (male), DFFF= Days to 1st Flower (Female), FL= Fruit Length (cm), FB= Fruit Breadth (cm), FW= Fruit Weight, NF/P= No. of Fruit/Plant and F/P= Fruit/Plant (kg) 58
77 Table 8. Phenotypic correlation coefficients among different pairs of yield and yield contributing characters for different genotypes of bitter gourd Traits B/V N/V DFFM DFFF FL FB FW NF/P F/P VL N/V 0.788** ** N/V ** ** DFFM 0.822** * DFFF * ** FL 0.515* 0.577* ** FB * 0.51 FW ** NF/P * Significant at 5% level of probability ** Significant at 1% level of probability VL= Vine Length (m), B/V= Branch/Vine, N/V= Node/Vine, DFFM= Days to 1st flower (male), DFFF= Days to 1st Flower (Female), FL= Fruit Length (cm), FB= Fruit Breadth (cm), FW= Fruit Weight, NF/P= No. of Fruit/Plant and F/P= Fruit/Plant (kg) 59
78 ( and ) and the significant negative correlation found with number of fruit per plant ( and ) at genotypic and phenotypic level (Table 7 and 8). Khan et al. (2008) reported almost similar result in case of pointed gourd Days to first female flowering Days to first female flowering had non significant negatively correlated with fruit length ( and ) and significantly negative correlated with fruit breadth ( and ) and number of fruit per plant ( and ) at genotypic and phenotypic level. It also negatively correlated with fruit per plant (kg) ( and ) at genotypic and phenotypic level (Table 7 and 8). Guffar (2008) also found similar result in case of bitter gourd Fruit character Significant positive correlation present in fruit yield with fruit characters such as fruit length (0.679), fruit breadth (0.517) and fruit weight (0.888) had a high degree of association (Table 7 and 8). This showed that with the increase of fruit length, fruit breadth, fruit weight altimately yield per plant will be increased. Miah et al. (2000); noted that fruit yield in bitter gourd showed significant positive association with average fruit weight, fruit breadth and number of nodes per vine in genotypic and phenotypic correlation with days to male flowering. Sarker et al. (1999); studied correlation of 16 divergence types of pointed gourd indicated that fruit weight, fruit diameter and number of primary branches per plant were positively and significantly correlated with yield per plant followed by fruit weight and fruit diameter had maximum positive direct effects on yield. 4.4 Path analysis Path analysis showed that the cause and effect situation of dependent and independent variable. For example yield considered as dependent variable and vine length, days to first flowering and fruit characters are independent variable. Path analysis gives the original pictures of inter relationship between 60
79 yield and yield attributing characters. Path co-efficient analysis was showed direct and indirect effects of different characters on yield of bitter gourd in Table Vine length Path co-efficient analysis in table (9) indicated that vine length had direct and positive (0.051) effect on yield. Vine length had indirect positive effect on yield via branch per vine (0.030), node per vine (0.016), fruit length (0.066), breadth (0.002), Number of fruit per plant (0.089). Besides negatively indirect effect via days to first male flower (-0.013), days to first female flower ( ), fruit weight (-0.176) and fruit per plant (-0.076) presented in Table (9). Shah and Kale (2002) reported similar result with the present study and they stated that vine length had positive direct effect on yield per plant Days to first male flowering Days to first male flowering had direct positive effect on yield of bitter gourd (0.056). It also had indirect negative correlation with yield via vine length ( ) branch per vine (-0.065), node per vine (-0.072) and fruit weight. Besides positive indirect correlation with yield via days to first female flower (0.092), fruit length (0.083), fruit breadth (0.007) showed in Table (9). Li et al.(1997) were found negative correlation of days to first male flowering with yield Days to first Female flowering Days to first female flowering had positive direct effect on yield of bitter gourd (0.111) which influence to genotypic correlation with fruit per plant (-0.174). It also had indirect negative effect with vine length (-0.004), branch per vine ( ), node per vine (-0.053) and number of fruit per plant (-0.238). It had indirect positive effect on yield via days to first male flower (0.047), fruit length (0.093), fruit breadth (0.010), fruit weight (0.085) Table (9). Rastogi et al. (1990) showed that days to female flowering had positive and direct effect on yield, which is supported by present findings. 61
80 Table 9. Path coefficient analysis showing direct and indirect effects of different characters on Fruit/Plant (kg) ofbitter gourd Characters Vine Length (m) Branc h/vine Node/ Vine Days to 1st flower (male) Days to 1st Flower (Female) Fruit Length (cm) Fruit Breadth (cm) Fruit Weight No. of Fruit/Plant Genotypic correlation with Fruit/Plant (kg) Vine Length (m) Branch/Vine Node/Vine Days to 1st flower (male) Days to 1st Flower (Female) Fruit Length (cm) ** Fruit Breadth (cm) * Fruit Weight ** No. of Fruit/Plant Residual effect:
81 4.4.4 Fruit character Fruit length had positive direct effect (0.315) on yield per plant of bitter gourd genotypes. It had indirect positive effect via fruit weight (0.411), number of fruit per plant (0.014) and node per vine (0.009) (Table 9).Zhang et al. (1999) stated that average fruit weight, number of fruits per plant and fruit length had direct effect on yield of bitter gourd genotypes.there was a significant and positive correlation between yield and yield attributing characters among indigenous and exotic bitter gourd cultivars(rajput et al., 1991). 4.5 Multivariate analysis Cluster analysis The experiment was conducted to investigate the genetic diversity of fifteen genotypes of bitter gourd. The genotypes were divided into four cluster according to D 2 analysis (Table10).The cluster III had maximum number of genotypes (7) followed by cluster I which had 4 genotypes. Cluster II and IV had two genotypes. Remarkably cluster I had (G3, G12, G13 and G15) where as cluster II had (G9 and G11). Furthermore cluster III had (G1, G2,G5,G6,G7,G8 and G15), cluster IV showed two genotypes (G4 and G10). Clustering was done at random that indicate a broad genetic base of the genotypes. Genetic variability in bitter gourd was also found by Prasad et at. (2001) Principal component analysis (PCA) Proper idea about genetic divergence is an important tool for breeding program. The diversity analysis is useful to determine the magnitude of divergence among population (Murthy and Quadri, 1966). Principal component analysis was studied with fifteen genotypes of bitter gourd. First three Eigen values for three principal co-ordination axes of genotypes accounted for 79.68% variation (Table11).Based on principal component scores I and II obtained from the Principal component analysis (Table 12), a two-dimensional scatter diagram 63
82 (Z1-Z2) using component score I as X axis and component score II as Y axis was Constructed, which has been presented in Figure 1. Table 10. Distribution of genotypes in different clusters Cluster Number of genotype Genotypes I 4 G 3, G 12, G 13, G 14 II 2 G 9, G 11 III 7 G 1, G 2, G 5, G 6, G 7, G 8, G 15 IV 2 G 4, G 10 64
83 Table 11. Eigen values and yield percent contribution of 10 charactersof15 genotypes of bitter gourd Parameters Eigen values Percent Cumulative % of Percent variation variation Vine Length (m) Branch/Vine Node/Vine Days to 1st flower (male) Days to 1st Flower (Female) Fruit Length (cm) Fruit Breadth (cm) Fruit Weight No. of Fruit/Plant Fruit/Plant (kg)
84 Table 12. PC scores of fifteen genotypes of bitter gourd Genotype PC1 PC2 G G G G G G G G G G G G G G G
85 Figure1. Scatter distribution of fifteen genotypes of bitter gourd based on their principal component scores super imposed with cluster. 67
86 4.5.3 Principal coordination analysis Principal coordination analysis (PCO) indicated that the maximum inter genotypic distance between genotype G4 and G5 (1.637), the minimum distance was showed between genotype G1 and genotype G8 (Table 13).There was moderate level of variation present among fifteen genotypes of bitter gourd due to low inter genotypic distance. The maximum intra-cluster distance was presented in cluster I (0.938) which had four genotypes (G3, G12, G13, G14). The minimum intra-cluster distance was recorded in cluster II which containing two genotypes (G9,G11) (Table 10). Khan et al. (2008) reported twelve clusters in pointed gourd. Quaruzzaman et al. (2008) reported six clusters in ridge gourd Non-hierarchical clustering Fifteen (Momordica charantia L.) genotypes were divided into different group for non-hierarchical clustering (Table10). These finding ensures the clustering pattern of the genotypes gained by PCA. It indicated that cluster 1 contained four genotypes, cluster II and IV contained two genotypes and cluster III presented seven genotypes of bitter gourd. From cluster mean (Table14), cluster II had the maximum mean value for seven characters namely vine length (4.21 cm), Branch per vine (23.29) node per vine (83.28), fruit length (13.57), fruit breadth (4.21 cm), fruit weight (58.04 gm), Number of fruit per plant (83.61) and fruit yield per plant (1.96 kg). This cluster mean gives idea about the cluster II could be used for future hybridization program for vine length (m), branch per vine, node per vine, fruit length (cm), number of fruit per plant and fruit per plant (kg). Cluster III had required for days to first flower male (51.05) and days to first flower female (54.87). Cluster IV had highest mean value for fruit weight (101.57) and days to first flower required (56.39) days, cluster III and cluster IV had moderate mean value for all character. These genotypes of cluster could be used for future hybridization program. Singh et al. (2013) reported that contribution of the characters to the divergence in bitter gourd. 68
87 Table 13. Ten highest and ten lowest inter genotypic distance among the fifteen genotypes of bitter gourd Sl. Genotype combination Distance 10 lowest inter genotypic distances 1 G4-G G5-G G5-G G5-G G2-G G3-G G4-G G4-G G5-G G4-G lowest inter genotypic distances 1 G1-G G6-G G3-G G1-G G1-G G13-G G2-G G8-G G2-G G3-G
88 Table 14. Cluster mean values of 10 different characters of 15 genotypes of bitter gourd Parameters I II III IV Vine Length (m) Branch/Vine Node/Vine Days to 1st flower (male) Days to 1st Flower (Female) Fruit Length (cm) Fruit Breadth (cm) Fruit Weight No. of Fruit/Plant Fruit/Plant (kg)
89 4.5.5 Conical variate analysis Conical variate analysis (CVA) was done to calculate the inter-cluster distance. Table (13) were presented intra and inter-cluster distance (D 2 ) values. In this study the inter-cluster distances were more than the intra-cluster distances. It proved that the wide range of genetic variability among genotypes of bitter gourd. Intra and inter-cluster distances were indicated in Table 15. On the basis of intra and inter cluster (D2) value, the close cluster of cluster 1 was cluster III (9.790) and distant cluster was cluster II (25.16). Cluster II consists of nearest cluster with D2 values was IV (26.80) and distant cluster was cluster III (31.35) In case of cluster III the nearest cluster was I (9.7) and the distant cluster was cluster II (31.35). The closest cluster of cluster IV was the cluster I (20.89) and farthest cluster was cluster III (30.55). With the help of D 2 values within and between clusters, an arbitrary cluster diagram (Figure 2) was constructed, which showed the relationship between different genotypes. Diagram also showed the intra and inter cluster distance of fifteen genotype of bitter gourd. Shanmugam and Rangasamy(1982) stated that genotypes distributed in different clusters are sign of broad genetic base of diversity Selection of genotypes as parent for hybridization programme Genetically dissimilar parent selection is the fundamental works for hybridization programme. So the genotypes were chosen according to specific trait, maximum heteros is could be shown in offspring from the crosses between genetically diverse parents. On the basis of cluster mean and agronomic performance the genotype G11 for maximum vine length, branch per vine, early flowering, fruit length, number of fruit and fruit weight. G13 for maximum fruit length, fruit weight and fruit per plant (kg) were found promising. Therefore considering group distance and other agronomic performance the inter genotypic crosses between G9, G11, G4 and G13 and also other improved variety and might be suggested for future hybridization program. 71
90 Table 15. Intra (Bold) and inter cluster distances (D 2 ) for 15 genotypes of bitter gourd Cluster I II III IV I II III IV
91 II (0.102) IV (0.530) I (0.938) 9.79 III (0.356) Figure2. Diagram showing intra and inter cluster distance of fifteen genotype of bitter gourd 73
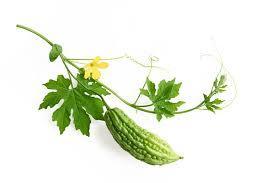
92
93 CHAPTER V SUMMARY AND CONCLUSION The experiment was conducted at Sher-e-Bangla Agricultural University Farm, Dhaka-1207, Bangladesh with fifteen genotypes of bitter gourd during October 2015 to February Seeds were sown on pots. The seedling transplanted into the main field in Randomized complete Block Design (RCBD) with three replication. As most of the morphological traits are not influenced by the environment, transfer of those characters is fully governed by genes and could be use in hybridization program. From this point of view, morphological characterization of leaf, fruit, flower and seed characters were performed. In order to investigate yield potential, genetic variability, character association, genetic divergence of fifteen genotypes data were recorded on yield contributing parameter such as vine length, branch per vine, node per vine, days to first flower (male), days to first flower (female), fruit length, fruit breadth, fruit weight, number of fruit per plant, fruit per plant (kg) under study. The genotypic and phenotypic variance along with co-efficient of variation for both (genotypic and phenotypic), showed adequate variation present among genotypes for all characters. In case of vine length, fruit weight, number of fruit per plant, fruit yield per plant indicated more environmental influence for expression of the trait. On the other hand branch per vine, node per vine, fruit length, fruit breadth indicate minimum genotypic and phenotypic variance difference suggesting additive gene action for the expression of the characters. Correlation co-efficient among the characters were used to investigate the relationship between yield and yield attributing traits. Most of the character showed higher genotypic correlation co-efficient than phenotypic correlation co-efficient which gives idea about the relationship between the characters under study. The significant positive correlation was found between yield and fruit length and fruit weight at genotypic and phenotypic level. There was non- 74
94 significant positive correlation between yield and branch per vine, node per vine, number of fruit per plant at genotypic and phenotypic level. On the other hand non-significant negative correlation was found between yield and vine length, days to first flower male and female at genotypic and phenotypic level. Path co-efficient analysis indicated that fruit length had positive correlation with fruit yield per plant. This character contributed to the yield through direct effect (0.315) which indicated that the selection will be more effective in future hybridization program. It was also found that fruit weight had highest positive correlation (0.888) and contributed to yield through direct effect (0.708) with fruit yield per plant gives idea about selection will be more judicious for future breeding. Number of fruit per plant had positive correlation with yield (0.332) positive indirect effect also found in vine length, branch per vine, days to flowering. Genetic diversity among bitter gourd genotypes was executed through principal component analysis (PCA), cluster analysis, canonical variate analysis (CVA) using GENSTAT software. The first three principal component axes accounted for 79.68% variation towards the divergence. Among four clusters cluster III had highest number of genotypes (7) on the other hand cluster II and cluster IV contain only two genotypes. In order to PCA, D 2 value and cluster analysis the genotypes grouped into four different clusters obtained from principal component scores. The maximum inter-cluster distance was found between cluster II and III (31.35) which indicated that the genotypes of two clusters if used in hybridization may produce a wide range of segregating generation. While the minimum inter cluster distance present between cluster I and cluster III (9.79). The highest intra-cluster distance was observed in cluster I (0.938) which obtained four genotypes. The lowest intra-cluster distance was observed in cluster II (0.102) contained two genotypes. 75
95 Therefore, hybridization between genotypes belonging to cluster I with cluster II, cluster II with cluster III, Cluster III with cluster IV and cluster II with cluster IV will produce maximum heterosis in respect of yield, single fruit weight and maximum number of fruit per plant. Considering the magnitude of cluster mean and yield attributing traits, it can be concluded that the performance of the G9 for vine length, branch per vine, early flowering and no. of fruit per plant was excellent. G4 for highest fruit length and fruit weight, G11 for early flowering and fruit yield per plant, G13 for maximum number of fruit per plant and higher yield were found promising. Therefore G4, G9, G11 and G13 considered as improved genotypes for high yielding genotypes and might be suggested for future hybridization program. 76

96
97 REFERENCES Abusaleha and Dutta, O.P. (1989). Interrelationship of yield components in cucumber. Veg. Sci. 15(1): Abusaleha and Dutta, O.P. (1990a). Study on variability, heritability and scope of improvement in cucumber. Haryana J. Hort. Sci. 19(34): Abusaleha and Dutta, O.P. (1990b). Association of yield components in ribbed gourd. Haryana J. Hort. Sci. 19(3-4): Anand, N.I., Singh, N.J. and Khanna, P.P. (1975). Inter-relationships and diversity in Indian colza. Indian J. Agric. Sci. 45: Anonymous. (1991). Basat Barita Sabji Utpada. BARI, Gazipur, Bangladesh. pp Anonymous. (2000). Annual Report ( ). Bangladesh agricultural Research Institute, Joydebpur, Gazipur. Anonymous. (2004). Research programme on vegetable improvement Horticulture Research Centre, BARI, Gazipur, Bangladesh. Badade, D.S., Warade, S.D. and Gaikwad, S.K. (2001). Genetic divergence in bottle gourd. J. Maharashtra Agril. Univ. 26(2): Banik, B.R. (2003). Inheritance pattern in snake gourd (Trichosanthes anguina L.). Ph. D. Thesis, Bangabandhu Sheikh Mujibur Rahman Agricultural University, Salna, Gazipur. pp Banik, R.B. (2003). Variability, gene action and heterosis in snake gourd (Trichosanthes anguina L.). Ph.D. Dissertation. BSMRAU, Salna, Gazipur. BBS (2012). Year Book of agricultural statistics of Bangladesh. Bangladesh Bureau of Statistics. Ministry of Planning. Govt. of the People s Republic of Bangladesh. Dhaka. Bhatt, G.M. (1973). Significant of path co-efficient analysis determining the nature of character association. Euphytica. 22: Bhuiyan, T.T.A. (2014). Genetic diversity in yield contributing and nutritional traits of tomato (Solanum lycopersicum L.). M.S. thesis, SAU, Dhaka, Bangladesh. Bose, T.K. and Som, M.G. (1986). Vegetable crops in India. Naya Prokash Bishausarani, Calcutta, India. pp Burton, G.W. (1952). Quantitative inheritance in Grasses. Proc. 6th. intl. Grassland, Cong. 1:
98 Chadhury, M.L. and Mandal, G. (1987). Correlation and path analysis in cucumber (Cucumis sativus L.). Haryana J. Hort. Sci. 16 (3-4): Chakravarty, H.L. (1990).Cucurbits of India and their role in the development of vegetable crops. In: M.D. Bates., W.R. Robinson and C. Jeffrey, (eds.). Biology and Utilization of cucurbitaceae Cornell Univ. press, Ithaca, NY. pp Choer, E., Silva, J.B. da. (2000). Genetic divergence evaluation in accessions of Cucurbita spp. through multivariate analysis. Agropecuaria Clima Temperado. 3(2): Chowdhury, D. and Shanna, K.C. (2002). Studies on variability, heritability, genetic advance and correlation in ridge gourd (Luffa acutangula Roxb.). Hort. J. 5(3): Clarke, G.M. (1973). Statistics and experimental design. Edward Arnold. London. Comstock, R.E. and Robinson, H. F. (1952). Genetic parameters their estimation and significance. Proc. of 6 th Int. Grassland Congr. 1: Das, K.P. and Gupta, D.T. (1984). Multivariate analysis in Blackgram. Indian J. Genet. 44(2): De Wilde, W. J. J. O. and Duyfjes, B. E. E. (2002). Synopsis of Momordica (Cucurbitaceae) in SE-Asia and Malaysia. Bot. Zhurn. 87: Decker-walters, D.S. (1999). Cucurbits, Sanskrit and the Indo-Aryas. Econ. Bot. 53: Devi, D. N., and Mariappan, S. (2013). Genetic variability, heritability and genetic advance for yield and its components Snake gourd. African J. Agric. Res. 8 (28): Dewey, D.K. and Lu, K.H. (1959). A correlation and path co-efficient analysis of components of crested wheat grass and production. Agron. J. 51: Dey, S.S., Singh, K.A., Chandel, D. and Behera, K.T. (2006).Genetic diversity of bitter gourd (Momordica charantia L.) genotypes reveled by RAPD markers and agronomic traits. Sci. Hort. 109: Digby, P., Galway, N. and Lane, P. (1989). GENSTAT 5: A Second Course. Oxford Science. Oxford Science Publications, Oxford. pp
99 Doijode, S.D. and Sulladmath, U.V. (1988). Genetic variability and correlation studies in pumpkin (Cucurbita moschata Poir). Mysore J. Agril. Sci. 20(1): Dora, D.K., Behera, T.K., Acharya, G.C., Das, S., Mahapatra, P. and Mishra, B. (2003). Genetic variability and character association in pointed gourd (Trichosanthes dioica Roxb.). Indian J. Hort. 60(2): Gaikwad, A.B., Behera, K.T., Singh, K.A., Chandel, D., Karihallo, L.J. and Staub, E.J. (2008). AFLP analysis provides strategies for improvement of bitter gourd. Hort. Sci. 43: Gaur, C.P., Gupta, K.P. and Kishore, H. (1978). Studies on genetic divergence in potato. Euphytica. 27: Ghosh, S., khan, H.M. Bhuyian, S.R, Akter, R. and Samsuzzaman, M. (2015). Genetic diversity in bitter gourd ( Momordica charantia L.). Eco-friendly Agril. J. 8(11): Ghosh, S., Khan, M.H., Bhuiyan, M.S.R., Akter, R. and Samsuzzamjan, M. (2015). Genetic diversity analysis in bitter gourd. Eco-friendly Agril. J. 8(11): Grubblen, H.J.G. (1977). Tropical vegetable and their genetic resources, IBPGR, Rome. pp Guffar, A. (2008). Characterization and genetic diversity of sponge gourd (Luffa cylindrica L.). MS Thesis, SAU, Dhaka, Bangladesh. Hanson, C.H., Robinson, H.F. and Comstock, R.E. (1956). Biometrical studies of yield in Segregation population of Korean Lespedza. Agron. J. 48: Haque, E.M. (1971). A comparative study on the external morphology and growth of cucurbitaceous vegetables. MS Thesis, BAU, Mymensingh, Bangladesh. p. 85. Harhsawardhan, C. and Ram, H.H. (2003). Genetic diversity studies in musk melon. Ann. Agril. Res. 24(2): Hazra, P., Ghosh, R. and Nath, S. (2003). Identification of important yield components in pointed gourd (T. anguina Roxb). Crop Res. Hisar. 25(2): Heiser, C.B. (1979). The gourd book. University of Oklahoma press, Norman, OK. 79
100 Hormuzdi, S.G. and More, T.A. (1989). Studies on combining ability in cucumber (Cucumis sativus L.). Indian J. Genet. 49(2): Hossain, M.S. (1996). Floral biology of ridge gourd. MS Thesis, IPSA, Salna, Gazipur, Bangladesh Ishida, K.B. and Chapman, H.M. (2009). Carotenoids extraction from plants using a novel, environmentally friendly solvent. J. Agric. Food Chem. 57: Islam, R.M., Hassain, M.S., Bhuiyan, M.S.R., Hasan, G.N., and syed, A. (2010). Multivariate analysis of bitter gourd. Middle-East J. Sci. Res. 5(2): Johnson, H.W., Robinson, H.F. and Comstock, R.E. (1955). Estimates of genetic and environmental variability in soybeans. Agron. J. 47: Joseph, S. (1978). Genetic variability and correlation studies in snake gourd (Trichosanthes anguina L.) MS Thesis, Kerala Agricultural University, Trissur, Kerala, India. p.120. Kabir, M.E. (2007). Genetic variability, correlation and path analysis of pointed gourd (Trichosanthes diolca Roxb.). MS Thesis, SAU, Dhaka, Bangladesh. Kadam, P.Y. and Kale, R.I. (1987). Genetic variability in ridge gourd. J. Maharashtra Agril. Univ. 12(2): Kajale, M.D. (1991). Current status of India palaeoethnobotany:introduced and indigenous food plants with a discussion of the historical and evolutionary development of India agriculture and agricultural systems in general. In: J.M. Renfew. (ed.). Edinburgh University press, Edinburgh, UK. Karuppaiah, P., Kavitha, R. and Senthilkumar, P. (2005). Divergent analysis in bitter gourd (Momordica charantia). Indian J. Hort. 46(2): Khan, A.S.M.R., Rabbani, M.G., Siddique, M.A. and Hossain, M.I. (2008). Study on genetic diversity of pointed gourd using morphological characters. Bangladesh J. Agril. Res. 33(3): Koppad, S.B., Chavan, M.L., Hallur, R.H., Rathod, V. and Shantappa, T. (2015). Variability and character association studies in ridge gourd with reference to yield attributes. J. Global Biosci. 4: Kumaran, S.S., Natarajan, S. and Thamburoj, S. (1998). Correlation and path analysis studies in pumpkin (Cucurbita moschata Poir.). South Indian Hort. 46(3-6):
101 Laxuman, Patil, S.A., Salimath P.M. and Dharmatti. (2012). Study on genetic diversity and its relation to heterosis in bitter gourd. Karnataka J. Agric. Sci. 25(1): Li, J.W., Sun, S.R. and Rer, Y.H. (1997). Study on genetic correlation and path analysis of the main agronomic characters of cucumber. Acta Agril. Univ. 31(3): Lim, K.T. (1998). Loofahs gourds, melons and snake beans. In: W.K. Hyde (ed.). The new Rural Industries, research and Development corporation, canberra, Australia. p Lush, J.L. (1943). Animal breeding plans. Iowa State Press, Ames, Iowa, p Mahalanobis, P.C. (1936). On the generalized distance in statistics. Proc. Natl. Inst. Sci., India. 2: Mangal, J.L., Dixit, J., Pandita, M.L. and Sidhu, A.S. (1981). Genetic variability and correlation studies in bitter gourd (Momordica charantia L.). Indian J. Hort. 38(2): Marani, A. and Avieli, E. (1973). Heterosis during the early phases of growth in intra-specific and inter-specific crosses of cotton. Crop Sci. 13: Marr, k.l., Xia, M.Y. and Bhattarai, K.N. (2004). Allozyme, morphological and nutritional analysis bearing on the domestion of Momordica charantia L. Econ. Bot. 85: Masud, M.A.T., Habib, A.K.M.A., Ahmed, S.U. and Hossain, S.M.M. (2001). Genetic diversity in sponge gourd (Luffa cylindrica). Bangladesh J. Plant Breed. Genet. 14(2): Masud, T.A.M., Chowdhury, Z.A.M., Hossain, M.A. and Hossain, S.M.M. (1995). Multivariate analysis in pumkin (Cucurbita moschata Duch ex Poir). Bangladesh J. Plant. Breed. Genet. 8(1-2): Mathew, S.M., Gopalkrishna, P.K. and Peter, K.V. (1986). Genetic distance among five botanical varieties of Cucumis melo. Agril. Res. J. 24(2): Mathew, S.S. and Khader, K.M.A. (1999). Genetic studies in snake gourd (Trichosanthes anguina L.). J. Tropical. Agril. 37(1-2): Miadenovic, E., ognjanov, V., Ljubojevic, Cukanovic, J, Berenji, J. (2012). Genetic variability of bottle gourd and its morphological characterization by multivariate analysis. Arch. Biol. Sci. 64(2):
102 Miah, M.A., Rahman, M.M., Uddin, M.S., Ralunan, A.K.M.M. and UIlah, M.H. (2000). Genetic association in bitter gourd. Bangladesh J. Sci. Technol. 2(1): Miller, P.J., Williams, J.C., Robinson, H.F. and Comstock, R.E. (1958). Estimation of genotypic and environmental variance and co-variance in upland cotton and their implications in selection. Agron. J. 50: Miniraj, N., Prasanna, P.K. and peter, V.K. (1993). Bitter gourd Momordica spp. In: Genetic improvement of vegetable plant. New light on early farming. Recent development in palaeoethnobotany. G. Kalloo and B.O. Bergh, (eds.). Pergamon press, Oxford, UK. pp Monthi, S.N., Rashid, A., Inouve, K., Hossain, A.K.M.A. and Hossain, M.A. (1989). Genetic variability, correlation and path co-efficient analysis in watermelon. Bangladesh J. Plant Breed. Genet. 2(1): Murthy and Quadri. (1966). Line x tester analysis of combining ability in bitter gourd (Momordica charantia L.). South Indian Hort. 31(2-3): Murty, R.B. and Arunachalam, V. (1966). The nature of genetic divergence in relation to breeding system in crop plants. Indian J. Genet. 26A: Pathak, Monpret, M. and Pahwa, K. (2014) Genetic variability, correlation and path co-efficient analysis in bitter gourd. Intl. J. Adv. Res. 2(8): Patil, P.R, Surve, V.H. and Mehta, H.D. (2012). Line x tester analysis in rice (Oryza sativa L.). Madras Agric. J. 99: Podder R., Rasul, G.M., Islam, A.M.K. A., Mian, KI.A.M., and Ahmed, U.J. (2010). Combining ability and heterosis in snake gourd. Bangladesh J. Plant. Breed. Genet. 23(2): Prasad, K.V.S.R. and Singh, D.P. (1994). Standardized potence and combining ability in slicing cucumber (Cucumis sativus L.). Indian. J. Hort. 51(1): Prasad, L., Gautam, N.C. and Singh, S.P. (1988). Studies on genetic variability and character association in watermelon (Citrullus lanatus). Veg. Sci. 15(1): Prasad, V.S.R.K and Singh, D.P. (1993). Biological divergence m the land races of cucumber (Cucumis sativus L.). Indian J. Hort. 50(1):
103 Prasad, V.S.R.K., Jam, B.P., Verma, S.P.P. and Ganguly, D.K. (2001). Diversity pattern and choice of parents for hybridization in slicing cucumber (Cucumis sativus L.). J. Res. Birsa. Agril. Univ. 13(1): Prasad. K.R.S.V., Singh, D.P. and Singh, R.P. (1993). Biological divergence in the land races of Indian cucumber (Cucumis sativus L.). Indian J. Hort. 50(1): Quamruzzaman, A.K.M., Rahman, M.H., Islam, M.N., Rahman, S.M.L. and Sarker, B.C. (2008). Genetic diversity in land races of ridge gourd. Bangladesh Res. Pub. J. 1(1): Rahman, A.K.M.M., Das, M.K. and Haque, M.M. (1986). Variability, correlation and path co-efficient analysis in bottle gourd (Lagenaria vulgaris L.). Bangladesh J. Agric. 11(3): Rahman, M. M., Dey, S.K. and Wazuddin, M. (1991). Study of yield, yield components and vine characters of some cucurbit genotypes. BAU Res. Prog. 5A: Rahman, M.M., Dey, S.K.and Wazuddin, M. (1990). Yield, yield components and plant characters of several bitter gourd, ribbed gourd, bottle gourd and sweet gourd genotypes. BAU Res. Prog. 4: Raja, Sekaran, L.R. and Shanmugavalu, K.G. (1984). MDU1 bitter gourd. South Indian Hort. 31(1): Rajput, J.C., Palve, S.B. and Jamadagni, B.M. (1991). Correlation and path analysis studies in cucumber (Cucumis sativus L.). Maharastra J. Hort. 5(2): Ram, D., Kallo, G. and Singh, M. (2001). Cluster analysis in pointed gourd (Trichosanthes dioica Roxb.). Veg. Sci. 28(1): Ram, J. and Panwan, S.V.D. (1970). Intra- specific divergence in rice. Indian J. Genet. 30: Ramachandran, C., Gopalkrishan, P.K. and Peter, K.V. (1981). Genetic divergence in bittergourd. Veg. Sci. 7: Ramos, S.S.R., Queiroz, M.A., Casali, V.W.D. and Cruz, C.D. (2000). Genetic diversity of squash germplasm from northeast of Brazil. Hort. Brasileira. 18(3): Rao, B.N., Rao, P.V. and Reddy, B.M.M. (2000). Correlation and path analysis in segregating population of ridge gourd. Crop Res. Hisar. 20(2):
104 Rao, C.R. (1952). Advanced statistical methods in biometrical research. Jhon Wiley and Sons. New York. pp Raseed, M.M., Nabi, S.A., Rasul, M.G. and Mian, M.A. (2002). Genetic divergence in pumpkin (Cucurbita moschata). Bangladesh J. Plant Breed. Genet. 15(1): Rashid, M. (2004). Sabji biggan. University press, Dhaka. pp. 99. Rashid, M.M. (1999). Sabgi Biggan. Rashid Publishing House, Dhaka. p Rashid, M.M. (2000). Genetic divergence in pumpkin. MS Thesis, Bangabandhu Sheikh Mujibur Rahman Agricultural University, Salna, Gazipur. p. 85. Rastogi, K.B., Arya, P. and Deep, A. (1990). A note on interrelationship between yield and important plant characters of cucumber (Cucumis sativus L.). Veg. Sci. 17(1): Reddy, K.S. and Rao, M.R. (1984). Studies on heritability, genetic advance and character association in ribbed gourd. South Indian Hort. 32(2): Robinson, R.W. and Decker-Walters, D.S. (1997). Cucurbits. University Press, Cambridge London, UK. pp Rumaran, S., Walterajan, S. and Suraj, S.T. (1997). Genetic variability in pumpkin. South Indian Hort. J. 45(1-2): Saha. R.R., Mitra, B.N., Hossain, A.E., Jamaluddin, M. and Mosiul Hoque, A.M.M. (1992). Genetic variability, character association and path coefficient analysis in pumpkin (Cucurbita moschata L). Bangladesh Hort. J. 20(1): Sanwal S.K., Yadav, R.K., Singh, P.K. and Rai, N. (2008). Variability and genetic diversity studies in indigenous chow-chow genotypes of northeast India. Indian J. Hort. 65(2): Sarkar, S.K., Marity, T.K. and Som, N.G. (1999). Correlation and path coefficient studies in pointed gourd (Trichosanthes dioica Roxb.). Indian J. Hort. 56(3): Shah, S.R. and Kale, P.N. (2002). Yield component association analysis in ridge gourd. J. Maharashtra Agril. Univ. 27(2): Shanmugam, A.S. and Rangsamy, S.R.S. (1982). Genetic diversity for quantitative characters in greengram ( Vigna radiata L. Wilczek.). Madras. Agric. J. 69(10):
105 Shanna, A., Vidyasagar, K. and Pathania, N.K. (2000). Studies on combining ability for earliness and marketable fruit yield in cucumber (Cucumis sativus L.). Himachal. J. Agril. Res. 26(1-2): Sharma, N.K.and Dhankhar, B.S. (1990). Variability studies in bottle gourd (Lagenania siceraria). Haiyana J. Hort. Sci. 19(3-4): Sidhu, A.S. and Gautam, N.C. (1985). Genetic divergence and hybrid performance in water melon. Indian J. Agril. Sci. 55: Singh, B., Singh. A.K. and Kumar, S. (2013) Genetic divergence studies in bitter gourd. Acad. J. Plant Sci. 6(2): Singh, D.K. and Ram, H.I. (2003). Correlation among fruit characters in the indigenous germplasm lines of musk melon. Prog. Hort. 35(1): Singh, R.K. and Chaudhury, B.D. (1985). Biometrical methods of quantitative genetic analysis. Haryana J. 12(2): Singh, R.V., Verman, T.S. and Thakur, P.C. (2002). Characters association in cucumber. Haryana J. Hort. Sci. 31 (l-2): Singh, S.K., Behera, K.T., Chandel, D., Sharma, P. and Singh, K.N. (2007). Assessing genetic relationship among bitter gourd (Momordica charantia L.) accession using inter simple sequence repeat (ISSR) markers. J. Hort. Sci. Biotechnol. 82: Singh, V.P., Singh, K. and Jaiswal, R.C. (1986). Genetic variability and correlation studies in pointed gourd (T. dioica Roxb.). Narendra Deva J. Agric. Res. 1(2): Sreelathakumary and Resmi, J. (2015). Genetic variability of bitter gourd genotypes in India. Acta Sci. Intl. Agric. 1(1): Sych, Z.D. (1990). Results of watermelon breeding material. Ovoshchevodstvo-i Bakhehevodstvo. 35: Tindall, H.D. ( 1968). Vegetables in the tropics. Macmillan Education Ltd. pp Turner, R.L. (1966). A comparative dictionary of the Indo-Aryan language. Oxford University press, London. Upadhya, M. R. and Murty, B. R. (1970). Genetic diversity in relation to geographical distribution in pear millet. J. Plant Breed. Genet. 75(3-4):
106 Varalaksmi, B., Reddy, Y.N. and Reddy, B.M. (1994). Genetic divergence in ridge gourd (Luffa acutangula Roxb.). J. Genet. Breed. 48(2): Varghese, P. (1991). Heterosis in snake gourd (Trichosanthes andguina L.). MS Thesis, Kerala Agricultural University. Kerala, India. Pp Vijay, O.P. (1987). Genetic variability, correlation and path analysis in muskmelon (Cucumis melon L.). Indian J.Hort. 44 (3-4): Vuong, T.L., Franke, A.A., Custer, J.L., Murphy, P.S. (2006). Momordica charantia cochinchinesis spreeng. (gac) fruit carotenoids reevaluated. J. Food comp. Anal. 19: Walkers, O.P. (1997). Genetic variability, correlation and path analysis in muskmelon (Cucumis melon L.). Indian J. Hort. 44 (3-4): Walters, T.W. and Decker Walters, S.D. (1988). Balsam pea (Momordica charantia). Econ. Bot. 42: Yang, S.L. and Walters, W.T. (1992). Ethnobotany and the economic role of cucurbitaceae of China. Econ. Bot. 46: Zaman, A.K.M. Masud, Q.M.A.T. and Rashid, M.A. (2004). Regional yield trial of sponge gourd. HRC Annual Report. Horticulture Research Centre, BARJ, Joydebpur, Gazipur. p
107

108 APPENDICES Appendix I. Map showing the experimental site under the study The experimental site under study 87
STUDY ON GENETIC DIVERSITY OF POINTED GOURD USING MORPHOLOGICAL CHARACTERS. Abstract
 ISSN 0258-7122 Bangladesh J. Agril. Res. 33(3) : 607-616, December 2008 STUDY ON GENETIC DIVERSITY OF POINTED GOURD USING MORPHOLOGICAL CHARACTERS A.S.M.R. KHAN 1, M.G. RABBANI 2, M.A. SIDDIQUE 3 AND M.I.
GENETIC DIVERGENCE OF A COLLECTION OF SPONGE GOURD (Luffa cylindrica L.)
") GENETIC DIVERGENCE OF A COLLECTION OF SPONGE GOURD (Luffa cylindrica L.) M. A. Gaffar 1, M. S. Hossain 2, Shamsunnaher 3 1 Agriculture Extension Officer, Department of Agricultural Extension, Narayanganj
GENETIC DIVERGENCE OF A COLLECTION OF SPONGE GOURD (Luffa cylindrica L.) M. A. Gaffar 1, M. S. Hossain 2, Shamsunnaher 3 1 Agriculture Extension Officer, Department of Agricultural Extension, Narayanganj
Genetic variability, Heritability and Morphological Characterization in. Bitter gourd (Momordica charantia L.)
") Available online at www.ijpab.com DOI: http://dx.doi.org/10.18782/2320-7051.5710 ISSN: 2320 7051 Int. J. Pure App. Biosci. 5 (4): 1322-1327 (2017) Research Article Genetic variability, Heritability and
Available online at www.ijpab.com DOI: http://dx.doi.org/10.18782/2320-7051.5710 ISSN: 2320 7051 Int. J. Pure App. Biosci. 5 (4): 1322-1327 (2017) Research Article Genetic variability, Heritability and
Genetic variability, Heritability and Genetic Advance for Yield, Yield Related Components of Brinjal [Solanum melongena (L.
 Available online at www.ijpab.com DOI: http://dx.doi.org/10.18782/2320-7051.5404 ISSN: 2320 7051 Int. J. Pure App. Biosci. 5 (5): 872-878 (2017) Research Article Genetic variability, Heritability and Genetic
MULTIVARIATE ANALYSIS IN ONION (Allium cepa L.)
") ISSN 0258-7122 Bangladesh J. Agril. Res. 37(4): 573-582, December 2012 MULTIVARIATE ANALYSIS IN ONION (Allium cepa L.) M. H. RASHID 1, A. K. M. A. ISLAM 2, M. A. K. MIAN 3 T. HOSSAIN 4 AND M. E. KABIR
ISSN 0258-7122 Bangladesh J. Agril. Res. 37(4): 573-582, December 2012 MULTIVARIATE ANALYSIS IN ONION (Allium cepa L.) M. H. RASHID 1, A. K. M. A. ISLAM 2, M. A. K. MIAN 3 T. HOSSAIN 4 AND M. E. KABIR
Genetic Variability Studies of Ridge Gourd Advanced Inbred Lines (Luffa acutangula (L.) Roxb.)
 Roxb.)") Available online at www.ijpab.com DOI: http://dx.doi.org/10.18782/2320-7051.6079 ISSN: 2320 7051 Int. J. Pure App. Biosci. 5 (6): 1223-1228 (2017) Research Article Genetic Variability Studies of Ridge
Available online at www.ijpab.com DOI: http://dx.doi.org/10.18782/2320-7051.6079 ISSN: 2320 7051 Int. J. Pure App. Biosci. 5 (6): 1223-1228 (2017) Research Article Genetic Variability Studies of Ridge
Genetic divergence studies for fibre yield traits in roselle (Hibiscus sabdariffa l.) In terai zone of West Bengal
 In terai zone of West Bengal") Journal Crop and Weed, 11(Special Issue):90-94(015) Genetic divergence studies for fibre yield traits in roselle (Hibiscus sabdariffa l.) In terai zone of West Bengal 1 N. HARI SATYANARAYANA, S. MUKHERJEE,
Journal Crop and Weed, 11(Special Issue):90-94(015) Genetic divergence studies for fibre yield traits in roselle (Hibiscus sabdariffa l.) In terai zone of West Bengal 1 N. HARI SATYANARAYANA, S. MUKHERJEE,
Studies on genetic divergence on cucumber (Cucumber sativum L.)
") RESEARCH PAPER Asian Journal of Bio Science, Volume 7 Issue 2 October, 2012 169-173 Received : 14.06.2012; Revised : 15.07.2012; Accepted : 20.07.2012 Studies on genetic divergence on cucumber (Cucumber
RESEARCH PAPER Asian Journal of Bio Science, Volume 7 Issue 2 October, 2012 169-173 Received : 14.06.2012; Revised : 15.07.2012; Accepted : 20.07.2012 Studies on genetic divergence on cucumber (Cucumber
Genetic Divergence Studies for the Quantitative Traits of Paddy under Coastal Saline Ecosystem
 J. Indian Soc. Coastal Agric. Res. 34(): 50-54 (016) Genetic Divergence Studies for the Quantitative Traits of Paddy under Coastal Saline Ecosystem T. ANURADHA* Agricultural Research Station, Machilipatnam
Genetic Variability and Heritability Estimation in Water Spinach (Ipomoea aquatica Forsk.) Genotypes
 Genotypes") International Journal of Current Microbiology and Applied Sciences ISSN: 2319-7706 Volume 6 Number 9 (2017) pp. 3018-3024 Journal homepage: http://www.ijcmas.com Original Research Article https://doi.org/10.20546/ijcmas.2017.609.370
International Journal of Current Microbiology and Applied Sciences ISSN: 2319-7706 Volume 6 Number 9 (2017) pp. 3018-3024 Journal homepage: http://www.ijcmas.com Original Research Article https://doi.org/10.20546/ijcmas.2017.609.370
American Journal of Plant Biology. Performance of Brinjal (Solanum melongena) Genotypes through Genetic Variability Analysis
 Genotypes through Genetic Variability Analysis") Nishi NSB et al. American Journal of Plant Biology 2017, 3:22-30 Page 1 of 9 Research Article American Journal of Plant Biology http://ivyunion.org/index.php/ajplantbio/ Performance of Brinjal (Solanum
Nishi NSB et al. American Journal of Plant Biology 2017, 3:22-30 Page 1 of 9 Research Article American Journal of Plant Biology http://ivyunion.org/index.php/ajplantbio/ Performance of Brinjal (Solanum
Study of Genetic Diversity in Some Newly Developed Rice Genotypes
 International Journal of Current Microbiology and Applied Sciences ISSN: 2319-7706 Volume 6 Number 10 (2017) pp. 2693-2698 Journal homepage: http://www.ijcmas.com Original Research Article https://doi.org/10.20546/ijcmas.2017.610.317
Correlation, path and cluster analysis in hyacinth bean (Lablab purpureus L. Sweet)
") Available online http://www.ijat-aatsea.com ISSN 1686-9141 Correlation, path and cluster analysis in hyacinth bean (Lablab purpureus L. Sweet) Singh, ramod K. 1*, Rai, N. 1, Lal, Hira 1, Bhardwaj, D.R.
Available online http://www.ijat-aatsea.com ISSN 1686-9141 Correlation, path and cluster analysis in hyacinth bean (Lablab purpureus L. Sweet) Singh, ramod K. 1*, Rai, N. 1, Lal, Hira 1, Bhardwaj, D.R.
Character Association and Path Coefficient Analysis in Tomato (Solanum lycopersicum L.)
") International Journal of Current Microbiology and Applied Sciences ISSN: 2319-7706 Volume 6 Number 8 (2017) pp. 1966-1972 Journal homepage: http://www.ijcmas.com Original Research Article https://doi.org/10.20546/ijcmas.2017.608.233
International Journal of Current Microbiology and Applied Sciences ISSN: 2319-7706 Volume 6 Number 8 (2017) pp. 1966-1972 Journal homepage: http://www.ijcmas.com Original Research Article https://doi.org/10.20546/ijcmas.2017.608.233
GENETIC DIVERGENCE IN PEA (PISUM SATIVUM L.)
") Plant Archives Vol. 14 No. 2, 2014 pp. 887-891 ISSN 0972-5210 GENETIC DIVERGENCE IN PEA (PISUM SATIVUM L.) B. Senthamizh Selvi*, J. Rajangam and R. Muthuselvi Horticultural Research Station, Tamil Nadu
Plant Archives Vol. 14 No. 2, 2014 pp. 887-891 ISSN 0972-5210 GENETIC DIVERGENCE IN PEA (PISUM SATIVUM L.) B. Senthamizh Selvi*, J. Rajangam and R. Muthuselvi Horticultural Research Station, Tamil Nadu
Study of Genetic Variability and Heritability in Sugarcane (Saccharum spp. Complex)
") International Journal of Current Microbiology and Applied Sciences ISSN: 2319-7706 Volume 6 Number 9 (2017) pp. 3112-3117 Journal homepage: http://www.ijcmas.com Original Research Article https://doi.org/10.20546/ijcmas.2017.609.384
International Journal of Current Microbiology and Applied Sciences ISSN: 2319-7706 Volume 6 Number 9 (2017) pp. 3112-3117 Journal homepage: http://www.ijcmas.com Original Research Article https://doi.org/10.20546/ijcmas.2017.609.384
ESTIMATION OF GENETIC DIVERSITY IN LENTIL GERMPLASM
 AGRIVITA VOLUME 33 No. 2 JUNE-2011 ISSN : 0126-0537 103 ESTIMATION OF GENETIC DIVERSITY IN LENTIL GERMPLASM A.K.M.M Alam 1*), R. Podder 1) and A. Sarker 2) 1) Pulses Research Centre, Bangladesh Agricultural
Variability and genetic divergence in paprika (Capsicum annuum L.) 1
 1") Journal of Spices and Aromatic Crops 71 Vol. 19 (1 & 2) : 71 75 (2010) Indian Society for Spices Variability and genetic divergence in paprika (Capsicum annuum L.) 1 S Surya Kumari, K Uma Jyothi, D Srihari,
Journal of Spices and Aromatic Crops 71 Vol. 19 (1 & 2) : 71 75 (2010) Indian Society for Spices Variability and genetic divergence in paprika (Capsicum annuum L.) 1 S Surya Kumari, K Uma Jyothi, D Srihari,
Genetic Parameters for Yield and Yield Components in F 1 Hybrids and Parents of Bell Pepper
 International Journal of Current Microbiology and Applied Sciences ISSN: 2319-7706 Volume 7 Number 03 (2018) Journal homepage: http://www.ijcmas.com Original Research Article https://doi.org/10.20546/ijcmas.2018.703.308
Evaluation and Variability of Some Genotypes of Tomato (Lycopersicon esculentum Mill) for Horticultural Traits
 for Horticultural Traits") Available online at www.ijpab.com Meena et al Int. J. Pure App. Biosci. 5 (4): 586-591 (2017) ISSN: 2320 7051 DOI: http://dx.doi.org/10.18782/2320-7051.5167 ISSN: 2320 7051 Int. J. Pure App. Biosci. 5
Available online at www.ijpab.com Meena et al Int. J. Pure App. Biosci. 5 (4): 586-591 (2017) ISSN: 2320 7051 DOI: http://dx.doi.org/10.18782/2320-7051.5167 ISSN: 2320 7051 Int. J. Pure App. Biosci. 5
Study of Genetic Divergence in Pea (Pisum sativum L.) based on Agro-Morphic Traits
 based on Agro-Morphic Traits") International Journal of Current Microbiology and Applied Sciences ISSN: 2319-7706 Volume 6 Number 11 (2017) pp. 3816-3821 Journal homepage: http://www.ijcmas.com Original Research Article https://doi.org/10.20546/ijcmas.2017.611.448
International Journal of Current Microbiology and Applied Sciences ISSN: 2319-7706 Volume 6 Number 11 (2017) pp. 3816-3821 Journal homepage: http://www.ijcmas.com Original Research Article https://doi.org/10.20546/ijcmas.2017.611.448
CHARACTER ASSOCIATION AND PATH ANALYSIS IN GARLIC (Allium sativum L) FOR YIELD AND ITS ATTRIBUTES
 FOR YIELD AND ITS ATTRIBUTES") SAARC J. Agri., 11(1): 45-52 (2013) CHARACTER ASSOCIATION AND PATH ANALYSIS IN GARLIC (Allium sativum L) FOR YIELD AND ITS ATTRIBUTES S. R. Singh, N. A. Ahmed, S. Lal, Asima Amin 1, Mudasir Amin 5 S. A.
SAARC J. Agri., 11(1): 45-52 (2013) CHARACTER ASSOCIATION AND PATH ANALYSIS IN GARLIC (Allium sativum L) FOR YIELD AND ITS ATTRIBUTES S. R. Singh, N. A. Ahmed, S. Lal, Asima Amin 1, Mudasir Amin 5 S. A.
DOCTOR Of PHILOSOPHY IN AGRICUL TI1.RE
 GENOTYPIC EVALUATION AND SCREENING FOR DROUGHT TOLERANCE IN WILD Hevea GERMPLASM '-- By M.A. MERCY THESIS Submitted in partial fulfilment of the requirement for the degree of DOCTOR Of PHILOSOPHY IN AGRICUL
Genetic divergence analysis of lime
 J. Bangladesh Agril. Univ. 7(1): 33 37, 2009 ISSN 1810-3030 Genetic divergence analysis of lime M. M. Rahman and M. A. Z. Al Munsur 1 Department of Horticulture, Bangladesh Agricultural University, -2202,
Assessment of Genetic Variation in Selected Germplasm of White Jute (Corchorus capsularis L.)
") Pertanika J. Trop. Agric. Sci. 39 (1): 41-53 (2016) TROPICAL AGRICULTURAL SCIENCE Journal homepage: http://www.pertanika.upm.edu.my/ Assessment of Genetic Variation in Selected Germplasm of White Jute
Pertanika J. Trop. Agric. Sci. 39 (1): 41-53 (2016) TROPICAL AGRICULTURAL SCIENCE Journal homepage: http://www.pertanika.upm.edu.my/ Assessment of Genetic Variation in Selected Germplasm of White Jute
ADIOLUS GLADIOL. Jitendra Kumar*, Rakesh Kumar and Krishan Pal
 Agric. Sci. Digest., 31 (4) : 280-284, 2011 AGRICULTURAL RESEARCH COMMUNICATION CENTRE www.ar.arccjour ccjournals.com / indianjournals.com nals.com VARIABILITY AND CHARACTER ASSOCIATION IN GLADIOL ADIOLUS
Breeding strategy for improvement of flower and seed yields in safflower
 Breeding strategy for improvement of flower and seed yields in safflower Vrijendra Singh, N. M. Kolekar and N. Nimbkar Nimbkar Agricultural Research Institute, Lonand Road, Phaltan 415523, Maharashtra,
Estimates of Variability for Growth and Yield Attributes in Taro (Colocasia esculenta var. Antiquorum (L.) Schott)
 Schott)") International Journal of Current Microbiology and Applied Sciences ISSN: 2319-7706 Volume 6 Number 8 (2017) pp. 1282-1286 Journal homepage: http://www.ijcmas.com Original Research Article https://doi.org/10.20546/ijcmas.2017.608.155
International Journal of Current Microbiology and Applied Sciences ISSN: 2319-7706 Volume 6 Number 8 (2017) pp. 1282-1286 Journal homepage: http://www.ijcmas.com Original Research Article https://doi.org/10.20546/ijcmas.2017.608.155
Heritability, Correlation and Path Coefficient Analysis in Twenty Ber Genotypes
 Academic Journal of Plant Sciences 3 (): 9-98, 010 ISSN 1995-8986 IDOSI Publications, 010 Heritability, Correlation and Path Coefficient Analysis in Twenty Ber Genotypes 1 3 3 M.N. Islam, M.M. Hossain,
Genetic Variability, Heritability and Genetic Advance in Garlic (Allium sativum L.)
") Available online at www.ijpab.com Kumar et al Int. J. Pure App. Biosci. 5 (3): 849-853 (2017) ISSN: 2320 7051 DOI: http://dx.doi.org/10.18782/2320-7051.2594 ISSN: 2320 7051 Int. J. Pure App. Biosci. 5
Available online at www.ijpab.com Kumar et al Int. J. Pure App. Biosci. 5 (3): 849-853 (2017) ISSN: 2320 7051 DOI: http://dx.doi.org/10.18782/2320-7051.2594 ISSN: 2320 7051 Int. J. Pure App. Biosci. 5
Studies on genetic diversity in Rice (Oryza sativa L.)
") Journal of Agricultural Technology 2012 Vol. 8(3): 1059-1065 Available online http://www.ijat-aatsea.com Journal of Agricultural Technology 2012, Vol. 8(3): 1059-1065 ISSN 1686-9141 Studies on genetic
Journal of Agricultural Technology 2012 Vol. 8(3): 1059-1065 Available online http://www.ijat-aatsea.com Journal of Agricultural Technology 2012, Vol. 8(3): 1059-1065 ISSN 1686-9141 Studies on genetic
Abstract. String bean, heritability, genetic advance, correlation, path analysis.
 Jahangirnagar University J. Biol. Sci. 1(1): 1-10, 2012 (June) Genetic variability, correlation and path analysis for yield and its component characters in string bean (Vigna unguiculata ssp. sesquipedalis
Genetic Divergence of Advanced Mutant Breeding Lines, In Sesame (Sesamum indicum L.) Assessed Through D 2 Statistics
 Assessed Through D 2 Statistics") International Journal of Current Microbiology and Applied Sciences ISSN: 2319-7706 Volume 6 Number 9 (2017) pp. 3133-3139 Journal homepage: http://www.ijcmas.com Original Research Article https://doi.org/10.20546/ijcmas.2017.609.387
International Journal of Current Microbiology and Applied Sciences ISSN: 2319-7706 Volume 6 Number 9 (2017) pp. 3133-3139 Journal homepage: http://www.ijcmas.com Original Research Article https://doi.org/10.20546/ijcmas.2017.609.387
Germplasm. Introduction to Plant Breeding. Germplasm 2/12/2013. Master Gardener Training. Start with a seed
 Introduction to Plant Breeding Master Gardener Training Start with a seed Germplasm Germplasm The greatest service which can be rendered to any country is to add a useful plant to its culture -Thomas Jefferson
Introduction to Plant Breeding. Master Gardener Training
 Introduction to Plant Breeding Master Gardener Training Start with a seed Germplasm Germplasm The greatest service which can be rendered to any country is to add a useful plant to its culture -Thomas Jefferson
Evaluation of Taro (Colocasia esculenta (L.) Schott.) Germplasm Using Multivariate Analysis
 Schott.) Germplasm Using Multivariate Analysis") 150 Journal of Root Crops, 2011, Vol. 37 No. 2, pp. 150-154 Indian Society for Root Crops ISSN 0378-2409 Evaluation of Taro (Colocasia esculenta (L.) Schott.) Germplasm Using Multivariate Analysis Central
150 Journal of Root Crops, 2011, Vol. 37 No. 2, pp. 150-154 Indian Society for Root Crops ISSN 0378-2409 Evaluation of Taro (Colocasia esculenta (L.) Schott.) Germplasm Using Multivariate Analysis Central
Chapter V SUMMARY AND CONCLUSION
 Chapter V SUMMARY AND CONCLUSION Zingiberaceae forms an important group of angiosperms with economic potential and many members of this family yield spices, dyes, perfumes and medicines and some are ornamental.
Correlation and path coefficient analysis in tuberose
 Journal of Crop and Weed, 9(2):44-49(2013) Correlation and path coefficient analysis in tuberose VANLALRUATI, T. MANDAL AND S. PRADHAN Department of Floriculture and Landscaping, Faculty of Horticulture
Hairy s Inheritance: Investigating Variation, Selection, and Evolution with Wisconsin Fast Plants
 Introduction Hairy s Inheritance: Investigating Variation, Selection, and Evolution with Wisconsin Fast Plants Daniel Lauffer Wisconsin Fast Plants Program University of Wisconsin - Madison Since the dawn
MULTIVARIATE ANALYSIS OF YOUNG AND MATURE :CLONES IN PARA RUBBER (Hevea brasiliensis Muell. Arg.)
") MULTIVARIATE ANALYSIS OF YOUNG AND MATURE :CLONES IN PARA RUBBER (Hevea brasiliensis Muell. Arg.) By. - JAY ASHREE MACHA VAN -. THESI~. SUBMITTED IN PARTIAL FULFILMENT OF THE REQUIREMENT FOR THE DEGREE
MULTIVARIATE ANALYSIS OF YOUNG AND MATURE :CLONES IN PARA RUBBER (Hevea brasiliensis Muell. Arg.) By. - JAY ASHREE MACHA VAN -. THESI~. SUBMITTED IN PARTIAL FULFILMENT OF THE REQUIREMENT FOR THE DEGREE
Estimates of Genetic variability, heritability and genetic advance of oat (Avena sativa L.) genotypes for grain and fodder yield
 genotypes for grain and fodder yield") Agricultural Science Research Journals Vol. 3(2), pp. 56-61, February 2013 Available online at http://www.resjournals.com/arj ISSN-L:2026-6073 2013 International Research Journals Full Length Research
Agricultural Science Research Journals Vol. 3(2), pp. 56-61, February 2013 Available online at http://www.resjournals.com/arj ISSN-L:2026-6073 2013 International Research Journals Full Length Research
ORIGINAL RESEARCH ARTICLE
 ORIGINAL RESEARCH ARTICLE OPEN ACCESS Studies on Genetic Divergence in High Yielding Rice (Oryza sativa L.) Genotypes G. Bharathi, B. Krishna Veni*, M. Lal Ahamed and K. Jaya Lalitha Department of Genetics
Genetic Diversity Studies in Desmodium gangeticum (L.) DC.
 DC.") International Journal of Current Microbiology and Applied Sciences ISSN: 2319-7706 Volume 6 Number 2 (2017) pp. 424-429 Journal homepage: http://www.ijcmas.com Original Research Article http://dx.doi.org/10.20546/ijcmas.2017.602.047
International Journal of Current Microbiology and Applied Sciences ISSN: 2319-7706 Volume 6 Number 2 (2017) pp. 424-429 Journal homepage: http://www.ijcmas.com Original Research Article http://dx.doi.org/10.20546/ijcmas.2017.602.047
Genetic Variability and Multivariate Analysis in Okra [Abelmoschus esculentus (L.) Moench]
![Genetic Variability and Multivariate Analysis in Okra [Abelmoschus esculentus (L.) Moench]](/thumbs/96/128444062.jpg "Genetic Variability and Multivariate Analysis in Okra [Abelmoschus esculentus (L.) Moench]") Tropical Agriculture Research Vol. 16: 99-113 (2004) Genetic Variability and Multivariate Analysis in Okra [Abelmoschus esculentus (L.) Moench] T.S.K.K. Kiran Patro and C. Ravisankar College of Agriculture,
Tropical Agriculture Research Vol. 16: 99-113 (2004) Genetic Variability and Multivariate Analysis in Okra [Abelmoschus esculentus (L.) Moench] T.S.K.K. Kiran Patro and C. Ravisankar College of Agriculture,
Combining Ability and Heterosis in Rice (Oryza sativa L.) Cultivars
 Cultivars") J. Agr. Sci. Tech. (2010) Vol. 12: 223-231 Combining Ability and Heterosis in Rice (Oryza sativa L.) Cultivars M. Rahimi 1, B. Rabiei 1*, H. Samizadeh 1, and A. Kafi Ghasemi 1 ABSTRACT Quantitative valuations
J. Agr. Sci. Tech. (2010) Vol. 12: 223-231 Combining Ability and Heterosis in Rice (Oryza sativa L.) Cultivars M. Rahimi 1, B. Rabiei 1*, H. Samizadeh 1, and A. Kafi Ghasemi 1 ABSTRACT Quantitative valuations
Evaluation of Physio-Agronomic and Chemical Traits in Relation to The Productivity of Eggplant (Solanum Melongena L.)
") Tropical Agricultural Research Vol. 16: 14-24 (2004) Evaluation of Physio-Agronomic and Chemical Traits in Relation to The Productivity of Eggplant (Solanum Melongena L.) T.K. Illangakoon, D.C Bandara
Tropical Agricultural Research Vol. 16: 14-24 (2004) Evaluation of Physio-Agronomic and Chemical Traits in Relation to The Productivity of Eggplant (Solanum Melongena L.) T.K. Illangakoon, D.C Bandara
2 Numbers in parentheses refer to literature cited.
 A Genetic Study of Monogerm and Multigerm Characters in Beets V. F. SAVITSKY 1 Introduction Monogerm beets were found in the variety Michigan Hybrid 18 in Oregon in 1948. Two of these monogerm plants,
Morphological Markers Related to Sex Expression in Papaya (Carica papaya L.)
") Available online at www.ijpab.com Soni et al Int. J. Pure App. Biosci. 5 (4): 526-531 (2017) ISSN: 2320 7051 DOI: http://dx.doi.org/10.18782/2320-7051.5132 ISSN: 2320 7051 Int. J. Pure App. Biosci. 5 (4):
Available online at www.ijpab.com Soni et al Int. J. Pure App. Biosci. 5 (4): 526-531 (2017) ISSN: 2320 7051 DOI: http://dx.doi.org/10.18782/2320-7051.5132 ISSN: 2320 7051 Int. J. Pure App. Biosci. 5 (4):
EXTENT OF HETEROTIC EFFECTS FOR SEED YIELD AND COMPONENT CHARACTERS IN CASTOR (RICINUS COMMUNIS L.) UNDER SEMI RABI CONDITION
 UNDER SEMI RABI CONDITION") Indian J. Agric. Res.., 47 (4) : 368-372, 2013 AGRICULTURAL RESEARCH COMMUNICATION CENTRE www.arccjournals.com / indianjournals.com EXTENT OF HETEROTIC EFFECTS FOR SEED YIELD AND COMPONENT CHARACTERS IN
Indian J. Agric. Res.., 47 (4) : 368-372, 2013 AGRICULTURAL RESEARCH COMMUNICATION CENTRE www.arccjournals.com / indianjournals.com EXTENT OF HETEROTIC EFFECTS FOR SEED YIELD AND COMPONENT CHARACTERS IN
COMBINING ABILITY ANALYSIS FOR CURED LEAF YIELD AND ITS COMPONENT TRAITS IN BIDI TOBACCO (NicotianatabacumL.)
") International Journal of Science, Environment and Technology, Vol. 5, No 3, 2016, 1373 1380 ISSN 2278-3687 (O) 2277-663X (P) COMBINING ABILITY ANALYSIS FOR CURED LEAF YIELD AND ITS COMPONENT TRAITS IN
International Journal of Science, Environment and Technology, Vol. 5, No 3, 2016, 1373 1380 ISSN 2278-3687 (O) 2277-663X (P) COMBINING ABILITY ANALYSIS FOR CURED LEAF YIELD AND ITS COMPONENT TRAITS IN
Development of regression models in ber genotypes under the agroclimatic conditions of south-western region of Punjab, India
 Indian J. Agric. Res., 49 (3) 2015: 260-264 Print ISSN:0367-8245 / Online ISSN:0976-058X AGRICULTURAL RESEARCH COMMUNICATION CENTRE www.arccjournals.com/www.ijarjournal.com Development of regression models
Genetic Variability, Coefficient of Variance, Heritability and Genetic Advance of Some Gossypium hirsutum L. Accessions
 Journal of Agricultural Science; Vol. 7, No. 2; 2015 ISSN 1916-9752 E-ISSN 1916-9760 Published by Canadian Center of Science and Education Genetic Variability, Coefficient of Variance, Heritability and
Research Notes: G. B. Pant University of Agriculture and Technology
 Volume 1 Article 6 4-1-1974 Research Notes: G. B. Pant University of Agriculture and Technology G. B. Pant University of Agriculture and Technology G. B. Pant University of Agriculture and Technology G.
Keywords: CGMS, combining ability, fertility restoration, heterosis, pigeonpea. Introduction
 Sri Lanka Journal of Food and Agriculture (2015) Byregowda et al. 1(2): 1-8 ISSN 2424-6913 Research Paper Identification of fertility restorers, stable combiners and heterotic combinations across environments
GENETIC VARIABILITY AND CHARACTER ASSOCIATION IN INDIAN MUSTARD [BRASSICA JUNCEA (L) CZERNS & COSS]
![GENETIC VARIABILITY AND CHARACTER ASSOCIATION IN INDIAN MUSTARD [BRASSICA JUNCEA (L) CZERNS & COSS]](/thumbs/82/86432454.jpg "GENETIC VARIABILITY AND CHARACTER ASSOCIATION IN INDIAN MUSTARD [BRASSICA JUNCEA (L) CZERNS & COSS]") Agric. Sci. Digest., 34 (3) : 183-188, 2014 doi:10.5958/0976-0547.2014.00998.7 AGRICULTURAL RESEARCH COMMUNICATION CENTRE www.arccjournals.com GENETIC VARIABILITY AND CHARACTER ASSOCIATION IN INDIAN MUSTARD
Agric. Sci. Digest., 34 (3) : 183-188, 2014 doi:10.5958/0976-0547.2014.00998.7 AGRICULTURAL RESEARCH COMMUNICATION CENTRE www.arccjournals.com GENETIC VARIABILITY AND CHARACTER ASSOCIATION IN INDIAN MUSTARD
Genetic study and selection in F4 generation of rice (Oryza sativa L.)
") Published with Open Access at Journal BiNET Vol. 09, Issue 01: 768-774 Journal of Bioscience and Agriculture Research Home page: www.journalbinet.com/jbar-journal.html Genetic study and selection in F4
Published with Open Access at Journal BiNET Vol. 09, Issue 01: 768-774 Journal of Bioscience and Agriculture Research Home page: www.journalbinet.com/jbar-journal.html Genetic study and selection in F4
GENETIC DIVERGENCE IN CONFECTIONARY TYPES OF GROUNDNUT (ARACHIS HYPOGAEA L.)
") Legume Res., 34 (1) : 1-7, 2011 AGRICULTURAL RESEARCH COMMUNICATION CENTRE www.ar.arccjour ccjournals.com / indianjournals.com nals.com GENETIC DIVERGENCE IN CONFECTIONARY TYPES OF GROUNDNUT (ARACHIS HYPOGAEA
Legume Res., 34 (1) : 1-7, 2011 AGRICULTURAL RESEARCH COMMUNICATION CENTRE www.ar.arccjour ccjournals.com / indianjournals.com nals.com GENETIC DIVERGENCE IN CONFECTIONARY TYPES OF GROUNDNUT (ARACHIS HYPOGAEA
9(4): , 2014 (Supplement on Genetics and Plant Breeding)
: , 2014 (Supplement on Genetics and Plant Breeding)") NSave Nature to Survive 9(4): 1711-1715, 2014 (Supplement on Genetics and Plant Breeding) www.thebioscan.in STUDIES ON GENETIC VARIABILITY PARAMETERS, CHARACTER ASSOCIATION AND PATH ANALYSIS AMONG YIELD
NSave Nature to Survive 9(4): 1711-1715, 2014 (Supplement on Genetics and Plant Breeding) www.thebioscan.in STUDIES ON GENETIC VARIABILITY PARAMETERS, CHARACTER ASSOCIATION AND PATH ANALYSIS AMONG YIELD
ASSOCIATION ANALYSIS OF YIELD AND YIELD PARAMETERS IN BRINJAL (SOLANUM MELONGENA L.)
") Plant Archives Vol. 16 No. 1, 2016 pp. 426-430 ISSN 0972-5210 ASSOCIATION ANALYSIS OF YIELD AND YIELD PARAMETERS IN BRINJAL (SOLANUM MELONGENA L.) N. Madhavi*, J. Om Prasad, P. Bijalwan and V. Sekhar Department
Plant Archives Vol. 16 No. 1, 2016 pp. 426-430 ISSN 0972-5210 ASSOCIATION ANALYSIS OF YIELD AND YIELD PARAMETERS IN BRINJAL (SOLANUM MELONGENA L.) N. Madhavi*, J. Om Prasad, P. Bijalwan and V. Sekhar Department
Deterioration of Crop Varieties Causes and Maintenance
 Deterioration of Crop Varieties Causes and Maintenance Deterioration of Genetic Purity The genetic purity of a variety or trueness to its type deteriorates due to several factors during the production
Phenotypic Stability Analysis, Heritability and Protein Patterns of snake Cucumber Genotypes. Section, Giza, Egypt. *
 Phenotypic Stability Analysis, Heritability and Protein Patterns of snake Cucumber Genotypes. AbdEl-Salam,M.M.M 1.; I.S. El-Demardash *2, and A.H.Hussein 1 1 Dep. of vegetable Hort. Res. Inst., Agric.Res.
Estimation of Genotypic and Phenotypic Coefficients Variation of Yield and its Contributing Characters of Brassica rapa L.
 American-Eurasian J. Agric. & Environ. Sci., 15 (10): 09-034, 015 ISSN 1818-6769 IDOSI Publications, 015 DOI: 10.589/idosi.aejaes.015.15.10.170 Estimation of Genotypic and Phenotypic Coefficients Variation
Genetic Variability and Character Association in Some Native Orchid Species (Dendrobium spp.)
") The Agriculturists 10 (1): 1-9 (01) A Scientific Journal of Krishi Foundation ISSN-179-511 Genetic Variability and Character Association in Some Native Orchid Species (Dendrobium spp.) M. Moniruzzaman
The Agriculturists 10 (1): 1-9 (01) A Scientific Journal of Krishi Foundation ISSN-179-511 Genetic Variability and Character Association in Some Native Orchid Species (Dendrobium spp.) M. Moniruzzaman
belonging to the Genus Pantoea
 Emerging diseases of maize and onion caused by bacteria belonging to the Genus Pantoea by Teresa Goszczynska Submitted in partial fulfilment of the requirements for the degree Philosophiae Doctoriae in
Variability, Heritability and Genetic Advance Analysis in Bread Wheat (Triticum aestivum L.) Genotypes
 Genotypes") International Journal of Current Microbiology and Applied Sciences ISSN: 2319-7706 Volume 6 Number 8 (2017) pp. 2687-2691 Journal homepage: http://www.ijcmas.com Original Research Article https://doi.org/10.20546/ijcmas.2017.608.321
International Journal of Current Microbiology and Applied Sciences ISSN: 2319-7706 Volume 6 Number 8 (2017) pp. 2687-2691 Journal homepage: http://www.ijcmas.com Original Research Article https://doi.org/10.20546/ijcmas.2017.608.321
Genetic Diversity by Multivariate Analysis Using R Software
 Available online at www.ijpab.com Shah et al Int. J. Pure App. Biosci. 6 (3): 181-190 (2018) ISSN: 2320 7051 DOI: http://dx.doi.org/10.18782/2320-7051.6596 ISSN: 2320 7051 Int. J. Pure App. Biosci. 6 (3):
Genetic studies on variability and genetic advance in garlic (Allium sativum L.)
") 2018; 7(6): 2272-2276 E-ISSN: 2278-4136 P-ISSN: 2349-8234 JPP 2018; 7(6): 2272-2276 Received: 22-09-2018 Accepted: 24-10-2018 Shubham Yadav NNPG, Department of Horticulture, Dr. RMLAU, VP Pandey Rohit
2018; 7(6): 2272-2276 E-ISSN: 2278-4136 P-ISSN: 2349-8234 JPP 2018; 7(6): 2272-2276 Received: 22-09-2018 Accepted: 24-10-2018 Shubham Yadav NNPG, Department of Horticulture, Dr. RMLAU, VP Pandey Rohit
TECHNICAL WORKING PARTY FOR AGRICULTURAL CROPS. Twenty-Ninth Session Uppsala, Sweden, June 27 to 30, 2000
 E TWA/29/17 ORIGINAL: English DATE: June 6, 2000 INTERNATIONAL UNION FOR THE PROTECTION OF NEW VARIETIES OF PLANTS GENEVA TECHNICAL WORKING PARTY FOR AGRICULTURAL CROPS Twenty-Ninth Session Uppsala, Sweden,
ASSESSMENT OF GENETIC DIVERSITY AMONG ORCHIDS
 Bangladesh J. Bot. 45(5): 987-993, 2016 (December) ASSESSMENT OF GENETIC DIVERSITY AMONG ORCHIDS TANVEER FATIMA MIANO* 1, MD GOLAM RABBANI AND NOOR-UN-NISA MEMON 1 Department of Horticulture, Bangladesh
EVALUATION OF SOME MANGO CULTIVARS UNDER NORTH INDIAN CONDITIONS
 Proceedings: International Conference on Mango and Date Palm: Culture and Export. 20 th to 23 rd June, 2005. Malik et al. (Eds), University of Agriculture, Faisalabad. EVALUATION OF SOME MANGO CULTIVARS
Assessments on growth and morphological attributes of bud wood nursery plants of rubber in different agro-climatic regions of Sri Lanka
 IOSR Journal of Agriculture and Veterinary Science (IOSR-JAVS) e-issn: 2319-2380, p-issn: 2319-2372. Volume 10, Issue 7 Ver. I (July 2017), PP 21-26 www.iosrjournals.org Assessments on growth and morphological
A Study on Genetic Variability, Character Association and Path Coefficient Analysis in Promising Indigenous Gentoypes of Garlic (Allium sativum L.
 Available online at www.ijpab.com Bhatt et al Int. J. Pure App. Biosci. 5 (1): 679-686 (2017) ISSN: 2320 7051 DOI: http://dx.doi.org/10.18782/2320-7051.2464 ISSN: 2320 7051 Int. J. Pure App. Biosci. 5
Variability Studies in Foxtail Millet [Setaria italica (L.) P. Beauv]
![Variability Studies in Foxtail Millet [Setaria italica (L.) P. Beauv]](/thumbs/94/119241936.jpg "Variability Studies in Foxtail Millet [Setaria italica (L.) P. Beauv]") International Journal of Current Microbiology and Applied Sciences ISSN: 2319-7706 Volume 6 Number 9 (2017) pp. 955-960 Journal homepage: http://www.ijcmas.com Original Research Article https://doi.org/10.20546/ijcmas.2017.609.115
International Journal of Current Microbiology and Applied Sciences ISSN: 2319-7706 Volume 6 Number 9 (2017) pp. 955-960 Journal homepage: http://www.ijcmas.com Original Research Article https://doi.org/10.20546/ijcmas.2017.609.115
Effect of rainfall and temperature on rice yield in Puri district of Odisha in India
 2018; 7(4): 899-903 ISSN (E): 2277-7695 ISSN (P): 2349-8242 NAAS Rating: 5.03 TPI 2018; 7(4): 899-903 2018 TPI www.thepharmajournal.com Received: 05-02-2018 Accepted: 08-03-2018 A Baliarsingh A Nanda AKB
The study of the impact of climate variability on Aman rice yield of Bangladesh
 The study of the impact of climate variability on Aman rice yield of Bangladesh Toma Rani Saha 1 and Dewan Abdul Quadir 2 Abstract An attempt has been made to investigate the relationship of climate variability
MAGNITUDE OF HETEROSIS AND HERITABILITY IN SUNFLOWER OVER ENVIRONMENTS
 Pak. J. Bot., 40(1): 301-308, 2008. MAGNITUDE OF HETEROSIS AND HERITABILITY IN SUNFLOWER OVER ENVIRONMENTS HAKIM KHAN 1, HIDAYAT-UR-RAHMAN 2, * HABIB AHMAD 3, HAIDAR ALI 4, INAMULLAH 3 AND MUKHTAR ALAM
HETEROSIS AND HERITABILITY STUDIES FOR SUPERIOR SEGREGANTS SELECTION IN CHICKPEA
 Pak. J. Bot., 39(7): 2443-2449, 2007. HETEROSIS AND HERITABILITY STUDIES FOR SUPERIOR SEGREGANTS SELECTION IN CHICKPEA AHMED BAKHSH *, SHAHID RIAZ MALIK **, UMER IQBAL ** AND WAHEED ARSHAD * * PMAS Arid
Study on Genetic Variability, Heritability and Genetic Advance in Rice (Oryza sativa L.) Genotypes
 Genotypes") Available online at www.ijpab.com DOI: http://dx.doi.org/10.18782/2320-7051.3047 ISSN: 2320 7051 Int. J. Pure App. Biosci. 5 (4): 511-515 (2017) Research Article Study on Genetic Variability, Heritability
Available online at www.ijpab.com DOI: http://dx.doi.org/10.18782/2320-7051.3047 ISSN: 2320 7051 Int. J. Pure App. Biosci. 5 (4): 511-515 (2017) Research Article Study on Genetic Variability, Heritability
Evaluation of Tomato (Solanum lycopersicum L.) Genotypes under Water Stress Based on Yield and Physiological Parameters
 Genotypes under Water Stress Based on Yield and Physiological Parameters") International Journal of Current Microbiology and Applied Sciences ISSN: 2319-7706 Volume 7 Number 01 (2018) Journal homepage: http://www.ijcmas.com Original Research Article https://doi.org/10.20546/ijcmas.2018.701.024
International Journal of Current Microbiology and Applied Sciences ISSN: 2319-7706 Volume 7 Number 01 (2018) Journal homepage: http://www.ijcmas.com Original Research Article https://doi.org/10.20546/ijcmas.2018.701.024
ABSTRACT: 54 BREEDING OF HYBRID SOYBEAN ZAYOUDOU NO.1
 ABSTRACT: 54 BREEDING OF HYBRID SOYBEAN ZAYOUDOU NO.1 ZHANG L, DAI O, HUANG Z, LI J, ZHANG L, HU C, YANG J 1.Crop Research Institute of Anhui Academy of Agricultural Sciences, 2.Key Laboratory of Crop
SABESAN Thayumanavan*, SARAVANAN Kannapiran and ANANDAN Annamalai
 ORIGINAL PAPER GENETIC DIVERGENCE ANALYSIS FOR CERTAIN YIELD AND QUALITY TRAITS IN RICE (ORYZA SATIVA L.) GROWN IN IRRIGATED SALINE LOW LAND OF ANNAMALAINAGAR, SOUTH INDIA SABESAN Thayumanavan*, SARAVANAN
CERTAIN ASPECTS OF THE NUMERICAL SIMULATION OF CIRCULATION IN THE BAY OF BENGAL AND THE ARABIAN SEA
 CERTAIN ASPECTS OF THE NUMERICAL SIMULATION OF CIRCULATION IN THE BAY OF BENGAL AND THE ARABIAN SEA by INDU JAIN A THESIS SUBMITTED IN FULFILMENT OF THE REQUIREMENTS FOR THE DEGREE OF DOCTOR OF PHILOSOPHY
Studies on Variability, Heritability and Genetic Advance Analysis for Yield and Yield Attributes of Garlic (Allium sativum L.)
") International Journal of Current Research in Biosciences and Biology Volume 4 Number 4 (April-2017) ISSN: 2349-8080 (Online) Journal homepage: www.ijcrbp.com Original Research Article doi: https://doi.org/10.20546/ijcrbp.2017.404.019
International Journal of Current Research in Biosciences and Biology Volume 4 Number 4 (April-2017) ISSN: 2349-8080 (Online) Journal homepage: www.ijcrbp.com Original Research Article doi: https://doi.org/10.20546/ijcrbp.2017.404.019
EFFECT OF PLANT GROWTH REGULATORS ON GROWTH AND YIELD PARAMETERS OF PAPRIKA cv.ktpl-19
 Agric. Sci. Digest, 29 (3) : 157-162, 2009 AGRICULTURAL RESEARCH COMMUNICATION CENTRE www.arccjournals.com / indianjournals.com EFFECT OF PLANT GROWTH REGULATORS ON GROWTH AND YIELD PARAMETERS OF PAPRIKA
C.v. Dr. Mohammed Ali Hussein
 C.v. Dr. Mohammed Ali Hussein - Dr Mohammed Ali Hussien Al- Falahe Email: dr.mohammed1953@yahoo.com Tele : 07507718671. - Was born in Baghdad Iraq 1953. - Graduated from Al-Nasar primary school in 1966.
IN SUNFLOWER (HELIANTHUS ANNUUS L.)
") Recent Research in Science and Technology 2009, 1(5): 202 206 ISSN: 2076-5061 www.recent-science.com GENETICS & GENOMICS USING LINE X TESTER ANALYSIS FOR EARLINESS AND PLANT HEIGHT TRAITS IN SUNFLOWER
Recent Research in Science and Technology 2009, 1(5): 202 206 ISSN: 2076-5061 www.recent-science.com GENETICS & GENOMICS USING LINE X TESTER ANALYSIS FOR EARLINESS AND PLANT HEIGHT TRAITS IN SUNFLOWER
Development of High Yielding Saffron Mutant
 Development of High Yielding Saffron Mutant I.A. Khan G.B. Pant University of Agriculture & Technology Saffron Cultivation and Marketing Project Chaubatia-263651 Almora India Keywords: 5-Branched stigma,
Genetic variability, Heritability, Genetic Advance and Correlation Coefficient for Vegetative and Floral Characters of Gerbera (Gerbera jamesonii)
") International Journal of Agriculture, Environment & Biotechnology Citation: IJAEB: 7(3): 527-533 September 2014 DOI Number: 10.5958/2230-732X.2014.01357.6 15 2014 New Delhi Publishers. All rights reserved
International Journal of Agriculture, Environment & Biotechnology Citation: IJAEB: 7(3): 527-533 September 2014 DOI Number: 10.5958/2230-732X.2014.01357.6 15 2014 New Delhi Publishers. All rights reserved
Probability models for weekly rainfall at Thrissur
 Journal of Tropical Agriculture 53 (1) : 56-6, 015 56 Probability models for weekly rainfall at Thrissur C. Laly John * and B. Ajithkumar *Department of Agricultural Statistics, College of Horticulture,
GENETIC VARIABILITY OF TRAITS FOR SUGARCANE (SACCHARUM SPP) GENOTYPES AT METAHARA SUGAR ESTATE
 GENOTYPES AT METAHARA SUGAR ESTATE") Available online at www.darshanpublishers.com Volume -5; Issue - 3; Year -2018; Pages: 16-22 ISSN: 2393-8560 DOI: http://dx.doi.org/10.22192/ijcrbs.2018.05.03.003 Abbr: Int. J. Compr. Res. Biol. Sci. International
Available online at www.darshanpublishers.com Volume -5; Issue - 3; Year -2018; Pages: 16-22 ISSN: 2393-8560 DOI: http://dx.doi.org/10.22192/ijcrbs.2018.05.03.003 Abbr: Int. J. Compr. Res. Biol. Sci. International
7.2: Natural Selection and Artificial Selection pg
 7.2: Natural Selection and Artificial Selection pg. 305-311 Key Terms: natural selection, selective pressure, fitness, artificial selection, biotechnology, and monoculture. Natural Selection is the process
SELECTING NEW Brachiaria FOR BRAZILIAN PASTURES. 2 CNPq fellow. Abstract
 ID # 13 14 SELECTING NEW Brachiaria FOR BRAZILIAN PASTURES C.B. do Valle 1,2, V.P.B. Euclides 1,2, M.C.M. Macedo 1,2, J R. Valério 1,2 and S. Calixto 1 1 Embrapa Gado de Corte, Caixa Postal 154, 79002-970
Correlation and Path Analysis Study in Dolichos Bean (Lablab purpureus L.)
") Int.J.Curr.Microbiol.App.Sci (2017) 6(9): 22282235 International Journal of Current Microbiology and Applied Sciences ISSN: 23197706 Volume 6 Number 9 (2017) pp. 22282235 Journal homepage: http://www.ijcmas.com
Int.J.Curr.Microbiol.App.Sci (2017) 6(9): 22282235 International Journal of Current Microbiology and Applied Sciences ISSN: 23197706 Volume 6 Number 9 (2017) pp. 22282235 Journal homepage: http://www.ijcmas.com
Gene Action and Combining Ability in Rice (Oryza sativa L.) Involving Indica and Tropical Japonica Genotypes
 Involving Indica and Tropical Japonica Genotypes") International Journal of Current Microbiology and Applied Sciences ISSN: 2319-7706 Volume 6 Number 7 (2017) pp. 8-16 Journal homepage: http://www.ijcmas.com Original Research Article https://doi.org/10.20546/ijcmas.2017.607.002
International Journal of Current Microbiology and Applied Sciences ISSN: 2319-7706 Volume 6 Number 7 (2017) pp. 8-16 Journal homepage: http://www.ijcmas.com Original Research Article https://doi.org/10.20546/ijcmas.2017.607.002
Lassen Community College Course Outline
 Lassen Community College Course Outline AGR 20 Introduction to Plant Science 4.0 Units I. Catalog Description This course is an introduction to plant science including structure, growth processes, propagation,
GENETIC VARIABILITY AND CHARACTER ASSOCIATION FOR YIELD AND QUALITY TRAITS IN TOMATO (Lycopersicon esculentum Mill)
") GENETIC VARIABILITY AND CHARACTER ASSOCIATION FOR YIELD AND QUALITY TRAITS IN TOMATO (Lycopersicon esculentum Mill) Ravindra Kumar* 1, S. K. Singh 2, K. Srivastava 1 and R.K. Singh 1 1 Deptt. of Genetics
GENETIC VARIABILITY AND CHARACTER ASSOCIATION FOR YIELD AND QUALITY TRAITS IN TOMATO (Lycopersicon esculentum Mill) Ravindra Kumar* 1, S. K. Singh 2, K. Srivastava 1 and R.K. Singh 1 1 Deptt. of Genetics
Genetic Divergence for Yield and other Quantitative Traits in Rice (Oryza sativa L.)
") International Journal of Current Microbiology and Applied Sciences ISSN: 2319-7706 Volume 7 Number 01 (2018) Journal homepage: http://www.ijcmas.com Original Research Article https://doi.org/10.20546/ijcmas.2018.701.146
International Journal of Current Microbiology and Applied Sciences ISSN: 2319-7706 Volume 7 Number 01 (2018) Journal homepage: http://www.ijcmas.com Original Research Article https://doi.org/10.20546/ijcmas.2018.701.146
Assessment of Genetic Diversity of Pawpaw Cultivars with Inter-Simple Sequence Repeat Markers
 Assessment of Genetic Diversity of Pawpaw Cultivars with Inter-Simple Sequence Repeat Markers Kirk W. Pomper*, Sheri B. Crabtree, and Snake C. Jones Kentucky State University What is Pawpaw? Asimina triloba
ASSESSING THE POTENTIAL IMPACT OF RAINFALL CHANGE ON SOUTHERN AFRICAN RIVER FLOWS RAKHEE LAKHRAJ-GOVENDER SUPERVISOR: PROF STEFAN GRAB
 ASSESSING THE POTENTIAL IMPACT OF RAINFALL CHANGE ON SOUTHERN AFRICAN RIVER FLOWS RAKHEE LAKHRAJ-GOVENDER 11598 SUPERVISOR: PROF STEFAN GRAB A research report submitted to the Faculty of Science, University
Genetic divergence in landraces of rice (O. sativa L.) of West Bengal, India
 of West Bengal, India") Journal of Crop and Weed,8(2):23-28(2012) Genetic divergence in landraces of rice (O. sativa L.) of West Bengal, India A. CHAKRAVORTY AND P. D. GHOSH Cytogenetics and Plant Breeding Section, Biotechnology
Journal of Crop and Weed,8(2):23-28(2012) Genetic divergence in landraces of rice (O. sativa L.) of West Bengal, India A. CHAKRAVORTY AND P. D. GHOSH Cytogenetics and Plant Breeding Section, Biotechnology