X chromosome evolution in Drosophila. Beatriz Vicoso
|
|
|
- Rosalind Knight
- 5 years ago
- Views:
Transcription
1 X chromosome evolution in Drosophila Beatriz Vicoso University of Edinburgh, 2008
2 Abstract Although the X chromosome is usually similar to the autosomes in size, gene density and cytogenetic appearance, theoretical models predict that its hemizygosity in males may cause unusual patterns of evolution. The sequencing of several genomes has indeed revealed differences between the X chromosome and the autosomes in the rates of gene divergence, patterns of gene expression and rates of gene movement between chromosomes. In this thesis, I have attempted to investigate some of these patterns and their possible causes. The first two chapters consist of theoretical and empirical work intended to analyse the rates of evolution of coding sequences of X-linked and autosomal loci, with particular emphasis on faster-x evolution, the theory that more effective selection on the X can lead to higher rates of adaptive evolution on this chromosome. By analyzing X-linked and autosomal coding sequence in several species of Drosophila, we found some evidence for more effective selection on the X, particularly evident in the higher levels of codon usage bias detected at X-linked loci. We argue that this could be due to higher levels of recombination on the X chromosome increasing its effective population size (N ex ) relative to the autosomal effective population size (N ea ). To further investigate this hypothesis, we have modeled the effect of increased N ex /N ea on rates of evolution and confirmed that this can contribute to faster-x evolution. The last two chapters deal with the evolution of sex-biased genes and the possible causes for their differential accumulation on the X. We used EST data to create expression profiles for D. melanogaster male-, female- and unbiased genes. Our results suggest that the expression levels of sex-biased genes are incompatible with the accepted
3 model of sex-biased gene evolution. We also show that the deficit of testis-expressed genes that is observed in Drosophila seems to be stronger for highly expressed genes. In fact, for very lowly expressed genes, we observe a small excess of testis-expressed genes on the X. We attempt to discuss this pattern in view of what is currently known about the evolution of sex-biased gene expression. iii
4 Contents Declaration ix Acknowledgements x Chapter 1: General Introduction Introduction A different mutation rate on the X? Male-driven evolution and the X chromosome Use of data on DNA sequence evolution to estimate α Assessing male driven evolution in flies Assessing male driven evolution in mammals Is selection more efficient for genes on the X? The fixation of beneficial and deleterious mutations Testing the faster-x hypothesis in Drosophila species Testing the faster-x hypothesis in mammals Excess of codon bias on the X X chromosomal divergence within species Summary: is there really a faster-x effect? Accumulation of sex-biased genes on the X chromosome versus autosomes The accumulation of antagonistic mutations The accumulation of sex-biased genes Results for Drosophila and C. elegans Different results for mammals Why the difference? What have we learnt from these patterns? Aims of this thesis References Chapter 2: Faster-X evolution in Drosophila Introduction Faster-X evolution Evidence for faster-x evolution Average rates of evolution at X-linked and autosomal sites Estimates of positive selection on the X chromosome and the autosomes Paired comparisons iv
5 2.1.3 Our project Materials and methods Selection of the genes D. affinis DNA extraction Sequencing of the genes Evaluation of K a and K s Codon usage Statistical analysis Polymorphism Datasets Aligning the coding sequence Analysis Results Within-clade comparisons Lower K s for X-linked genes Higher K a /K s for 3L-XR genes in D. pseudoobscura/d. affinis Pairwise comparisons Is there any evidence for faster-x effect in fast evolving genes? Discussion Is selection more efficient on the X chromosome? The effective population size of the X chromosome and the autosomes Is there a higher recombination rate on the Drosophila X? The dominance coefficient of new mutations Conclusions References Chapter 3: Effective population sizes and substitution rates of the X chromosome and the autosomes Introduction Methods The diffusion approximation Determining M δx Accounting for the time spent by autosomes and the X chromosome in males and females Calculating the substitution rate v
6 3.2.5 Modifying the effective population size Results The rate of fixation of beneficial mutations The rate of fixation of deleterious mutations Different mutation rates in males and females The rate of fixation of sexually antagonistic mutations Discussion The importance of estimating NeX/NeA Different mutation rates in males and females Sex-biased genes and faster-x evolution Conclusions References Chapter 4: Sex-biased gene expression in Drosophila Introduction Sex-Biased genes Predictions of Rice s model The rates of evolution of male- and female-biased genes Goals of this study Materials and methods Datasets used Microarray data EST data Analysis Cleaning the EST database Matching the sex-biased genes and their expression profile Two-species analysis Statistical analysis Results The importance of the germline Expression profiles of sex-biased genes Conserved versus non-conserved sex-biased genes Discussion The expression of sex-biased genes vi
7 4.4.2 The evolution of sex-biased genes An association between female- and embryo-expressed genes Conclusions References Chapter 5: Male-biased genes and the hyperactivated X Introduction The evolution of dosage compensation The evolution of sex chromosomes Dosage compensation The distribution of sex-biased genes: theory and practice New insights into the evolution of sex-biased genes Can dosage compensation affect the distribution of sex-biased genes? Aims of this chapter Materials and methods EST analysis Microarray Results Microarray data EST data Discussion References Chapter 6: Discussion Faster-X evolution: is selection more efficient on the X? How is this expected to affect the results for the different organisms studied? The dominance of new mutations The proportion of sites fixed by positive selection The accumulation of sex-biased genes Why the differences between D. melanogaster and C. elegans, and mammals? References Appendix A Appendix A AppendixA Appendix A vii
8 Appendix A Appendix A Appendix A viii
9 Declaration I declare that this thesis has been composed by myself and is entirely my own work. ix
10 Acknowledgements First, I would like to thank my supervisors Brian Charlesworth and Penelope Haddrill for being so helpful and supportive over the past three years. Many thanks to all my family and friends for their support. My mother in particular deserves an award for having spent most of her holidays in Rio on very hot 485 bus trips, and on the even hotter Fundão campus, sorting paperwork in time for me to start my PhD. Finally, I am extremely grateful to the Gabba PhD program for the opportunity they have given me, and to the Portuguese Foundation for Science and Technology (FCT) for funding. x
11 Chapter 1: General Introduction Abstract Although the X chromosome is usually similar to the autosomes in size and cytogenetic appearance, theoretical models predict that its hemizygosity in males may cause unusual patterns of evolution. The sequencing of several genomes has indeed revealed differences between the X chromosome and the autosomes in the rates of divergence, patterns of gene expression and rates of gene movement. A better understanding of these patterns should provide valuable information on the evolution of genes located on the X chromosome. It may also suggest solutions to more general problems in molecular evolution, such as detecting selection and estimating mutational effects on fitness. Vicoso, B. and Charlesworth, B. Evolution on the X chromosome: unusual patterns and processes. Nat. Rev. Genet. 7(8): ,
12 1.1 Introduction Sex chromosome systems have evolved independently numerous times, and have attracted much attention from evolutionary geneticists. This work has been mainly focused on the steps leading to the initial evolution of sex chromosomes, and the genetic degeneration of Y and W chromosomes (e.g. Charlesworth et al., 2005). Here we will discuss the evolution of the X chromosome in long-established sex chromosome systems, such those of mammals and Drosophila species. The emphasis is on recent molecular evolutionary, genomic and gene expression studies, especially as the whole genome analysis of several Drosophila (Richards et al., 2005) and mammalian (The Chimpanzee Sequencing and Analysis Consortium, 2005) species has provided estimates of divergence rates for both coding and non-coding regions of the sex chromosomes and the autosomes. In addition, several studies using microarray technology have revealed that many genes that are expressed exclusively or preferentially in one sex in Drosophila melanogaster (Parisi et al., 2003; Ranz et al., 2003), mammals (Lercher et al., 2003; Khil et al., 2004) and Caenorhabditis elegans (Reinke et al., 2004). The evolutionary properties of the X chromosome are also relevant to several interesting biological phenomena that occur above the molecular level. In the genus Drosophila, the X chromosome appears to be enriched in genes that cause reproductive isolation between species (Tao et al., 2003), helping to explain classic observations such as Haldane s Rule (Coyne and Orr, 2004). Similarly, genes expressed in the brain (Skuse, 2005) and genes controlling fertility (Saifi and Chandra, 1999) appear to be preferentially located on the human X chromosome. A better understanding of the 2
13 general evolutionary properties of genes located on the X chromosome will help to determine the causes of these peculiarities. Furthermore, tests of the predictions of theoretical models of X evolution will shed light on the assumptions on which they are based, such as the degree of dominance of mutations or the existence of opposing forces of selection on males and females, leading to better understanding of the forces that shape the evolution of eukaryotic genomes. We first examine DNA sequence divergence to ask: is the X chromosome evolving at a different rate from the autosomes or Y chromosome, and what might cause such a difference? Second, we review evidence on the evolution of the expression patterns of X-linked genes, in particular discussing why so many of them exhibit sexbiased expression. In all the clades analysed, the X chromosome appears to be under more efficient selection and to accumulate new genes, or genes with new, sex-biased expression patterns, differently from the autosomes. However, differences between the more extensively studied Drosophila melanogaster and mammalian X chromosomes make it hard to explain all the current data, suggesting that more work is necessary to clarify the processes involved. 1.2 A different mutation rate on the X? Male-driven evolution and the X chromosome Most mutational changes in DNA are thought to occur through replication errors during cell division (Drake et al., 1998). Consequently, the mutation rate per generation is expected to increase with the number of divisions in the germline (only mutations in 3
14 the germline are transmitted to the next generation) (Keightley and Eyre-Walker, 2000). In species with separate sexes, males and females have different ways of making gametes, which may cause a difference in the number of cell divisions. In mammals, for instance, spermatogenesis requires more cell divisions than oogenesis, so that the mutation rate in the male germline is likely to be higher than that in the female germline (Haldane, 1947; Miyata et al., 1987). This effect is very sensitive to the average ages at reproduction of males and females, since the overall mutation rate for a given sex is the sum over mutations contributed by individuals from all reproductively active ages (Charlesworth, 1994). Genes on autosomes spend an equal amount of their time in males and females, so that their net mutation rate is the average of the male and female mutation rates. With male heterogamety, X-linked genes spend only 1 / 3 of their time in males and 2 / 3 of their time in females. If spermatogenesis is more mutagenic than oogenesis, the X chromosome is subjected to a lower mutation rate than the autosomes (or the Y chromosome) (Haldane, 1947; Miyata et al., 1987). The reverse is true for Z-linked genes in taxa with female heterogamety. This results in corresponding differences in the rate of molecular sequence evolution, since the rate of neutral DNA sequence divergence between species is equal to the mutation rate (Kimura, 1968; Li, 1997). 4
15 1.2.2 Use of data on DNA sequence evolution to estimate α The rate of substitution, K, is defined as the number of mutations that become fixed in a population per unit of evolutionary time (Kimura, 1968). This value can be estimated from the degree of DNA sequence divergence between two taxa with a known date of divergence, by dividing the estimated proportion of nucleotide sites for which they differ by the time that separates them (Kimura, 1968). For neutral mutations (i.e. mutations with no effect on fitness), K is equal to the mutation rate per site (Kimura, 1968). Assume that the only factor controlling the relative mutation rates of genes on the X, Y and autosomes is the time that they spend in females and males (male heterogamety is assumed). Let the ratio of male mutation rate u m to female mutation rate u f be α. Let the substitution rates for autosomal, X- chromosome linked and Y- chromosome-linked mutations be K A, K X and K Y, respectively. It is easily shown (Miyata et al., 1987) that: K A = (u f + u m ) (! + 1) u = f 2 2 (1.1) K X = (2u f + u m ) (! + 2) u = f 3 3 (1.2) K Y = u m =! u f (1.3) 5
16 Since u f is common to all these expressions, it is simple to get two different estimates of α from ratios such as K A /K X and K Y /K X. Similar expressions can be derived for female heterogamety (Axelsson et al., 2004) Assessing male-driven evolution in flies Two complementary approaches have been used to detect such male-driven evolution. The first uses comparative data on the numbers of cell divisions required for female and male gametogenesis (Drost and Lee, 1995, 1998). The second estimates between-species divergence levels at silent nucleotide sites for autosomal, X- and Y- linked sequences; the differences among these yield estimates of α, the ratio of the male to female mutation rates (Miyata et al., 1987). If male-driven evolution is the sole cause of this difference, the estimate of α should be related to the ratio of the numbers of male and female germline divisions required to make a successful gamete, although the sensitivity of net mutation rates to demography (Charlesworth, 1994) means that equality of the two estimates is not necessarily expected. The two approaches have yielded consistent results for Drosophila melanogaster: the mean number of divisions is estimated to be 35.5 divisions for spermatogenesis and 34.5 for oogenesis (Drost and Lee, 1998). Although silent divergence among D. simulans and D. melanogaster is slightly higher for X-linked sites, this difference is not significant (i.e. α is approximately 1) (Bauer and Aquadro, 1997; Richards et al., 2005). More recent studies of different Drosophila species have detected some evidence for male-driven evolution in some lineages, but not others (Richards et al., 2005; Begun et al., 2007; Singh et al., 6
17 2007). This is further complicated by the high levels of ancestral polymorphisms in Drosophila populations, which can lead to apparent differences in divergence at X-, Y- linked and autosomal sites. For instance, while a higher rate of substitution of silent mutations has been found on the neo-y chromosome of D. miranda compared with the neo-x (Bachtrog, 2008), and this has been taken as evidence for male-driven evolution in this lineage, it can be also accounted for by the fixation of ancestral polymorphisms on the neo-y, caused by its greatly reduced effective population size (Bartolomé and Charlesworth, 2006) Assessing male-driven evolution in mammals The estimated mean numbers of cell divisions per generation are 401 divisions for human spermatogenesis and 31 for oogenesis (Drost and Lee, 1995). A male-driven evolution effect was detected in a human chimpanzee sequence comparison (Ebersberger et al., 2002), where α was estimated to be about 3. Overall sequence divergence among humans and chimpanzees estimated from the genome sequences is highest for the Y and lowest for the X chromosome (The Chimpanzee Sequencing and Analysis Consortium, 2005), yielding an α value of 2 6. This value is much smaller than the estimate from the cell division data. In contrast, a comparison of X chromosome and autosomal mouse rat silent divergence gave a much higher estimate of α than expected (McVean and Hurst, 1997). McVean & Hurst (1997) suggested that the low level of X-chromosome divergence was caused by a local reduction in the mutation rate, evolved by selection to avoid the expression of deleterious recessive mutations in 7
18 hemizygous males. Their sample of genes was relatively small, however, and subsequent work with larger samples supports male-biased mutation as the main force reducing X- chromosome neutral divergence (Malcom et al., 2004). Malcom et al. (2004) pointed out that, although there is great variation from chromosome to chromosome in human mouse and rat mouse comparisons (Lercher et al., 2001), the X chromosome consistently shows the lowest divergence. The shorter generation time of rodents is expected to lead to a smaller α than in primates, making it more difficult to estimate (62 germ cell divisions in males, assuming reproduction at 9 months, compared with 25 in females (Drost and Lee, 1995)). It has also been argued that there are replication-independent mutational mechanisms, which could explain inconsistencies between the ratio of male to female gametogenesis divisions and α estimates (Huttley et al., 2000). Taylor et al. (2005) analysed neutral divergence at X-linked and autosomal loci in a human-chimpanzee comparison, but separated mutations at CpG sites from the rest. These sites are known to be hotspots for mutations caused by deamination of methylated cytosines, a process that may be replication-independent. Consistent with this, divergence at non-cpg sites showed a strong male bias, with α corresponding to the ratio of male to female germline divisions, whereas a much smaller effect was observed at CpG sites. Additional support for male-driven evolution in vertebrates comes from sequence comparisons of birds, whose female heterogamety means that genes on the female-limited W chromosome should show lower rates of silent evolution than either the Z chromosome or autosomes, as is indeed observed (Montell et al., 2001; Axelsson et al., 2004; Sundstrom et al., 8
19 2004). This cannot be explained by the hypothesis of McVean and Hurst (McVean and Hurst, 1997). In summary, the extent and effects of male-driven neutral evolution depend both on the life history of the species and on the molecular basis of mutation. Current work suggests that the mammalian X chromosome and bird W chromosomes have lower mutation rates than the autosomes, resulting in lower levels of neutral divergence at X- and W-chromosome loci. In D. melanogaster, on the other hand, no such effect has been detected, as expected from the similar number of cell divisions estimated for male and female gametogenesis, but this needs further investigation in other Drosophila species. 1.3 Is selection more efficient for genes on the X? The fixation of beneficial and deleterious mutations In randomly mating populations, newly arisen autosomal mutations are found mostly in heterozygotes, where any recessive effects are masked by the ancestral allele and hence not exposed to selection (Haldane, 1924). If they arise on the X (or Z) chromosomes, however, their effect on fitness is fully expressed in the hemizygous males (or females). Therefore, selection is expected to fix beneficial recessive, or partially recessive, mutations (and remove deleterious recessive mutations) more efficiently on the X or Z chromosomes than on the autosomes (Rice, 1984; Charlesworth et al., 1987). Theoretical predictions concerning the rates of molecular evolution for favourable mutations at X-linked and autosomal sites are shown below. 9
20 Selection on autosomal and X-linked mutations A simple model of the effects on fitness of a mutation is as follows (Table 1.1), where s denotes the homozygous or hemizygous effect of a mutation, A 2, and h measures its degree of dominance. Table 1.1 : The fitness model used in Charlesworth et al. (1987). Females Males Autosomal mutation Genotypes A 1 A 1 A 1 A 2 A 2 A 2 A 1 A 1 A 1 A 2 A 2 A 2 Fitnesses 1 1+hs f 1+s f 1 1+hs m 1+s m X-linked mutation Genotypes A 1 A 1 A 1 A 2 A 2 A 2 A 1 A 2 Fitnesses 1 1+hs f 1+s f 1 1+s m The fate of a mutation is mainly determined by its rate of spread when rare, so we show the expressions for gene frequency change when A 2 is at a low frequency, p. Provided that selection is weak (s << 1), the change in frequency per generation of a rare autosomal mutation is (Ewens, 2004): ph( s!p " f + s m ) 2 (1.4) 10
21 The corresponding expression for an X- chromosome-linked mutation is: p( 2hs!p " f + s m ) 3 (1.5) A mutation will only spread in a very large population if Δp is positive, i.e. there is a net selective advantage to the mutation over wild-type, A 1. In a finite population, it can spread by genetic drift even if Δp < 0; the probabilities that this happens for autosomal and X- chromosomelinked mutations can be calculated (Charlesworth et al., 1987), but will not be given here. It is also of interest to know the rate of substitution (K) of mutations with fitness effects like A 2, since theoretical values of K can be compared with data on between-species DNA sequence divergence. K for mutations that arise as unique copies in the population is equal to the expected number of mutations that enter the population, times the probability that a mutation spreads through the population (Kimura, 1968; Charlesworth et al., 1987). The former is given by the product of the mutation rate and the number of gene copies in the population (2 x the population size N for autosomal genes; 1.5N for X-linked genes). With weak selection, the latter is determined by the ratio Δp/p. To simplify the formulae, we express K relative to the product of 2N and the mutation rate (Charlesworth et al., 1987). For beneficial autosomal mutations in a large population, we have: K A! 2h( s f + s m ) (1.6) (provided that s f + s m > 0; otherwise K A = 0). 11
22 The corresponding expression for X-linked mutations is: K X! ( 2hs f + s m ) (1.7) (provided that 2hs f + s m > 0; otherwise K X = 0). The ratio of K for X-linked and autosomal mutations (when both are > 0) is thus: ( 2hs R! f + s m ) 2h ( sf + s m ) (1.8) If there are no sex differences in selection (s f = s m ), R! {1 + 1/(2h)}/2; with selection on males only (s f = 0), R! 1/(2h); with selection on females only (s m = 0), R! 1. These predictions show that, under certain conditions, the X chromosome is expected to accumulate beneficial mutations at a faster rate than the autosomes, whereas weakly deleterious mutations are expected to accumulate by genetic drift at a higher rate on the autosomes (Charlesworth et al., 1987). This effect is especially strong for mutations affecting only males (Charlesworth et al., 1987). Higher male mutation rates, on the other hand, reduce any tendency for faster evolution of beneficial mutations on the X chromosome, but have the reverse effect for Z chromosomes (Kirkpatrick and Hall, 2004). In addition, if adaptive evolution uses variants that have been maintained in the population by mutation pressure, rather than picking up new mutations, the relative rates 12
23 of evolution for the X chromosome and autosomes can behave in the opposite way to these predictions (Orr and Betancourt, 2001). If a substantial fraction of DNA sequence divergence for non-synonymous mutations is driven by the fixation of beneficial mutations by natural selection (positive selection), as has been claimed for mammals (Fay et al., 2001) and some Drosophila species (Smith and Eyre-Walker, 2002; Sawyer et al., 2003; Bierne and Eyre-Walker, 2004; Welch, 2006; Andolfatto, 2007), we might see a higher rate of protein sequence evolution for X-chromosome-linked versus autosomal mutations. The reverse would be the case if protein evolution largely reflects the fixation of weakly deleterious, at least partly recessive, mutations. The availability of large quantities of sequence data makes it possible to examine this question Testing the faster-x hypothesis in Drosophila species Sequence divergence is often studied using K a and K s, the rates of evolution at non-synonymous sites (where mutations change the protein sequence of the gene) and synonymous sites (where mutations do not change the protein sequence), respectively. The nature of selection that has shaped the between-species sequence divergence of a gene affects its K a /K s ratio. If positive selection is more effective at X-linked loci, these should have higher K a /K s ratios than autosomal loci; the reverse would the case if purifying selection against deleterious mutations is more effective. One way to test for this is to estimate average K a and K s values over large numbers of genes on the X chromosome and the autosomes. Betancourt et al. (2002) found no difference between 51 X- chromosome-linked and 202 autosomal loci in the D. melanogaster /D. simulans 13
24 comparison. An even larger sample was provided by the release of the D. pseudoobscura genome (Richards et al., 2005). The values of K a and K s for alignable genes in this pair of species are similar for X-linked and autosomal loci (Richards et al., 2005). Thornton and Long (2002), on the other hand, studied duplicate gene pairs in the D. melanogaster genome, and observed that K a /K s values were significantly higher when both copies were located on the X chromosome than when one or both were located on an autosome. Subsequent population genetics work detected more positive selection on X-linked duplicates (Thornton and Long, 2005). These comparisons suffer from several problems, especially the fact that different sets of genes are often being compared, which may differ for reasons other than chromosomal location. This can be avoided by asking if the same gene evolves faster when it is on the X chromosome than when it is on an autosome. In the D. pseudoobscura group, an autosomal arm (3L in D. melanogaster) has fused to the X chromosome. Counterman et al. (2004) argued that, if there is a faster-x effect, then the genes on this new X chromosome arm will evolve faster than their autosomal homologues. They compared rates of evolution in the D. pseudoobscura group and the D. melanogaster group and found that, for 3L/XR genes, there is an excess of genes evolving faster in the D. pseudoobscura group (where they are X- chromosome linked) than in the D. melanogaster group, in agreement with the faster-x hypothesis. However, a recent study where the same approach was applied to a larger sample of genes suggested similar rates of evolution for X-linked and autosomal protein sequences (Thornton et al., 2006). 14
25 These mixed results suggest that either some of the assumptions on which the model is based are incorrect, or that the fraction of mutations fixed by positive selection has been overestimated. There seems to be some evidence for the latter. Most of the studies that detected a faster-x effect in Drosophila were biased towards fast evolving genes. Counterman et al. (2004) obtained part of their sample from a male-specific EST screen, thereby selecting genes that might be under stronger positive selection than is typical (Zhang et al., 2004). Similarly, newly duplicated genes (Thornton and Long, 2002) are likely to evolve under strong positive selection or to decay into pseudogenes Testing the faster-x hypothesis in mammals Recent studies also provide some indication of faster-x effects in mammals. Human-chimpanzee K a and K s values for many genes have been estimated (The Chimpanzee Sequencing and Analysis Consortium, 2005; Lu and Wu, 2005), showing that X-chromosome genes have a statistically significantly higher mean K a /K s than autosomal genes. The values for X-linked genes are skewed towards the two extremes, giving further support to the idea that X-linked genes evolving mainly under negative selection are evolving more slowly, whereas genes subject to positive selection are evolving faster. Several studies have suggested that sperm proteins are under strong positive selection, and might therefore be a good target for faster-x evolution (Torgerson et al., 2002; Swanson et al., 2003). Furthermore, they are only expressed in males, which would enhance this effect. In accordance with this prediction, X-linked sperm proteins in mammals evolve significantly faster than autosomal ones (Torgerson and Singh, 2003; Torgerson and Singh, 2006). Similarly, Khaitovich et al. (2005) analysed a 15
26 large dataset of tissue-specific genes and found that only testis-expressed X-linked genes have a higher K a /K i (K i is the divergence for non-coding sequences) Excess of codon bias on the X Recent studies of codon bias suggest that purifying selection may be more efficient on the X chromosome. Although synonymous codons are often assumed to evolve neutrally, in several organisms there is evidence for selection favouring preferred codons (Powell and Moriyama, 1997). Hambuch and Parsch (2005) and Singh et al. (2005) estimated the levels of codon bias for X-linked and autosomal genes in Drosophila and C. elegans and found a stronger bias on the X chromosome. Lu and Wu (2005) found a lower value of K s for synonymous sites on the X chromosome in the human chimpanzee genome sequence comparison. This pattern suggests more effective weak purifying selection on the X chromosome, possibly indicating that mutations affecting codon usage have partially recessive deleterious fitness effects (McVean and Charlesworth, 1999) X chromosomal divergence within species We have so far discussed the divergence of the X chromosome between species, but the same processes apply within a species. Both positive selection on new beneficial mutations and the continual removal of deleterious mutations reduce polymorphism levels at sites linked to the genes in question (Gordo and Charlesworth, 2001). If positive selection is more efficient on the X chromosome, we expect it to harbour less variability than the autosomes (Betancourt et al., 2004). Although this pattern is not observed in African populations of D. melanogaster and D. simulans, the X chromosome 16
27 is indeed less variable than the autosomes in non-african populations (Begun and Whitley, 2000; Andolfatto, 2001; Kauer et al., 2002; Mousset and Derome, 2004; Schofl and Schlotterer, 2004). Because these species have recently spread from Africa into Europe and North America, they might have experienced new selection pressures, so that the lower levels of polymorphism on the X chromosome reflect a higher frequency of recent fixations of favourable mutations on this chromosome than on the autosomes. However, other demographic scenarios could account for this pattern (Charlesworth, 2001), and more work is necessary to determine how much of it is caused by selection (Haddrill et al., 2005). Similarly, Wang et al. (2006) have detected an excess of linkage disequilibrium for X-linked loci in a large human polymorphism dataset. This result may be caused either by reduced recombination or increased selection. Although the human X chromosome appears to have a lower recombination rate than the autosomes, it seems likely that the 2-fold difference in linkage disequilibrium is at least partially caused by more effective selection on X-linked loci (Wang et al., 2006) Summary: is there really a faster-x effect? Theoretical models predict that if mutations are on average recessive, then selection will be more efficient on the X chromosome. Between- and within-species DNA divergence data are sometimes consistent with this prediction, both in Drosophila species and in mammals. Whether this corresponds to a faster or slower evolution of X- linked sites, however, depends on how much of the divergence is fixed by positive selection versus genetic drift. The fact that whole genome comparisons among 17
28 Drosophila species mostly yield similar rates of divergence for X and autosomes, whereas studies that focus on genes under strong positive selection find a higher K a /K s at X-linked sites, suggests that positive selection is rarer than previously estimated (Smith and Eyre-Walker, 2002; Bierne and Eyre-Walker, 2004). In human chimpanzee comparisons, higher K a /K s is consistently observed for X-linked loci. However, faster or slower X-evolution can arise in other ways, for example, if mutations have effects of opposite sign on the fitnesses of males and females, i.e. they are sexually antagonistic (see next section). This means that no unambiguous conclusions concerning causality can be drawn simply from differences among X chromosome and autosomes in the distribution of K a /K s values. 1.4 Accumulation of sex-biased genes on the X chromosome versus autosomes The accumulation of antagonistic mutations The occurrence of sexual antagonism also implies that the X chromosome may preferentially accumulate genes with sex-biased fitness effects (Rice, 1984). If an autosomal mutation with a significant heterozygous fitness effect is beneficial for females but deleterious for males, it will increase in frequency under positive selection only if the advantage to females is greater than the disadvantage to males (Rice, 1984). If a similar mutation occurs on the X chromosome, it will be subject to negative selection only 1/3 of the time, and thus has a higher probability of becoming fixed in the population. Similar predictions to those of Rice (1984) can be made by rewriting Equations 1.4 and 1.5, but using opposite signs for s f and s m : 18
29 a. Male advantage, female disadvantage: Let s m > 0, s f = -k s m. For autosomal inheritance, a mutation will spread in a large population if k < 1. For X-linked inheritance, it will spread if k < 1/(2h). The ratio of substitution rates for X-linked versus autosomal mutations (when both rates are > 0) is: (1-2hk) R! 2h(1 - k) (1.9) R > 1 if h < 0.5, and approaches infinity as h tends to zero. The conclusion is that some degree of recessivity (h < 0.5) of favourable fitness effects in males tends to leads to a higher rate of fixation of mutations on the X; dominance (h > 0.5) leads to a higher rate for the autosomes. This is true even if there are no deleterious effects in females (k = 0), but the effect increases with the value of k. b. Female advantage, male disadvantage: Let s f > 0, s m = -k s f. For autosomal inheritance, a mutation will spread in a large population if k < 1; for X-linked inheritance, if k < 2h. The ratio of X to autosome rates (when both are > 0) is: (2h - k) R! 2h (1 - k) (1.10) R 1 if h > k/2, and approaches infinity as k tends to 1. 19
30 With favourable fitness effects in females, sexual antagonism leads to a higher rate of fixation of mutations on the X if there is some degree of dominance, and to a higher rate on the autosomes with recessivity; again, this effect increases with k The accumulation of sex-biased genes Rice s (1984) model of the fixation of sexually antagonistic mutations relies on modifiers that inhibit the expression of sexually antagonistic mutations in the harmed sex, so that the mutation becomes unconditionally beneficial and is consequently driven to fixation. The gene involved therefore becomes sex-biased, that is, primarily expressed in one of the sexes. If the accumulation of antagonistic mutations leads to the creation of sex-biased genes, the X chromosome is likely to accumulate genes that are expressed in females rather than males, at a faster rate than the autosomes (when the initial sexually antagonistic mutation is dominant). But sexual antagonism involving alleles with recessive fitness effects predicts an accumulation of male-biased genes on the X chromosome rather than the autosomes (Rice, 1984): New X-linked recessive mutations that are beneficial for males and deleterious for females can spread, since their beneficial effects are expressed in males, whereas at low frequencies their deleterious effects on females are masked. Depending on the level of dominance of the fitness effects of mutations, accumulation of either male- or female-biased genes on the X chromosome relative to the autosomes can occur. 20
31 1.4.3 Results for Drosophila and C. elegans Microarray datasets can be used to determine the patterns of expression of genes in relation to sex, allowing the distribution of female- and male-biased genes in the genome to be determined. Using this approach, an excess of female-biased genes on the X chromosome has been found in both Drosophila species and C. elegans (Parisi et al., 2003; Ranz et al., 2003; Reinke et al., 2004; Table 1.2), whereas genes with male-biased expression are under-represented on the X chromosome. Genes expressed in the gonads seem to show a particularly strong effect of this kind (Parisi et al., 2003). 21
32 Table 1.2: Summary of the studies on the genomic distribution of sex-biased genes. (Lercher et al., 2003; Parisi et al., 2003; Khil et al., 2004; Reinke et al., 2004; Kaiser and Ellegren, 2006). A plus sign is used to mark an excess of genes on the X chromosome, whereas a minus sign denotes a deficit. NA stands for not applicable. To disentangle the effects of meiotic inactivation and sexual antagonism in the distribution of male-biased genes in the mouse genome, Khil et al. (Khil et al., 2004) focused on genes involved in early spermatogenesis, before the X chromosome has been inactivated. To do so they analysed testis expression data from young mice, as developing testes contain a higher proportion of cells in early spermatogenesis, and spoii-/- mice, whose spermatogenesis is blocked in early meiosis. Genes on the X chromosome Organism Tissue/Function female Male Drosophila melanogaster Gonads + - Whole adults No effect - Adult soma No effect - Caenorhabditis elegans Gametogenesis - - Soma + No effect Mouse Gonads + - Testis, SpoII-/- NA + Young testis NA + Human Prostate NA + Ovary+mammary gland No effect NA Chicken (females ZW) Brain - + Gonads - No effect 22
33 1.4.4 Different results for mammals There has been some debate about whether there is evidence for an excess of female-biased genes on the X chromosome in mammals (Lercher et al., 2003), but a recent study suggests that there is such an effect (Khil et al., 2004). Initial reports in rodents suggested that the X chromosome had an excess of male-biased genes (Wang et al., 2001). The X chromosome is inactivated during meiosis in the male germline, so that genes whose expression is required late in spermatogenesis must be located on the autosomes or Y chromosome (Lifschytz and Lindsley, 1972). This would prevent any accumulation of members of this subset of male-biased genes on the X chromosome. It has accordingly been suggested that the differences between the mouse and C. elegans/ Drosophila results were mainly due to experimental design, since early spermatocytes were used in the rodent study. If this were the case, then the mammalian X chromosome should also show a deficit of late spermatogenesis genes, and the male-biased gene deficit on the Drosophila/C. elegans X chromosomes should be confined to spermatogenesis-related genes. The first prediction was confirmed by Khil et al. (2004), who found that the rodent X chromosome was deficient in male-biased genes from mature testis arrays (consisting mostly of mature spermatocytes), but enriched in malebiased genes from immature testis (where mature spermatocytes, with an inactive X chromosome, are absent or rare). Oliver and Parisi (2004) pointed out that somatically expressed male-biased genes in Drosophila melanogaster are also scarce on the X chromosome, so that the second prediction is falsified. In particular, the accessory gland proteins are fertilityenhancing proteins produced by Drosophila males and transferred to females during 23
34 mating. These are not expressed in spermatocytes, but are also present more rarely than expected on the X chromosome (Mueller et al., 2005), suggesting that the deficit of this class of male-biased genes on the X chromosome is caused by evolutionary forces other than avoidance of X-inactivation Why the difference? There thus seems to be a real difference between the Drosophila species and mammalian results, once the effect of X-inactivation in spermatogenesis is removed. There is, however, no obvious reason why the dominance of the fitness effects of favourable mutations should be consistently different between these groups. Without direct evidence of the dominance effects of favourable mutations, it will be challenging to resolve this difficulty, and the interpretation of the patterns we have discussed remains speculative. One possibility is that differences in the mechanisms of dosage compensation could influence the evolution of the expression pattern at X -linked loci. In flies, nematodes and mammals, mechanisms are in place to ensure that haploid males and diploid females produce similar amounts of X-derived mrnas (Gupta et al., 2006). In Drosophila melanogaster, this involves increasing the rate of expression of genes on the male X chromosome. It has been suggested (Connallon and Knowles, 2005) that male-biased genes evolve mostly by increases in the level of expression of existing genes in males; if this is the case then higher expression levels could be harder to achieve on the already hyperactive X chromosome than on the autosomes, if the rate of mrna transcription is limited. 24
35 It is interesting to note that a study of the distribution of sex-biased genes in the chicken genome has recently been completed (Kaiser and Ellegren, 2006). The results are similar to the Drosophila and C. elegans results, with a deficit of female brain and ovary genes on the Z chromosome, and an excess of male brain genes (Table 1.2). Studies in birds, where the female is heterogametic, are useful, since they decouple the effects of sex and heterogamety. On the other hand, not much is known about the biology of the Z chromosome, making it difficult to evaluate the influence of other factors, such as dosage compensation, on its evolution. It is important to note that the gene content of the X chromosome is very stable in both Drosophila species and mammals (Brudno et al., 2004), so that the patterns we have described must overwhelmingly reflect evolutionary shifts in gene expression, not physical movements of genes on and off the X chromosome. This casts doubt on the SAXI hypothesis (Wu and Xu, 2003), the idea that the X-chromosome has a deficit of male-biased genes because there is a selective pressure for genes involved in spermatogenesis to be duplicated onto autosomes (followed by the loss of the original copy or of the male-biased function of the original X-linked copy) in order to avoid X meiotic inactivation. 1.5 What have we learnt from these patterns? Although they have evolved independently, the sex chromosomes of mammals and Drosophila species are quite similar in their general properties, and their evolution appears to be shaped by similar evolutionary forces. However, we have highlighted 25
36 several differences between them, which probably result from differences in the biology of insects and mammals. The number of cell divisions is higher for spermatogenesis than for oogenesis in mammals, but not in D. melanogaster. Probably as a result of this difference, silent site divergence for X-linked loci is lower than for autosomes in mammals, but is usually similar in Drosophila species. Recombination is lower for the X chromosome than the autosomes in humans, but higher in Drosophila. The evidence on rates of protein sequence evolution and codon usage bias from both Drosophila species and mammals suggests that both positive and negative selection act more efficiently at X-linked loci. The classic explanation for faster protein sequence evolution on the X chromosome invokes the faster accumulation of favourable recessive mutations (Charlesworth et al., 1987). As noted above, there are other possible causes of this pattern. It will probably be necessary to relate differences in patterns of gene expression between the sexes to differences in evolutionary rates between X-linked and autosomal genes to answer questions of causation: for instance, genes which have been expressed only in one sex for a long period of evolutionary time are not likely to be subject to sexual antagonism. The recessivity of beneficial mutations suggested above is contrary to the expression data in Drosophila, for which the patterns of sex-biased genes are consistent with predictions for dominant mutations, with an accumulation of female-biased and a deficit of male-biased genes on the X (Parisi et al., 2003). Since an excess of malebiased genes is observed for mammals (Khil et al., 2004), it is possible that other biological causes, such as differences in dosage compensation mechanisms, are 26
37 preventing male-biased expression patterns evolving on the Drosophila X chromosome, but this needs to be further studied. A study of the evolution of patterns of gene expression in species such as D. pseudoobscura, in which a former autosome has been attached to the X chromosome for a long period of evolutionary time (Counterman et al., 2004), would be illuminating in this regard. Finally, both the faster-x effect and the accumulation of sex-biased genes on the X due to sexual antagonism can account for the excess of brain- and testis-expressed genes detected on the human X chromosome, without involving female choice of more intelligent males as proposed by Zechner et al. (2001). Cognitive function and fertility are probably critical for the evolution of mammalian lineages (Wilda et al., 2000), and it is possible that genes that influence them are especially subject to positive selection. X- linked loci in mammals might thus have accumulated an excess of mutations that enhance these characteristics, making them more prone to mutations that impair them. Furthermore, behavioural patterns differ in the two sexes, and this might lead brainexpressed genes to accumulate on the X chromosome through sexually antagonistic effects (Arnold, 2004). This is consistent with the higher expression level of X- chromosome versus autosomal genes detected in the brain (Nguyen and Disteche, 2006) (but not in other tissues), if sexual antagonism results in increased gene expression in the beneficiary sex (Connallon and Knowles, 2005). Analyses of gene expression in different mammalian tissues have shown that there is a correlation between testis and the brain in patterns of gene expression, so that brain-expressed genes are to a certain extent also testis-expressed genes (Guo et al., 2003; Son et al., 2005), which may further enhance their accumulation on the X chromosome. 27
38 1.6 Aims of this thesis This chapter summarizes important results that have come out of recent analyses of X-linked and autosomal divergence, polymorphism, and expression. There are several inconsistencies, both between different studies of the same organism and between different organisms, that still need to be accounted for. The initial focus of this thesis was faster-x evolution in Drosophila. We used two different approaches that can improve our understanding of the processes leading to presence or absence of faster-x evolution: -Empirical approach (Chapter 2): Estimating K a, K s and K a /K s for a set of genes that are X-linked in some species of Drosophila but autosomal in others can highlight differences in evolutionary rates that are caused solely by being located on the X, and not by other factors that could differ between chromosomes. This was used by some previous studies to test for faster-x evolution (see section 1.3). For this type of analysis, the species chosen to estimate K a, K s and K a /K s are crucial: if the species are too close, differences in rates of evolution between chromosomes can be the result of different levels of ancestral polymorphism; if the species are too distant, more sites are saturated, which makes estimates of rates of evolution (in particular of K s ) unreliable. We have chosen two species pairs that are nearly ideal for this purpose: D. melanogaster-d. yakuba and D. pseudoobscura-d. affinis. We compare rates of evolution of genes when they are autosomal, in D. melanogaster-d. yakuba, with the respective rates when they are X-linked, in D. pseudoobscura-d. affinis. -Theoretical approach (Chapter 3): Current models of X-linked and autosomal evolutionary rates often assume that the effective population size of the X chromosome 28
39 is equal to ¾ of the autosomal population size. However, polymorphism studies in D. melanogaster and D. simulans suggest that there are often significant deviations from this value. We have used a FORTRAN program to compute fixation rates of beneficial and deleterious mutations at X-linked and autosomal sites when this occurs. The second part of the thesis is dedicated to the evolution of sex-biased genes, as many patterns concerning these genes remain to be understood (section 1.4). We were interested in two main questions: -What are the steps that lead to the creation of sex-biased genes, and how do they relate to Rice s (1984) model for the accumulation of sexually antagonistic mutations? To investigate this, we used EST data to compare expression profiles of genes that are sex-biased in D. melanogaster, but not in D. simulans, with the expression profiles of non-biased genes (Chapter 4). -The results presented in Chapter 4 suggest that male-biased genes arise through a large increase of expression in the testis. Can this provide an alternative explanation for the deficit of male-biased genes on the X chromosome, observed in Drosophila? Using EST and microarray data, we investigate the possibility that the high levels of testis expression observed for male-biased genes in Drosophila may be harder to achieve on the single male X chromosome, if there is an upper limit to the amount of mrna that can be produced from one copy of each gene (Chapter 5). 29
40 1.7 References Andolfatto, P. Contrasting patterns of X-linked and autosomal nucleotide variation in Drosophila melanogaster and Drosophila simulans. Mol. Biol. Evol., 18: , 2001 Andolfatto, P. Hitchhiking effects of recurrent beneficial amino acid substitutions in the Drosophila melanogaster genome. Genome Research, 17: , 2007 Arnold, P.A. Sex chromosomes and brain gender. Nat. Rev. Neur., 5:1-8, 2004 Axelsson, E., Smith, N.G.C., Sundstrom, H., Berlin, S., Ellegren, H. Male-biased mutation rate and divergence in autosomal, Z-linked and W-linked introns of chicken and turkey. Mol. Biol. Evol., 21: , 2004 Bachtrog, D. Evidence for Male-Driven Evolution in Drosophila. Molecular Biology and Evolution, 25: , 2008 Bartolomé, C., Charlesworth, B. Evolution of Amino-Acid Sequences and Codon Usage on the Drosophila miranda Neo-Sex Chromosomes. Genetics, 174: , 2006 Bauer, V.L., Aquadro, C.F. Rates of DNA sequence evolution are not sex-biased in Drosophila melanogaster and D. simulans. Mol. Biol. Evol., 14: , 1997 Begun, D.J., Holloway, A.K., Stevens, K., Hillier, L.W., Poh, Y.P., Hahn, M.W., Nista, P.M., Jones, C.D., Kern, A.D., Dewey, C.N., Pachter, L., Myers, E., Langley, C.H. Population genomics: whole-genome analysis of polymorphism and divergence in Drosophila simulans. PLoS Biology, 5:e310, 2007 Begun, D.J., Whitley, P. Reduced X-linked nucleotide polymorphism in Drosophila simulans. Proc. Nat. Acad. Sci., 97: ,
41 Betancourt, A.J., Kim, Y., Orr, H.A. A pseudohitchhiking model of X vs. autosomal diversity. Genetics, 168: , 2004 Betancourt, A.J., Presgraves, D.C., Swanson, W.J. A test for faster X evolution in Drosophila. Mol. Biol. Evol., 19: , 2002 Bierne, N., Eyre-Walker, A. The genomic rate of adaptive amino acid substitution in Drosophila. Mol. Biol. Evol., 21: , 2004 Brudno, M., Poliakov, A., Salamov, A., Cooper, G.M., Sidow, A., Rubin, E.M., Solovyev, V., Batzoglou, S., Dubchak, I. Automated whole-genome multiple alignment of rat, mouse, and human. Genome Res., 14: , 2004 Charlesworth, B. Background selection and patterns of genetic diversity in Drosophila melanogaster. Genet. Res., 68: , 1996 Charlesworth, B. The effect of life-history and mode of inheritance on neutral genetic variability. Genet. Res., 77: , 2001 Charlesworth, B., Coyne, J.A., Barton, N.H. The relative rates of evolution of sexchromosomes and autosomes. American Naturalist, 130: , 1987 Charlesworth, D., Charlesworth, B., Marais, G. Steps in the evolution of heteromorphic sex chromosomes. Heredity, 95: , 2005 The Chimpanzee Sequencing and Analysis Consortium. Initial sequence of the chimpanzee genome and comparison with the human genome. Nature, 437:69-87, 2005 Connallon, T., Knowles, L.L. Intergenomic conflict revealed by patterns of sex-biased gene expression. Trends Genet., 21: ,
42 Counterman, B.A., Ortiz-Barrientos, D., Noor, M.A. Using comparative genomic data to test for fast-x evolution. Int. J. Org. Evolution, 58: , 2004 Drake, J.W., Charlesworth, B., Charlesworth, D., Crow, J.F. Rates of spontaneous mutation. Genetics, 148: , 1998 Drost, J.B., Lee, W.R. Biological basis of germline mutation: comparisons of spontaneous germline mutation rates among drosophila, mouse, and human. Environ. Mol. Mutagen., 25 Suppl 26:48-64, 1995 Drost, J.B., Lee, W.R. The developmental basis for germline mosaicism in mouse and Drosophila melanogaster. Genetica, 102/103: , 1998 Ebersberger, I., Metzler, D., Schwarz, C., Paabo, S. Genomewide comparison of DNA sequences between humans and chimpanzees. Am. J. Hum. Genet., 70: , 2002 Ewens, W. J., (2004) Mathematical Population Genetics. Second Revised Edition. (Springer-Verlag, New York) Fay, J.C., Wyckoff, G.J., Wu, C.-I. Positive and negative selection on the human genome. Genetics, 158: , 2001 Gordo, I., Charlesworth, B. Genetic linkage and molecular evolution. Curr. Biol., 11:R684-R686, 2001 Guo, J., Zhu, P., Wu, C., Yu, L., Zhao, S., Gu, X. In silico analysis indicates a similar gene expression pattern between human brain and testis. Cytogenet. Genome. Res., 103:58-62,
43 Gupta, V., Parisi, M., Sturgill, D., Nuttall, R., Doctolero, M., Dudko, O.K., Malley, J.D., Eastman, P.S., Oliver, B. Global analysis of X-chromosome dosage compensation. J. Biol., 5: , 2006 Haddrill, P.R., Thornton, K.R., Charlesworth, B., Andolfatto, P. Multilocus patterns of nucleotide variability and the demographic and selection history of Drosophila melanogaster populations. Genome Res., 15: , 2005 Haldane, J.B.S. A mathematical theory of natural and artificial selection. Part I. Trans. Camb. Philos. Soc., 23:19-41, 1924 Haldane, J.B.S. The mutation rate of the gene for haemophilia, and its segregation ratios in males and females. Annals of Eugenics, 13: , 1947 Hambuch, T.M., Parsch, J. Patterns of synonymous codon usage in Drosophila melanogaster genes with sex-biased expression. Genetics, 170: , 2005 Huttley, G.A., Jakobsen, I.B., Wilson, S.R., Easteal, S. How important is DNA replication for mutagenesis? Mol. Biol. Evol., 17: , 2000 Kaiser, V.B., Ellegren, H. Nonrandom distribution of genes with sex-biased expression in the chicken genome. Evolution Int J Org Evolution, 60: , 2006 Kauer, M., Zangerl, B., Dieringer, D., Schlotterer, C. Chromosomal patterns of microsatellite variability contrast sharply in African and non-african populations of Drosophila melanogaster. Genetics, 160: , 2002 Keightley, P.D., Eyre-Walker, A. Deleterious mutations and the evolution of sex. Science, 290: , 2000 Khaitovich, P., Hellmann, I., Enard, W., Nowick, K., Leinweber, M., Franz, H., Weiss, G., Lachmann, M., Pääbo, S. Parallel patterns of evolution in the 33
44 genomes and transcriptomes of humans and chimpanzees. Science, 309: , 2005 Khil, P.P., Smirnova, N.A., Romanienko, P.J., Camerini-Otero, R.D. The mouse X chromosome is enriched for sex-biased genes not subject to selection by meiotic sex chromosome inactivation. Nat. Genet., 36: , 2004 Kimura, M. Evolutionary rate at the molecular level. Nature, 217: , 1968 Kirkpatrick, M., Hall, D.W. Male-biased mutation, sex linkage, and the rate of adaptive evolution. Int. J. Org. Evolution, 58: , 2004 Lercher, M.J., Urrutia, A.O., Hurst, L.D. Evidence that the human X chromosome is enriched for male-specific but not female-specific genes. Mol. Biol. Evol., 20: , 2003 Lercher, M.J., Williams, E.J.B., Hurst, L.D. Local similarity in evolutionary rates extends over whole chromosomes in human-rodent and mouse-rat comparisons: implications for understanding the mechanistic basis of the male mutation bias. Mol. Biol. Evol., 18: , 2001 Lifschytz, E., Lindsley, D.L. The role of X-chromosome inactivation during spermatogenesis (Drosophila-allocycly-chromosome evolution-male sterilitydosage compensation). Proc. Nat. Acad. Sci., 69: , 1972 Lu, J., Wu, C.-I. Weak selection revealed by the whole-genome comparison of the X chromosome and autosomes of human and chimpanzee. Proc. Nat. Acad. Sci., 102: ,
45 Malcom, C.M., Wyckoff, G.J., Lahn, B.T. Genic mutation rates in mammals: local similarity, chromosomal heterogeneity, and X-versus-autosome disparity. Mol. Biol. Evol., 20: , 2004 McVean, G.T., Charlesworth, B. A population genetic model for the evolution of synonymous codon usage: patterns and predictions. Genet. Res., 74: , 1999 McVean, G.T., Hurst, L.D. Evidence for a selectively favourable reduction in the mutation rate of the X chromosome. Nature, 386: , 1997 Miyata, T., Hayashida, H., Kuma, K., Mitsuyasu, K., Yasunaga, T. Male-driven molecular evolution: a model and nucleotide sequence analysis. Cold Spring Harb. Symp. Quant. Biol., 52: , 1987 Montell, H., Fridolfsson, A.-K., Ellegren, H. Contrasting levels of nucleotide diversity on the avian Z and W sex chromosomes. Mol. Biol. Evol., 18: , 2001 Mousset, S., Derome, N. Molecular polymorphism in Drosophila melanogaster and D. simulans: what have we learned from recent studies? Genetica, 120:79-86, 2004 Mueller, J.L., Ravi Ram, K., McGraw, L.A., Bloch Qazi, M.C., Siggia, E.D., Clark, A.G., Aquadro, C.F., Wolfner, M.F. Cross-species comparison of Drosophila male accessory gland protein genes. Genetics, 171: , 2005 Nguyen, D.K., Disteche, C.M. Dosage compensation of the active X chromosome in mammals. Nat. Genet., 38:47-53, 2006 Oliver, B., Parisi, M. Battle of the Xs. Bioessays, 26: , 2004 Orr, H.A., Betancourt, A.J. Haldane's sieve and adaptation from the standing genetic variation. Genetics, 157: ,
46 Parisi, M., Nuttall, R., Naiman, D., Bouffard, G., Malley, J., Andrews, J., Eastman, S., Oliver, B. Paucity of genes on the Drosophila X chromosome showing malebiased expression. Science, 299: , 2003 Powell, J.R., Moriyama, E.N. Evolution of codon usage bias in Drosophila. Proc. Nat. Acad. Sci., 94: , 1997 Ranz, J.M., Castillo-Davis, C.I., Meiklejohn, C.D., Hartl, D.L. Sex-dependent gene expression and evolution of the Drosophila transcriptome. Science, 300: , 2003 Reinke, V., Gil, I.S., Ward, S., Kazmer, K. Genome-wide germline-enriched and sexbiased expression profiles in Caenorhabditis elegans. Development, 131: , 2004 Rice, W.R. Sex chromosomes and the evolution of sexual dimorphism. Evolution, 38: , 1984 Richards, S., Liu, Y., Bettencourt, B.R., Hradecky, P., Letovsky, S., Nielsen, R., Thornton, K., Hubisz, M.J., Chen, R., Meisel, R.P., Couronne, O., Hua, S., Smith, M.A., Zhang, P., Liu, J., Bussemaker, H.J., van Batenburg, M.F., Howells, S.L., Scherer, S.E., Sodergren, E., Matthews, B.B., Crosby, M.A., Schroeder, A.J., Ortiz-Barrientos, D., Rives, C.M., Metzker, M.L., Muzny, D.M., Scott, G., Steffen, D., Wheeler, D.A., Worley, K.C., Havlak, P., Durbin, K.J., Egan, A., Gill, R., Hume, J., Morgan, M.B., Miner, G., Hamilton, C., Huang, Y., Waldron, L., Verduzco, D., Clerc-Blankenburg, K.P., Dubchak, I., Noor, M.A.F., Anderson, W., White, K.P., Clark, A.G., Schaeffer, S.W., Gelbart, W., Weinstock, G.M., Gibbs, R.A. Comparative genome sequencing of 36
47 Drosophila pseudoobscura: Chromosomal, gene, and cis-element evolution. Genome Res., 15:1-18, 2005 Saifi, G.M., Chandra, H.S. An apparent excess of sex- and reproduction-related genes on the human X chromosome. Proc. Biol. Sci., 266: , 1999 Sawyer, S.A., Kulathinal, R.J., Bustamante, C.D., Hartl, D.L. Bayesian analysis suggests that most amino acid replacements in Drosophila are driven by positive selection. J. Mol. Evol., 57 Suppl 1:S154-S164, 2003 Schofl, G., Schlotterer, C. Patterns of microsatellite variability among X chromosomes and autosomes indicate a high frequency of beneficial mutations in non-african D. simulans. Mol. Biol. Evol., 21: , 2004 Singh, N.D., Davis, J.C., Petrov, D.A. X-linked genes evolve higher codon bias in Drosophila and Caenorhabditis. Genetics, 171: , 2005 Singh, N.D., Larracuente, A.M., Clark, A.G. Contrasting the Efficacy of Selection on the X and Autosomes in Drosophila. Molecular Biology and Evolution, msm275, 2007 Skuse, D.H. X-linked genes and mental functioning. Hum. Mol. Genet., 14:R27-R32, 2005 Smith, N.G., Eyre-Walker, A. Adaptive protein evolution in Drosophila. Nature, 415: , 2002 Son, C.G., Bilke, S., Davis, S., Greer, B.T., Wei, J.S., Whiteford, C.C., Chen, Q.-R., Cenacchi, N., Khan, J. Database of mrna gene expression profiles of multiple human organs. Genome Res., 15: ,
48 Sundstrom, H., Webster, M.T., Ellegren, H. Reduced variation on the chicken Z chromosome. Genetics, 167: , 2004 Swanson, W.J., Nielsen, R., Yang, Q. Pervasive adaptive evolution in mammalian fertilization proteins. Mol. Biol. Evol., 20:18-20, 2003 Tao, Y., Chen, S., Hartl, D.L., Laurie, C.C. Genetic dissection of hybrid incompatibilities between Drosophila simulans and D. mauritiana. I. Differential accumulation of hybrid male sterility effects on the X and autosomes. Genetics, 164: , 2003 Taylor, J., Tyekucheva, S., Zody, M., Chiaromonte, F., Makova, K.D. Strong and weak male mutation bias at different sites in the primate genomes: insights from the human-chimpanzee comparison. Mol. Biol. Evol., 23: , 2005 Thornton, K., Bachtrog, D., Andolfatto, P. X chromosomes and autosomes evolve at similar rates in Drosophila: No evidence for faster-x protein evolution. Genome Res., gr , 2006 Thornton, K., Long, M. Rapid divergence of gene duplicates on the Drosophila melanogaster X Chromosome. Mol. Biol. Evol., 19: , 2002 Thornton, K., Long, M. Excess of amino acid substitutions relative to polymorphism between X-linked duplications in Drosophila melanogaster. Mol. Biol. Evol., 22: , 2005 Torgerson, D.G., Kulathinal, R.J., Singh, R.S. Mammalian sperm proteins are rapidly evolving: evidence of positive selection in functionally diverse genes. Mol. Biol. Evol., 19: ,
49 Torgerson, D.G., Singh, R.S. Sex-linked mammalian sperm proteins evolve faster than autosomal ones. Mol. Biol. Evol., 20: , 2003 Torgerson, D.G., Singh, R.S. Enhanced adaptive evolution of sperm-expressed genes on the mammalian X chromosome. Heredity, 96:39-44, 2006 Wang, E.T., Kodama, G., Baldi, P., Moyzis, R.K. Global landscape of recent inferred Darwinian selection for Homo sapiens. Proc. Nat. Acad. Sci., 103: , 2006 Wang, P.J., McCarrey, J.R., Yang, F., Page, D.C. An abundance of X-linked genes expressed in spermatogonia. Nat. Genet., 27: , 2001 Welch, J.J. Estimating the Genomewide Rate of Adaptive Protein Evolution in Drosophila. Genetics, 173: , 2006 Wilda, M., Bachner, D., Zechner, U., Kehrer-Sawatzki, H., Vogel, W., Hameister, H. Do the constraints of human speciation cause expression of the same set of genes in brain, testis, and placenta? Cytogenet. Cell. Genet., 91: , 2000 Wu, C.I., Xu, E.Y. Sexual antagonism and X inactivation--the SAXI hypothesis. Trends Genet., 19: , 2003 Zechner, U., Wilda, M., Kehrer-Sawatzki, H., Vogel, W., Fundele, R., Hameister, H. A high density of X-linked genes for general cognitive ability: a run-away process shaping human evolution? Trends Genet., 17: , 2001 Zhang, Z., Hambuch, T.M., Parsch, J. Molecular evolution of sex-biased genes in Drosophila. Mol. Biol. Evol., 21: ,
50 Chapter 2: Faster-X evolution in Drosophila Abstract Population genetics models show that, given certain conditions, the X chromosome is expected to be under more efficient selection than the autosomes. This could lead to faster-x evolution, if a large proportion of mutations are fixed by positive selection, as suggested by recent studies in Drosophila and mammals. We used a multi-species approach to test this: Muller s element D, an autosomal arm, is fused to the ancestral X chromosome in Drosophila pseudoobscura and its sister species, D. affinis. We tested whether the same set of genes had higher rates of non-synonymous evolution when they were X-linked (in the D. pseudoobscura-d.affinis comparison) than when they were autosomal (in D. melanogaster-d. yakuba). Our results suggest this may be the case, but only for genes under particularly strong positive selection/weak purifying selection. They also suggest that genes that have become X-linked have higher levels of codon bias and slower synonymous site evolution, consistent with more effective selection on codon usage at X-linked sites. We also analyzed published D. melanogaster polymorphism data to investigate why selection is more effective on the X. We find that this is at least partly due to different rates of recombination for X-linked and autosomal sites. Vicoso, B., Haddrill, P.R., Charlesworth, B. A multispecies approach for comparing sequence evolution of X-linked and autosomal sites in Drosophila. Genetics Research, 90: ,
51 2.1 Introduction Faster-X evolution Positive selection may be more effective on the X chromosome compared with the autosomes, because the impact of recessive mutations is never masked in males, which could lead to a higher number of beneficial mutations being fixed at X-linked loci. Charlesworth et al. (1987) modelled the rates of evolution of sex-linked and autosomal loci, assuming that this occurs by fixation of new unique mutations. When selection acts equally on both sexes (the selection coefficient, s, is the same in males and females) and there is dosage compensation, the ratio of the rates of fixation of advantageous mutations at autosomal sites to X-linked sites, in a very large population, is given by: R x 4h/(2h + 1) (where h is the dominance coefficient) (2.1) This implies that, if most beneficial mutations are at least partially recessive, they will accumulate faster on the X chromosome. If selection is acting on males only (e.g. for genes that are only expressed in males), the effect is even stronger. On the other hand, under the same conditions (selection on both sexes with dosage compensation), the ratio of the rates of fixation of slightly deleterious mutations is such that if most deleterious mutations are at least partially recessive, they will accumulate faster on the autosomes. This occurs because the deleterious effect of an X-linked mutation will be immediately expressed, and selected against, in the hemizygous males, whereas an autosomal equivalent would not be selected against until it reaches a significant frequency in the population. Ultimately, X-linked loci will evolve faster or slower than autosomal ones depending on the fractions of mutations that are fixed by positive selection versus genetic drift. Studies in 41
52 mammals suggest that only a small fraction of non-synonymous divergence is fixed by positive selection in this group (Fay et al., 2001; Zhang and Li, 2005; Eyre-Walker, 2006; Studer et al., 2008). In Drosophila, on the other hand, recent studies have suggested that 25 to 50% of the divergent non-synonymous sites in Drosophila (Smith and Eyre-Walker, 2002; Bierne and Eyre-Walker, 2004; Welch, 2006; Andolfatto, 2007) were fixed by positive selection. In view of this considerable amount of adaptive divergence, we might expect to observe a faster-x evolution in Drosophila. This will, however, only occur if divergence comes from the fixation of new mutations and not from standing variation. Orr and Betancourt (2001) modelled the fixation of polymorphic alleles and concluded that evolution by fixation of alleles initially present at frequencies expected under mutation-selection balance always proceeds more slowly at X- linked than autosomal genes (Orr and Betancourt, 2001). Kirkpatrick and Hall (2004) further extended Charlesworth et al. s (1987) model to investigate the effect of higher male mutation rates on the evolution rates of X-linked and autosomal loci (Kirkpatrick and Hall, 2004). Spermatogenesis often involves a higher number of cell divisions than oogenesis and, as mutations often occur as a result of replication mistakes during cell division, this can lead to a higher mutation rate in males than in females (reviewed in Vicoso and Charlesworth, 2006). Since the X chromosome only spends 1/3 of its time in males, its overall mutation rate is equal to: u X = 1 / 3 u m + 2 / 3 u f (2.2) where u m is the male mutation rate, and u f the female mutation rate. The autosomal mutation rate is : u A = 1 / 2 u m + 1 / 2 u f (2.3) 42
53 since autosomes spend 1 / 2 of their time in males. This means that a higher male mutation rate will affect the autosomal mutation rate more strongly than the mutation rate at X-linked sites (Miyata et al., 1987). Since the rate of divergence is affected by the mutation rate, this can, in principle, counteract the faster-x effect. Kirkpatrick and Hall (2004) showed that, in this case, X-linked genes only evolve faster when mutations are quite recessive (e.g. h < 0.32 for α = 5, where α is the ratio of male to female mutation rates). Although this result should carefully be taken into account when analysing the evolution of the mammalian X, it is unlikely to be of major importance in Drosophila, where there is no evidence for a higher male mutation rate in most species (Bauer and Aquadro, 1997, Richards et al., 2005). Much lower rates of silent and synonymous evolution were detected on the X chromosome than on the Y in a study of D. miranda (Bachtrog, 2008), and this was taken as evidence for male-driven evolution in this species, but, as pointed out by Bartolomé and Charlesworth (2006), it can also be accounted for by differences in X-linked and autosomal ancestral polymorphism levels Evidence for faster-x evolution in Drosophila Average rates of evolution at X-linked and autosomal sites The current availability of large DNA sequence datasets has made possible extensive analyses of X chromosome molecular evolution. In particular, by using between-species comparisons, we can now study separately K s, the rate of synonymous divergence (the accumulation of mutations that do not affect the amino-acid sequence), and K a, the rate of non-synonymous divergence (the accumulation of new amino-acid sequence differences). It is commonly assumed that K s reflects nearly neutral evolution, and the ratio K a /K s is used to 43
54 estimate the effect of selective forces: neutral or nearly neutral sequences evolve at K a /K s 1. Negative (purifying) selection decreases this ratio whereas recurrent positive selection increases it. If positive selection is more efficient on the X chromosome, we expect X-linked sites to show higher K a /K s values than autosomal sites (reviewed in Hurst, 2002). Thornton and Long (2002) studied the molecular evolution of 1841 duplicated gene pairs in the Drosophila melanogaster genome. They observed that K a /K s values were significantly higher when both duplicates were located on the X than when one or both were located on an autosome. They eliminated the possibility that this could be caused by an excess of pseudogenes on the X by using only gene pairs with K a /K s smaller than 0.5 (if one of the two genes is constrained but the other is a pseudogene evolving neutrally, K a /K s has a minimum of 0.5). Although the possibility of an accelerated rate of divergence for X- linked genes by relaxation of negative selective pressure could not be rejected, this would require the unlikely condition that most of the deleterious mutations were dominant. Increased positive selection on recessive advantageous mutations seemed to provide the best explanation. To further explore this hypothesis, they followed this work with a second study in which they performed a population genetic analysis for some of their fast evolving duplicates, as well as others collected from the literature (Thornton and Long, 2005). By comparing levels of polymorphism and divergence, it is possible to detect positive and negative selection: under a purely neutral scenario, divergence is the consequence of the fixation of segregating mutations by drift, and the rate of divergence is proportional to the level of polymorphism. Sites under positive selection, on the other hand, will be quickly 44
55 swept through the population, and will not contribute significantly to polymorphism levels: this will cause an excess of fixed to segregating mutations. Sites under negative selection will have the opposite effect, as they are unlikely to be fixed but can segregate at low frequencies. This forms the basis of the McDonald-Kreitman test (McDonald and Kreitman, 1991), which uses synonymous variation as a neutral control to evaluate the selective forces acting on non-synonymous sites. Using a variant of this test, Thornton and Long (2005) detected a significant excess of amino-acid fixations for X-linked loci and a deficit of fixations for autosomal loci, giving further support to the hypothesis that more efficient positive selection on X-linked duplicates is causing them to diverge faster. Betancourt et al. (2002), on the other hand, evaluated K a and K s values in the D. melanogaster /D. simulans species pair for 51 X-linked and 202 autosomal loci, and detected no difference in K a /K s values between them. In fact, the average K a /K s value was higher for autosomal loci, though not significantly. An even larger sample was provided by the release of the Drosophila pseudoobscura genome (Richards et al., 2005). Although the X was the chromosome with the lowest fraction of alignable sequence with the D. melanogaster genome, which is pointed at by the authors as potential evidence for faster-x evolution, the values of K a and K s for alignable genes in this pair of species are actually similar for X-linked and autosomal loci. Finally, a large amount of work has been done on the evolution of proteins involved in male reproduction. Previous studies have suggested that sperm proteins are under strong positive selection (Torgerson, et al. 2002; Swanson et al. 2003). Furthermore, they are only expressed in males, which could enhance an existing faster-x effect (Charlesworth et al., 1987). Sperm proteins therefore provide the ideal sample to detect faster-x evolution. 45
56 Torgerson et al. (2003) analyzed the molecular evolution of 33 mammalian sperm proteins. They found that X-linked sperm proteins evolve significantly faster than autosomal ones. Other tissue-specific proteins did not display the same pattern Estimates of positive selection on the X chromosome and the autosomes Instead of simply looking at the average rates of evolution, another common approach has been to estimate the fraction of genes that are likely to have diverged under positive selection, to see if this proportion varies between the X and the autosomes. Results have been mixed: in an analysis of 12 different Drosophila genomes, the authors found that the set of genes that had been singled out as having been under positive selection was enriched for X-linked genes, but only marginally (Drosophila 12 Genomes Consortium, 2007). Combining polymorphism and divergence data is a more powerful method to detect selection, through derivations of the McDonald and Kreitman (MK) test (McDonald and Kreitman, 1991). Connallon (2007) examined divergence rates between D. melanogaster and D. simulans and compared them to polymorphism levels in D. melanogaster, and found no evidence for increased positive selection on the X. The recent sequencing of 6 lines of D. simulans has allowed for the first true population genomics study, and the first comparison of polymorphism and divergence for whole chromosomes (Begun et al., 2007). Although they found that the X chromosome was evolving faster, at both coding and non-coding sites, they could not find evidence for more positive selection at X-linked sites when they compared polymorphism and divergence (in fact, there was a significantly higher number of MK tests significant for positive selection for the autosomal genes). This study suffered from several drawbacks: the average cover 46
57 was actually only 3.9, and the alleles were sampled both from ancestral (African) and derived (cosmopolitan) populations, so that the results are likely to influenced by strong demographic effects, and need further investigation Paired comparisons The X chromosome can differ in its gene content from the autosomes. In Drosophila melanogaster, for instance, male-biased genes are rarely found on the X (Parisi et al., 2003). This could cause systematic biases in the mean sex-specificity of selection coefficients of X-linked and autosomal mutations. Since the value of K a /K s depends on the selection coefficients affecting the genes, variation in these coefficients could be masking an existing faster-x effect in some of the previous studies. If genes with similar functions have similar selection coefficients, then focusing on gene groups with related functions could expose a hidden faster-x evolution, as in the case of the sperm proteins. However, an even better approach would consist of studying the same group of genes in an autosomal and an X-linked context. Drosophila species vary both in the number and in the organisation of their chromosomes. It was, however, noted early on that chromosomal arms seemed to be homologous, as genes linked in one species also appeared to be linked in others, and all the described karyotypic differences could be explained by rearrangements of the six basic arms (Muller, 1940). Muller summarized the correspondence between the chromosomes of several species of Drosophila (Muller, 1940), and the chromosomal arms have become known as Muller s elements A to F. The comparative analysis of the Drosophila genomes has confirmed that, despite extensive within-arm rearrangements, only small fragments of 47
58 DNA have been translocated between arms (Richards et al, 2005, 12 Genome Consortium, 2007). After splitting from the D. melanogaster group, species in the D. pseudoobscura subgroup accumulated one rearrangement that has made them exceptionally useful for studying the evolution of the X chromosome: Muller s element D (the autosomal 3L arm of D. melanogaster) fused to the D. melanogaster X chromosome (element A) to form respectively the R and L arms of the D. pseudoobscura X (Figure 2.1). Therefore, whatever forces are shaping the evolution of the X chromosome should also be acting on this new R arm of the D. pseudoobscura X chromosome. Counterman et al. (2004) used a multi-species comparison to test for faster-x evolution, by examining whether a given set of genes evolves faster when it is located on the X, in the D. pseudoobscura subgroup, than it does when it is autosomal, in the D. melanogaster subgroup. First, they compared the K a /K s values of genes on the element D for D. pseudoobscura-d. melanogaster (the genes are autosomal in one species, but X- linked in the other) with D. simulans-d. melanogaster (where the genes are autosomal for both species). Consistent with the faster-x evolution predictions, they found a significant excess of genes with higher K a /K s for D. pseudoobcura-d. melanogaster. Their second approach was to use two pairs of species, D. melanogaster-d. simulans and D. pseudoobscura-d. miranda. D. miranda is a close relative of D. pseudoobscura and also shares the new XR (Muller, 1940). For 15 genes on the 3L-XR arm and 15 genes on the X-XL arm, they evaluated the K a /K s for each species pair and found that the percentage of genes with higher K a /K s in the D. pseudoobscura-d. miranda pair was higher, though not significantly, for 3L-XR genes. Thornton et al. (2006) and Musters et al. (2006) used the 48
59 same approach but increased the sample to over 200 DNA fragments for the four-species comparison (Thornton et al, 2006), and whole-genomes for the three-species comparisons (Musters et al., 2006; Thornton et al., 2006). Unlike Counterman et al. (2004), they found no evidence for faster-x evolution. The lack of statistical significance in the previous fourspecies comparisons could be due to the species pairs used; these show very low levels of divergence (about 4% for D. pseudoobscura/d. miranda synonymous sites in Bartolomé et al. s (2005) analysis of 32 genes). As such they may not be ideal for sequence comparisons, especially as some apparent differences may reflect polymorphisms within species (Bartolomé and Charlesworth, 2006). Similarly, the evidence for faster-x found in a whole genome comparison using D. melanogaster-d. simulans and D. pseudoobscura-d. persimilis (Singh, et al., 2008) should be interpreted with caution, as D. persimilis is even closer to D. pseudoobscura than D. miranda, and higher rates of evolution on the X could reflect higher levels of ancestral polymorphism on this chromosome, as is currently observed in African populations of D. melanogaster and D. simulans. 49
60 D. melanogaster D. simulans D. yakuba 3R 3L X D. affinis D. miranda D. pseudoobscura XL XR Figure 2.1: In Drosophila pseudoobscura and its sister species D. affinis and D. miranda, Muller s element D (the autosomal 3L arm in D. melanogaster) is fused to the X chromosome. 50
61 2.1.3 Our project Our project follows the rationale behind Counterman et al. s second approach (Counterman et al, 2004), with alterations to increase its statistical power. We use comparisons between more divergent pairs of species, as K a and K s estimates from very close species may be imprecise and are likely to be influenced by ancestral polymorphisms (Charlesworth, et al., 2005). D. yakuba is thought to have split from D. melanogaster over 12 million years ago (Tamura et al., 2004) and the synonymous divergence between them is about 29% (Zhang et al, 2004), making them ideal for K a and K s estimation. Genome sequences for both species have been released. In the pseudoobscura subgroup, we evaluated K a and K s for D. pseudoobscura/d. affinis, as these have similar levels of divergence as the previous pair (about 23% at synonymous sites in Bartolomé et al, 2005) and D. affinis shares the XR rearrangement with D. pseudoobscura (Muller, 1940). Our project used the following: -selecting 69 annotated genes from the 3L arm of D. melanogaster and 67 genes from other chromosomal arms (27 X-linked, and 40 autosomal) (49 of the genes came from Bartolomé et al., 2005 and Bartolomé and Charlesworth, 2006). -for each gene, identifying its orthologue in the genomes of D. yakuba and D. pseudoobscura. -using the D. pseudoobscura sequence to design primers, amplifying and sequencing the homologues in D. affinis (D. affinis gene sequences were available for the genes provided by C. Bartolomé). -estimating K a and K s for the species pairs D.melanogaster-D. yakuba and D. affinis-d. pseudoobscura. We expected to find no systematic difference for non-3l-xr genes, and 51
62 used these genes as our control. We could then test if genes on the 3L-XR arm showed an increased K a /K s in the D. affinis/d. pseudoobscura pair. 2.2 Materials and methods Selection of the genes D. melanogaster protein coding genes were downloaded from the Flybase website ( To avoid a possible influence of Hill-Robertson effects due to close linkage to genes under selection, they were all chosen from regions of normal recombination in D. melanogaster (cytological region 62A12-71A1 for the 3L arm and 3C3-15F3 for the X chromosome, as described in Charlesworth, 1996). For each gene, we recovered all the corresponding mrnas in the NCBI database with the Megablast algorithm ( and verified that they had a size between 1000 and 3000 base pairs, with at least 1000 base pairs without introns. We identified the D. yakuba homologue through the UCSC BLAT server ( and the D. pseudoobscura homologue through the NCBI Blast, and kept only genes whose location was syntenic for all three species D. affinis DNA extraction DNA was extracted from males of a D. affinis line originally from Nebraska (no ; Drosophila Species Resource Center), using a Qiagen DNA extraction kit (Qiagen House, Fleming Way, Crawley, West Sussex, RH10 9NQ, United Kingdom) Sequencing of the genes Primers were designed using the DNAstar package and the Primer3 software ( using the D. pseudoobscura 52
63 sequence to amplify bps of the gene in D. affinis (the list of primers used is given in Appendix A2.1). Additional internal primers were designed for sequencing. Since the D. affinis sequences of the 39 autosomal genes we used were provided by Carolina Bartolomé (Bartolomé, et al., 2005; Bartolomé & Charlesworth, 2006), all the genes we sequenced were on the D. affinis/d. pseudoobscura X chromosome (66 on the 3L-XR arm and 20 on the X-XL arm). PCR products were therefore directly sequenced on both strands using the BigDye (version 3) sequencing kit and run on an ABI 3730 Genetic Analyser (Applied Biosystems, Foster City, CA) by the sequencing service of the School of Biological Sciences, University of Edinburgh Evaluation of K a and K s All sequences were translated and virtual protein sequences were aligned with the European Bioinformatics Institute ClustalW interface ( The resulting alignment was used to align the DNA sequences with Tranalign ( which aligns coding DNA according to a protein alignment. The rates of synonymous (K s ) and non-synonymous (K a ) divergence were calculated using Nei and Gojobori s (1986) model of substitution (Nei & Gojobori, 1986), implemented in DnaSP version 4.50 (Rozas & Rozas, 1995; with the Jukes-Cantor correction for multiple hits. Since several models of substitution can lead to artifactual biases in K s when there are differences in codon usage bias (Bierne & Eyre-Walker, 2003), we also analysed the data using the Goldman and Yang (1994) model of substitution (using the PAML software package: 53
64 The list of all the genes analysed, and their respective K a, K s and K a /K s values, is given in Appendix A Codon usage The alignments obtained for the K a and K s analyses were used to estimate the frequency of optimal codons, Fop, with CodonW (Peden, 1997). We used the D. melanogaster table of preferred codons (Shields et al., 1988), as patterns of codon usage have been shown to be well conserved in Drosophila (Powell and Moriyama, 1997) Statistical analysis The descriptive statistics, Mann-Whitney tests and Wilcoxon signed rank tests were performed with the Statview software (version 4.5) Polymorphism Datasets We have used sequences published in two previous studies (Andolfatto, 2005; Shapiro et al., 2007) to compare polymorphism levels at X-linked and autosomal coding sites. Coding sequences for the X-linked loci were downloaded from Peter Andolfatto s website ( The autosomal sequences from Shapiro et al. (2007) were retrieved from the NCBI website ( by searching the nucleotide database for Shapiro AND adaptive Aligning the coding sequence The Andolfatto (2005) dataset consisted of 31 coding sequence files, each containing one sequence from D. simulans and 12 sequences from African populations of D. 54
65 melanogaster. We removed the D. simulans sequence and aligned the others with ClustalW (Chenna et al., 2003; ftp://ftp.ebi.ac.uk/pub/software/unix/tools/clustalw/). The Fasta file containing all the autosomal genes from Shapiro et al. (2007) included D. melanogaster African lines, but also non-african D. melanogaster and D. simulans sequences. Since we were interested in comparing X-linked and autosomal sequences from African D. melanogaster (as African populations for this species are thought to be closer to equilibrium than European or American populations (Haddrill et al., 2005)), a Perl script (described in Appendix A2.3) was used to discard all the sequences from cosmopolitan lines or other species, and create, for each gene, a file containing the African sequences. The protein sequence of each gene was retrieved from the Flybase batch download website ( The corresponding cdna was extracted from the African sequences using the Genewise software ( A second Perl script (see Appendix A2.3) extracted the cdna sequences from the Genewise output into a Fasta file, but only if the score of the alignment was larger than 100 (this value was chosen arbitrarily to remove non-specific alignments). If the initial and the final number of sequences for a gene were the same (suggesting non-specific alignments had been properly removed, and true alignments had not been lost), the sequences were aligned with ClustalW (376 genes). The other 36 genes were reprocessed by hand and then aligned with ClustalW Analysis The π A and π S values were obtained for all the alignments with DnaSP (Rozas and Rozas, 1995). We checked the alignments manually with Se-Al 55
66 ( and removed visible errors (these came mostly from intronic sequence being extracted as coding sequence by Genewise). The π A and π S values were re-evaluated for the 33 alignments that were changed. This did not alter our results. 56
67 2.3 Results Within-clade comparisons We obtained and aligned sequences for 69 3L-XR and 66 non-3l-xr genes (27 from the X-XL arm, 39 autosomal in both clades) in the D. melanogaster/d. yakuba and D. affinis/d. pseudoobscura pairs. The average K a, K s, and K a /K s values are shown in Table 2.1 and Figure 2.2 (the values for individual genes are given in Appendix A2.2). As a first analysis, we can compare K a, K s and K a /K s values between chromosomes within the two groups (D. melanogaster/d. yakuba and D. pseudoobscura/d. affinis). Overall, the mean values are in agreement with the faster-x predictions: K a /K s values are higher for X-linked chromosomal arms in both the D. pseudoobscura and D. melanogaster groups. Table 2.1: Average rates of evolution. The average K a /K s is the ratio of the averages of Ka and Ks. SE is the standard error. D. pseudoobscura/d. affinis D. melanogaster/d. yakuba K a K s K a /K s K a K s K a /K s 3L-XR (SE) (0.004) (0.008) (0.015) (0.003) (0.011) (0.01) Autosomal (SE) (0.003) (0.01) (0.013) (0.003) (0.015) (0.014) X-XL (SE) (0.007) (0.017) (0.019) (0.008) (0.023) (0.021) The average K a /K s is estimated from the ratio of the averages of K a and K s. SE is the standard error. 57

68 NS NS NS p< NS NS p<0.001 NS NS Figure 2.2: The mean and standard error of K a, K s and K a /K s for all classes of genes. On the X-axis, the Autosomal class includes all the genes that are autosomal in both groups. The D. pseudoobscura/d. affinis and D. melanogaster/d. yakuba values were compared using Wilcoxon Signed Rank tests, and the significant p-values are shown (NS stands for non significant). 58
69 It should however be noted that, whilst the higher K a /K s of the 3L-XR genes in the D. pseudoobscura group is in agreement with the faster-x hypothesis, these genes also exhibit particularly high K a /K s values in the D. melanogaster group when compared to the rest of the autosomes (Table 2.1 and Table 2.2). This is likely to be caused by a sampling bias, as most of the autosomal genes were previously sequenced by Carolina Bartolomé, and consisted of long, well studied, genes. These differ from the genes we selected (most of the 3L-XR sample), which correspond to small, unnamed (mostly unstudied) transcripts. Genes with no annotated function have been shown to be less constrained than genes with known functions (Drosophila 12 Genomes Consortium, 2007). Consistently, Mann-Whitney tests (Table 2.2) show that the autosomal sample does have significantly lower K a and lower K a /K s than the 3L-XR sample in both D. melanogaster-d. yakuba and D. pseudoobscura-d. affinis. Although these differences are not significant after correcting for multiple comparisons, they suggest that direct comparisons of K a and K s values between different chromosomal arms may not be reliable. This should, however, not affect the comparison of rates of evolution of the same chromosomal arm between the two clades, since we have the same set of genes in all the four species. 59
70 Table 2.2: Within-species comparisons show heterogeneity in our sample. The p-values were obtained with a two-tailed t-test. Significant values are in bold. Mann-Whitney test p-value D. pseudoobscura-d. affinis Ka Ks Ka/Ks 3L-XR, XL L-XR, auto X-XL, auto D. melanogaster-d. yakuba Ka Ks Ka/Ks 3L-XR, XL L-XR, auto X-XL, auto Significant p-values are denoted in bold Lower K s for X-linked genes Further examination of Table 2.1 and Figure 2.2 shows that the most striking pattern is the consistent reduction in K s for the 3L-XR genes in the Drosophila pseudoobscura group. A similar phenomenon was described by Lu and Wu (2005), who found that, in a humanchimpanzee comparison, X-linked genes had significantly lower K s values than autosomal genes. Two types of explanation have been put forward to account for this: -Neutral: In several species, a higher mutation rate in males than in females leads to a lower mutation rate on the X chromosome, because the X is transmitted by females 2 / 3 of the time, whereas autosomes are transmitted by females only ½ of the time (Miyata et al., 1987). 60
71 Whilst in mammals this effect appears to be solidly established (Ebersberger et al., 2002), no evidence has been found for such an effect in D. melanogaster, D. yakuba or D. pseudoobscura (Bauer and Aquadro, 1997, Richards et al., 2005). While a higher rate of substitution of silent mutations has been found on the neo-y chromosome of D. miranda compared with the neo-x, this can be accounted for by the fixation of ancestral polymorphisms on the neo-y, caused by its greatly reduced effective population size (Bartolomé and Charlesworth, 2006; Bachtrog, 2008). It therefore seems unlikely that a male-female mutation rate difference could account for our observations on K s. -Selective explanation: although synonymous substitutions are often used as a neutral control, there is ample evidence that synonymous codons appear in the genome at different frequencies, possibly because preferred codons increase the efficiency of translation (Powell and Moriyama, 1987). This selective pressure is stronger for highly expressed genes, and these do indeed show higher levels of codon usage bias (Duret and Mouchiroud, 1999). McVean and Charlesworth (1999) investigated, theoretically, the influence of X- chromosome linkage on codon bias and found that, if unpreferred codons are on average recessive in their effect on fitness, they will be selected out of the population more efficiently when they are on the X, thereby reducing the rate of X-linked synonymous evolution and increasing the level of codon bias of the X chromosome. Singh et al. (2005) estimated codon bias levels in D. melanogaster, D. pseudoobscura and Caenorhabditis elegans and found that, as expected, these were higher on the X chromosome in all three species. They excluded differences in expression as the cause of this, because their analysis of an EST dataset showed that, in D. melanogaster and C. elegans, the X has lower levels 61
72 of expression than the autosomes. Other factors that are correlated with codon usage bias, such as gene length, recombination rate, gene density, and protein evolution, were excluded as possible causes for the X-autosomes difference, suggesting that more efficient selection on the hemizygous male X is the main cause of increased codon usage bias on the X. More recently, the analysis of twelve Drosophila genomes confirmed that the X chromosome consistently harbours higher levels of codon usage bias (Drosophila 12 Genomes Consortium, 2007). We evaluated the frequency of preferred codons (Fop), a measure of codon usage bias, for all the genes in our sample (Table 2.3). Although X-XL genes have the highest levels of codon bias in each species, 3L-XR genes have similar levels of Fop as the autosomes in D. pseudoobscura and D. affinis. This might be simply reflecting a sampling bias, since in D. melanogaster and D. yakuba 3L genes have lower levels of Fop than other autosomal genes, which suggests that direct comparisons between different chromosomal arms are, once again, unreliable. More interesting insights come from the comparisons between the same chromosomal arm in the two clades. D. melanogaster is known to have experienced a reduction in codon usage bias, thought to be due to a reduction in effective population size resulting in less efficient selection on this lineage (Akashi, 1995, 1996). We find, in agreement with previous studies, that D. melanogaster has significantly reduced levels of codon usage for all the chromosomes compared to D. yakuba (not shown). We therefore used D. yakuba-d. pseudoobscura to compare the Fop values in the two clades (using D. yakuba-d.affinis yields similar results). Whilst Fop values are similar in the two groups for our control genes (Table 2.3), they are significantly higher for XR in D. pseudoobscura pair than for 3L in D. 62
73 yakuba (p < 0.001), consistent with the hypothesis that selection to maintain optimal codon usage is more efficient when loci are X-linked than when they are autosomal. Table 2.3: Average values of Fop (frequency of optimal codons) for 3L-XR, X-XL and autosomal genes. D. affinis D. pseudoobscura D. melanogaster D. yakuba 3L-XR (SE) (0.01) (0.01) (0.009) (0.009) p = X-XL (SE) (0.016) (0.015) (0.019) (0.015) p = Autosomes (SE) (0.017) (0.017) (0.019) (0.019) p = Bold values indicate X-linked genes. SE is the standard error. Since D. melanogaster has significantly reduced levels of codon usage bias for all the chromosomes compared to D. yakuba (not shown), we used D. yakuba- D. pseudoobscura to compare the Fop values in the two clades (using D. yakuba-d.affinis yields similar results). The p-values of the D. yakuba-d. pseudoobscura comparison were obtained using Wilcoxon Signed Rank Tests Higher K a /K s for 3L-XR genes in D. pseudoobscura/d. affinis The K a /K s values are in agreement with the faster-x hypothesis, as pointed out previously: whilst autosomal and X-linked loci have similar K a /K s values in D. melanogaster/d. yakuba and D. pseudoobscura/d. affinis, the mean K a /K s for 3L-XR genes is significantly higher in the D. pseudoobscura group, where they are X-linked, than in the 63
74 D. melanogaster group. However, this is mostly caused by the reduction in K s observed for this chromosomal arm in the D. pseudoobscura group. Since the corresponding K a values do not differ, this comparison does not support a faster-x effect due to more efficient positive selection at X-linked coding sites. Unfortunately, since we are not using any control for the neutral processes, such as differences in the mutation rate that could affect K a, this analysis is not conclusive Pairwise comparisons In order to test whether the behaviour of the 3L-XR genes is different from that of the control genes, we can, instead of looking at the average values, look at the proportion of genes that are evolving faster (genes that have higher K a /K s ) in the D. affinis/d. pseudoobscura pair than in D. melanogaster/d. yakuba. In the absence of a faster-x effect, this value will be similar for 3L-XR and non-3l-xr genes. If, on the other hand, there is faster-x evolution, this proportion will be higher for 3L-XR genes (and this prediction is easily testable with a Chi-square test). The values are presented in Table 2.4. Unlike previous observations, there is no detectable faster-x effect (although the proportion of genes with higher K a/ K s in the pseudoobscura group is slightly higher 70% versus 61% for 3L-XR genes, this is not significant, and the opposite is observed for the K a values). Once again, the decrease in K s for 3L-XR genes in D. pseudoobscura/d. affinis is the only significant pattern. Several models of substitution can lead to an artifactual negative correlation between codon usage bias and K s (Bierne and Eyre-Walker, 2003), which could account for our reduction in K s for X-linked genes, as these also have (slightly) increased codon usage bias. 64
75 The Goldman-Yang (1994) model of substitution, implemented in the PAML package, can be used to bypass this issue. We repeated the analysis using D N and D S, estimated with the Goldman and Yang (1994) model of substitution. Although the results differ numerically, the reduction in synonymous divergence observed for X-linked genes remains significant when we use D S instead of K s (Table 2.4). This is still observable when we use four-fold degenerate sites (D 4 in Table 2.4), but the pattern is not significant. Table 2.4: Proportion of genes with higher rates of evolution (K a, K s or K a /K s, D N, D S, D N /D S or D 4 ) in the D. pseudoobscura/d. affinis pair. The p value was obtained with a Fisher exact test. Proportion of genes evolving faster in D. pseudoobscura/d. affinis 3L-XR Control p K a 54% 59% 0.38 K s 19% 45% K a /K s 70% 61% 0.45 D N 54% 56% 0.86 D S 35% 61% D N /D S 65% 55% 0.37 D 4 40% 52% 0.23 One of the drawbacks of this Chi-square comparison is that it does not take into account the magnitude of the differences between the two clades. We used a second method to perform 65
76 this pairwise comparison. Using the average K a, K s and K a /K s for the two clades, we calculated : # Z = K a (pse " 3L " XR) & % ( $ K a (mel " 3L " XR) ' # K a (pse " auto) & % ( $ K a (mel " auto) ' A Z value larger than 1 reflects faster-x evolution, whereas slower-x evolution would lead to Z being lower than 1. We bootstrapped the data to derive a confidence interval for the above statistic in order to test the significance of observed patterns. Although the values of Z in the table below confirm the patterns that we observed previously (faster-x evolution, when we look at K a, D N, K a /K s and D N /D S, but lower K s and D S for X-linked genes), only the decreased Ks for 3L-XR genes in D. pseudoobscura/d. affinis is significant. Table 2.5: Z-values for K a, K s, k a /K s, D N, D S, D N /D S and D 4. CI 05, CI 95, CI 01 and CI 99 are the 5%, 95%, 1% and 99% values of the confidence intervals obtained by bootstrapping the data. Z CI 05 CI 95 CI 01 CI 99 K a K s K a /K s D N D S D N /D S D
77 We can also test whether the lower K s on the D. pseudoobscura/d. affinis 3L-XR arm is accompanied by an increase in codon usage bias by estimating the proportion of genes that have higher Fop values in the D. pseudoobscura group for 3L-XR and control genes, and testing if it differs (Table 2.5). Although there is a higher proportion of 3L-XR genes than control genes that have a higher Fop in the pseudoobscura group (68% versus 55%), this trend is not significant. Singh et al. (2005) followed the same approach using the whole chromosome arms and found a significant increase in codon bias for XR genes compared to their autosomal counterpart, suggesting that increased selection on codon usage at X-linked sites is indeed the cause of this reduction in K s. Table 2.5: Number of genes that show higher frequencies of preferred codons (Fop) in the pseudoobscura and melanogaster groups. To evaluate this, we used, for each gene, the mean Fop of D. affinis and D. pseudoobscura (PA) and D. melanogaster and D. yakuba (MY). The p-value was obtained with a two-tailed Fisher exact test. Number of genes with higher Fop in: PA MY Total 3L-XR Control (X+A) p-value Is there any evidence for faster-x effect in fast evolving genes? Many factors could be causing this absence of faster-x evolution: it is possible that most beneficial mutations are not partially recessive or that beneficial alleles are fixed in 67
78 Drosophila from the array of standing variation (Thornton et al., 2006; Betancourt et al., 2004). A slower-x evolution is also expected if most fixed mutations are either neutral or slightly deleterious (Charlesworth et al., 1987). If a higher K a /K s reflects at least partially the action of stronger positive selection, then genes with high K a /K s will be the ones prone to faster-x evolution. Genes with low K a /K s, on the other hand, will be expected to have a slower-x evolution. To test for this we divided our sample into fast, medium and slow evolving genes in the following way: we ordered our 3L-XR genes according to their K a /K s in the D. melanogaster/d. yakuba pair and classified the first 23 as slow-evolving genes, the next 23 as medium, and the last 23 as fast-evolving genes. We then repeated the analysis for these three classes, using as a control the non-3l-xr genes that had K a /K s values, in D. melanogaster/d. yakuba, in the same range as the 3L-XR genes. The resulting sample contains 39 fast evolving genes (23 3L-XR, 16 non-3l-xr), 46 medium (23 3L-XR, 23 non-3l-xr) and 50 slow evolving genes (23 3L-XR, 27 non 3L-XR). The proportion of genes with higher K a, K s and K a /K s in the D. affinis/d. pseudoobscura pair is shown in Table 2.6 (the detailed number of genes for each class is given in Appendix A2.4). Although our sample size is now drastically reduced, the proportion of genes evolving faster in the D. affinis/d. pseudoobscura pair is behaving in the predicted direction (for K a /K s values): for fast evolving genes, only 44% of the non-3l-xr loci are evolving faster in D. affinis/d. pseudoobscura, compared with 61% of the 3L-XR loci, which is in agreement with the faster-x hypothesis. Slow-evolving genes, on the other hand, do indeed show a moderate slower-x effect (70% of 3L-XR genes evolving faster in the pseudoobscura group, versus 78% for the control genes). 68
79 Table 2.6: Proportion of slow and fast evolving genes with increased K a /K s, K a and K s in the D. affinis/d. pseudoobscura pair. Ka/Ks 3L-XR Non-3L-XR Fast (p=0.34) 61% 44% Medium (p=0.12) 78% 52% Slow (p=0.2) 70% 78% Ka 3L-XR Non-3L-XR Fast (p=0.52) 52% 38% Medium (p=0.77) 48% 57% Slow (p=0.11) 61% 74% Ks 3L-XR Non-3L-XR Fast (p=0.006) 17% 63% Medium (p=0.33) 22% 39% Slow (p=0.07) 17% 41% The p-values were obtained using two-tailed Fisher tests. This trend is partially caused by differences in K s (3L-XR fast evolving genes have the strongest K s reduction in the D. pseudoobscura group), but the values for K a are also consistent with the faster-x hypothesis. For fast evolving genes, the 3L-XR arm has a higher proportion of genes with higher K a in the D. pseudoobscura group than the control. For slow evolving genes, we observe the opposite. Although they are not conclusive, these results are of interest in view of the contradictory results obtained by previous studies on faster-x evolution, as they suggest that such an effect can only be observed for genes that are under particularly strong positive 69
80 selection and / or relaxed negative selection. In fact, most of the studies that detected faster- X evolution in Drosophila were in some way biased towards fast evolving genes. Counterman et al. (2004) obtained part of their sample from a male-specific EST screen (Swanson et al. 2001). Male-specific genes are not only expected to show an enhanced faster-x evolution, but it has also been claimed that they evolve faster than non-sex-biased genes in Drosophila, possibly as a consequence of increased positive selection (Zhang et al. 2004). Consistent with this, several studies of male-biased or male reproductive genes have detected faster rates of evolution on the X (Torgerson, 2003; Wang, 2004). Thornton et al. (2006), whilst following a similar approach, chose their genes randomly, and observed no effect. Although K a /K s values were significantly higher for X-linked duplicates in Thornton and Lang s study (2002), one of their results was puzzling: according to the faster-x hypothesis, the average K a /K s should be highest when both duplicates are on the X, lowest when they are both autosomal and intermediate when one gene is X-linked and its pair autosomal. In fact, the values are similar for X-linked/autosomal and autosomal/autosomal pairs (0.26 and 0.27, respectively). They suggest this occurs because the direction of duplication is not random: there is an excess of duplications from the X onto the autosomes (Betran, 2002). Therefore, for most X-linked/autosomal pairs, the gene on the X is the ancestral one. In a pair of newly duplicated genes, for the newborn duplicate to acquire a new function, the ancestral gene has to maintain its original function: only the new gene is expected to show increased rates of evolution. The value of K a /K s does not depend on whether the ancestral gene is on the X or on an autosome, reinforcing the idea that faster X evolution can only be detected for genes under strong positive selection (or weaker negative selection). 70
81 2.4 Discussion Is selection more efficient on the X chromosome? We have obtained several lines of evidence that suggest that selection is more efficient at X-linked loci than at autosomal loci: -X-linked genes have, on average, higher Fop values, and lower K s. Whilst neutral processes could explain both the lower K s (if mutation was lower on the X, which seems unlikely in Drosophila) and the higher Fop values (if these are caused by an increase in GC content), more efficient selection against unpreferred codons can account for both (McVean and Charlesworth, 1999). -Overall, 3L-XR genes do not differ from our control genes as far as K a values are concerned. However, a closer look at the data shows that fast-evolving genes appear to have higher K a in D. pseudoobscura/d. affinis, where they are X-linked, than in D. melanogaster/d. yakuba, whereas slow-evolving genes show the opposite pattern (Table 2.6). Whilst these patterns are not significant, they are in the expected direction, if selection is indeed more efficient on the X. Our discussion has focused mostly on the faster-x hypothesis, the idea that partially or completely recessive mutations on the X will be instantly expressed in the haploid males and therefore more efficiently selected than autosomal ones. However, another factor that could cause selection to be more efficient on the X is a difference in effective population size at X-linked loci. Below, we discuss why this could occur and how it would affect the evolution of the X chromosome. 71
82 2.4.2 The effective population size of the X chromosome and the autosomes The proportion of neutral mutations and mutations under selection was the subject of heated discussions for decades in evolutionary biology (Nei, 2006). Ohta (1973) showed that the behaviour of mutations depends not only on their selection coefficient s, but also on the effective population size (N e ) since, when N e s < 1, their fate is mostly controlled by drift and they behave as effectively neutral mutations. Therefore differences in X-linked and autosomal population sizes could, in principle, also explain the more efficient selection observed at X-linked sites. Males have only one copy of the X chromosome. This implies that, all other things being equal, the effective population size of the X chromosome is only ¾ of the autosomal population size, and selection is expected to be less efficient at X-linked sites (Hedrick, 2007). However, it has been shown that differences in male and female reproduction variance can distort this ratio (Charlesworth, 2001; Laporte and Charlesworth, 2002). If, for instance, males have a high variance in reproductive success, only a small proportion will contribute to the next generation, and therefore the male effective population will be smaller than the female population. Since 2 / 3 of the X chromosomes are in females (assuming equal sex ratio), their effective population size will be less affected by the reduction in male N e than the autosomal N e. If the difference between male and female variance is large enough, this can result in a higher effective population size for the X than the autosomes. Higher female than male reproductive variance results in an N e ratio lower than 3/4. 72
83 One way to assess if the effective population size of the X chromosome is higher or lower than the autosomal one is to compare neutral polymorphism at X-linked and autosomal sites, since neutral polymorphism levels are proportional to the effective population size (π, the pairwise average divergence, is equal to 4N e µ, where µ is the neutral mutation rate). Whilst not being strictly neutral (see previous section on codon usage bias), synonymous sites have been shown to be under lower selective constraints than either nonsynonymous or non-coding sites in Drosophila species (a large proportion of the latter is probably involved in transcription regulation (Halligan and Keightley, 2006; Begun et al., 2007)). We have compared X-linked and autosomal synonymous polymorphism data from African populations of D. melanogaster collected by Andolfatto (2005) and Shapiro et al. (2007) (Table 2.7). At first glance, differences in N e seem to account for the increase in selection efficiency at X-linked sites, since, at synonymous sites, π X is much higher than π A. A similar result was recently described by Hutter et al. (2007), who found that, in African populations of D. melanogaster, X-linked sites have higher levels of non-coding polymorphism than autosomal sites. 73
84 Table 2.7: Synonymous polymorphism at X-linked and autosomal genes (data from Shapiro et al., 2007 and Andolfatto, 2006). N Average π s Standard deviation t-test P-value Mean recombination rate (cm/mbp) X NA Autosomes Autosomes (high recombination only) Autosomal genes were classified as being in a region of high recombination when the estimate of the recombination was equal or larger than 3.08, the smallest value for the X-linked genes. The p-values refer to the comparison of diversity levels between X-linked and autosomal loci. One caveat of our comparison, however, is that Andolfatto (2005) focused his sampling efforts on regions of high recombination of the X chromosome, whereas Shapiro et al. (2007) aimed for a more homogeneous coverage of mostly the third chromosome. Since low recombination can also decrease neutral polymorphism levels (see next section), we had to verify that the difference between the X chromosome and the autosomes was not due to higher levels of recombination. We used Singh and Lipatov s online recombination estimator ( to obtain recombination rates for all our loci, and plotted π s as a function of recombination rate for each locus (Figure 2.3). Figure 2.3 clearly shows that our X-linked sample consists of high recombination loci, and that, when we focus on regions of high recombination only (lower panel), synonymous polymorphism levels are more similar in our two samples (the effect of linkage was not completely eliminated, as the mean recombination rate was still higher for X-linked genes than for high recombination autosomal genes). We can therefore not exclude the possibility 74
85 that higher recombination at the X-linked loci is the cause of the observed higher synonymous polymorphism levels. In Hutter et al. (2007), recombination rates for X-linked and autosomal loci were estimated and found to have very similar means. Consistent with this, silent polymorphism seems to be, overall, higher at X-linked sites for all recombination levels (Figure 2.4, upper panel). When we use Singh et al. s (2005) estimates of recombination rates, however, this effect disappears (Figure 2.4, lower panel), and we cannot exclude differences in recombination as the cause of the increased polymorphism levels in their sample. How, then, can we explain that this effect has been observed repeatedly in African populations of D. melanogaster (Andolfatto, 2001; Kauer et al, 2002, Mousset and Derome, 2004)? One possibility is that higher rates of recombination on the X, and not just demographic history, are causing the increase in the effective population size of the X chromosome Is there a higher recombination rate on the Drosophila X? The effective population size was defined as the population size that would be required for the same amount of genetic diversity to be accumulated by drift as in the observed population, under an ideal random mating model (Wright, 1931). Reduced recombination can increase this amount, by dragging linked variation to fixation when beneficial mutations are swept to fixation, or by removing variation linked to deleterious mutations. This is thought to account for the observation, in several species, that recombination rates and neutral polymorphism levels are positively correlated (Betancourt and Presgraves, 2002). We therefore expect the effective population size, and the efficiency of selection, to be higher for chromosomes with higher rates of recombination. 75
86 Figure 2.3: The data from Shapiro et al. and Andolfatto was used to compare synonymous average pairwise diversity (π s ) at X-linked and autosomal loci for all loci (upper panel) and high recombination regions only (lower panel). 76
87 Figure 2.4: Non-coding polymorphism levels (π) at X-linked and autosomal loci, from Hutter et al. (2007), using the recombination estimates they provided (upper panel) and the estimates of Singh et al. (2005, lower panel). 77
88 In Drosophila, recombination only occurs in females. Since the X chromosome is transmitted 2 / 3 of the time by females, as opposed to only 1 / 2 of the time for autosomes, it is expected to have higher recombination levels than the autosomes ( 4 / 3 as high). Connallon (2007) analysed rates of evolution at X-linked sites in order to test the faster-x hypothesis. For this purpose, he used several methods to estimate the average rates of recombination at X-linked and autosomal sites and found a much lower value for the autosomes with all the methods (the A:X ratio estimates ranged from 0.45 to 0.66). Bachtrog and Andolfatto (2006) analysed linkage disequilibrium in D. miranda, a sister species of D. pseudoobscura, and found a similar effect, with autosomes harbouring higher levels of linkage disequilibrium, compatible with a lower recombination rate, than the X chromosome. Ortiz-Barrientos et al. (2006) estimated mean rates of recombination for the two X-linked chromosomal arms and two autosomal arms in D. pseudoobscura and obtained similar results (121kb/cM and 105kb/cM for the X-linked arms, versus 148kb/cM and 232kb/cM for the autosomal arms, where kb/cm represents kilobases per centimorgan). This higher rate of recombination on the X is therefore not specific to D. melanogaster, and is likely to be contributing to the differences we observe between X and autosomal rates of evolution and codon usage bias. The extent to which this occurs will become clearer once more precise estimates of recombination rates on the D. pseudoobscura X become available The dominance coefficient of new mutations Whilst a large amount of research has been dedicated to the estimation of the mean dominance coefficient of deleterious mutations, the dominance level of beneficial 78
89 mutations remains elusive. Anecdotal evidence from resistance genes in plants has mostly supported the dominance of beneficial mutations, whereas in insects there is less consistency (Bourguet and Raymond, 1998; Kacser and Burns, 1981). Furthermore, the hypothesis that new beneficial mutations are on average partially recessive is somewhat counterintuitive, as some of these are likely to confer a gain of function. However, the only systematic analysis of the dominance of beneficial mutations comes from mutationaccumulation studies in Saccharomyces cerevisiae and does not support this (Zeyl et al., 2003; Anderson et al., 2004). Since S. cerevisiae can exist in both a haploid and diploid state, it is an excellent model to estimate dominance coefficients of artificially selected beneficial mutations: recessive mutations do not affect diploid fitness, whereas dominant mutations have the same effect on both haploid and heterozygous fitness (intermediary dominant coefficients cause a larger increase of haploid fitness than diploid fitness). These studies show that selection on diploids leads to the accumulation of partially dominant beneficial mutations (which is expected, since in diploids recessive mutations are more often lost by drift). Selection on haploids, on the other hand, leads to the accumulation of more recessive mutations: one study found that 17 out of 29 mutations accumulated were recessive (59%) (Anderson et al., 2004), the other estimated that the mean dominance coefficient of the beneficial mutations fixed in a haploid population was 0.25 (Zeyl et al., 2003), suggesting that, in yeast, beneficial mutations are on average partially recessive. It is possible that this is also the case in multi-cellular organisms and that the observed beneficial mutations are dominant because they were selected in diploids. 79
90 Comparisons of rates of evolution at X-linked and autosomal sites offer a promising approach to this problem, as predictions differ depending on the dominance coefficient of new beneficial mutations (Charlesworth et al., 1987). Two recent studies on faster-x evolution have concluded that new beneficial mutations were likely to be, on average, partially dominant (Thornton et al., 2006; Connallon, 2007). This conclusion was derived from the fact that no detectable difference in adaptive rates of evolution was found between the X and the autosomes. Our results differ slightly from Connallon s (2007) and support the view that, whilst it is possible that there is more efficient positive selection at X-linked loci, this is only detectable for genes which evolve predominantly under positive selection or are under weak negative selection (further support for this comes from studies of X- linked reproductive or sex-biased genes that consistently find a faster-x effect). This is not incompatible with dominant mutations, if an increased rate of recombination is sufficient to account for the faster-x effect. 2.5 Conclusions By using a multi-species model, we were able to examine directly the consequences being on the X chromosome on the evolution of coding sequence. Our main result was an increase in codon usage bias on the 3L-XR arm (and decrease in synonymous divergence) in D. pseudoobscura/d. affinis, possibly due to more efficient selection against unpreferred codons at X-linked loci. We did not observe a significant increase in K a for X-linked sites. K a /K s values were significantly higher, but this effect comes mostly from differences in K s. In fast-evolving genes, there seemed to be an increase in K a at X-linked loci, and the opposite was observed 80
91 for slow-evolving genes (though none of these patterns were significant). This suggests that further studies on faster-x evolution should focus on fast-evolving genes. 2.6 References Akashi H. Inferring weak selection from patterns of polymorphism and divergence at "silent" sites in Drosophila DNA. Genetics 139: , 1995 Akashi, H. Molecular evolution between Drosophila melanogaster and D. simulans: reduced codon bias, faster rates of amino acid substitution, and larger proteins in D. melanogaster. Genetics, 144: , 1996 Anderson, J.B., Sirjusingh, C., Ricker, N. Haploidy, Diploidy and Evolution of Antifungal Drug Resistance in Saccharomyces cerevisiae. Genetics, 168 : , 2004 Andolfatto, P. Adaptive evolution of non-coding DNA in Drosophila. Nature, 437: , 2005 Andolfatto, P. Hitchhiking effects of recurrent beneficial amino acid substitutions in the Drosophila melanogaster genome. Genome Res. 17: , 2007 Bachtrog, D. and Andolfatto, P. Selection, Recombination and Demographic History in Drosophila miranda. Genetics, 174(4): , 2006 Bachtrog, D. Evidence for Male-Driven Evolution in Drosophila. Molecular Biology and Evolution, 25(4): , 2008 Bartolomé, C., Maside, X., Yi, S., Grant, A.L., Charlesworth, B. Patterns of Selection on Synonymous and Nonsynonymous Variants in Drosophila miranda. Genetics 169: ,
92 Bartolomé, C., Charlesworth, B. Evolution of Amino-Acid Sequences and Codon Usage on the Drosophila miranda Neo-Sex Chromosomes. Genetics 174(4): , 2006 Bauer, V.L., Aquadro, C.F. Rates of DNA sequence evolution are not sex-biased in Drosophila melanogaster and D. simulans. Mol. Biol. Evol. 14: , 1997 Begun, D.J., Holloway, A.K., Stevens, K., Hillier, L.W., Poh, Y.P., et al. Population Genomics: Whole-Genome Analysis of Polymorphism and Divergence in Drosophila simulans. PLoS Biology. 5(11): e310, 2007 Betancourt, A.J., and Presgraves, D.C. Linkage limits the power of natural selection in Drosophila. Linkage limits the power of natural selection in Drosophila. Proc Natl Acad Sci USA, 99: , 2002 Betancourt, A.J., Presgraves, D.C. Swanson, W.J. A Test for Faster X Evolution in Drosophila. Mol. Biol. Evol. 19(10) : , 2002 Betancourt, A.J., Kim, Y., Orr, H.A. A Pseudohitchhiking Model of X vs. Autosomal Diversity. Genetics, 168: , 2004 Betrán, E., Thornton, K., Long M. Retroposed New Genes Out of the X in Drosophila. Genome Res. 12: , Bierne N., Eyre-Walker, A. The Genomic Rate of Adaptive Amino Acid Substitution in Drosophila. Mol. Biol. Evol. 21: , 2004 Bourguet, D. and Raymond, M. The molecular basis of dominance relationships: the case of some recent adaptive genes. Journal of Evolutionary Biology, 11 (1): ,
93 Charlesworth, B., Coyne, J.A., Barton, N.H. The relative rates of evolution of sex chromosomes and autosomes. The American Naturalist, 130(1): , 1987 Charlesworth, B. Background selection and patterns of genetic diversity in Drosophila melanogaster. Genet Res., 68(2):131-49, 1996 Charlesworth, B. The effect of life-history and mode of inheritance on neutral genetic variability. Genet Res., 77(2):153-66, 2001 Charlesworth,B., Bartolomé,C., and Noël,V. The detection of shared and ancestral polymorphisms. Genet. Res. 86: , 2005 Connallon, T. Adaptive Protein Evolution of X-Linked and Autosomal Genes in Drosophila: Implications for faster-x Hypotheses. Molecular Biology and Evolution, 24(11): , 2007 Counterman, BA, Ortiz-Barrientos, D, Noor, MA. Using comparative genomic data to test for fast-x evolution. Evolution Int J Org Evolution 58(3): , 2004 Drosophila 12 Genomes Consortium. Evolution of genes and genomes on the Drosophila phylogeny. Nature 450, Duret, L. and Mouchiroud, D. Expression pattern and, surprisingly, gene length shape codon usage in Caenorhabditis, Drosophila, and Arabidopsis. PNAS, 96 (8): , 1999 Ebersberger, I., Metzler, D., Schwarz, C. & Paabo, S. Genomewide comparison of DNA sequences between humans and chimpanzees. Am. J. Hum. Genet. 70: , 2002 Eyre-Walker, A. The genomic rate of adaptive evolution. Trends Ecol Evol, 21(10): ,
94 Fay, J.C., Wyckoff, G.J., Wu, C.-I Positive and Negative Selection on the Human Genome. Genetics, 158: , 2001 Haddrill, P.R., Thornton, K.R., Charlesworth, B. and Andolfatto, P. Multilocus patterns of nucleotide variability and the demographic and selection history of Drosophila melanogaster populations. Genome Res. 15: , 2005 Halligan, D. L., Keightley, P. D. Ubiquitous selective constraints in the Drosophila genome revealed by a genome-wide interspecies comparison. Genome Research 16: , 2006 Hedrick, P.W. Sex: differences in mutation, recombination, selection, gene flow, and genetic drift. Evolution, 61(12): , 2007 Hurst, L. The Ka/Ks ratio: diagnosing the form of sequence evolution. Trends in Genetics. 18(9): , 2002 Hutter, S., H. Li, Beisswanger, S., De Lorenzo, D., Stephan, W. Distinctly different sex ratios in African and European populations of Drosophila melanogaster inferred from chromosome-wide SNP data. Genetics 177: , 2007 Kacser, H., Burns, J. A. The molecular basis of dominance. Genetics 97, , 1981 Kauer, M., Zangerl, B., Dieringer, D., Schlötterer, C. Chromosomal Patterns of Microsatellite Variability Contrast Sharply in African and Non-African Populations of Drosophila melanogaster. Genetics 160: , 2002 Kirkpatrick, M., Hall, D.W. Male-biased mutation, sex linkage, and the rate of adaptive evolution. Evolution Int J Org Evolution 58(2): , 2004 Laporte, V. and Charlesworth, B. Effective Population Size and Population Subdivision in Demographically Structured Populations. Genetics, 162: ,
95 Lu, J., Wu, C.-I. Weak selection revealed by the whole-genome comparison of the X chromosome and autosomes of human and chimpanzee. PNAS 102: , 2005 McDonald, J.H., Kreitman, M. Adaptive protein evolution at the Adh locus in Drosophila. Nature 351:652-54, 1991 McVean, G.A.T., and Charlesworth, B. A population genetic model for the evolution of synonymous codon usage: patterns and predictions. Genet. Res. 74: , 1999 Miyata, T., Hayashida, H., Kuma, K., Mitsuyasu, K., Yasunaga, T. Male-driven molecular evolution: a model and nucleotide sequence analysis. Cold Spring Harb Symp Quant Biol 52: 863-7, 1987 Mousset, S., Derome, N. Molecular polymorphism in Drosophila melanogaster and D. simulans: what have we learned from recent studies? Genetica 120(1-3): 79-86, 2004 Muller, H.J. Bearing of the Drosophila work on systematics. In: The New Systematics (J.S. Huxleys, ed.), pp Clarendon Press, Oxford, 1940 Musters, H., Huntley, M.A., Singh, R.S. A genomic comparison of faster-sex, faster-x, and faster-male evolution between Drosophila melanogaster and Drosophila pseudoobscura. J. Mol. Evol. 62: , 2006 Nei M. Selectionism and neutralism in molecular evolution. Mol Biol Evol 22: , 2005 Ohta, T. Slightly Deleterious Mutant Substitutions in Evolution. Nature 246, 96 98, 1973 Orr, H.A., Betancourt, A.J. Haldane's Sieve and Adaptation From the Standing Genetic Variation. Genetics 157: ,
96 Ortiz-Barrientos, D., Chang, A.S., Noor, M.A.F. A recombinational portrait of the Drosophila pseudoobscura genome. Genet. Res. Cambr. 87: 23 31, 2006 Parisi, M., et al. Paucity of genes on the Drosophila X chromosome showing male-biased expression. Science 299: , 2003 Powell, J.R. and Moriyama, E.N. Evolution of codon usage bias in Drosophila. Proc. Natl. Acad. Sci. 94: , 1997 Peden, J. CodonW Richards, S., Liu, Y, Bettencourt, B.R., Hradecky, P., et al. Comparative genome sequencing of Drosophila pseudoobscura: Chromosomal, gene, and cis-element evolution. Genome Res, 15: 1-18, 2005 Rozas, J., Rozas, R. DnaSP, DNA sequence polymorphism: an interactive program for estimating population genetics parameters from DNA sequence data. Comput. Appl. Biosci. 11: , 1995 Shapiro, J.A., Huang, W., Zhang, C., Hubisz, M.J., Lu, J., Turissini, D.A., Fang, S., Wang, H.Y., Hudson, R.R., Nielsen, R., Chen, Z. and Wu, C.I. Adaptive genic evolution in the Drosophila genomes. PNAS 104: , 2007 Shields, D.C., Sharp, P.M., Higgins, D.G., Wright, F. "Silent" sites in Drosophila genes are not neutral: evidence of selection among synonymous codons. Mol. Biol. Evol, 5: , 1988 Singh, N.D., Davis, J.C., Petrov, D.A. X-Linked Genes Evolve Higher Codon Bias in Drosophila and Caenorhabditis. Genetics, 171, , 2005 Singh, N.D., Larracuente, A.M., Clark, A.G. Contrasting the Efficacy of Selection on the X and Autosomes in Drosophila. Molecular Biology and Evolution. 25(2):
97 467, 2008 Smith, N.G., Eyre-Walker, A. Adaptive protein evolution in Drosophila. Nature 415(6875): , 2002 Studer, R.A., Penel, S., Duret, L., Robinson-Rechavi, M. Pervasive positive selection on duplicated and nonduplicated vertebrate protein coding genes. Genome Res., 18: , 2008 Swanson W.J., Clark, A.G., Waldrip-Dail, H.M., Wolfner, M.F., Aquadro, C.F. Evolutionary EST analysis identifies rapidly evolving male reproductive proteins in Drosophila. Proc. Natl. Acad. Sci. USA 98: , 2001 Swanson, W. J., Nielsen, R., Yang, Q. Pervasive adaptive evolution in mammalian fertilization proteins. Mol. Biol. Evol. 20:18 20, 2003 Tamura, K., Subramanian, S., Kumar, S. Temporal Patterns of Fruit Fly (Drosophila) Evolution Revealed by Mutation Clocks. Mol. Biol. Evol. 21: 36-44, 2004 Thornton, K, Long, M. Rapid Divergence of Gene Duplicates on the Drosophila melanogaster X Chromosome. Mol. Biol. Evol. 19(6): , 2002 Thornton, K., Long, M. Excess of Amino Acid Substitutions Relative to Polymorphism Between X-Linked Duplications in Drosophila melanogaster Mol. Biol. Evol. 22: , 2005 Thornton, K. R., Bachtrog, D., Andolfatto, P. X-chromosomes and autosomes evolve at similar rates in Drosophila - no evidence for faster-x protein evolution. Genome Research, 16: , 2006 Torgerson, D.G., Kulathinal, R.J., Singh, R.S. Mammalian sperm proteins are rapidly evolving: evidence of positive selection in functionally diverse genes. Mol. Biol. 87
98 Evol. 19: , 2002 Torgerson, D.G., Singh, R.S. Sex-Linked Mammalian Sperm Proteins Evolve Faster Than Autosomal Ones. Mol. Biol. Evol. 20: , 2003 Vicoso, B. and Charlesworth, B. Evolution on the X chromosome: unusual patterns and processes. Nat Rev Genet 7(8): , 2006 Wang, X. and Zhang, J. Rapid Evolution of Mammalian X-Linked Testis-Expressed Homeobox Genes. Genetics, 167(2): , 2004 Welch, J.J. Estimating the Genomewide Rate of Adaptive Protein Evolution in Drosophila. Genetics, 173(2): , Wright, S. Evolution in Mendelian populations. Genetics, 16: , 1931 Zeyl, C., Vanderford, T., Carter, M. An Evolutionary Advantage of Haploidy in Large Yeast Populations. Science 299 (5606): , 2003 Zhang, L., Li, W.-H. Human SNPs Reveal No Evidence of Frequent Positive Selection. Mol. Biol. Evol. 22: , 2005 Zhang, Z., Hambuch, T.M., Parsch J. Molecular Evolution of Sex-Biased Genes in Drosophila. Mol. Biol. Evol., 21: ,
99 Chapter 3: Effective population sizes and substitution rates of the X chromosome and the autosomes Abstract Current models of X-linked and autosomal evolutionary rates often assume that the effective population size of the X chromosome (N ex ) is equal to 3 / 4 of the autosomal population size (N ea ). However, polymorphism studies in D. melanogaster and D. simulans suggest that there are often significant deviations from this value. We have used a program to compute fixation rates of beneficial and deleterious mutations at X- linked and autosomal sites when this occurs. We find that N ex /N ea is a crucial parameter for the rates of evolution of X-linked sites compared to autosomal sites. We also tested different parameters that are known to influence the rates of evolution at X-linked and autosomal sites, such as different mutation rates in males and females and mutations that are sexually antagonistic, to determine which cases can lead to faster-x evolution. 89
100 3.1 Introduction As discussed in Chapter 2, Charlesworth et al. (1987) modelled rates of evolution on the X chromosome and the autosomes and showed that, under certain conditions, the X chromosome is expected to accumulate beneficial mutations at a higher rate than the autosomes. This happens because selection on recessive or partially recessive mutations is more efficient on the X, as the effect of these mutations is not masked by the ancestral allele in males (Charlesworth et al., 1987, Vicoso and Charlesworth, 2006). Another factor that affects the efficacy of selection is the effective population size (N e ), as in smaller populations a larger fraction of mutations fall within the zone of nearneutrality (Ohta, 1973). Since males have only one copy of the X chromosome, the effective population size of the X (N ex ) equals 3 / 4 of the autosomal effective population size (N ea ), when offspring number for both females and males follow a Poisson distribution, as assumed by Charlesworth et al. (1987). However, it has also been shown that differences in variance of reproductive success between males and females could invalidate this assumption (Caballero, 1995; Charlesworth, 2001; Laporte and Charlesworth, 2002). If male reproductive success has a higher variance than female reproductive success, then the male effective population size will be smaller than the female effective population size, as only a few males will effectively contribute to the next generations. Since the X chromosome only spends 1 / 3 of its time in males, N ex will be less affected by this reduction in male effective population size than N ea (as the autosomes spend ½ of the time in males). Consequently, N ex will be larger than ¾ of N ea. The opposite is expected if females have a higher variance of reproductive success than males. 90
101 In Drosophila, synonymous and silent polymorphism levels are not consistently lower on the X chromosome. In fact, in African populations of D. melanogaster, the pairwise diversity is higher on the X chromosome than on the autosomes, suggesting that N ex could be larger than N ea (Andolfatto, 2001; Kauer et al, 2002; reviewed in Mousset and Derome, 2004). It therefore seemed of interest to modify Charlesworth et al. s (1987) model, to examine the effects of variance in reproductive success on the rates of evolution of the X chromosome and the autosomes. It should be noted that non-african populations of D. melanogaster have lower polymorphism levels on the X chromosome than on the autosomes (Mousset and Derome, 2004). However, these populations are thought to have recently expanded from ancestral African populations. The bottlenecks and/or different selective pressures deriving from expanding into a new environment affect the diversity of the X chromosome and of the autosomes to different extents, so that these newly expanded populations are unlikely to represent the ancestral effective population sizes of the X and the autosomes (Mousset and Derome, 2004; Haddrill et al., 2005; Pool and Nielsen, 2007). A related question has been addressed by Singh et al. (2005) and Lu and Wu (2005), who examined the expected rates of synonymous evolution (Lu and Wu, 2005) and the expected levels of codon usage bias on the X chromosome (Singh et al., 2005) when the sex-ratio is biased; this can also increase N ex /N ea, if the sex-ratio is male-biased. However, the effect of varying N ex /N ea through other mechanisms has so far not been the focus of any work. We have written a FORTRAN program that extends the model of Charlesworth et al. (1987) to compare the rates of evolution at X-linked and autosomal sites under different scenarios for the variance in male and female reproductive success 91
102 (and consequent differences in N ex /N ea ). By varying the strength and direction of selection in males and females, we have produced a more exhaustive description of possible scenarios that can lead to faster-x (or slower-x) evolution. Finally, we have examined the effect of different mutation rates in males and females on the rates of evolution at X-linked and autosomal sites. This has been shown to occur in some organisms (Ebersberger et al., 2002; Axelsson et al., 2004), and can lead to different mutation rates on the X and the autosomes, as these spend different amounts of time in males and females (Miyata et al., 1987; reviewed in Vicoso and Charlesworth, 2006). Since the rate of neutral evolution is equal to the effective mutation rate, this difference will be reflected in the rates of neutral evolution at X-linked and autosomal sites. In mammals, for instance, males have higher mutation rates than females, possibly because the male germline undergoes more cell divisions to form gametes and this leads to lower rates of neutral rates of evolution at X-linked sites (Ebersberger et al., 2002, Taylor et al., 2005). Kirkpatrick and Hall (2004) investigated the effect of different mutation rates in males and females on the rates of fixation of mutations under positive selection, and how this affected faster-x evolution. They found that, when the rate of mutation was higher in males (and, consequently, so was the mutation rate on the autosomes), this could counteract the faster-x effect, whereas the opposite was expected, when the mutation rate was higher in females. We have extended this analysis to the fixation rate of deleterious mutations, as well as the normalized rates of evolution of beneficial mutations. 92
103 3.2 Methods The diffusion approximation The probability of fixation (U) of a beneficial mutation with an initial frequency p can be calculated by using the following approximation (Ewens, 2004): U( p) = p " 0 1 " 0 G(x)dx G(x)dx (3.1) where: % x M#y ( G(x) = exp '"2 $ dy* (3.2) & V#y ) M δx describes the expected change in frequency of an allele with frequency x and V δx is the variance of the change in frequency due to finite population size (we are considering the case of a biallelic locus, with alleles A 1 and A 2 at initial frequencies 1-x and x, respectively (Table 3.1). The equations for M δx are given below). U(p) is a double integral and cannot be solved analytically for all cases of interest. We have written a FORTRAN 77 program that estimates the probability of fixation of a new mutation numerically, for given values of s, the selection coefficient, h, the dominance coefficient, and N ea and N ex (More specific details on the program are given in Appendix A3.1). 0 93
104 Table 3.1: The fitness model used in our computations. A 1 is the ancestral allele, A 2 the new mutation, s m and s f are the selection coefficient in males and females, respectively, and h is the dominance coefficient of the new mutation. Autosomal case Females Males A 1 A 1 A 1 A 2 A 2 A 2 A 1 A 1 A 1 A 2 A 2 A hs f 1+s f 1 1+hs m 1+s m X-linked case Females Males A 1 A 1 A 1 A 2 A 2 A 2 A 1 A hs f 1+s f 1 1+s m Determining M δx Autosomal locus, with different selection coefficients for males (s m ) and females (s f ) We are using the same fitness model as Charlesworth et al. (1987, Table 3.1). The deterministic change in the frequency of a mutation is given in standard textbooks (e.g. Crow and Kimura, 1970; Ewens, 2004). For the autosomal case, when selection is weak, M"x = #x $ x(1% x) [ WA 2.%WA1. ] (3.3) where the marginal fitness of the new beneficial mutation is: WA 2.= x [ 1+ sf +1+ sm] + 1" x 2 2 and the marginal fitness of the ancestral allele is: WA1.= 1" x 2 [ 1+1] + x 1+ hsf +1+ hsm 2 [ 1+ hsf +1+ hsm] (3.4) [ ] (3.5) 94
105 If we replace the marginal fitnesses in Equation 3.3 by these formulae, we have: % "x # x(1$ x) x & ' 2 which can be simplified to: (2 + sf + sm) + 1$ x 2 (2 + h(sf + sm)) $ (1$ x + x 2 ( (2 + h(sf + sm)) ) * "x # x(1$ x)(sf + sm) [ x( 1$ 2h) + h] 2 (3.6) In the diffusion approximation, we use M δx /V δx. V δx is (Crow and Kimura, 1970; Ewens, 2004): V"x = x(1# x) 2NeA (3.7) for the autosomal case, we thus have: M"x V"x = NeA(sm + sf )[ x( 1# 2h) + h] (3.8) X-linked locus, with different selection coefficients for males and females Equation (3.3) can be adjusted to take into account the fact that the X chromosome spends 2 / 3 of the time in females, and 1 / 3 of the time in males. This time, we have, for the case of weak selection: M"x = #x $ x(1% x) 3 [ 2(W 2.f %W 1.f ) + (W 2.m %W 1.m) ] (3.9) where W 2. f and W 2. m are the marginal fitnesses of the new mutation in females and males, and W 1. f and W 1. m are the marginal fitnesses of the ancestral allele in females and males. If we replace them by: W 2.f =1+ (1" x)hsf + xhsf 95
106 W 2.m =1+ sm W 1.f =1+ xhsf W 1.m =1 we now have: "x # x(1$ x) 3 [ 2( 1+ (1$ x)hsf + xsf $1$ xhsf ) + (1+ sm $1) ] which can be simplified to give: "x # x(1$ x) 3 [ sf (2h + 2x(1$ 2h)) + sm] (3.10) V δx is: V"x = x(1# x) 2NeX (3.11) so that, for the X-linked case: M"x V"x = 2NeX 3 [ sf(2h + 2x(1# 2h)) + sm] (3.12) Accounting for the time spent by autosomes and the X chromosome in males and females We have adjusted the formulae to account for the fact that the X chromosome spends 2 / 3 of the time in females, whereas autosomes are only in females ½ of the time, by calculating the probabilities of fixation in males, U m, and females, U f, separately: Uf(pf) = pf " 0 1 " 0 G(x)dx G(x)dx (3.13) 96
107 And: Um( pm) = pm " 0 1 " 0 G(x)dx G(x)dx (3.14) where p m is the initial frequency of a mutation in males and p f its initial frequency in females. Following the approach of Charlesworth (1994), we have used p m A =N m /4, p fa =N f /4 f, p m X = =N m /3, p f X =N f /3, where N f and N m are the number of males and females in the breeding population, respectively Calculating the substitution rate We use the formulae of Charlesworth (1994) to calculate the rate of substitution of mutations under selection at X-linked and autosomal sites: KaA = (µ + "µ)[ NfUf + NmUm] (3.15) KaX = (µ + "µ)nfuf + µnmum (3.16) where µ and αµ are the female and male mutation rates, respectively (α is a constant). These are easier to interpret once they are normalized by dividing them by the neutral rate of substitution at X-linked (K sx ) and autosomal (K sa ) sites, as this is an approximation of the often used K a /K s. The neutral rate of substitution is simply the effective mutation rate that autosomes and the X-chromosome are subject to. In the case of autosomes, it is the average of the male and female mutation rates (αµ and µ), since autosomes spend half of their time in females and half of their time in males. In the case of the X-chromosome, this has to be adjusted to 97
108 KsX = ( 2µ + "µ) /3 (3.17) as the X chromosome spends 2/3 of the time in females and only 1/3 in males Modifying the effective population size Whilst silent polymorphism levels strongly suggest that N ex is larger than ¾ of N ea in D. melanogaster, the reasons for this deviation remain unclear (Mousset and Derome, 2004). Female-biased sex-ratio, population expansion, increased recombination on the X chromosome and increased male variance in number of offspring have all been suggested as possible causes (Andolfatto, 2001; Kauer et al, 2002; Mousset and Derome, 2004; Hutter et al., 2007). We focus on the last hypothesis, by estimating N ex and N ea, when the male variance in number of offspring (Vm) differs from the value expected with a Poisson distribution, as it is of interest to determine if this can cause deviations in N e X /N e A large enough to skew polymorphism levels on the X to higher levels than the autosomal ones, when biologically plausible scenarios are considered. It should however be noted that the results obtained with these values of N ex and N ea for the rates of evolution on the X and the autosomes apply when any of the above theories is considered, except for male-biased sex-ratio, as we are merely using differences in Vm to vary N e X /N e A without affecting the sex-ratio. Laporte and Charlesworth (2001) provided formulae to estimate the effective population size of the X chromosome and the autosomes, taking into account the variance of male and female reproductive success: 1 NeA " (1+ F) 4 % 1 & ' Nf + 1 Nm + (1# c)2 $Vf Nf + c 2 $Vm Nm ( ) * (3.18) 98
109 1 NeX " 1 % 4(1+ F) & ' Nf Nm + 4(1+ F)(1# c)2 $V f N f + 2c 2 $V ( m ) Nm * (3.19) where F is the inbreeding coefficient (we assume F=0), N m the number of males, N f the number of females, V m the variance in male reproductive success, V f the variance in female reproductive success. "V m and "Vf are the male and female deviations from a Poisson offspring number distribution and c is the proportion of males in the breeding population (c=n m /(N m +N f )). We have created a subroutine (EFFPOP) in our programs to estimate N ex and N ea, for given values of N m, N f, "V m and "Vf, using these formulae. The resulting values are then used in the diffusion approximations for the fixation probabilities (Equations (3.13) and (3.14)). The range of "V m and "Vf and the associated N ex /N ea that we used are shown in Figure 3.1. Although for lower values of "V m and "Vf (up to "V =20), increasing "V strongly affects N ex /N ea, increasing it further only causes a marginal change. 99
110 Figure 3.1: The ratio N e X /N e A can be altered by increasing the male (ΔV m ) and female (ΔV f ) deviations from the variance for the Poisson distribution of number of offspring. 100
111 3.3 Results The rate of fixation of beneficial mutations We can run our program with equal sex ratio (5000 males, 5000 females), equal selection on males and females (s f =s m, N e A s=1), and no non-random variance in male or female reproductive success (so that N e X =3N e A /4), to check that it yields the same results as those obtained by Charlesworth et al. (1987). The results presented in Figure 3.2 for this case are indeed consistent with those obtained with previous models, with the X chromosome accumulating more recessive or partially recessive beneficial mutations than the autosomes, but less dominant or partially dominant beneficial mutations. The ratio N e X /N e A can be increased, by increasing "V m, the male deviation from a Poisson distribution of offspring number, which represents sexual selection on males (Figure 3.1). This also reduces N e, the overall effective population size, which affects the rates of evolution, as more mutations fall within the zone of near neutrality. In order to focus only on the effect of modifying N e X /N e A, we scaled s to maintain a constant N e A s for all the values i of "V m studied, by using " si = s NeAi % $ ' # NeA 0& where N eai is N ea when "V m = i and N ea0 is N ea when "V m =0. When we use the same parameters as previously, but changing "V m to 1 (N e X =0.86N e A ), there is a faster-x effect even when mutations are slightly dominant (Figure 3.2). 101
112 Current estimates of neutral polymorphism in African populations of D. melanogaster and D. simulans suggest that N ex is, in fact, very similar to N ea (if anything, it seems to be slightly higher (Kauer et al., 2002; Andolfatto, 2001; Mousset and Derome, 2004)). We examine this case by using "V m =100 (N e X 1.1N e A, Figure 3.2). In this case, there is a faster-x effect for all levels of dominance of new mutations. 102
113 A B Figure 3.2: The normalized rate of adaptive evolution at X-linked and autosomal sites when N ex > 3 / 4 N ea. A/X is the ratio of autosomal to X-linked normalized rates of adaptive evolution (N=10000, s m =s f ). A) N e A s m =3; B) N e A s m =10) 103
114 We also computed the substitution rates for new beneficial mutations at X-linked and autosomal sites when N ex is smaller than 3N ea /4 (Figure 3.3). Unsurprisingly, in this scenario a faster-x effect can only be observed for more recessive mutations (h<0.4 in the case of N e X 0.65N e A ). Although this result may be of interest for other organisms, it is probably irrelevant to the discussion of Drosophila The rate of fixation of deleterious mutations We have once again tested our program by reproducing the results of Charlesworth et al. (1987) for the fixation of deleterious mutations when N e X =3N e A /4 (Figures 3.4 and 3.5). In this case, we focus on mutations that are nearly neutral (N e s=-1) or under weak negative selection (N e s=-3) as mutations under strong negative selection are expected to contribute very little to the overall rates of evolution, as they are effectively removed from the population (Kimura, 1983). The results are consistent with what was previously found: recessive or partially recessive mutations (h<0.5) accumulate more slowly on the X chromosome, whereas dominant or partially dominant mutations (h>0.5) accumulate faster on the X. When N ex >3N ea /4 (Figure 3.4), this scenario changes drastically, as there is a slower-x effect for most levels of dominance of new deleterious mutations. Furthermore, the amplitude of this phenomenon is much stronger than the faster-x effect observed for beneficial mutations, with, for the case of N ex =1.08N ea, the ratio of autosomal to X- linked rates of deleterious evolution exceeding 12 (when N e A s=-3). The opposite effect is observed when N ex <3N ea /4 (Figure 3.5). 104
115 A B Figure 3.3: The normalized rate of adaptive evolution at X-linked and autosomal sites when N ex < 3 / 4 N ea. N=10000, s m =s f. A) N e A s m =3; B) N e A s m =
116 A B Figure 3.4: The normalized rate of fixation of deleterious mutations at X-linked and autosomal sites when N ex > 3 / 4 N ea (s m =s f, N=10000). A) N e A s m =-1; B) N e A s m =
117 A B Figure 3.5: The normalized rate of fixation of deleterious mutations at X-linked and autosomal sites when N ex < 3 / 4 N ea (s m =s f, N=10000 ). A) N e A s m =-1; B) N e A s m =
118 3.3.3 Different mutation rates in males and females In some organisms, males and females have different mutation rates (αµ and µ, respectively), and this is reflected in the rates of evolution of X-linked and autosomal sites, as the time these spend in males and females differs (Miyata et al., 1987, Vicoso and Charlesworth, 2006). Kirkpatrick and Hall (2004) argued that a male-driven evolution (α>1) reduced faster-x evolution, whereas the opposite scenario (α<1) enhanced the faster-x effect to some extent. We have used our program to further investigate how α influences the rates of evolution at X-linked and autosomal loci, for both beneficial and deleterious mutations, when N ex differs from 3N ea /4. The first, surprising, result, is that both K ax /K sx and K aa /K sa are independent of α. In the case of K aa /K sa, this is easily explained, as, in our model, Equations (15) and (16) imply that: KaA KsA = (µ + "µ)[ NfUf + NmUm] NfUf + NmUm = (µ + "µ) /2 2 (3.20) In the case of K ax /K sx, if we write down the formulae for two different values of α (α 1 and α 2 ), it is easily shown that K a X /K s X (α 1 )=K a X /K s X (α 2 ) when α 1 and α 2 are equal, or when N f U f =N m U m. This last condition is always approximately satisfied in our results, even when N f is different from N m, and when we use different values of ΔV m and ΔV f (an example is shown in Table 3.2. The small differences observed in the table occur because these are numerical approximations; the demonstration is given in Appendix 3.2). This suggestion that the normalized rates of evolution are independent of α led us to focus on the effects of varying α on the non-normalized rates of evolution (K AA and 108
119 K AX ). In agreement with what was previously found, the faster-x effect is enhanced in female-driven evolution scenarios (α < 1) and somewhat counteracted in male-driven evolution scenarios (α > 1, Figure 3.6). A similar pattern occurs for deleterious mutations (Figure 3.7). 109
120 Table 3.2: An example of the approximate equality of N f U f and N m U m for all values of N m, N f, ΔV m and ΔV f in our computations of the fixation probabilities of new mutations on the X chromosome, When N ea s=10, N m =4000, N f =6000, ΔV m =ΔV f =0 h U m U m *N m U f U f *N f E E E E E E E E E E E E E E E E E E E E E E When N ea s=10, N m =4000, N f =6000, ΔV m =1, ΔV f =0 h U m U m *N m U f U f *N f E E E E E E E E E E E E E E E E E E E E E E
121 Figure 3.6: The (non-normalized) rate of fixation of beneficial mutations at X-linked and autosomal sites (s m =s f, N e A s m =10) when males and females have different mutation rates (in the figures, A=α). A) N e X = 3 / 4 N e A ; B) N e X =1.08N e A. 111
122 Figure 3.7: The (non-normalized) rate of fixation of deleterious mutations at X-linked and autosomal sites (s m =s f, N e A s m =-3) when males and females have different mutation rates (in the figures, A=α). A) N e X = 3 / 4 N e A ; B) N e X =1.08N e A. 112
123 3.3.4 The rate of fixation of sexually antagonistic mutations We can use our program to compare the rate of accumulation of sexually antagonistic mutations at X-linked and autosomal loci, as these are of great interest when studying the evolution of the X chromosome (see discussion). Predictions concerning their rates of substitution at X-linked and autosomal loci were made first by Rice (1984), but using a complex model, that required the evolution of expression inhibitors in the harmed sex before the mutation could be fixed in the population. Our model is simpler (Table 3.1), as it makes no assumptions about the evolution of expression modifiers, but the results are similar (Figures 3.8 and 3.9): the X chromosome accumulates an excess of recessive mutations that are beneficial for males and dominant mutations that are beneficial for females, and autosomes accumulate an excess of dominant mutations favourable to males and recessive mutations favourable to females. This is true when the benefit to the favoured sex is equal to the fitness loss in the harmed sex, when the overall benefit is larger than the loss of fitness, but also when the loss of fitness is larger than the benefit (Figures 3.8 and 3.9). By using a zero selection coefficient in one of the sexes, we can use our program to see how completely sex-specific genes are expected to evolve on the X and the autosomes. In the case of female-specific genes, the haploidy of the X chromosome in males is no longer a factor, and these genes are expected to evolve at the same rate as their autosomal counterparts (Figure 3.10). Male-specific genes, on the other hand, are subjected to an enhanced faster-x effect, consistent with Charlesworth et al. (1987). 113
124 Figure 3.8: The accumulation of sexually antagonistic mutations, when the advantage to the beneficiary sex is equal to the disadvantage to the harmed sex (N f =N m =5000, ΔV m =ΔV f =0). The dashed line (F) represents the case where a mutation is beneficial to females (s f =0.001) and detrimental to males (s m =-0.001). The continuous line (M) shows the opposite scenario (s f =-0.001, s m =0.001). 114
125 Figure 3.9: The accumulation of sexually antagonistic mutations, when A) the advantage to the beneficiary sex is stronger than the disadvantage to the harmed sex (The dashed line (F) represents the case where a mutation is beneficial to females (s f =0.002) and detrimental to males (s m =-0.001). The continuous line (M) represents the opposite scenario (s f =-0.001, s m =0.002)). B) the disadvantage to the harmed sex is stronger than the advantage to the beneficiary sex (F:s f =0.001, s m =-0.002; M:s f =-0.002, s m =0.001). In both A) and B), N f =N m =5000, and ΔV m =ΔV f =0. 115
126 Figure 3.10: The accumulation of sexually antagonistic mutations, when the mutation is advantageous in one of the sexes and neutral in the other (F: s f =0.001, s m =0.0; M: s f =0.0, s m =0.001), as in the case of sex-specific genes (N f =N m =5000, ΔV m =ΔV f =0). 116
127 3.4 Discussion The importance of estimating NeX/NeA The discussion on faster-x evolution has crucial implications, as it can provide clues to essential parameters of evolution, such as the mean dominance level of new beneficial and deleterious mutations. However, it has often been reduced to a question of faster-x/recessivity of new beneficial mutations versus absence of faster-x/dominance of new beneficial mutations. Our results highlight the need for more quantitative analyses, as under different conditions of N ea /N ex, faster-x evolution can occur even if new mutations are on average dominant. In African populations of Drosophila, non-coding polymorphism studies suggest similar population sizes for the X and the autosomes (Mousset and Derome, 2004), but this is rarely included in the discussion on faster-x evolution. It has been argued, for instance, that the overall dominance of new beneficial mutations could explain an absence of faster-x evolution. However, as figure 3.2 shows, this would not be a plausible explanation if Ne X =Ne A, and other factors must be involved, as, even when Ne X =0.98Ne A, there is a faster-x effect even when the mean dominance coefficient of new beneficial mutations is equal to 0.9. Figures 3.2 and 3.4 further show that the ratio N ex /N ea can have a stronger effect on faster-x evolution than the dominance coefficient, particularly in the case of the accumulation of deleterious mutations (Figure 3.4B). Although our results emphasize the extent to which differences in the effective population size of the X chromosome can affect the faster-x effect, some of the values of ΔV m that we have used to increase N ex /N ea seem too high to have any biological relevance in Drosophila, the organism that instigated this study. For instance, with equal 117
128 sex ratios, the Poisson expectation for variance in total offspring number for both females and males (V m and V m, respectively) is 2 (Laporte and Charlesworth, 2002). A ΔV m value of 100, as we used for N ex =1.1N ea, would therefore require extremely strong sexual selection. It is more likely that several factors are contributing to the high levels of polymorphism at X-linked versus autosomal sites in African populations of Drosophila. As discussed in the previous chapter, the Drosophila X chromosome is subject to more recombination than the autosomes, since Drosophila males do not recombine, and the X chromosome spends less time in males than the autosomes (Connallon, 2007). Higher recombination on the X decreases interference amongst sites under selection and therefore increases its effective population size. Hutter et al. (2007) also argued that biased sex ratios in African populations of D. melanogaster are contributing to this phenomenon. Whilst the exact extent to which each of these factors contribute remains to be determined, this should not affect our results, as we used ΔV m and ΔV m as tools to manipulate the effective population sizes, and not just to study the effect of reproductive success per se Different mutation rates in males and females The idea that different mutation rates in males and females could influence the evolutionary rates at X-linked and autosomal sites was examined by Miyata et al. (1987), who pointed out that male-driven evolution would lead to decreased rates of neutral evolution at X-linked sites. Kirkpatrick and Hall (2004) extended this analysis to sites under positive selection and noted that the faster rate of beneficial evolution expected on the X chromosome could be somewhat counteracted by this male-driven evolution. We 118
129 have used our numerical estimations to confirm this, and have applied the same approach to deleterious mutations, which are also expected to accumulate at lower rates on the X when evolution is male-driven than they would otherwise. Our results concerning K aa and K ax are consistent with those expectations. An important point that came out of our analysis, however, is that none of these patterns should affect K a /K s analyses, as, once the neutral rate of evolution is taken into account, the A/X ratio is independent of α. This occurs for all the scenarios tested (different numbers of males and females, and different variances of reproductive success). This result is of great interest, as different mutation rates in males and females have been put forward as an alternative to differences in selection efficiency to account for differences in K a /K s between the X and the autosomes. Differences in male and female mutation rates remain useful for non-synonymous rates of evolution, and to account for biological phenomena such as the large-x effect (Dobzhansky, 1936, Tao et al., 2003), but care should be taken when discussing X-chromosome molecular evolution, as this is often done in terms of K a /K s Sex-biased genes and faster-x evolution Although our analysis has focused on beneficial or deleterious mutations, mutations that have a beneficial effect in one sex but are deleterious for the other sex (antagonistic mutations) are also of interest when considering the evolution of the X chromosome. Rice (1984) modelled the accumulation of such mutations on the X chromosome and the autosomes, and found that, because recessive or partially recessive mutations are selected when in males, antagonistic mutations that are beneficial for 119
130 males are expected to accumulate faster on the X than on the autosomes when they are recessive or partially recessive, but faster on the autosomes when they are dominant. The opposite pattern is expected for antagonistic mutations favourable to females (Rice, 1984). In Rice s model (1984), a modifier of expression, which represses the gene expression in the harmed sex, is required for the mutation to be fixed in the population, leading to the creation of a sex-biased gene (a gene expressed mainly in one sex). Consequently, sex-biased genes are expected to accumulate at different rates on the X chromosome (Rice, 1984). This has been consistently observed in Drosophila, mammals and nematode (reviewed in Parsch and Ellegren, 2007). However, the biological soundness of Rice s (1984) model has been brought into question, as sex-biased genes often reflect an increase of expression in the beneficiary sex and not a decrease in the harmed sex (Connallon and Lacey-Knowles, 2005, and see next chapter). It is therefore of interest to investigate whether the same results are expected with our more straightforward model of the accumulation of genes with opposite fitness effects in males and females. Figures 3.8 and 3.9 show that a complex model involving expression modifiers for the fixation of sexually antagonistic mutations is not necessary to explain the different rates of accumulation of such mutations (and consequently of sex-biased genes) at X-linked and autosomal sites. The accumulation of sexually antagonistic mutations and sex-biased genes influences the molecular evolution of the X in two ways. If there are enough antagonistic mutations, and they accumulate faster on the X, this can enhance a faster-x effect. Inversely, if they accumulate more slowly on the X, they can counteract the faster-x 120
131 effect. Which of these actually occurs still remains to be determined, as no information is yet available about the levels of dominance of antagonistic mutations. Sex-biased genes have also been shown to have different rates of non-synonymous evolution. Male-biased genes, in particular, consistently show increased K a /K s compared to unbiased and female-biased genes (Parsch and Ellegren, 2007). Furthermore, as Charlesworth et al. (1987) pointed out and as shown in Figure 3.10, male-specific genes also experience an enhanced faster-x effect. The proportion of such male-biased and male-specific genes found on the X and the autosomes is therefore likely to influence the overall rates of evolution on the X and the autosomes. In Drosophila, for instance, the paucity of male-biased genes on the X (Parisi et al., 2004) could be one factor that makes it harder to detect faster-x evolution in this organism (Betancourt et al., 2002). Female-specific genes, on the other hand, do not experience faster-x evolution at all (Figure 3.10), and could perhaps provide an interesting control group for future studies on faster-x evolution. 3.5 Conclusions The molecular evolution of the X chromosomes and the autosomes has been the subject of much theoretical and empirical research, but the results are often inconsistent. One of the reasons for this is that many factors can influence the rates of evolution of these chromosomes, including their effective population size, their rate of mutation, and the proportion of mutations fixed by positive selection and drift, and these are hard to estimate and analyse together. We have written a program that evaluates the probability of fixation of new mutations, both beneficial and deleterious, as well as the rate of 121
132 substitution of such mutations, but allowing for different values of selection, effective population sizes, and mutation rates in males and females. Our results emphasize the need to consider all these parameters, and in particular the ones affecting N e X /N e A, as very different results are expected when there is a large deviation from N e X /N e A =3/ References Andolfatto, P. Contrasting Patterns of X-Linked and Autosomal Nucleotide Variation in Drosophila melanogaster and Drosophila simulans. Mol. Biol. Evol. 18: , 2001 Axelsson, E., Smith, N. G. C., Sundstrom, H., Berlin, S., Ellegren, H. Male-biased mutation rate and divergence in autosomal, Z-linked and W-linked introns of chicken and turkey. Mol. Biol. Evol. 21: , 2004 Betancourt, A.J., Presgraves, D.C. Swanson, W.J. A Test for Faster X Evolution in Drosophila. Mol. Biol. Evol. 19(10): , 2002 Caballero, A. On the effective size of populations with separate sexes, with particular reference to sex-linked genes. Genetics 139: , 1995 Charlesworth, B., Coyne, J. A., Barton, N. H. The relative rates of evolution of sexchromosomes and autosomes. Am. Nat. 130: , 1987 Charlesworth, B. The effect of background selection against deleterious mutations on weakly selected, linked variants. Genet Res, 63(3): , 1994 Charlesworth, B. The effect of life-history and mode of inheritance on neutral genetic variability. Genet. Res. 77: ,
133 Connallon, T., Knowles, L. L. Intergenomic conflict revealed by patterns of sex-biased gene expression. Trends Genet 21: 495-9, 2005 Connallon, T. Adaptive Protein Evolution of X-linked and Autosomal Genes in Drosophila: Implications for Faster-X Hypotheses. Mol. Biol. Evol., 24: , 2007 Crow, J.F., Kimura, M. (1970) An Introduction to Population Genetics Theory (Harper & Row, New york) Dobzhansky, T. Studies on hybrid sterility. II. Localization of sterility factors in Drosophila pseudoobscura hybrids. Genetics 21: , 1936 Ebersberger, I., Metzler, D., Schwarz, C., Paabo, S. Genomewide comparison of DNA sequences between humans and chimpanzees. Am J Hum Genet 70, (2002) Ewens, W. J., (2004) Mathematical Population Genetics. Second Revised Edition. (Springer-Verlag, New York) Fay, J.C., Wyckoff, G.J., Wu, C.-I Positive and Negative Selection on the Human Genome. Genetics 158: , 2001 Haddrill, P.R., Thornton, K.R., Charlesworth, B., Andolfatto, P. Multilocus patterns of nucleotide variability and the demographic and selection history of Drosophila melanogaster populations. Genome Res. 15(6): 790-9, 2005 Hutter, S., Li, H., Beisswanger, S., Lorenzo, D.D., Stephan, W. Distinctly Different Sex Ratios in African and European Populations of Drosophila melanogaster Inferred From Chromosomewide Single Nucleotide Polymorphism Data. Genetics 177: ,
134 Kauer, M., Zangerl, B., Dieringer, D., Schlötterer, C. Chromosomal Patterns of Microsatellite Variability Contrast Sharply in African and Non-African Populations of Drosophila melanogaster. Genetics 160: , 2002 Kimura, M. (1983) The neutral theory of molecular evolution (Cambridge University Press, Cambridge, New York) Kirkpatrick, M., Hall, D.W. Male-biased mutation, sex linkage, and the rate of adaptive evolution. Evolution Int J Org Evolution 58(2): , 2004 Laporte, V., B. Charlesworth, Effective population size and population subdivision in demographically structured populations. Genetics 162: , 2002 Lu, J., Wu, C.-I. Weak selection revealed by the whole-genome comparison of the X chromosome and autosomes of human and chimpanzee. PNAS 102: , 2005 Miyata, T., Hayashida, H., Kuma, K., Mitsuyasu, K., Yasunaga, T. Male-driven molecular evolution: a model and nucleotide sequence analysis. Cold Spring Harb Symp Quant Biol 52: 863-7, 1987 Mousset, S., Derome, N. Molecular polymorphism in Drosophila melanogaster and D. simulans: what have we learned from recent studies? Genetica 120: 79 86, 2004 Ohta, T. Slightly Deleterious Mutant Substitutions in Evolution. Nature 246, 96 98, 1973 Parisi, M., et al. Paucity of genes on the Drosophila X chromosome showing malebiased expression. Science 299: , 2003 Parsch, J. and Ellegren, H. The evolution of sex-biased genes and sex-biased gene expression. Nat Rev Genet 8(9): ,
135 Pool, J.E., Nielsen, R. Population size changes reshape genomic patterns of diversity. Evolution 61 (12): , 2007 Rice, W. R. Sex chromosomes and the evolution of sexual dimorphism. Evolution 38: , 1984 Singh, N. D., Davis, J. C., Petrov, D. A. X-linked genes evolve higher codon bias in Drosophila and Caenorhabditis. Genetics 171: , 2005 Tao, Y., Zeng, Z.-B., Li, J., Hartl, D.L., Laurie, C.C. Genetic Dissection of Hybrid Incompatibilities Between Drosophila simulans and D. mauritiana. II. Mapping Hybrid Male Sterility Loci on the Third Chromosome. Genetics 164: , 2003 Taylor, J., Tyekucheva, S., Zody, M., Chiaromonte, F., Makova, K. D. Strong and weak male mutation bias at different sites in the primate genomes: insights from the human-chimpanzee comparison. Mol. Biol. Evol. 23(3): , 2005 Vicoso, B. and Charlesworth, B. Evolution on the X chromosome: unusual patterns and processes. Nat Rev Genet 7(8): ,
136 Chapter 4: Sex-biased gene expression in Drosophila Abstract Sex-biased genes are of great interest, as they are thought to encode most of the differences between sexes in morphology, behaviour and metabolism. The evolution of sex-biased expression was first modelled by Rice (1984), who suggested it resulted from the repression of expression of genes that are carrying sexually antagonistic mutations, in the harmed sex. This should lead sex-biased genes to have, overall, lower levels of expression than unbiased genes. We have created expression profiles for sex-biased genes, using EST data as a proxy for expression level, in order to compare them with expression profiles of unbiased genes. Our results suggest that the evolution of sex-biased expression occurs primarily through an increase of expression in the beneficiary sex, unlike what was predicted by Rice (1984). Furthermore, the expression profiles of female- and malebiased genes are widely different, and provide us with some clues as to why male- and female-biased genes have very different rates of evolution, a pattern that is consistently observed in Drosophila. 126
137 4.1 Introduction Sex-Biased genes In species with separate sexes, males and females often have very different morphology, behaviour and physiology. A lot of work has been put into understanding how these between-sexes differences arose, as many characteristics that are advantageous to one of the sexes are disadvantageous to the other (Rice, 1984; Parsch and Ellegren, 2007). Obvious examples include the outrageous tail of the peacock, which makes males an easy target for females but also for predators, or the gigantic horns of the bighorn sheep, which are a lot less effective against predators than the shorter, female version, but more efficient in male head to head fights. Whilst these are extreme cases, it has been suggested that sexual antagonism is actually a common feature, and that most metabolic and physical traits have different optimal values for males and females (Glucksman, 1981). Rice (1984) modelled the evolution of mutations that provide an advantage to one of the sexes but are deleterious to the other. He noted that, for the autosomal case, a sexually antagonistic mutation is predicted to increase in frequency when the advantage it provides to one sex is larger than the harm to the other. As the frequency increases, it becomes beneficial for the harmed sex to develop a modifier that decreases the now deleterious expression of the gene. Once this has occurred, the mutation is expected to become unconditionally advantageous and will be fixed in the population, with the gene predominantly expressed in one of the sexes (it is now a sex-biased gene). Predictions for the X chromosome are described in section
138 Microarray and EST technologies have made it possible to study the expression level of genes in different organisms or tissues. Several groups have taken advantage of these approaches to determine which genes have a sex-biased expression, by comparing their expression in males and females (these can be whole-body comparisons, or comparisons of specific tissues in both sexes) (Reinke et al., 2004; Wang et al., 2001; Parisi et al., 2003; Lercher et al., 2003; Meiklejohn et al., 2003; Zhang et al., 2004; Kaiser and Ellegren, 2006). These studies have shown that a large proportion of the genome of several organisms is indeed sex-biased in its expression, and that these sex-biased genes differ from other genes in their rates of evolution and genomic distribution (reviewed in Parsch and Ellegren, 2007). Most of the discussion of these results has been based on Rice s 1984 model. However, the relevance of this model has not been clearly assessed Predictions of Rice s model Rice s model makes two predictions that can be easily tested. First, he showed that, under certain conditions, the X chromosome is expected to accumulate more sexbiased genes than the autosomes. Dominant mutations that are beneficial for females, but deleterious for males, accumulate there simply because the X spends more time in females (where they are beneficial) than in males (where they are deleterious), whereas autosomes spend the same amount of time in each (Rice, 1984). On the other hand, recessive X-linked mutations that are beneficial for males, but deleterious for females, are masked in heterozygous females but have an immediate beneficial effect on males, whereas autosomal mutations only start having a beneficial effect on males when they 128
139 appear in homozygous individuals, and therefore have a deleterious effect in females. In Rice s model, in both cases, a modifier that decreases the expression of the gene in the harmed sex is required for the mutation to become fixed in the population. This would, in principle, lead to an accumulation of sex-biased genes on the X chromosome. The predictions concerning sex-biased genes are summarized in Table 4.1. Table 4.1: Rice s (1984) predictions of the distribution of sex-biased genes on the X and the autosomes, depending on the dominance coefficient of the initial antagonistic mutation. Dominant favourable mutations Recessive favourable mutations Male-biased genes Deficit on the X Excess on the X Female-biased genes Excess on the X Deficit on the X Whilst the distribution of sex-biased genes in the genome is not random, and the X in particular often shows a deficit or excess of sex-biased genes, the results for different species are often inconsistent. In Drosophila melanogaster and Caenorhabditis elegans, there seems to be a deficit of male-biased genes on the X, whereas in mammals an excess of male-biased genes is observed (Parisi et al., 2003, Lercher et al., 2003, Khil et al., 2004, Reinke et al., 2004). Most of the discussion of these discrepancies has focused on dominance effects, even though there seems to be no clear reason to expect a systematic difference in dominance coefficients between different species (Kaiser and 129
140 Ellegren, 2006). Another possibility is that Rice s model (1984) is in fact an unrealistic representation of the evolution of most sex-biased genes. A better understanding of the actual mechanistic evolution of sex-biased genes is needed to assess how useful this model really is (Vicoso and Charlesworth, 2006). The second prediction concerns the overall level of gene expression: if sexbiased genes evolve through the appearance of a modifier that inhibits their expression in the harmed sex, they should, on average, have lower levels of expression than nonbiased genes. One study has addressed this issue; Connallon and Lacey-Knowles (2005) pointed out that whilst Rice s model has often been quoted and antagonism used as the explanation for the distribution of sex-biased genes, no one had tested it directly. They attempted to do this, using published Drosophila microarray data. One of their findings was that sex-biased genes are, on average, more highly expressed than nonbiased genes. This seems to be true even for genes that are sex-biased in D. melanogaster but not in D. simulans, suggesting that new sex biased genes arise through an increase of expression in the favoured gene, and not, as Rice (1984) predicted, by a decrease in the disfavoured gene. Taken together, these studies suggest that Rice s model (1984) may not be sufficient to explain the overall evolution and distribution of sex-biased genes, and that experimental studies are needed to ensure that the models that are used are relevant to the discussion The rates of evolution of male- and female-biased genes Whilst the differential accumulation of sex-biased genes in the genome can sometimes be accounted for by Rice s model, the unusual rates of evolution observed for 130
141 sex-biased genes still need explaining: rates of molecular evolution are particularly high for male-biased genes but particularly low for female-biased genes compared to nonbiased genes (Meiklejohn et al., 2003; reviewed in Ellegren and Parsch, 2007). The general view is that males are subjected to more positive often sexual selection, leading male-biased genes to evolve faster and have high rates of turnover between close species (Zhang et al., 2007). Although male- and female-biased genes could be expected to be involved in an arms race, and therefore evolve similarly fast, female-biased genes tend to be more conserved between species and show, overall, lower rates of evolution, even than non-biased genes (Zhang et al., 2007). One suggestion has been that femalebiased genes are involved in developmental processes, as knocking down female-fertility genes has been shown to often be lethal, which could lead to these genes being strongly conserved (Perrimon et al., 1986; Davis et al., 2005). Although these explanations are intuitively appealing, the evidence supporting them is mostly anecdotal, and more systematic testing is required. Other factors could be influencing these rates of evolution, such as the level, breadth and developmental time of expression, which are all correlated with rates of evolution (Lemos et al., 2005). There is some indirect evidence concerning these. Connallon and Lacey-Knowles (2005) found that sex-biased genes had higher levels of expression than non-biased genes, and that this pattern was stronger for male-biased genes. This suggests that differences in expression levels are not the cause of faster evolution of male-biased genes, since high levels of expression are usually accompanied by slow rates of evolution. The breadth of expression of sex-biased genes has been assessed, using microarray comparisons of different male and female tissues, to determine sex-biased gene expression in different 131
142 tissues (Parisi et al., 2004). The results suggest that female-biased genes are sex-biased in a wider range of tissues than male-biased genes. A more straightforward approach to better understanding the relation between the evolution of sex-biased genes and their expression patterns is to select genes that have been classified as sex-biased, and compare their overall expression levels in different tissues with the expression levels of non-biased genes. We have done this, using the mean number of ESTs in an EST database as a proxy for expression levels of genes that have been classified as male-, female- or non-biased in microarray studies of sex-biased genes, to examine tissue-specificity of sex-biased genes and their overall levels of expression. EST datasets provide a simple method to approximate expression levels as, unlike microarray datasets, they do not depend on the number of genes included in the microarray chip, and can therefore be used for any list of genes (see for instance Duret and Mouchiroud, 1999) Goals of this study -Creating expression profiles for sex-biased and non-biased genes, to further extend our understanding of what the biological definition of a sex-biased gene is. -Investigating which steps lead to the creation of sex-biased genes, by comparing the expression profiles of genes that have conserved sex-biases in D. melanogaster and its sister species D. simulans, and genes that are sex-biased only in D. melanogaster (as this last category should be enriched for newly sex-biased genes). 132
143 -Examine the differences between male- and female-biased genes in their evolution and current expression patterns, and discuss how this relates to our current knowledge of the evolution of sex-biased genes. The results reported below suggest that male- and female-biased genes evolve differently and have different expression profiles. Male-biased genes are primarily expressed in the testis, at very high levels, and their expression appears to be reduced in other tissues. The first step in their evolution seems to be a large increase in expression in the testis. The germline appears to have a smaller importance in the evolution of female-biased genes, which are over-expressed in several tissues (although the biggest increase is in the ovary). Furthermore, there seems to be an association between female-biased and embryo-expressed genes. 4.2 Materials and methods Datasets used Microarray data A dataset of Drosophila melanogaster male-, female- and non-biased genes was downloaded from genes included in the SEx-BIas DAtabase (SEBIDA, a repository of microarray data from several studies of sex-biased genes in Drosophila. For this dataset, genes were classified as sex-biased when they had a two-fold excess of expression in one sex. The sex-ratio of expression values for D. simulans were also downloaded EST data 133
144 The D. melanogaster EST dataset was downloaded from the NCBI UNIGENE database ( Analysis Cleaning the EST database The downloaded dataset consists of a list of genes, a list of ESTs associated with each gene and the EST library they come from. A Perl script extracted, for each gene, the gene name, and counted how many ESTs from each tissue library were associated with them. This resulted in a large table containing a list of genes and their expression profile (all Perl scripts used are described in Appendix A4.1) Matching the sex-biased genes and their expression profile For each gene in the male-, female- and non-biased gene lists, a second Perl script was used to search the EST dataset and extract the expression profile for them. This resulted in 3 groups of expression profiles; male-, female- and non-biased genes, which were then compared Two-species analysis The second Perl script was run again, after separating the sex-biased genes into conserved genes (when they were also sex-biased in D. simulans, as described on the SEBIDA website) and non-conserved genes (when their sex-bias was specific to D. melanogaster), in order to create expression profiles for conserved and non-conserved male-biased and female-biased genes. The non-conserved group is likely to be enriched for newly evolved sex-biased genes, and should therefore give us some information about the early steps of sex-bias evolution. 134
145 4.2.3 Statistical analysis The significance of the differences in expression of male- and female-biased genes compared to the non-biased genes was assessed using two-tailed unpaired t-tests, with p- values adjusted for multiple comparisons with the Dunn-Sidak method (Ury, 1976). Since the number of genes in the sample was very large (682 female-biased genes, 636 male-biased genes and 3501 non-biased genes), we used parametric tests. 4.3 Results The importance of the germline Parsch and Ellegren (2007) claimed that most of the sex-biased differences could be accounted for by differences in expression in reproductive tissues (Parisi et al., 2003, Parsch and Ellegren, 2007). This is hard to reconcile with Parisi et al. s (2004) finding that microarray comparisons using the ovary resulted in a lower fraction of the genome being detected as sex-biased than comparisons using female soma. Two types of microarray comparisons were used in Parisi et al. s (2003) study on Drosophila melanogaster sex-biased genes: ovary versus testis, and whole-female versus whole-male comparisons. By combining these two types of datasets, the importance of the germline for sex-biased genes can be evaluated. Simply comparing the sex-ratio of expression (the male to female ratio, in the case of male-biased genes, or female to male ratio, for female-biased genes) for whole-body comparison versus germline comparisons (Figure 4.1) shows a clear difference between femaleand male-biased genes: male-biased genes are more sex-biased for germline 135
146 Figure 4.1: The male-bias is stronger in the germline, whereas the female-bias is stronger in whole-body comparisons. The sex-ratio of expression corresponds to the mean male to female expression ratio, for male-biased genes, and mean female to male expression ratio, for female-biased genesin the Parisi et al. (2004) whole-body and ovary-testis comparisons, as given in the Sebida website. 136
147 comparisons, whereas such an effect is not observed in female-biased genes (if anything, the bias seems stronger for whole-body comparisons, in agreement with Parisi et al. (2004)). This is a first suggestion that a single model to explain the evolution and distribution of all sex-biased genes might not be adequate, as femalebiased genes seem to be more systemic whereas male-biased genes are expressed mostly in germline. They therefore may have different sex-specific functions and be under different selective pressures Expression profiles of sex-biased genes Table 4.2 shows the mean number of ESTs from each tissue, for the three classes of genes (seqcount is the total number of sequences found in UNIGENE, and should be representative of overall expression levels). The first thing to note is that different tissues have a different representation in the dataset, and that the results for some tissues are probably not very reliable (whole larva, for instance, is only represented by one small library). However, it is interesting to note that overall, female-biased genes have higher mean expression levels than non-biased genes, but male-biased genes show the opposite pattern. To further analyse in which tissues sex-biased genes are over- and under-expressed, the mean EST counts for female- and male-biased genes, for each tissue, can be divided by the corresponding non-biased value, so that the difference between the sex-biased genes and the non-biased genes is observed independently of the library size. This is represented in Figure 4.2. The most noticeable pattern is the very large increase in testis expression for malebiased genes. Female-biased genes show a more modest increase of ovary expression, in 137
148 Table 4.2: Mean EST count per gene for non-biased and sex-biased genes. Seqcount is the total number of sequences found in Unigene Nonbiased genes (SD) Male-biased genes (SD) Femalebiased genes (SD) Seqcount (60.77) (52.51) (126.50) Ovary 0.79 (2.84) 0.15 (0.63) 2.38 (6.54) Testis 1.57 (5.09) (23.50) 1.14 (3.45) Brain 0.01 (0.08) 0.00 (0.04) 0.00 (0.05) Head 6.07 (17.13) 4.37 (32.56) 7.82 (47.09) Whole embryo 9.67 (21.97) 1.76 (6.51) (40.75) Whole larva 0.00 (0.03) 0.00 (0.00) 0.00 (0.00) Whole adult 0.44 (4.40) 0.42 (2.57) 0.71 (11.36) Gonad 0.31 (1.86) 0.05 (0.27) 0.70 (4.98) Fat body 0.52 (3.83) 0.45 (2.38) 0.35 (1.71) Blood 0.48 (1.89) 0.08 (0.58) 0.61 (2.14) Salivary gland 0.31 (1.89) 0.11 (0.89) 0.16 (0.82) Other (27.29) 6.61 (13.78) (37.95) 138
149 Figure 4.2: Normalized expression levels of sex-biased genes in different tissues. The normalized values were obtained by dividing the mean number of ESTs per sexbiased gene found in each tissue by the corresponding value for non-biased genes, so that we are now observing, for each tissue, the over- (more than 100%) or under- (under 100%) expression of sex-biased genes compared to the non-biased genes. Levels of significance using unpaired two-tailed t-tests, after applying a Dunn-Sidak correction for multiple comparisons, are represented by asterisks (* < 0.05, ** < 0.01, *** < 0.001). 139
150 agreement with the microarray data. As far as the other tissues go, male-biased genes are under-expressed in all of them, whereas female-biased genes tend to be over-expressed (they are never significantly under-expressed). This again suggests that male- and female-biased genes are different in their behaviour and may require different models to explain their evolution and distribution. Another interesting result is that the libraries for which female-biased genes show a significant increase in EST count (apart from ovary) are all embryonic. Possible explanations for this pattern are put forward in the discussion Conserved versus non-conserved sex-biased genes These profiles show the current expression of sex-biased genes, whereas Rice s model is concerned with their early evolution. It is possible, for instance, that femalebiased genes arise by a decrease of expression in males, later followed by an increase in females. It is therefore of interest to analyse newly evolved sex-biased genes. By analysing the genes that are only sex-biased in D. melanogaster but not D. simulans, it is possible to obtain a sample that is enriched for genes with newly evolved sex-biased expression. By considering only the genes that are in all three datasets, the sex-biased genes can be separated into conserved, if they are also sex-biased in D. simulans, and nonconserved categories. The analysis can then be repeated. Table 3 shows the mean EST counts for sex-biased and non-biased genes. Since the non-conserved category is likely to be enriched for genes that have recently acquired their sex-bias in D. melanogaster, they can give us useful information about the initial steps of evolution of sex-biased 140
151 Table 4.3: Mean EST count per gene for conserved and non-conserved non-biased and sex-biased genes. Seqcount is the total number of sequences found in Unigene. Conserved Nonconserved femaleconserved Conserved Non- Nonbiased malebiased male-biased biased female-biased Seqcount Ovary Testis Brain Head Whole embryo Whole larva Whole adult Gonad Fat body Blood Salivary gland Other
152 Figure 4.3: Normalized expression levels of conserved and non-conserved sex-biased genes in different tissues. The normalized values were obtained by dividing the mean number of ESTs per sex-biased gene found in each tissue by the corresponding value for non-biased genes. Levels of significance using unpaired two-tailed t-tests, after applying a Dunn-Sidak correction for multiple comparisons, are represented by asterisks (* <0.05, **<0.01, ***<0.001). 142
153 genes. The male-biased case is particularly interesting, as non-conserved genes, unlike the conserved genes, have a higher level of expression than non-biased genes. This is in agreement with the findings of Connallon and Lacey-Knowles (2005), that the initial evolution of male-biased genes involves an increase of expression. Female-biased genes always have higher levels of expression than non-biased genes, but the difference is stronger for the conserved genes. It is again of interest to determine in which tissues these changes in expression occur (Figure 4.3). For the male non-conserved genes, the only significant difference is a strong increase in testis expression. The repression of expression in other tissues is not consistently observed (even expression in the ovary is still at 88% of the expression level of non-biased genes in the ovary), which may suggest that this only occurs at a later stage of male-biased gene evolution, and would explain why their overall level of expression is higher than that of the non-biased genes. For female-biased genes, the nonconserved group shows an increased level of expression in the ovary and in embryonic tissues, but the increase in expression levels is not as large as for the conserved femalebiased genes. The consistency of the association between female-biased genes and embryonic tissues suggests this is not a random event (but a bias in the libraries cannot be excluded). 4.4 Discussion The expression of sex-biased genes Connallon and Lacey-Knowles (2005) had hinted at the inadequacy of Rice s model to fully account for the evolution and distribution of sex-biased genes. The results 143
154 reported here differed from theirs, as male-biased genes had, overall, a lower level of expression than non-biased genes. Their expression was, in fact, repressed in all tissues except the testis, where it was greatly increased. Female-biased genes, on the other hand, have a higher level of expression in most tissues analysed, and this is reflected in the higher mean expression level of female-biased genes. It is interesting to note that in D. melanogaster the rates of non-synonymous divergence are negatively correlated with the level and the breadth of expression (Lemos et al., 2005). Since the results show that female-biased genes are expressed at higher levels in several tissues than non-biased genes (resulting in a higher overall expression level), but male-biased genes are expressed at lower levels in most tissues, low rates of divergence for female-biased genes and high rates in male-biased genes are expected. Low rates of evolution have indeed been consistently detected in Drosophila melanogaster for female-biased genes, contrasting with the high rates detected for malebiased genes (Zhang et al., 2004, Proeschel et al., 2006) The evolution of sex-biased genes Although male-biased genes have, overall, a lower level of expression than nonbiased genes (represented by seqcount in Figure 4.2 and 4.3), the opposite is true when only non-conserved male-biased genes are considered. In fact, unlike what has mostly been previously assumed, our results suggest that the initial step in the evolution of both male- and female-biased genes appears to be an increase of expression, possibly in the beneficiary sex, and not a decrease in the disfavoured sex, in agreement with Connallon and Lacey-Knowles (2005). Our results further suggest that in the case of male-biased 144
155 genes, this increase in expression is mostly limited to the testis, and later followed by the repression of expression in most other tissues. Female-biased genes, on the other hand, arise by a consistent increase of expression not only in the ovary, but in embryonic tissues as well. How can this be reconciled with the genomic distribution results, which often are in agreement with Rice s (1984) model, at least if sexually antagonistic mutations are assumed to be dominant? It has been pointed out that similar predictions to those in Table 3.1 can be made, without invoking a modifier of expression, for the accumulation of antagonistic mutations (Vicoso and Charlesworth, 2006; Chapter 3). Once a sexually antagonistic allele is fixed, it becomes advantageous for the beneficial sex to increase its expression and/or for the harmed sex to decrease it, so that this is likely to be followed by the accumulation of mutations in the regulatory region of the gene, which lead to the sex-biased patterns of expression. Although the reasoning is similar to that of Rice s (1984) model, in this case the fixation of the antagonistic mutation precedes the evolution of sex-biased expression, and does not require inhibition of the expression in the harmed sex to cause a differential accumulation of sex-biased genes on the X chromosome An association between female- and embryo-expressed genes In this dataset, the tissues where the biggest increase in expression of femalebiased genes is observed (excluding the ovary) are the embryonic tissues. An experimental bias could account for this, if the embryonic libraries were made from a 145
156 pool of flies containing more females than males. It is, however, unclear why this should be the case for all the embryonic libraries. A more likely alternative is that a large proportion of the female-biased genes are in fact maternal genes, that is, genes whose mrnas are expressed in the egg and used in the development of the embryo. It has been suggested that genes required in early development tend to be strongly conserved, and such an effect has been observed in D. melanogaster (Davis et al., 2005). In the same study, the authors postulate that maternal genes should be under similar selective pressures as embryonic genes, and evolve at similarly low rates, and they did indeed find maternal genes to have slow rates of evolution (Davis et al., 2005). This would further explain why a large proportion of D. melanogaster female-biased genes have been found to be under stronger negative selection and evolve slower than not only male-biased genes, but also non-biased genes (Zhang et al., 2004, Pröschel et al., 2006). 4.5 Conclusions The analysis of EST and microarray data can further improve our knowledge of the evolution of sex-biased genes in D. melanogaster. The results presented here suggest that the evolution of a non-biased gene into a sex-biased gene occurs primarily through an increase of expression in the beneficiary sex. This goes against the predictions made by Rice (1984), and the relevance of this model to the overall evolution of sex-biased genes needs to be assessed carefully. The expression pattern of female- and male-biased genes is widely different. Male-biased genes are strongly over-expressed in the testis, but under-expressed in all 146
157 other tissues. Female-biased genes, on the other hand, are over-expressed in a wide array of tissues. Although this effect is stronger in the ovary, embryonic tissues also show an enrichment of female-biased genes, possibly because many female-biased genes are maternal genes. These differences in the expression profiles of male- and female-biased genes also shed some light into the different rates of evolution and different selective pressures that have been detected for female-and male-biased genes in D. melanogaster. 4.6 References Connallon, T., Knowles, L. L. Intergenomic conflict revealed by patterns of sex-biased gene expression. Trends Genet 21: 495-9, 2005 Davis, J.C., Brandman, O. and Petrov, D.A. Protein Evolution in the Context of Drosophila Development. Journal of Molecular Evolution, Volume 60 (6): , 2005 Duret, L., Mouchiroud, D. Expression pattern and, surprisingly, gene length shape codon usage in Caenorhabditis, Drosophila, and Arabidopsis. Proc Natl Acad Sci U S A, 96: , 1999 Glucksmann, A. (1981) Sexual Dimorphism in Human and Mammalian Biology and Pathology (Academic Press, N.Y.) Kaiser, V. B. & Ellegren, H. Nonrandom distribution of genes with sex-biased expression in the chicken genome. Evolution 60: ,
158 Khil, P.P., Smirnova, N.A., Romanienko, P.J., and Camerini-Otero, R.D. The mouse X chromosome is enriched for sex-biased genes not subject to selection by meiotic sex chromosome inactivation. Nature Genetics 36: , 2004 Lemos, B., Bettencourt, B. R., Meiklejohn, C. D. and Hartl, D. L. Evolution of Proteins and Gene Expression Levels are Coupled in Drosophila and are Independently Associated with mrna Abundance, Protein Length, and Number of Protein-Protein Interactions. Mol. Biol. Evol. 22(5): , 2005 Lercher, M. J., Urrutia, A. O., Hurst, L. D. Evidence that the Human X chromosome is enriched for male-specific but not female-specific genes. MBE 20: , 2003 Meiklejohn, C.D., Parsch, J., Ranz, J.M.,and Hartl, D.L. Rapid evolution of malebiased gene expression in Drosophila. PNAS, 100 (17): , 2003 Parisi, M., Nuttall, R., Naiman, D., Bouffard, G., Malley, J., Andrews, J., Eastman, S., Oliver, B. Paucity of Genes on the Drosophila X Chromosome Showing Male- Biased Expression. Science 299: , 2003 Parisi, M., Nuttall, R., Edwards, P., et al. A survey of ovary-, testis-, and somabiased gene expression in Drosophila melanogaster adults. Genome Biology, 5:R40, Parsch, J. and Ellegren, H. The evolution of sex-biased genes and sex-biased gene expression. Nat Rev Genet 8(9): , 2007 Perrimon, N., Mohler, D., Engstrom, L., Mahowald A. P. X-linked female-sterile loci in Drosophila melanogaster. Genetics 113: ,
159 Pröschel, M., Zhang, Z., Parsch, J. Widespread Adaptive Evolution of Drosophila Genes With Sex-Biased Expression. Genetics 174: , 2006 Reinke, V., Gil, I. S., Ward, S., Kazmer, K. Genome-wide germline-enriched and sexbiased expression profiles in Caenorhabditis elegans. Development 131: , 2004 Rice, W. R. Sex chromosomes and the evolution of sexual dimorphism. Evolution 38: , 1984 Ury, H. K. A comparison of four procedures for multiple comparisons among means (pairwise contrasts) for arbitrary sample sizes. Technometrics 18: 89-97, 1976 Vicoso, B. and Charlesworth, B. Evolution on the X chromosome: unusual patterns and processes. Nat Rev Genet 7(8): , 2006 Wang, P.J., McCarrey, J.R., Yang, F. and Page, DC. An abundance of X-linked genes expressed in spermatogonia. Nature Genetics 27: , 2001 Zhang, Z., Hambuch, T.M. and Parsch, J. Molecular Evolution of Sex-Biased Genes in Drosophila. Molecular Biology and Evolution 21(11): , 2004 Zhang Y., Sturgill D., Parisi M., Kumar S., Oliver, B. Constraint and turnover in sexbiased gene expression in the genus Drosophila. Nature 450: ,
160 Chapter 5: Male-biased genes and the hyperactivated X Abstract In Drosophila, there is a consistent deficit of male-biased genes on the X chromosome. The results presented in Chapter 4 suggest that male-biased genes arise through an initial large increase of expression levels in the testis. If transcription rates are limited, a large increase of expression in the testis may be harder to achieve for single-copy X-linked genes than for autosomal genes, as the latter are present in two copies in males. Furthermore, dosage compensation mechanisms that duplicate the expression on the single X in Drosophila males imply that, in males, X-linked genes are more likely to be close to this upper limit of transcription than autosomal genes. This hypothesis predicts that the larger the increase of expression required to make a male-biased gene, the smaller the chance of it being located on the X. Consequently, highly expressed male-biased genes should be located on the X chromosome less often than lowly expressed male-biased genes. This pattern is consistently observed in our data, whether microarray data or EST data are used to detect male-biased genes in D. melanogaster and to measure their expression levels, consistent with the idea that limitations in transcription rates may prevent male-biased genes from accumulating on the X chromosome. 151
161 5.1 Introduction The evolution of dosage compensation The evolution of sex chromosomes Sex chromosomes have evolved independently from pairs of autosomes in many clades, suggesting similar evolutionary forces and overall similar steps in their evolution (reviewed in Charlesworth et al., 2005). Once a male-determining gene has arisen on an autosome, this new autosome will only be transmitted from fathers to sons. Unlike the autosomes, which spend half of their time in females, this new sex chromosome will only be under selection in males: this will lead to the accumulation of mutations that are favourable to males. It then becomes highly advantageous to keep the sex-determining gene and the alleles that are advantageous to males linked (that is, to avoid recombination on the new sex chromosome), so that they are only transmitted to males. This can, for instance, occur through successive inversions around the sex-determining gene region, as these abolish the recombination within the inverted fragment. This reduced recombination on the Y (we will refer to the chromosome carrying the sex-determining region as Y, but the same applies to the W chromosome, in the case of ZW sex determination systems, such as birds and butterflies) also has consequences for the rest of the Y-linked genes, as follows (Charlesworth and Charlesworth, 2000): -Selective sweeps: when a new mutation arises on the non-recombining Y, which is beneficial for males, it can sweep to fixation. If there is no recombination, it will carry with it any other mutations present on the chromosome, including deleterious ones. -Muller s ratchet: when there is no recombination, the chromosome with the fewest deleterious mutations is the fittest in the population. Soon after the repression of 152
162 recombination, this is likely to be a chromosome free from strongly deleterious mutations. However, after some time, all chromosomes accumulate some mutations, so that even the fittest Y chromosome will carry at least one deleterious mutation: the ratchet has clicked. This process then starts again, eventually leading to the accumulation of deleterious mutations on the Y chromosome. -A lower recombination rate causes a reduction in the efficacy of selection, by decreasing the effective population size. This means that more deleterious mutations will behave neutrally, and therefore may become fixed by drift. The removal of transposable elements is expected to be less efficient for the same reasons. Taken together, these theories predict that after recombination is repressed, the Y chromosome is expected to quickly accumulate deleterious mutations and transposable elements, and this has been amply documented. In species that have had sex chromosomes for a long time, such as mammals, the Y chromosome has lost most of its gene content (Lahn et al., 2001). More recently, genomic data from clades that have only recently acquired their sex chromosomes has shown that the Y chromosome shows higher rates of substitution (possibly due to the accumulation of deleterious mutations), accumulation of transposable elements and disrupted patterns of gene expression (Guttman and Charlesworth, 1998; Liu et al., 2004; Charlesworth, 2004; Bachtrog, 2005; Bartolomé and Chalesworth, 2006) Dosage compensation As the Y chromosome degenerates, males are left with only one copy of X-linked genes, and an absent or defective Y-linked copy. This creates a dosage problem, since 153
163 the expression of functional X-Y-linked genes is halved in males. Dosage compensation mechanisms, that redress this, have been found and studied extensively in several species (Lyon, 1961; Gupta et al., 2006). Discussion of dosage imbalances initially focused on the difference between XX females and XY males and the means to readjust this difference. This view has however been abandoned, since, as Charlesworth (1978) and Gupta et al. (2006) pointed out, selection acts on the individual and is not affected by the difference between females and males. It has therefore been hypothesized that dosage compensation mechanisms arise in two steps (reviewed in Straub and Becker, 2007): 1) Expression levels on the X chromosome are increased to compensate for the absence of Y-linked copies. This readjusts the expression in males. If the increase of expression is limited to males, as in Drosophila, no further mechanisms are necessary. However, if the X chromosome is over-expressed in both sexes, females suffer from an excess of X- linked expression, leading to step 2; 2) Expression of the female X is inhibited, so that the two sexes now have levels of X- linked expression similar to the initial ones, and also similar between females and males. Several studies have analysed the expression of X-linked genes in male and female soma and germline in Drosophila melanogaster, Caenorhabditis elegans and Mus musculus to determine precisely how the dosage compensation mechanisms regulate expression in these organisms (Gupta et al., 2006; Nguyen and Disteche, 2006; Lin et al., 2007; reviewed in Straub and Becker, 2007), and their findings are summarized below. 154
164 Drosophila melanogaster The male X chromosome is hypertranscribed in the male germline and soma, as X- individuals produce as much X-linked mrna as XX individuals. In somatic tissues, this hyperactivation seems to be male-specific, and XX females produce X-linked and autosomal RNA at similar rates (slightly higher on the X, actually). This is consistent with the previous observation that when dosage compensation mechanisms are repressed, female X-linked expression remains unchanged, whilst male X-linked expression is halved (Mukherjee and Beermann, 1965). C. elegans X-linked somatic transcription is similar in XX- and X- individuals, with females reducing transcription on the X (Straub and Becker, 2007). However, even in females, transcription on the X is higher than on the autosomes (Gupta et al., 2006). This means that the female X might be slightly hyperactive, and the male X is very hyperactive (as it achieves these high levels of transcription from one chromosome only). No information is available for the germline. Mammals One of the X chromosomes is inactivated in each somatic female cell, so that XX and X- individuals produce similar levels of X-linked RNA (Lyon, 1969; Straub and Becker, 2007). Studies of expression levels in mouse and human detected no difference between X-linked and autosomal gene expression (Gupta et al., 2006; Nguyen and 155
165 Disteche, 2006; Lin et al., 2007), suggesting that there was hyperactivation of the X in both males and females The distribution of sex-biased genes: theory and practice Rice (1984) showed that, under certain conditions, the X chromosome is expected to accumulate more sex-biased genes than the autosomes (see previous chapter). Dominant mutations that are beneficial for females but deleterious for males accumulate there because the X spends more time in females than in males, whereas autosomes spend the same amount of time in each sex (Rice, 1984). Recessive X-linked mutations that are beneficial for males, but deleterious for females, are masked in heterozygous females but have a beneficial effect in males instantly, whereas autosomal mutations only start having a beneficial effect in males when they appear in homozygous individuals, and therefore have a deleterious effect in females. In both cases, a modifier that decreases the expression of the gene in the harmed sex is required for the mutation to become fixed in the population. This would in principle lead to an accumulation of sex-biased genes on the X. Microarray and EST datasets comparing female and male expression have made the identification of male- and female-biased genes possible in several organisms. As predicted, their distribution in the genome is not random, and the X chromosome always differs from the autosomes in its content of sex-biased genes (Parisi et al., 2003, Khil et al., 2004, Lercher et al., 2003, Reinke et al., 2003, Kaiser and Ellegren, 2006). However, the patterns are highly inconsistent between species (see Table 1.2 in Chapter 1). Since Rice s (1984) theory predicts different results for different levels of dominance 156
166 of the new mutations, most of the discussion on these patterns has relied on differences in dominance to explain the discrepancies. Why there should be such systematic differences in dominance between organisms remains unclear New insights into the evolution of sex-biased genes Whilst the X chromosome differs from the autosomes in its transmission mode and ploidy state, as modelled by Rice (1984), it also has different biological properties that could affect the distribution of sex-biased genes. Meiotic X inactivation, for instance, implies that genes required for certain stages of spermatogenesis cannot be located on the X chromosomes in organisms where this mechanism is present, such as mammals (Khil et al., 2004), and possibly Drosophila (Hense et al., 2007). In mouse, it has been shown that genes required for late spermatogenesis are indeed rare on the X, whereas genes required for early spermatogenesis (before X-inactivation) are located on the X more often than expected with a random distribution (Khil et al., 2004). Meiotic X- inactivation cannot, however, explain other peculiarities of the sex-gene distribution, as many are not limited to testis-expressed genes (Sturgill et al., 2007). The potential effect of dosage compensation on the distribution of sex-biased genes has so far not been studied. This phenomenon, however, might be of particular interest because, whilst it is present in all the organisms analyzed (apart from birds, Ellegren et al., 2007; Itho et al., 2007), it evolved independently and has different properties in each of them. This could lead to different predictions for the sex-biased gene distribution in these species, which we attempt to test using published microarray and EST data. 157
167 5.1.4 Can dosage compensation affect the distribution of sex-biased genes? In Rice s model (1984), genes become sex-biased when expression in the harmed sex is decreased or abolished. Therefore, on average, sex-biased genes should have lower levels of expression than unbiased ones. Connallon and Lacey-Knowles (2005) tested this by comparing microarray expression data for male-biased, female-biased and unbiased genes. Surprisingly, they found that sex-biased genes are on average transcribed at higher rates than unbiased genes. Our analysis of EST data for sex-biased and unbiased genes (see previous chapter) also suggests that the first step in the evolution of male-biased genes is an increase of expression in the testis, whereas for females it is an increase in both ovary and embryonic tissue expression. If that is the case, and if there is a limit to how much mrna can be produced from a single gene, then this increase might be harder to achieve in genes that are already being heavily transcribed. The X chromosome is often hyperactivated to achieve dosage compensation, so that most of its genes may be close to this limit and therefore an increase to make a gene sex-biased may be rare on these hyperactive chromosomes. This yields two predictions: 1) hyperactive X chromosomes should accumulate less sex-biased (with respect to the sex where the hyperactivity occurs) genes than the autosomes; 2) this deficit should be expression-dependent, as lowly expressed sex-biased genes either arose from genes that were very lowly expressed to start with, or by a decrease of expression levels in the harmed sex, as predicted by Rice s model (1984). The evolution of their sex-bias should therefore not have been affected by limited transcription rates. 158
168 These predictions are further complicated by the fact that most of what is known about dosage compensation and X chromosome hyperactivation concerns the soma (Gupta et al., 2006; Nguyen and Disteche, 2006), whereas a large proportion of sexbiased genes are primarily expressed in the germline (Parsch and Ellegren, 2007). In Drosophila, however, predictions are made particularly simple by the fact that X chromosome hyperactivation has been detected both in the germline and in the soma (Gupta et al., 2006) Aims of this chapter In Drosophila, we expect to observe (see previous section): 1) A deficit of male-biased genes on the X-chromosome (which has been consistently observed); 2) A small deficit of male-biased genes on the X chromosome when only lowexpression genes are considered, and a marked deficit of highly expressed male-biased genes on the X-chromosome. We test the second prediction by checking if the deficit of male-biased genes observed on the D. melanogaster X chromosome is stronger for highly expressed genes than for lowly expressed genes, using microarray and EST data to measure levels of expression of male-biased genes. We have focused on genes expressed in the testis and the ovary, as there are only very small numbers of somatic male-biased genes on the X, making the sample size too small to perform meaningful analyses. 159
169 5.2 Materials and methods EST analysis The UNIGENE database ( is a collection of EST and cdna libraries organized by sequence similarity, so that, for each gene, it returns the ESTs that have been detected in all the libraries in the dataset. The results can be filtered to return all the genes found in one particular species, tissue and/or chromosome. We have taken advantage of this to select D. melanogaster autosomal and X-linked genes that are expressed in the testis and ovary, and scored the number of genes found in each case. We used this to compare the fraction of X-linked and autosomal genes expressed in the testis, separating them according to their expression level (measured by the total number of ESTs detected for each gene). We followed the same procedure for autosomal and X-linked genes expressed in the testis (ovary) but not ovary (testis) and finally, to avoid most of all ubiquitously expressed genes, testis (ovary) but not ovary (testis) or head, as the head library is the largest library from a characterized somatic tissue Microarray We downloaded four microarray datasets (Ovaries versus Testes 5a, dataset ID: GSM2464; Ovaries versus Testes 5b, ID: GSM2465; Testes versus Ovaries 6a, ID: GSM2466; and Testes versus Ovaries 6b, ID: GSM2467) that compared expression levels in D. melanogaster testes and ovaries (Parisi et al., 2004) from the NCBI GEO website, a repository of microarray datasets ( The genes were ordered according to the natural log-transformed ratio of the corrected ratio 160
170 of ovary to testis signals, as this should be representative of their sex-bias. Genes with scores higher than 1, or smaller than -1, were considered to be sex-biased. Once the genes were classified into male-, female- or unbiased genes, we organized them according to their overall expression in males (for the case of malebiased genes), females (for female-biased genes), and the average of males and females (for unbiased genes). We used the overall probe signal, after normalization for background signaling, as the measure of expression levels (this corresponds to P1S/B and P2S/B in the datasets). 5.3 Results Microarray data Using two datasets from Parisi et al. (2004), which compared D. melanogaster ovary and testis expression (Ovaries versus Testes 5a and Ovaries versus Testes 5b), we can test if the distribution of male-, female- and unbiased genes is dependent on the expression level (Figure 5.1). To maximise our capacity to detect the deficit of malebiased genes for all levels of expression, we divided the sample of male-biased genes into three groups of equal size (low-expression, medium-expression and high expression). The boundaries of these groups were used to classify the unbiased and the female-biased genes according to their expression level, so that, for each expression class, we could test if there was a deficit of male-biased genes. 161


171 Figure 5.1 (Legend on the next page) 162
172 Figure 5.1: The percentage of male-, female- and unbiased genes located on the X for three classes of expression levels (low, medium and high expression), using two comparisons of testis and ovary expression levels (A: Ovaries versus testes 5a, B: Ovaries versus testes 5b). The male-biased genes were organized according to the probe signal for testis RNA, and divided into three groups of equal size (low, medium and high expression genes). The probe signal range of these classes was used to classify female-biased and unbiased genes into low, medium and high expression classes. The female-biased genes were separated according to the probe signal for ovary RNA, and the unbiased genes according to the average of the ovary and the testis signals. The p-values denote significant deficits or excesses of low-, medium- and high-expression sex-biased genes on the X compared with the number of unbiased genes for that class, and were obtained with Chi-square tests (NS denotes nonsignificant differences). 163
173 In both datasets (Figure 5.1A and 5.1B), the deficit of male-biased genes on the X (compared with the number of unbiased genes that are located on the X) is nonsignificant for the low expression genes, using a Chi-square test. The high expression genes have, in both cases, the most highly significant deficit of male-biased genes, suggesting that the deficit of male-biased genes on the X chromosome is indeed stronger for highly expressed genes. The patterns for female-biased genes are mostly nonsignificant, apart from a significant excess of lowly expressed female-biased genes on the X in one of the datasets (Figure 5.1A). In order to see if the pattern observed for male-biased genes was consistent, we used two more datasets (Testes versus Ovaries 6a and 6b) and repeated the analysis for male-biased genes (Figure 5.2A). In all four datasets, the percentage of male-biased genes located on the X was lowest for highly expressed genes, and highest for lowly expressed genes, and this difference was significant in three of the cases (using a three by two Chi-square test). This contrasts with unbiased genes (Figure 5.2C), which show the opposite pattern: in three of the four datasets, a larger proportion of highly expressed than lowly expressed unbiased genes is located on the X chromosome (although this difference is only significant for two of the datasets). No significant differences were detected for female-biased genes (Figure 5.2B). Overall, these results agree with the prediction that the deficit of male-biased genes on the X chromosome should be stronger for highly-expressed genes, and weaker for lowly-expressed genes. However, this analysis suffers from two drawbacks: - truly lowly expressed genes may not to be identified as sex-biased amongst the generally high levels of background noise; 164


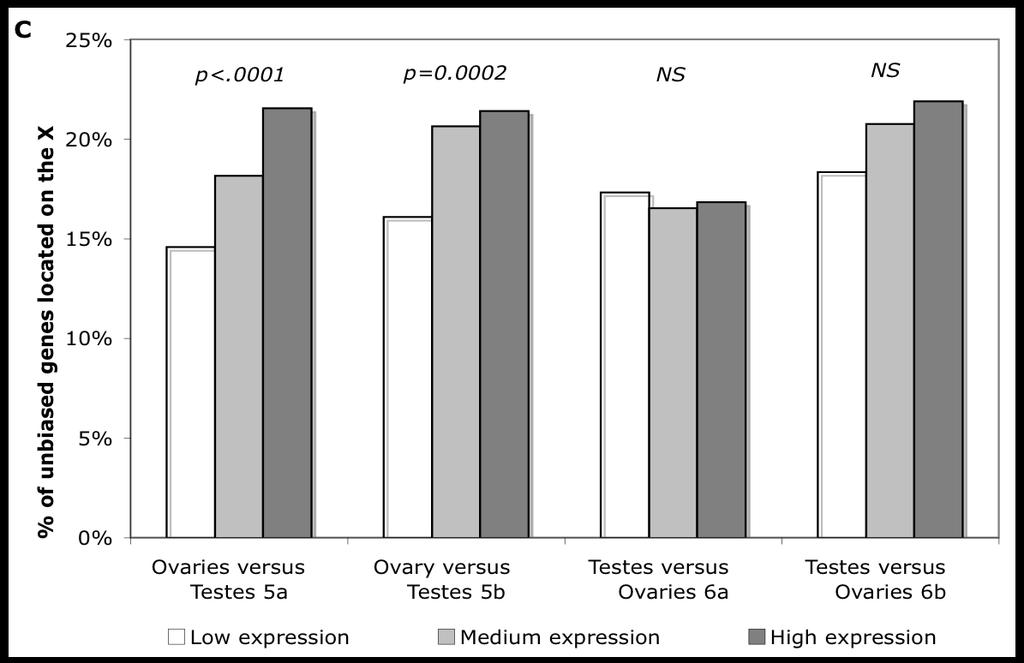
174 Figure 5.2 (Legend on the next page) 165
Drosophila melanogaster and D. simulans, two fruit fly species that are nearly
 Comparative Genomics: Human versus chimpanzee 1. Introduction The chimpanzee is the closest living relative to humans. The two species are nearly identical in DNA sequence (>98% identity), yet vastly different
Molecular Evolution & the Origin of Variation
 Molecular Evolution & the Origin of Variation What Is Molecular Evolution? Molecular evolution differs from phenotypic evolution in that mutations and genetic drift are much more important determinants
Molecular Evolution & the Origin of Variation
 Molecular Evolution & the Origin of Variation What Is Molecular Evolution? Molecular evolution differs from phenotypic evolution in that mutations and genetic drift are much more important determinants
(Write your name on every page. One point will be deducted for every page without your name!)
") POPULATION GENETICS AND MICROEVOLUTIONARY THEORY FINAL EXAMINATION (Write your name on every page. One point will be deducted for every page without your name!) 1. Briefly define (5 points each): a) Average
POPULATION GENETICS AND MICROEVOLUTIONARY THEORY FINAL EXAMINATION (Write your name on every page. One point will be deducted for every page without your name!) 1. Briefly define (5 points each): a) Average
Chapter 13 Meiosis and Sexual Reproduction
 Biology 110 Sec. 11 J. Greg Doheny Chapter 13 Meiosis and Sexual Reproduction Quiz Questions: 1. What word do you use to describe a chromosome or gene allele that we inherit from our Mother? From our Father?
Name Class Date. KEY CONCEPT Gametes have half the number of chromosomes that body cells have.
 Section 1: Chromosomes and Meiosis KEY CONCEPT Gametes have half the number of chromosomes that body cells have. VOCABULARY somatic cell autosome fertilization gamete sex chromosome diploid homologous
Understanding relationship between homologous sequences
 Molecular Evolution Molecular Evolution How and when were genes and proteins created? How old is a gene? How can we calculate the age of a gene? How did the gene evolve to the present form? What selective
Effective population size and patterns of molecular evolution and variation
 FunDamental concepts in genetics Effective population size and patterns of molecular evolution and variation Brian Charlesworth Abstract The effective size of a population,, determines the rate of change
Processes of Evolution
 15 Processes of Evolution Forces of Evolution Concept 15.4 Selection Can Be Stabilizing, Directional, or Disruptive Natural selection can act on quantitative traits in three ways: Stabilizing selection
Mutation, Selection, Gene Flow, Genetic Drift, and Nonrandom Mating Results in Evolution
 Mutation, Selection, Gene Flow, Genetic Drift, and Nonrandom Mating Results in Evolution 15.2 Intro In biology, evolution refers specifically to changes in the genetic makeup of populations over time.
UNIT 8 BIOLOGY: Meiosis and Heredity Page 148
 UNIT 8 BIOLOGY: Meiosis and Heredity Page 148 CP: CHAPTER 6, Sections 1-6; CHAPTER 7, Sections 1-4; HN: CHAPTER 11, Section 1-5 Standard B-4: The student will demonstrate an understanding of the molecular
Chromosome Chr Duplica Duplic t a ion Pixley
 Chromosome Duplication Pixley Figure 4-6 Molecular Biology of the Cell ( Garland Science 2008) Figure 4-72 Molecular Biology of the Cell ( Garland Science 2008) Interphase During mitosis (cell division),
1. CHROMOSOMES AND MEIOSIS
 Meiosis and Mendel Answer Key SECTION 1. CHROMOSOMES AND MEIOSIS 1. somatic/body cells; germ cells/gametes 2. in the reproductive organs; ovaries and testes 3. 46 4. mother 5. father 6. autosomes 7. X
Patterns of inheritance
 Patterns of inheritance Learning goals By the end of this material you would have learnt about: How traits and characteristics are passed on from one generation to another The different patterns of inheritance
Biology 067 Section 14 Cell Division. A. Definitions:
 Biology 067 Section 14 Cell Division A. Definitions: In a human cell, a nucleus holds all the chromatin that condenses to form chromosomes when cells divide every cell in the body has the same set of chromosomes
Review Article Gene Duplication and the Genome Distribution of Sex-Biased Genes
 SAGE-Hindawi Access to Research International Journal of Evolutionary Biology Volume 2011, Article ID 989438, 20 pages doi:10.4061/2011/989438 Review Article Gene Duplication and the Genome Distribution
- mutations can occur at different levels from single nucleotide positions in DNA to entire genomes.
 February 8, 2005 Bio 107/207 Winter 2005 Lecture 11 Mutation and transposable elements - the term mutation has an interesting history. - as far back as the 17th century, it was used to describe any drastic
WHERE DOES THE VARIATION COME FROM IN THE FIRST PLACE?
 What factors contribute to phenotypic variation? The world s tallest man, Sultan Kosen (8 feet 1 inch) towers over the world s smallest, He Ping (2 feet 5 inches). WHERE DOES THE VARIATION COME FROM IN
Reproduction & Cell Types
 Reproduction & Cell Types TYPES OF REPRODUCTION Asexual Relies on MITOSIS All of the parent s DNA goes to the offspring Sexual Relies on MEIOSIS Used to create sex cells TYPES OF CELLS Body Cells Includes
Febuary 1 st, 2010 Bioe 109 Winter 2010 Lecture 11 Molecular evolution. Classical vs. balanced views of genome structure
 Febuary 1 st, 2010 Bioe 109 Winter 2010 Lecture 11 Molecular evolution Classical vs. balanced views of genome structure - the proposal of the neutral theory by Kimura in 1968 led to the so-called neutralist-selectionist
Full file at CHAPTER 2 Genetics
 CHAPTER 2 Genetics MULTIPLE CHOICE 1. Chromosomes are a. small linear bodies. b. contained in cells. c. replicated during cell division. 2. A cross between true-breeding plants bearing yellow seeds produces
For a species to survive, it must REPRODUCE! Ch 13 NOTES Meiosis. Genetics Terminology: Homologous chromosomes
 For a species to survive, it must REPRODUCE! Ch 13 NOTES Meiosis Genetics Terminology: Autosomes Somatic cell Gamete Karyotype Homologous chromosomes Meiosis Sex chromosomes Diploid Haploid Zygote Synapsis
THE CONTRIBUTION OF GENE MOVEMENT TO THE TWO RULES OF SPECIATION
 doi:10.1111/j.1558-5646.2010.00990.x THE CONTRIBUTION OF GENE MOVEMENT TO THE TWO RULES OF SPECIATION Leonie C. Moyle, 1,2 Christopher D. Muir, 1 Mira V. Han, 3 and Matthew W. Hahn 1,3 1 Department of
MEIOSIS, THE BASIS OF SEXUAL REPRODUCTION
 MEIOSIS, THE BASIS OF SEXUAL REPRODUCTION Why do kids look different from the parents? How are they similar to their parents? Why aren t brothers or sisters more alike? Meiosis A process where the number
You have body cells and gametes Body cells are known as somatic cells. Germ cells develop into gametes or sex cells. Germ cells are located in the
 MEIOSIS You have body cells and gametes Body cells are known as somatic cells. Germ cells develop into gametes or sex cells. Germ cells are located in the ovaries and testes. Gametes are sex cells: egg
Module B Unit 5 Cell Growth and Reproduction. Mr. Mitcheltree
 Module B Unit 5 Cell Growth and Reproduction Mr. Mitcheltree DNA and Genetics - The Cell and Inheritance Gene = group of codons that code for a specific protein Allele = alternate form of a gene A dominant,
Genomes and Their Evolution
 Chapter 21 Genomes and Their Evolution PowerPoint Lecture Presentations for Biology Eighth Edition Neil Campbell and Jane Reece Lectures by Chris Romero, updated by Erin Barley with contributions from
Solutions to Problem Set 4
 Question 1 Solutions to 7.014 Problem Set 4 Because you have not read much scientific literature, you decide to study the genetics of garden peas. You have two pure breeding pea strains. One that is tall
Estimating selection on non-synonymous mutations. Institute of Evolutionary Biology, School of Biological Sciences, University of Edinburgh,
 Genetics: Published Articles Ahead of Print, published on November 19, 2005 as 10.1534/genetics.105.047217 Estimating selection on non-synonymous mutations Laurence Loewe 1, Brian Charlesworth, Carolina
Purposes of Cell Division
 Purposes of Cell Division Increase the number of cells for growth and repair of worn out tissues What examples in the human body can you think of? Transmit genetic information to later generations Why
Guided Notes Unit 6: Classical Genetics
 Name: Date: Block: Chapter 6: Meiosis and Mendel I. Concept 6.1: Chromosomes and Meiosis Guided Notes Unit 6: Classical Genetics a. Meiosis: i. (In animals, meiosis occurs in the sex organs the testes
Learning Objectives LO 3.7 The student can make predictions about natural phenomena occurring during the cell cycle. [See SP 6.4]
![Learning Objectives LO 3.7 The student can make predictions about natural phenomena occurring during the cell cycle. [See SP 6.4]](/thumbs/94/118687827.jpg "Learning Objectives LO 3.7 The student can make predictions about natural phenomena occurring during the cell cycle. [See SP 6.4]") Big Ideas 3.A.2: In eukaryotes, heritable information is passed to the next generation via processes that include the cell cycle and mitosis or meiosis plus fertilization. CHAPTER 13 MEIOSIS AND SEXUAL
Big Ideas 3.A.2: In eukaryotes, heritable information is passed to the next generation via processes that include the cell cycle and mitosis or meiosis plus fertilization. CHAPTER 13 MEIOSIS AND SEXUAL
Meiosis and Sexual Reproduction
 Meiosis and Sexual Reproduction Asexual Reproduction Single parent produces offspring All offspring are genetically identical to one another and to parent Produces identical somatic (body) cells Sexual
SEQUENCE DIVERGENCE,FUNCTIONAL CONSTRAINT, AND SELECTION IN PROTEIN EVOLUTION
 Annu. Rev. Genomics Hum. Genet. 2003. 4:213 35 doi: 10.1146/annurev.genom.4.020303.162528 Copyright c 2003 by Annual Reviews. All rights reserved First published online as a Review in Advance on June 4,
DNA Structure and Function
 DNA Structure and Function Nucleotide Structure 1. 5-C sugar RNA ribose DNA deoxyribose 2. Nitrogenous Base N attaches to 1 C of sugar Double or single ring Four Bases Adenine, Guanine, Thymine, Cytosine
A Complex Suite of Forces Drives Gene Traffic from Drosophila X Chromosomes
 Complex Suite of Forces Drives Gene Traffic from Drosophila Chromosomes Richard P. Meisel,* Mira V. Han,à and Matthew W. Hahnà *Department of Biology and Graduate Program in Genetics, The Pennsylvania
MEIOSIS. KEY CONCEPT Gametes have half the number of chromosomes that body cells have.
 MEIOSIS MEIOSIS KEY CONCEPT Gametes have half the number of chromosomes that body cells have. MEIOSIS : CELL TYPES You have Body cells and Gametes Body cells are also called somatic cells. Germ cells develop
How robust are the predictions of the W-F Model?
 How robust are the predictions of the W-F Model? As simplistic as the Wright-Fisher model may be, it accurately describes the behavior of many other models incorporating additional complexity. Many population
Lecture 12 - Meiosis
 Lecture 12 - Meiosis In this lecture Types of reproduction Alternation of generations Homologous chromosomes and alleles Meiosis mechanism Sources of genetic variation Meiosis and Mitosis Mitosis the production
Name: Period: EOC Review Part F Outline
 Name: Period: EOC Review Part F Outline Mitosis and Meiosis SC.912.L.16.17 Compare and contrast mitosis and meiosis and relate to the processes of sexual and asexual reproduction and their consequences
9 Genetic diversity and adaptation Support. AQA Biology. Genetic diversity and adaptation. Specification reference. Learning objectives.
 Genetic diversity and adaptation Specification reference 3.4.3 3.4.4 Learning objectives After completing this worksheet you should be able to: understand how meiosis produces haploid gametes know how
1. The diagram below shows two processes (A and B) involved in sexual reproduction in plants and animals.
 involved in sexual reproduction in plants and animals.") 1. The diagram below shows two processes (A and B) involved in sexual reproduction in plants and animals. Which statement best explains how these processes often produce offspring that have traits not
1. The diagram below shows two processes (A and B) involved in sexual reproduction in plants and animals. Which statement best explains how these processes often produce offspring that have traits not
Major questions of evolutionary genetics. Experimental tools of evolutionary genetics. Theoretical population genetics.
 Evolutionary Genetics (for Encyclopedia of Biodiversity) Sergey Gavrilets Departments of Ecology and Evolutionary Biology and Mathematics, University of Tennessee, Knoxville, TN 37996-6 USA Evolutionary
A. Correct! Genetically a female is XX, and has 22 pairs of autosomes.
 MCAT Biology - Problem Drill 08: Meiosis and Genetic Variability Question No. 1 of 10 1. A human female has pairs of autosomes and her sex chromosomes are. Question #01 (A) 22, XX. (B) 23, X. (C) 23, XX.
Reinforcement Unit 3 Resource Book. Meiosis and Mendel KEY CONCEPT Gametes have half the number of chromosomes that body cells have.
 6.1 CHROMOSOMES AND MEIOSIS KEY CONCEPT Gametes have half the number of chromosomes that body cells have. Your body is made of two basic cell types. One basic type are somatic cells, also called body cells,
Objective 3.01 (DNA, RNA and Protein Synthesis)
") Objective 3.01 (DNA, RNA and Protein Synthesis) DNA Structure o Discovered by Watson and Crick o Double-stranded o Shape is a double helix (twisted ladder) o Made of chains of nucleotides: o Has four types
Objective 3.01 (DNA, RNA and Protein Synthesis) DNA Structure o Discovered by Watson and Crick o Double-stranded o Shape is a double helix (twisted ladder) o Made of chains of nucleotides: o Has four types
Chapter 13: Meiosis and Sexual Life Cycles Overview: Hereditary Similarity and Variation
 Chapter 13: Meiosis and Sexual Life Cycles Overview: Hereditary Similarity and Variation Living organisms Are distinguished by their ability to reproduce their own kind Biology, 7 th Edition Neil Campbell
Meiosis B-4.5. Summarize the characteristics of the phases of meiosis I and meiosis II.
 Meiosis B-4.5 Summarize the characteristics of the phases of meiosis I and meiosis II. Key Concepts Daughter cells Diploid Haploid Zygote Gamete Meiosis I vs. Meiosis II What You Already Know This concept
Mitosis & Meiosis. PPT Questions. 4. Why must each new cell get a complete copy of the original cell s DNA?
 1. From where do new cells arise? Mitosis & Meiosis PPT Questions 2. Why does the body constantly make new cells? 3. Is cell division the same in all cells? Explain. 4. Why must each new cell get a complete
Lecture Notes: BIOL2007 Molecular Evolution
 Lecture Notes: BIOL2007 Molecular Evolution Kanchon Dasmahapatra (k.dasmahapatra@ucl.ac.uk) Introduction By now we all are familiar and understand, or think we understand, how evolution works on traits
Reproduction and Evolution Practice Exam
 Reproduction and Evolution Practice Exam Topics: Genetic concepts from the lecture notes including; o Mitosis and Meiosis, Homologous Chromosomes, Haploid vs Diploid cells Reproductive Strategies Heaviest
Ladies and Gentlemen.. The King of Rock and Roll
 Ladies and Gentlemen.. The King of Rock and Roll Learning Objectives: The student is able to construct an explanation, using visual representations or narratives, as to how DNA in chromosomes is transmitted
Quiz Section 4 Molecular analysis of inheritance: An amphibian puzzle
 Genome 371, Autumn 2018 Quiz Section 4 Molecular analysis of inheritance: An amphibian puzzle Goals: To illustrate how molecular tools can be used to track inheritance. In this particular example, we will
Ch. 13 Meiosis & Sexual Life Cycles
 Introduction Ch. 13 Meiosis & Sexual Life Cycles 2004-05 Living organisms are distinguished by their ability to reproduce their own kind. -Offspring resemble their parents more than they do less closely
Why do cells divide? Why do cells divide? What would happen if they didn t?
 1 of 41 Boardworks Ltd 2007 2 of 41 Boardworks Ltd 2007 Why do cells divide? 3 of 41 Boardworks Ltd 2007 Why do cells divide? What would happen if they didn t? Organisms would only ever exist as single
Cancer: DNA Synthesis, Mitosis, and Meiosis
 Chapter 5 Cancer: DNA Synthesis, Mitosis, and Meiosis Copyright 2007 Pearson Copyright Prentice Hall, 2007 Inc. Pearson Prentice Hall, Inc. 1 5.6 Meiosis Another form of cell division, meiosis, occurs
Meiosis and Sexual Life Cycles
 CAMPBELL BIOLOGY IN FOCUS URRY CAIN WASSERMAN MINORSKY REECE 10 Meiosis and Sexual Life Cycles Lecture Presentations by Kathleen Fitzpatrick and Nicole Tunbridge, Simon Fraser University SECOND EDITION
Chapter 6 Meiosis and Mendel
 UNIT 3 GENETICS Chapter 6 Meiosis and Mendel 1 hairy ears (hypertrichosis)- due to holandric gene. (Y chromosome)-only occurs in males. Appears in all sons. 2 Polydactyly- having extra fingers Wendy the
Meiosis and Sexual Life Cycles
 Chapter 13 Meiosis and Sexual Life Cycles Lecture Outline Overview: Variations on a Theme Living organisms are distinguished by their ability to reproduce their own kind. Offspring resemble their parents
Group activities: Making animal model of human behaviors e.g. Wine preference model in mice
 Lecture schedule 3/30 Natural selection of genes and behaviors 4/01 Mouse genetic approaches to behavior 4/06 Gene-knockout and Transgenic technology 4/08 Experimental methods for measuring behaviors 4/13
Darwinian Selection. Chapter 7 Selection I 12/5/14. v evolution vs. natural selection? v evolution. v natural selection
 Chapter 7 Selection I Selection in Haploids Selection in Diploids Mutation-Selection Balance Darwinian Selection v evolution vs. natural selection? v evolution ² descent with modification ² change in allele
9-4 Meiosis Meiosis. Slide 1 of 35
 9-4 Meiosis 11-4 Meiosis 1 of 35 11-4 Meiosis Each organism must inherit a single copy of every gene from each of its parents. Gametes are formed by a process that separates the two sets of genes so that
Interphase & Cell Division
 1 Interphase & Cell Division 2 G1 = cell grows and carries out its normal job. S phase = DNA is copied (replicated/duplicated) G2 = Cell prepares for division 3 During mitosis, the nuclear membrane breaks
QQ 10/5/18 Copy the following into notebook:
 Chapter 13- Meiosis QQ 10/5/18 Copy the following into notebook: Similarities: 1. 2. 3. 4. 5. Differences: 1. 2. 3. 4. 5. Figure 13.1 Living organisms are distinguished by their ability to reproduce their
Outline. Genome Evolution. Genome. Genome Architecture. Constraints on Genome Evolution. New Evolutionary Synthesis 11/8/16
 Genome Evolution Outline 1. What: Patterns of Genome Evolution Carol Eunmi Lee Evolution 410 University of Wisconsin 2. Why? Evolution of Genome Complexity and the interaction between Natural Selection
Agenda. 1. Lesson Learning Goals 2. Meiosis 3. Meiosis Bingo
 Meiosis SBI 3U Agenda 1. Lesson Learning Goals 2. Meiosis 3. Meiosis Bingo Learning Goals By the end of today s lesson, you will be able: To use proper vocabulary related to this unit, including meiosis,
CHAPTER 23 THE EVOLUTIONS OF POPULATIONS. Section C: Genetic Variation, the Substrate for Natural Selection
 CHAPTER 23 THE EVOLUTIONS OF POPULATIONS Section C: Genetic Variation, the Substrate for Natural Selection 1. Genetic variation occurs within and between populations 2. Mutation and sexual recombination
Biology. Chapter 12. Meiosis and Sexual Reproduction. Concepts and Applications 9e Starr Evers Starr. Cengage Learning 2015
 Biology Concepts and Applications 9e Starr Evers Starr Chapter 12 Meiosis and Sexual Reproduction 12.1 Why Sex? In asexual reproduction, a single individual gives rise to offspring that are identical to
KEY: Chapter 9 Genetics of Animal Breeding.
 KEY: Chapter 9 Genetics of Animal Breeding. Answer each question using the reading assigned to you. You can access this information by clicking on the following URL: https://drive.google.com/a/meeker.k12.co.us/file/d/0b1yf08xgyhnad08xugxsnfvba28/edit?usp=sh
11-4 Meiosis Meiosis. Slide 1 of 35. Copyright Pearson Prentice Hall
 11-4 Meiosis 1 of 35 Each organism must inherit a single copy of every gene from each of its parents. Gametes are formed by a process that separates the two sets of genes so that each gamete ends up with
Meiosis and Sexual Life Cycles
 13 Meiosis and Sexual Life Cycles Lecture Presentation by Nicole Tunbridge and Kathleen Fitzpatrick CAMPBELL BIOLOGY TENTH EDITION Reece Urry Cain Wasserman Minorsky Jackson Variations on a Theme Living
Chapter 16: Reconstructing and Using Phylogenies
 Chapter Review 1. Use the phylogenetic tree shown at the right to complete the following. a. Explain how many clades are indicated: Three: (1) chimpanzee/human, (2) chimpanzee/ human/gorilla, and (3)chimpanzee/human/
CELL BIOLOGY - CLUTCH CH MEIOSIS AND SEXUAL REPRODUCTION.
 !! www.clutchprep.com CONCEPT: BASICS OF MEIOTIC GENETICS Sexual reproduction involves mixing DNA from individuals to produce genetically distinct offspring Beneficial because it allows for genetic diversity
Meiosis. Introduction. A life cycle is the generation-to-generation sequence of stages in the reproductive history of an organism.
 Meiosis The pomegranate (Punica granatum) is believed to have originated near Iran and southern Afghanistan. The flowers are bright red with five petals. After the flower is fertilized with pollen the
BIOLOGY - CLUTCH CH.13 - MEIOSIS.
 !! www.clutchprep.com CONCEPT: SEXUAL REPRODUCTION Meiosis is a special type of cell division that occurs as part of the sexual life cycle of eukaryotes Sexual reproduction parents donate a unique mixture
Binary fission occurs in prokaryotes. parent cell. DNA duplicates. cell begins to divide. daughter cells
 Chapter 11 Chapter 11 Some eukaryotes reproduce through mitosis. Binary fission is similar in function to mitosis. Asexual reproduction is the creation of offspring from a single parent. Binary fission
Bustamante et al., Supplementary Nature Manuscript # 1 out of 9 Information #
 Bustamante et al., Supplementary Nature Manuscript # 1 out of 9 Details of PRF Methodology In the Poisson Random Field PRF) model, it is assumed that non-synonymous mutations at a given gene are either
Meiosis & Sexual Reproduction. AP Biology
 Meiosis & Sexual Reproduction Cell division / Asexual reproduction! Mitosis " produce cells with same information! identical daughter cells " exact copies! clones " same amount of DNA! same number of chromosomes!
BIOLOGY 111. CHAPTER 5: Chromosomes and Inheritance
 BIOLOGY 111 CHAPTER 5: Chromosomes and Inheritance Chromosomes and Inheritance Learning Outcomes 5.1 Differentiate between sexual and asexual reproduction in terms of the genetic variation of the offspring.
4/6/2014. Chromosome Number
 Meiosis 1of 35 Each organism must inherit a single copy of every gene from each of its parents. Gametes are formed by a process that separates the two sets of genes so that each gamete ends up with just
Name Period. 3. How many rounds of DNA replication and cell division occur during meiosis?
 Name Period GENERAL BIOLOGY Second Semester Study Guide Chapters 3, 4, 5, 6, 11, 14, 16, 17, 18 and 19. SEXUAL REPRODUCTION AND MEIOSIS 1. What is the purpose of meiosis? 2. Distinguish between diploid
Biol. 303 EXAM I 9/22/08 Name
 Biol. 303 EXAM I 9/22/08 Name -------------------------------------------------------------------------------------------------------------- This exam consists of 40 multiple choice questions worth 2.5
Meiosis and Life Cycles - 1
 Meiosis and Life Cycles - 1 We have just finished looking at the process of mitosis, a process that produces cells genetically identical to the original cell. Mitosis ensures that each cell of an organism
Meiosis and Sexual Life Cycles
 Chapter 13 Meiosis and Sexual Life Cycles Lecture Outline Overview Living organisms are distinguished by their ability to reproduce their own kind. Offspring resemble their parents more than they do less
Introduction to Meiosis Many organisms pass their genes to their offspring through.
 MEIOSIS NAME DATE 1 Introduction to Meiosis http://vcell.ndsu.nodak.edu/animations/meiosis/movie-flash.htm Many organisms pass their genes to their offspring through. This begins when two gametes unite
Biology EOC Review Study Questions
 Biology EOC Review Study Questions Microscopes and Characteristics of Life 1. How do you calculate total magnification on a compound light microscope? 2. What is the basic building block of all living
Linking levels of selection with genetic modifiers
 Linking levels of selection with genetic modifiers Sally Otto Department of Zoology & Biodiversity Research Centre University of British Columbia @sarperotto @sse_evolution @sse.evolution Sally Otto Department
Meiosis and Sexual Life Cycles
 Chapter 13 Meiosis and Sexual Life Cycles Lecture Outline Overview: Variations on a Theme Living organisms are distinguished by their ability to reproduce their own kind. Offspring resemble their parents
KEY CONCEPT Cells have distinct phases of growth, reproduction, and normal functions.
 5.1 10.1 The Cell Cell Growth Cycle KEY CONCEPT Cells have distinct phases of growth, reproduction, and normal functions. 5.1 10.1 The Cell Cell Growth Cycle Why must cells divide? Growth and Repair -
Mitosis and Meiosis for AP Biology
 Mitosis and Meiosis for AP Biology by Mark Anestis Practice problems for these concepts can be found at : Cell Division Review Questions for AP Biology Mitosis During mitosis, the fourth stage of the cell
2. Which of the following are NOT prokaryotes? A) eubacteria B) archaea C) viruses D) ancient bacteria
 eubacteria B) archaea C) viruses D) ancient bacteria") 1. Which of the following statements is FALSE? A) Errors in chromosome separation are rarely a problem for an organism. B) Errors in chromosome separation can result in a miscarriage. C) Errors in chromosome
1. Which of the following statements is FALSE? A) Errors in chromosome separation are rarely a problem for an organism. B) Errors in chromosome separation can result in a miscarriage. C) Errors in chromosome
Biology I Level - 2nd Semester Final Review
 Biology I Level - 2nd Semester Final Review The 2 nd Semester Final encompasses all material that was discussed during second semester. It s important that you review ALL notes and worksheets from the
A dynamic view of sex chromosome evolution Doris Bachtrog
 A dynamic view of sex chromosome evolution Doris Bachtrog Sex chromosomes are derived from ordinary autosomes. The X chromosome is thought to maintain most of its ancestral genes over evolutionary time,
GENETICS - CLUTCH CH.1 INTRODUCTION TO GENETICS.
 !! www.clutchprep.com CONCEPT: HISTORY OF GENETICS The earliest use of genetics was through of plants and animals (8000-1000 B.C.) Selective breeding (artificial selection) is the process of breeding organisms
The genomic rate of adaptive evolution
 Review TRENDS in Ecology and Evolution Vol.xxx No.x Full text provided by The genomic rate of adaptive evolution Adam Eyre-Walker National Evolutionary Synthesis Center, Durham, NC 27705, USA Centre for
Lesson Overview Meiosis
 11.4 As geneticists in the early 1900s applied Mendel s laws, they wondered where genes might be located. They expected genes to be carried on structures inside the cell, but which structures? What cellular
What is Meiosis? Form of nuclear division Creates FOUR haploid cells from ONE diploid cell. Two rounds of cell division=meiosis I & Meiosis II
 Process of Meiosis What is Meiosis? Form of nuclear division Creates FOUR haploid cells from ONE diploid cell Diploid=2N=46 chromosomes (somatic cell) Haploid=1N=23 chromosomes (sex cells) Two rounds of
There are 3 parts to this exam. Use your time efficiently and be sure to put your name on the top of each page.
 EVOLUTIONARY BIOLOGY EXAM #1 Fall 2017 There are 3 parts to this exam. Use your time efficiently and be sure to put your name on the top of each page. Part I. True (T) or False (F) (2 points each). Circle
Essentials of Genetics, 8e (Klug) Chapter 2 Mitosis and Meiosis
 Chapter 2 Mitosis and Meiosis") Essentials of Genetics, 8e (Klug) Chapter 2 Mitosis and Meiosis 1) During interphase of the cell cycle,. A) DNA recombines B) sister chromatids move to opposite poles C) the nuclear membrane disappears
Essentials of Genetics, 8e (Klug) Chapter 2 Mitosis and Meiosis 1) During interphase of the cell cycle,. A) DNA recombines B) sister chromatids move to opposite poles C) the nuclear membrane disappears
11-4 Meiosis Chromosome Number Slide 1 of 35
 Each organism must inherit a single copy of every gene from each of its parents. Gametes are formed by a process that separates the two sets of genes so that each gamete ends up with just one set. Chromosome