BMC Evolutionary Biology
|
|
|
- Julie Walton
- 5 years ago
- Views:
Transcription

1 BMC Evolutionary Biology This Provisional PDF corresponds to the article as it appeared upon acceptance. Fully formatted PDF and full text (HTML) versions will be made available soon. Giant viruses coexisted with the cellular ancestors and represent a distinct supergroup along with superkingdoms Archaea, Bacteria and Eukarya BMC Evolutionary Biology 2012, 12:156 doi: / Arshan Nasir (arshan.nasir@gmail.com) Kyung Mo Kim (kmkim@kribb.re.kr) Gustavo Caetano-Anolles (gca@illinois.edu) ISSN Article type Research article Submission date 4 May 2012 Acceptance date 22 August 2012 Publication date 24 August 2012 Article URL Like all articles in BMC journals, this peer-reviewed article can be downloaded, printed and distributed freely for any purposes (see copyright notice below). Articles in BMC journals are listed in PubMed and archived at PubMed Central. For information about publishing your research in BMC journals or any BioMed Central journal, go to Nasir et al. ; licensee BioMed Central Ltd. This is an open access article distributed under the terms of the Creative Commons Attribution License ( which permits unrestricted use, distribution, and reproduction in any medium, provided the original work is properly cited.
2 Giant viruses coexisted with the cellular ancestors and represent a distinct supergroup along with superkingdoms Archaea, Bacteria and Eukarya Abstract Background Arshan Nasir 1 anasir@illinois.edu Kyung Mo Kim 1,2 kmkim@kribb.re.kr Gustavo Caetano-Anolles 1* * Corresponding author gca@illinois.edu 1 Evolutionary Bioinformatics Laboratory, Department of Crop Science, University of Illinois, Urbana, IL 61801, USA 2 Korean Bioinformation Center, Korea Research Institute of Bioscience and Biotechnology, 111 Gwahangno, Yuseong-gu, Daejeon , Korea The discovery of giant viruses with genome and physical size comparable to cellular organisms, remnants of protein translation machinery and virus-specific parasites (virophages) have raised intriguing questions about their origin. Evidence advocates for their inclusion into global phylogenomic studies and their consideration as a distinct and ancient form of life. Results Here we reconstruct phylogenies describing the evolution of proteomes and protein domain structures of cellular organisms and double-stranded DNA viruses with medium-to-very-large proteomes (giant viruses). Trees of proteomes define viruses as a fourth supergroup along with superkingdoms Archaea, Bacteria, and Eukarya. Trees of domains indicate they have evolved via massive and primordial reductive evolutionary processes. The distribution of domain structures suggests giant viruses harbor a significant number of protein domains including those with no cellular representation. The genomic and structural diversity embedded in the viral proteomes is comparable to the cellular proteomes of organisms with parasitic lifestyles. Since viral domains are widespread among cellular species, we propose that viruses mediate gene transfer between cells and crucially enhance biodiversity.
3 Conclusions Results call for a change in the way viruses are perceived. They likely represent a distinct form of life that either predated or coexisted with the last universal common ancestor (LUCA) and constitute a very crucial part of our planet s biosphere. Background The last few years have seen a dramatic increase in our knowledge of viruses particularly boosted by the discovery of giant viruses such as Acanthameoba polyphaga mimivirus [1], Acanthamoeba castellanii mamavirus [2], and Megavirus chilensis (Megavirus) [3]. Mimivirus is truly a Gulliver among the Lilliputians [4] as its sheer physical (~750 nm in diameter) and genomic (1.2 Mb, 1,018 genes) size exceeds those of the vast majority of viruses and dozens of cellular species, including numerous parasitic bacteria [5-8]. Mamavirus, an even bigger relative of mimivirus, was isolated from a cooling tower in Paris, and found associated with a new type of satellite virus, Sputnik [2]. Sputnik appears to be a virophage, a parasite very much alike those of cellular organisms [9]. Both mimiviruses and mamaviruses have been identified as a new family (mimiviridae) of an apparently large monophyletic group known as the Nucleocytoplasmic Large DNA viruses (NCLDV), which already includes the Poxviridae, Irido/Ascoviridae, Phycodnaviridae, Marseilleviridae, and Asfarviridae [10,11]. Megavirus was isolated from Chile and is the largest virus known to date (1.26 Mb, 1,120 genes) [3]. Both mimiviruses and megaviruses encode for genes that were never encountered in viral genomes before, such as genes related to DNA repair, protein folding and most surprisingly protein translation [3,5]. Some other fascinating features include the unique Stargate DNA entry-exit mechanism [12] and the presence of highly conserved early promoter elements [3,13]. These features make giant viruses the most complex viruses known to date, reviving debates about their origin and evolution [4,7,11,14-18]. Some scientists believe mimiviruses are representatives of a distinct supergroup that is united by the presence of capsid (i.e., protein structures that enclose viral genetic material and are found in many diverse viruses) [15], and should be placed in the tree of life (ToL) along with superkingdoms, Archaea, Bacteria and Eukarya [19,20]. They propose that mimiviruses (and megaviruses) evolved from a more complex ancestral virus by means of reductive evolution (i.e., by the progressive loss of an evolving gene set) [3]. Others believe that the unusual set of mimiviral genes was acquired from its ameobal host by horizontal gene transfer (HGT) [18,21,22]. In this study, we take advantage of molecular processes occurring at higher and conserved levels of the structural hierarchy [23] and make statements about the evolution of cellular organisms and viruses that have large genomes. These molecular processes are responsible for the redundant appearance and accumulation of modules in the structure of living organisms [e.g., how many times particular protein domains are present in proteomes (i.e., genomic abundance)] [24]. The structural hierarchy defined in the Structural Classification of Proteins (SCOP) groups protein domains with high sequence conservation (>30 % identities) into fold families (FFs), FFs with structural and functional evidence of common origin into fold superfamilies (FSFs), FSFs with common topologies (i.e., same major secondary structure in same arrangement) into folds (Fs) and Fs with similar secondary structure (e.g., alpha helix, beta sheet etc.) into protein classes [25,26]. A total of 110,800 domains that are indexed in SCOP ver correspond to 38,221 protein data bank (PDB) entries and are grouped into 1,195 Fs, 1,962 FSFs and 3,902 FFs. In contrast, the number of protein
4 sequence entries in UniProtKB/SwissProt is more than half a million (535,698 entries as of 04/18/2012). The relatively limited number of structural designs suggests that structure space is finite and evolutionarily more conserved than sequence space [23,27]. Because domains defined at higher levels of SCOP classification (i.e., FSFs) exhibit higher levels of evolutionary conservation than domains defined at the lower fold family (FF) or sequence levels, they make useful tools (phylogenetic characters) when studying the evolution of protein domains and organisms [28,29]. This focus on structure as general evolutionary principle of biology offers several advantages over standard phylogenetic methods and overcomes important limitations imposed by the violation of assumptions that occur when attempting to extract deep phylogenetic signal present in molecular sequence data [24]. For example, phylogenomic trees derived from genomic abundance counts of FF and FSF domains [28,30] are less prone to the effects of HGT as shown in a number of studies [29,31-34] and do not require computation of sequence alignment, making them free from the problems resulting from characters that are not applicable to data sets (i.e., insertion/deletions in sequence alignment) [35,36]. Trees also sample hundreds of proteomes and the set of entire FFs and FSFs. Thus, taxa are finite and insensitive to taxon sampling problems. More importantly tree reconstruction is free from the violations of character independence that plague sequence analysis because of the mere existence of molecular structure [37]. The phylogenomic analysis of structure has been used previously to reconstruct ToLs and reveal the early divergence of Archaea relative to Bacteria and Eukarya [28-30], as well as reductive trends in the proteomes of cellular organisms [28,38]. The structural make up of the last universal common ancestor (LUCA) of life was also reconstructed [29]. Molecules and planetary events (inferred from geology and paleobiology) were linked with a clock of folds [39]. Phylogenomic methods also uncovered the origin and history of ribosomes [40], among many other studies [41-46]. Here we make evolutionary statements from a census of abundance of 1,830 FSFs (defined in SCOP ver. 1.75) in a total of 1,037 proteomes. This total dataset included completely sequenced proteomes from 652 Bacteria, 259 Eukarya, 70 Archaea and 56 viruses. For the viral supergroup, we sampled double-stranded DNA (dsdna) viruses with medium-to-very large proteomes (mainly NCLDV) since they harbor large genomes (i.e., giant viruses) and apportion maximum structural and genetic diversity to the virosphere (i.e., the group of all viruses) [47]. We test whether giant viruses follow the same patterns of reductive evolution we have seen in the cellular proteomes [28,38]. We also explore if they mediate transfer of domains between cells, enhancing planetary biodiversity and acting as source of new fold structures [47]. Finally, we place sampled viruses in a universal tree of life (utol) and propose they embody a new and ancient supergroup that either predated or coexisted with LUCA. This supergroup experienced massive gene loss very early in evolution resulting in a transition to the parasitic lifestyle. Methods Data retrieval We downloaded the FSF assignments for a total of 981 organisms with publically available sequenced genomes (70 Archaea, 652 Bacteria, and 259 Eukarya) from the SUPERFAMILY ver MySQL database (release: 08/29/2010)[48,49]. We retrieved the protein sequences encoded by 56 viral genomes including 51 NCLDV and 5 viruses from Archaea, Bacteria and Eukarya (united by the presence of capsid) from the NCBI viral genome resource homepage (link: and assigned structural domains corresponding to 1,830 FSFs using the hidden Markov Models (HMMs)
5 of structural recognition in SUPERFAMILY at a probability cutoff E value of [50]. This defined a total dataset of 1,037 proteomes (56 Viruses, 70 Archaea, 652 Bacteria, and 259 Eukarya) with a total FSF repertoire of 1,739 FSFs (91 out of 1,830 FSFs had no representation in our dataset and were excluded from the analysis). In these studies, domains were identified using concise classification strings (css) (e.g., c , where c represents the protein class, 26 the F, 1 the FSF and 5 the FF). Phylogenomic analysis We generated rooted phylogenomic trees describing the evolution of protein domains (ToDs) and proteomes (ToPs) using the genomic abundance counts of FSFs as phylogenomic characters [41,43]. We began by counting the number of times each FSF was present in every proteome for the total dataset. We defined this count as the genomic abundance value (g) and presented these values in a 1,037 * 1,739 ([total number of proteomes] x [total number of FSFs]) matrix. Because large genomes (e.g., Homo sapiens) are expected to have higher counts of FSFs, g values can range from 0 (absent) to thousands [41,51]. In order to account for unequal genome sizes and large variances, and because most phylogenetic software allow characters states only up to 32, we normalized the g values to a 0 23 scale in an alphanumeric format (0 9 and A-N) using the following formula [41,51]. g ab_norm = Round [ln(g ab + 1)/(g max + 1) * 23 ] Where, a and b represent an FSF and a proteome respectively; g ab describes the g value of the FSF a in the proteome b; g max is the maximum g value in the matrix; Round function normalizes the g ab value taking into account the g max and standardizes the values to a 0 23 scale (g ab_norm ) [41,51]. The normalization results in 24 transformed values that are compatible with PAUP* ver. 4.0b10 [52] and represent linearly ordered multistate phylogenetic character states. For the ToDs, we declared N (maximum value) as the ancestral character state under the assumption that the most abundant FSF (character N) appeared first in evolution. We expect older FSFs to be abundant as gene duplications and rearrangements increase proteomic repertoires. Under this scenario, older FSFs have more time to increase their representations and are reused as modules for the generation of new domain architectures [30,46]. For this reconstruction, FSFs were treated as taxa and proteomes as characters. For the ToPs, we declared 0 (minimum value) as the ancestral character state assuming that the primordial proteome had a simpler organization and there was a progressive trend towards organismal complexity. Under this model, we assume that proteomic growth is governed by the accumulation of new domains and using old architectures in various combinations to enhance proteomic diversity [30,46]. In order to improve ToP reconstructions, we manually studied the lifestyles of cellular organisms in the total dataset and excluded organisms exhibiting parasitic (P) and obligate parasitic (OP) lifestyles, as their inclusion is known to affect the topology of the phylogenetic tree [29]. We also sampled 50 proteomes equally from cells and dsdna viruses to reduce any effect of the large number of bacterial proteomes in our dataset. For the reconstructions of ToPs, data matrix was transposed to represent proteomes as taxa and FSFs as characters. Ancestral states were declared using the ANCSTATE command and trees were rooted using the Lundberg method which does not require to specify the outgroup taxa but places the root at the most parsimonious location [53]. Maximum Parsimony (MP) was used to search for the best possible tree. MP is a meaningful way to analyze FSF data as we pool the set of entire FSFs into a single phylogenetic analysis. Therefore, our dataset
6 encompasses many different genes that are changing with different evolutionary rates [54]. We note that MP gives superior performance when evolutionary rate is variable for the set of characters and approximates maximum likelihood (ML) when using large numbers of multistate characters (convergence is less likely with large number of character states) [54]. To evaluate the reliability of phylogenetic trees, we carried out a bootstrap analysis with 1,000 replicates. From the ToDs, we calculated the relative age of each FSF defined as the node distance (nd) using a PERL script that counts the number of nodes from a hypothetical ancestral FSF at the base of the tree to each leaf and provides it in a relative 0 1 scale. In order to evaluate homoplasy (i.e., conflict between data and tree) affecting the ToPs, retention indexes (r i ) were calculated for individual FSF characters using the DIAG option in PAUP* [55]. r i portrays processes other than vertical inheritance (i.e., convergent evolution and HGT) of characters (FSFs) on a relative scale of 0 1 and is insensitive to the large number of taxa [55]. Higher r i values indicate a better fit of characters (FSFs) to the phylogeny and support vertical inheritance. Trees were visualized using Dendroscope ver. 2.4 [56]. Reconstruction of network trees We generated network trees for 200 proteomes sampled equally from Archaea, Bacteria, Eukarya and the giant viruses. Network trees were constructed using the NeighborNet algorithm [57] implemented in the SplitsTree4 package [58]. The presence/absence matrix for a total of 1,739 FSFs was used as characters to describe the 200 taxa (the abundance matrix was incompatible with the software). Thus taxa were treated as binary sequences where 1 and 0 represented presence and absence of FSFs, respectively. SplitsTree4 evaluates each nonconstant column in the matrix and creates a split of the taxon set. For example, if an FSF is present only in Archaea and Bacteria, but absent from Eukarya and viruses then the taxa will be partitioned into two sets i.e., (Archaea, Bacteria) and (Eukarya, viruses). The algorithm operates by first generating a distance matrix that is used to infer the set of splits for the given taxa. The set of splits is visualized as a network that gives a generalized representation of the phylogeny. For this exercise, distances were computed using the UncorrectedP method that calculates the fraction of variable positions between any two taxa. The reliability of Splits was evaluated by 1,000 bootstrap replicates. Distribution of FSF domains in organismal groups In order to evaluate the spread/popularity of FSFs across the three superkingdoms, Archaea (A), Bacteria (B) and Eukarya (E), and the viral supergroup (V) (which we collectively refer to as supergroups but reserve the word superkingdom for cellular supergroups), we assigned FSFs appearing in all supergroups to the ABEV category, those present in all but one supergroup to the ABE, AEV, BEV, and ABV categories, those present in two supergroups to the AB, AE, AV, BE, BV, and EV categories, and those present in only one supergroup to the A, B, E, and V categories (these individual categories will be referred to as taxonomic groups hereinafter). We used a distribution index (f) to describe the popularity of FSFs across all the proteomes. This index ranges from 0 to 1 and represents the fraction of proteomes harboring a particular FSF [28]. An f value of 1 indicates that a particular FSF is present in all the proteomes while a value close to 0 suggests it is present in very few proteomes or absent (i.e., probably lost from a lineage) [28].
7 Estimating the bias in the spread of viral FSFs among cellular proteomes The total repertoire of FSFs present in each superkingdom was split into two components: (i) the set of FSFs shared with the viral supergroup, and (ii) the set of FSFs of that superkingdom (shared or not shared with other superkingdoms). The f index for both components was represented in a boxplot generated using programming implementations in R ver Enrichment of taxonomic groups with viral FSFs In order to estimate which taxonomic groups were enriched with viral FSFs, we compared the counts of FSFs in cellular taxonomic groups (background) against the viral taxonomic groups (sample). The probability of enrichment of a particular taxonomic group was calculated using the hypergeometric distribution and the equation [29,32]: M N M P X k k n k a a!, where N b b! a b! n Where, M indicates the number of FSFs in the background; k indicates the number of FSFs in the sample; N is the total number of FSFs of the two sets; n represents the total number of FSFs in sample; and P(X = k) is the probability that implies a chance that a random variable X has k FSFs for a given taxonomic group [29]. Referring to the equation above and previous literature [29,32], we calculated P values for the individual sub-categories that had k/n larger (over-represented) or smaller (under-represented) than M/N and evaluated statistical significance with 95 % confidence level (P < 0.05). Functional annotation of viral FSFs We used the functional annotation scheme described by Vogel and Chothia to assign molecular functions to viral FSFs [59-61]. This annotation is based on one-to-one mapping between FSFs and molecular functions and utilized before to describe the functional make up of cellular proteomes [27]. Vogel divides molecular functions into 7 major categories including, Metabolism, Information, Intracellular processes (ICP), Extracellular processes (ECP), Regulation, General and Other. These major categories are further subdivided into 50 minor categories (Table 1). The classification scheme is based upon manual surveys and various online resources like Cluster of Orthologus Groups (COGs) and Gene Ontology (GO) databases [62,63]. For multifunctional FSFs, the most dominant function is assigned to the FSF, while the error rate is assessed to be <10 % for large FSFs and <20 % for all FSFs [59-61].
8 Table 1 Mapping between the major and minor functional categories described in [59-61] Major category Minor categories Metabolism Energy, Photosynthesis, E-transfer, Amino acids m/tr, Nitrogen m/tr, Nucleotide m/tr, Carbohydrate m/tr, Polysaccharide m/tr, Storage, Coenzyme m/tr, Lipid m/tr, Cell envelope m/tr, Secondary metabolism, Redox, Transferases, Other enzymes Information Chromatin structure, Translation, Transcription, DNA replication/repair, RNA processing, Nuclear structure Intracellular Cell cycle, Apoptosis, Phospholipid m/tr, Cell motility, Trafficking/secretion, Protein processes modification, Proteases, Ion m/tr, Transport Regulation RNA binding, m/tr, DNA-binding, Kinases/phosphatases, Signal transduction, Other regulatory function, Receptor activity General Small molecule binding, Ion binding, Lipid/membrane binding, Ligand binding, General, Protein interaction, Structural protein Other Unknown functions, viral proteins Extracellular Cell adhesion, Immune response, Blood clotting, Toxins/defense processes m/tr, metabolism and transport. Results The overlap between mimiviruses and parasitic microbes is significant The HMMs detected a large number of domains (4,679) and a rich repertoire of FSFs (304 distinct FSFs) in the medium-to-very-large viral proteomes we sampled (Table 2). Six out of these FSFs were viral-specific and had no representation in the cellular proteomes (Table 3). These viral-specific FSFs are responsible for functions unique to viruses, such as attachment to the host cell receptors and DNA, inhibition of caspases to trigger anti-apoptosis, and acting as major capsid proteins (Table 3). The median proteomic coverage (i.e., proteins with FSF assignments / total number of proteins) in viral proteomes was 34 %, while A. polyphaga mimivirus had the highest coverage (59 %)(Table 2). A comparison with the cellular supergroups (Additional file 1: Table S1) revealed that the proteomic coverage of mimivirus was higher than the median coverage in eukaryotes (55 %) but lower compared to the bacterial (66 %) and archaeal (61 %) proteomes. The range of assignments in cells varies from % in Eukarya, % in Bacteria and % in Archaea (Additional file 1: Table S1). We note that mimivirus overlaps with cellular species that are similar in genome size and lifestyles. For example, despite considerable proteomic coverage, mimiviral assignments were restricted to only 163 distinct FSFs, a rather poor repertoire when compared for example with FSFs present in the proteomes of free living (FL) organisms (ranging from 407 FSFs in Staphylothermus marinus to 1,084 in Capitella sp.). FSF number was however comparable to small organisms with reduced genomes or parasitic/symbiotic lifestyles [e.g., Guillardia theta (189 distinct FSFs), Nanoarchaeam equitans (211 FSFs) and Candidatus Hodgkinia cicadicola (115 FSFs)]. The average reuse level of mimiviral FSFs (total FSFs/distinct FSFs) was quite low as well (530/163 = 3.25) but still comparable to that of organisms with similar genome size or lifestyles (e.g., 3.03 in Staphylothermus marinus, 1.42 in Candidatus Hodgkinia cicadicola, 2.01 in Nanoarchaeam equitans, and 2.48 in Guillardia theta). In summary, a significant number of FSFs exist in the proteomes of dsdna viruses, including the ones that are not encoded by cells. Mimiviruses have a genome size comparable to numerous small bacteria and also share with them a very simple proteome. Both features overlap significantly with the parasitic unicellular organisms.
9 Table 2 List of dsdna viruses sampled along with family name, total number of proteins, number of total and unique FSFs detected by the SUPERFAMILY HMMs (Evalue cutoff of ) and proteomic coverage. # Common name Virus family No. of proteins Total FSFs detected Total distinct FSFs Proteomic coverage (%) 1 Human Adenovirus Adenoviridae Heliothis virescens Ascoviridae ascovirus 3e 3 Spodoptera frugiperda Ascoviridae ascovirus 1a 4 Trichoplusia ni ascovirus c Ascoviridae African swine fever virus Asfarviridae Pseudoalteromonas phage PM2 Corticoviridae Ambystoma tigrinum virus Iridoviridae Singapore grouper iridovirus Iridoviridae Infectious spleen and kidney Iridoviridae necrosis virus 10 Lymphocystis disease virus - Iridoviridae isolate China 11 Aedes taeniorhynchus Iridoviridae iridescent virus 12 Frog virus 3 Iridoviridae Invertebrate iridescent virus Iridoviridae Lymphocystis disease virus 1 Iridoviridae Soft-shelled turtle iridovirus Iridoviridae Acanthamoeba polyphaga Mimiviridae mimivirus 17 Marseillevirus Mimiviridae Acanthocystis turfacea Phycodnaviridae Chlorella virus 1 19 Emiliania huxleyi virus 86 Phycodnaviridae Feldmannia species virus Phycodnaviridae Paramecium bursaria Phycodnaviridae Chlorella virus 1 22 Paramecium bursaria Phycodnaviridae Chlorella virus AR Paramecium bursaria Phycodnaviridae Chlorella virus FR Paramecium bursaria Chlorella virus NY2A Phycodnaviridae Ectocarpus siliculosus virus Phycodnaviridae Ostreococcus tauri virus 1 Phycodnaviridae Ostreococcus virus OsV5 Phycodnaviridae Bovine papular stomatitis Poxviridae virus 29 Amsacta moorei Poxviridae entomopoxvirus 'L' 30 Camelpox virus Poxviridae Canarypox virus Poxviridae Cowpox virus Poxviridae Crocodilepox virus Poxviridae Deerpox virus W Poxviridae Ectromelia virus Poxviridae Fowlpox virus Poxviridae Goatpox virus Pellor Poxviridae
10 38 Lumpy skin disease virus Poxviridae NI Melanoplus sanguinipes Poxviridae entomopoxvirus 40 Molluscum contagiosum Poxviridae virus subtype 1 41 Monkeypox virus Zaire-96- Poxviridae I Myxoma virus Poxviridae Orf virus Poxviridae Pseudocowpox virus Poxviridae Rabbit fibroma virus Poxviridae Sheeppox virus Poxviridae Swinepox virus Poxviridae Tanapox virus Poxviridae Taterapox virus Poxviridae Vaccinica virus Poxviridae Variola virus Poxviridae Yaba monkey tumor virus Poxviridae Yaba-like disease virus Poxviridae Sulfolobus turreted Rudiviridae icosahedral virus 55 Bacillus phage Bam35c Tectiviridae Enterobacteria phage PRD1 Tectiviridae Table 3 Viral-specific FSFs and their molecular functions. 1 No. SCOP ID FSF ccs Description Function(s) b Adsorption protein P2 Attachment of phage to host conjugative DNA complex b.28.1 Baculovirus p35 protein Anti-apoptotic in infected insect cells by inhibiting caspases b.21.1 Virus attachment protein globular domain Binding selectively to cell surface receptors b Group II dsdna viruses VP Includes major capsid protein family a.54.1 Domain of early E2A DNA binding protein ADDBP C-terminal domain of the viral DNA binding protein g.51.1 Zn binding domain of ADDBP Binds to DNA and RNA & required for replication and transcription control. 1 Abbreviations: ID, identifier; ccs, concise classification string; The distribution of domain structures is biased but shows widespread representation of viral FSFs FSFs are not equally distributed in the proteomes of Archaea (A), Bacteria (B) and Eukarya (E), and viruses (V). In turn, FSFs exist that are uniquely present (groups A, B, E or V) or are shared by two (AB, AE, AV, BE, BV, EV), three (ABE, ABV, AEV, BEV) or all (ABEV). A Venn diagram (Figure 1A) describes the FSF distribution and highlights the differential enrichment of viral FSFs within these taxonomic groups. All cellular taxonomic groups share FSFs with the viral supergroup. ABE is the most populated with 557 FSFs, BE is the second largest with 291 FSFs and ABEV makes the third largest group with 229 FSFs. Eukaryotes have the highest number of supergroup-specific FSFs with 335 (~19 %) of the total FSFs present only in eukaryotes, followed by Bacteria, Archaea and Viruses with 163 (9.37 %), 22 (1.26 %) and 6 (0.345 %) supergroup-specific FSFs, respectively. This complete and unique distribution of FSFs in supergroups suggests that viruses with medium-to-very-large proteomes maintain considerable structural diversity despite their reduced genomes and parasitic lifestyle. The lower number of viral-specific FSFs can be explained by the fact that current shift in genomics is towards the sequencing of viral genomes with medical
11 importance [47]. The discovery and sequencing of viruses with large genomes (e.g., mimiviruses, megaviruses, and mamaviruses) is expected to add to the number of viralspecific structures. However, we expect that the relative patterns of FSF sharing with the cellular supergroups will remain conserved. Figure 1 History of protein domain structures. A. The Venn diagram shows distribution of FSFs in the taxonomic groups. Viral families included in the analysis: Adenoviridae, Ascoviridae, Asfarviridae, Corticoviridae, Iridoviridae, Marseilleviridae, Mimiviridae, Phycodnaviridae, Poxviridae, Rudiviridae, and Tectiviridae (see Table 2). B. Phylogenomic tree of protein domain structure describing the evolution of 1,739 FSFs in 1,037 proteomes (4,63,915 steps; consistency index CI = 0.051; retention index RI = 0.795; tree skewness g 1 = 0.127). Taxa are FSFs and characters are proteomes. Terminal leaves were not labeled, as they would not be legible. C. Distribution index (f, the number of species using an FSF/total number of species) of each FSF plotted against relative age (nd, number of nodes from the root/total number of nodes) for the four supergroups and individually for sampled viruses, Archaea, Bacteria, and Eukarya. D. Boxplots displaying distribution of FSFs in viral and cellular taxonomic groups with respect to age (nd). Vertical lines within each distribution represents group median. Dotted vertical lines represent important evolutionary events in the evolution of proteomes. Reductive evolutionary processes explain viral make up We generated trees of FSF domains from linearly ordered multistate phylogenetic features (FSFs as taxa and proteomes as characters) using maximum parsimony (MP) (Figure 1B). Trees of FSFs are rooted and highly unbalanced. However, the imbalance in trees results from the accumulation of protein domains in proteomes (i.e., genomic abundance) and portrays a biological process and not a phylogenetic artifact. From the FSF tree, we calculated the age of each FSF defined as the node distance (nd) [28]. nd is given on a relative 0 1 scale, with nd = 0 representing the origin of proteins and nd = 1 the present [28]. nd is a good proxy for the age of each FSF, is linearly proportional to geological time, follows a molecular clock and can be used to accurately date domains defined at FF and FSF levels [39]. When plotted against the fraction of proteomes encoding each FSF (i.e., distribution index; f), nd described unprecedented patterns in the evolution and origins of proteomes in the total dataset and individual supergroups (Figure 1C). We note that the majority of the viral FSFs originated either very early or very late, showing a clear bimodal pattern of domain appearance (red circles in the tree of Figure 1B and timelines of Figure 1C). The distribution of FSFs in the total dataset revealed that the most ancient FSF, the P-loop-containing NTP hydrolase (c.37.1) was present in all the proteomes (f = 1), including the viral proteomes (Figure 1C: Total). In total, 28 ancient FSFs had an f > and were present in almost all cellular and most viral proteomes. However, the representation of FSFs decreased in the timeline with increasing nd until f approached 0 at about nd = (Figure 1C:Total). The steady drop in the f value for ancestral FSFs (nd < 0.587) defines the reductive model of evolution for viral and microbial superkingdoms. We hypothesize that very early in the evolutionary timeline (nd < 0.587), f values smaller than 1 indicated loss of an existing FSF in few proteomes. In general, the probability for a few proteomes to loose an FSF was higher than the probability for the rest of the proteomes to discover the same FSF simultaneously (very much alike the probabilistic model for insertion and deletions in sequence alignment) [28]. This differential loss of structures probably triggered the early diversification of lineages emerging from an ancestral community (read
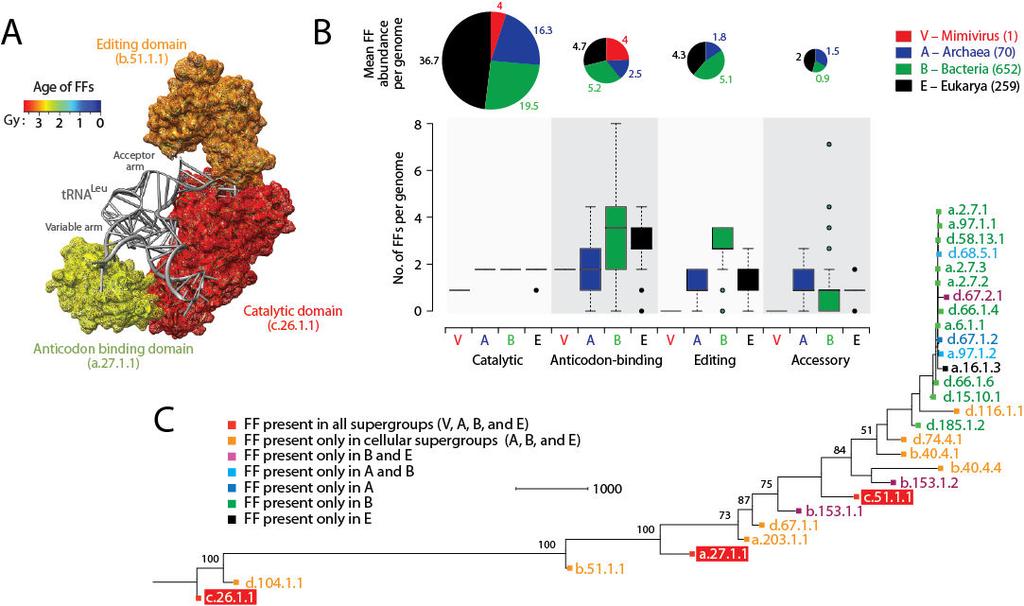
12 below) [28]. The f value approached a minimum at nd = Beyond this point, an opposite trend took place and the representation of FSFs in proteomes increased with increasing nd. We explain the increase in f value for younger FSFs (nd > 0.587) by evolutionary forces initiating the emergence of diversified supergroups (i.e., A, B, E, and V). These forces were primarily responsible for genome expansion in proteomes (especially in Eukarya) by evolutionary processes including gene shuffling, domain rearrangements, and HGT [28,46]. Distribution plots for the individual supergroups confirmed that, in general, the most ancient FSFs (nd = 0 0.4) were shared by most proteomes (Figures 1C). However, the representation of ancient FSFs decreased in time, first in the viral proteomes (Figure 1C: Viruses), and then in the cellular proteomes, starting with Archaea (Figure 1C: Archaea), then Bacteria (Figure 1C: Bacteria) and finally Eukarya (Figure 1C: Eukarya). The decrease in the representation of ancient FSFs (as explained above) is consistent with the reductive tendencies described previously for the cellular proteomes [28,38]. We propose that both sampled dsdna viruses and Archaea experienced high levels of genome reduction through loss of ancient FSFs. While in general, they maintained small proteomic representations of younger FSFs, FSF representation increased considerably in the eukaryal proteomes as f reached 1 again at nd =1 (primarily triggered by domain rearrangements) (Figure 1C: Eukarya) [46]. Appearance of supergroups The distribution of FSFs with respect to age (nd) (Figure 1D) revealed that ABEV was the most ancient taxonomic group with nd ranging between 0 1 and a median nd of This confirmed that the majority of the FSFs shared between giant viruses and cells were ancient, providing further support to the hypothesis of early coexistence of giant viruses with cellular ancestors. The appearance of the ABEV taxonomic group was followed by the ABE, BEV, and BE taxonomic groups, in that order. The late appearance of supergroup-specific taxonomic groups suggests giant viruses and Archaea diversified much later and concurrently with Eukarya (nd = ) (Figure 1D). Interestingly, the appearance of BV, EV and AV FSFs occurs soon after the appearance of the respective supergroup-specific FSFs or after the diversification of the respective supergroups (i.e., B, E and A). We hypothesize that these FSFs were discovered when dsdna viruses began to infect their hosts and adopted a parasitic lifestyle. This occurred when lineages of diversified cellular organisms were already in existence. Therefore, parasitic adaptation in the viral proteomes appears to be an afterthought most likely triggered by massive amounts of genome reduction experienced very early in evolution (nd < 0.587). Early reductive evolution of the translational machinery of giant viruses The loss of FSFs was abrupt and massive for viruses. It started very early in evolution but substantially dropped in the nd = range (Figure 1C: Viruses). Its first effects were on the repertoire of aminoacyl trna synthetase (aars) enzymes that are responsible for the algorithmic implementation of the genetic code [64-66]. The class II aars and biotin synthetase FSF (d.104.1) was the first domain structure to be completely lost in the viral proteomes we sampled (f = 0; nd = ) (Figure 1C: Viruses; boxplot for ABE in Figure 1D). This FSF includes the catalytic domain of class II aars enzymes that along with class I aars enzymes charge trnas with correct amino acids and make central components of the protein translation machinery [65,66]. It has been reported that the mimivirus genome encodes four class I aars enzymes (TyrRS, MetRS, ArgRS, and CysRS) but no class II enzymes [5]. Our census of FSFs confirms these findings. This partial enzymatic set of aarss
13 was proposed to be a likely remnant of a primordial translational apparatus that was once present in the genome of its ancestor (virus or more likely cell) [3]. The recent discovery of megavirus (a distant phylogenetic relative of mimivirus that is not included in this study) led to the identification of seven aars in the megavirus genome including both the class I (TyrRS, MetRS, ArgRS, CysRS, TrpRS, and IleRS) and class II (AsnRS) enzymes [3]. Megavirus is therefore the only virus known to possess both class I and class II aarss. We studied the genomic distribution of 28 FF domains that make structural components of aars enzymes in the 1,037 proteomes of the total proteome dataset of cells and viruses (Figure 2). These structures are catalytic, editing, trans-editing, anticodon binding and accessory domains of aars enzymes (Additional file 2: Table S2). As we illustrate with LeuRS, each of these domains contribute their own history to the evolutionary make up of individual aars enzymes (Figure 2A). The vast majority of the FF domains were only present in cells. The viruses we sampled encoded only four instances of the catalytic domain of class I aars (c ) and four total instances of the anticodon-binding domains of both class I (a ) and class II aars (c ) per proteome, all in mimivirus (Figure 2B). The fact that the anticodon-binding domain typical of class II ProRS, ThrRS, GlyRS and HisRS is present even if the correponding class II catalytic domain is absent is remarkable and suggests reductive evolutionary processes are still actively at play. The average number of catalytic domains per proteome was substantially larger in cells (ranging 16 37) and increased in the order Archaea, Bacteria and Eukarya (see pie charts of Figure 2B), following corresponding increases in genome complexity. The exception is the highly reduced eukaryotic genome of Guillardia theta that contains only one instance of an aars catalytic domain (corresponding to a class II enzyme) and resembles mimivirus. More importantly, we note that viruses did not contain editing or trans-editing domains that always appear together and at rather constant ratios with anticodon binding domains in cellular organisms and are especially substantial in Bacteria (bar diagrams, Figure 2B). Similarly, viruses did not contain any of the many other C-terminal and N-terminal accessory domains. These domains are typical of aarss and enhance their functional repertoire, especially in Eukarya [64]. As expected, a ToD reconstructed from the genomic abundance counts of these FFs (with FFs as taxa) described the origin and evolution of aars domains and revealed interesting patterns (Figure 2C). Catalytic and editing domains appeared at the base of the tree very early in evolution, generally before anticodon-binding domains necessary to establish crucial aminoacylation specificities. For example, the ValRS/IleRS/LeuRS editing domain FF (b ) appeared before the anticodon binding domains that are present in viruses. Remarkably, the progression of loss of domains of aarss in supergroups (Figure 2C) follows the progression observed for the entire proteomic dataset (Figure 1). The reductive evolutionary tendencies of the aars enzymes are therefore not atypical. Figure 2 Evolution of the major domains of aminoacyl-trna synthetase (aars) enzymes. A. The leucyl-trna synthetase (LeuRS) enzyme in complex with trna Leu (PDB entry 1WZ2) with its three domains (catalytic, editing and anticodon-binding) colored according to their age of origin. Domain ages were derived from a ToD at FF level of structural complexity [41]. Note how the variable arm of trna makes crucial contact with the anticodon-binding domain, which is evolutionarily derived, while the acceptor arm contacts the ancient catalytic domain in pre-editing conformation. B. Occurrence (box plots) and abundance (pie charts) of 28 fold family (FF) domains of aars enzymes with known structures in the total genomic dataset of 1,037 cellular organisms and viruses. The name and function of domains are described in Table S2 of the Additional file. C. Phylogenomic tree of protein domain structures describing the evolution of the 28 FFs of aarss in the 1,037 proteomes (982 parsimony informative characters; 26,638 steps; CI = ; RI = ;
14 g 1 = ). Taxa are aars FF domains and characters are proteomes. FFs are labeled with SCOP concise classification strings. Numbers on the branches indicate bootstrap values. FF domains present in viruses are highlighted in red. Note that d has been identified in megavirus (not included in this study). utols identify viruses as a distinct supergroup along with cellular superkingdoms We reconstructed rooted utols built from the genomic abundance counts of individual FSFs (total character set: 1,739 FSFs) as previously described [28,29]. For this reconstruction, we excluded cellular organisms with P and OP lifestyles (in order to remove noise from the data) and sampled 50 proteomes equally from each supergroup [29]. The reconstruction produced trees in which organisms in Archaea, Bacteria, Eukarya, and viruses formed four distinct groups, placed viruses as the most ancient group and Archaea as the second oldest. Figure 3A gives a radial representation of an example phylogeny of randomly sampled taxa. The viral supergroup is discriminated from other superkingdoms by 72 % BS. Both the viral and archaeal supergroups were always paraphyletic while Bacteria and Eukarya appeared monophyletic (Figure 3A). Reconstructions supported the early divergence of viruses and Archaea relative to Bacteria and Eukarya [28-30]. Because the FSF repertoire of sampled viruses (a total of 304 FSFs) is considerably smaller than the FSF repertoires in cellular supergroups (885 FSFs in Archaea; 1,312 FSFs in Bacteria; and 1,508 FSFs in Eukarya) (Figure 1A), we also reconstructed the utol from the ABEV taxonomic group (Additional file 3: Figure S1). The ABEV taxonomic group includes 229 FSFs that are encoded by both sampled viruses and cells and is the most ancient group with a median nd of (Figure 1D). This exercise reduced the effect of the number of supergroup-specific structures in Archaea, Bacteria and Eukarya that are significantly greater than the viral-specific structures (22, 163, 335 VS 6) and eliminated any bias resulting from the phylogenomic model (i.e., we consider primordial proteomes to encode very few structures and root trees by structural absence). The utol and network tree diagram (also read below) reconstructed from the set of 229 universal FSFs resulted in a topology which overall favored the previous reconstructions (Additional file 3: Figure S1). Viruses were identified as a separate group along with superkingdoms Archaea, Bacteria and Eukarya with the cellular world stemming from viruses and Archaea (Additional file 3: Figure S1). Figure 3 Universal tree of life (utol) and proteomic diversity. A. One optimal (P < 0.01) most parsimonious phylogenomic tree describing the evolution of 200 proteomes (50 each from Archaea, Bacteria, and Eukarya and viruses; virus families are listed in Table 2) generated using the census of abundance of 1,739 FSFs (1,517 parsimoniously informative sites; 62,061 steps; CI = 0.156; RI = 0.804; g 1 = 0.325). Terminal leaves of Viruses (V), Archaea (A), Eukarya (E) and Bacteria (B) were labeled in red, blue, black and green respectively Numbers on the branches indicate bootstrap values. B. FSF diversity (number of distinct FSFs in a proteome) plotted against FSF abundance (total number of FSFs that are encoded) for 200 proteomes. Major families/phyla/kingdoms are labeled. Both axes are in logarithmic scale. A plot that describes the interplay between diversity (use) and abundance (reuse) of FSFs (total number of distinct FSFs versus the total number of FSF domains that are encoded in a proteome) shows viruses have the simplest proteomes, followed progressively by Archaea, Bacteria and Eukarya, in that order (Figure 3B). Organisms follow a congruent trend towards structural diversity and organismal complexity. This trend confirms our initial evolutionary
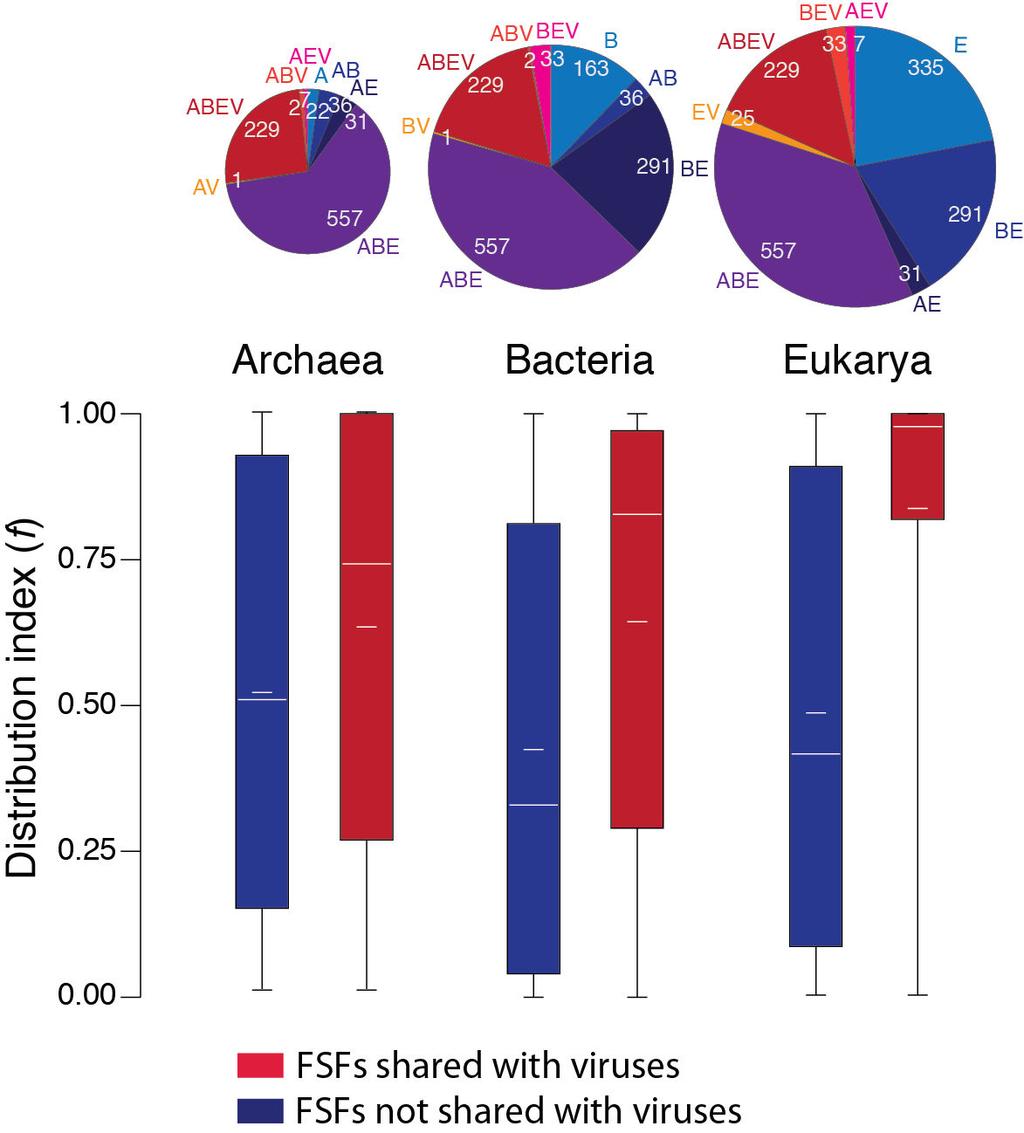
15 model of proteome growth that we use for the rooting of the utol and again supports the ancestrality of viruses and Archaea [28]. Phylogenomic networks give unity to sampled viruses When the evolutionary model involves processes like gene gain/loss, duplications, and HGT, it is appropriate to provide an abstract representation of the phylogeny using networks [57]. A phylogenomic network is expected to reflect the evolutionary tree when there is no conflict between data and the tree and aids in phylogenetic analysis. A network tree reconstructed by the agglomerative NeighborNet algorithm [57] identified viruses as a distinct supergroup along with cellular superkingdoms (Figure 4). Each edge on the network represented a split of taxa. The splits discriminating viruses and eukaryotes from the rest of the supergroups were supported by 100 % BS. The network tree is congruent with the phylogeny recovered in Figure 3A and defies theories attributing large proteomes of dsdna viruses to massive amounts of HGT from cells. In contrast, the resulting network gave unity to the sampled viruses and suggests vertical acquisition of their gene repertoires (no mixing of viruses with cells was observed in the network) (Figure 4). However, we realize that HGT from cells to viruses harboring smaller proteomes or RNA genomes might be occurring at different (or higher) levels. Figure 4 Network tree visualization of the supergroups. Network tree generated from the presence/absence matrix of 1,739 FSFs in 200 proteomes sampled equally from the four supergroups. The number of non-constant sites was 1,581. Nodes in the network tree are proteomes and are represented by rectangles labelled red, blue, green, and black for viruses, Archaea, Bacteria and Eukarya, respectively. Numbers on the major splits indicate bootstrap values. Viruses enhance planetary biodiversity The spread (f) of viral FSFs relative to cellular FSFs in the individual proteomes of Archaea, Bacteria and Eukarya appeared considerably biased (Figure 5). When compared to the cellspecific FSFs, FSFs shared by viruses and cells were significantly widespread in the proteomes of a superkingdom. Viruses hold 294, 265, and 239 FSFs in common with Eukarya, Bacteria and Archaea, respectively. Median f values of these FSFs were considerably higher than those of corresponding cellular FSFs in Eukarya (0.978 vs ), Bacteria ( vs ), and Archaea (0.742 vs ) (Figure 5). This bias is remarkable in the case of Eukarya where nearly all (98 %) the proteomes were enriched with viral FSFs (Figure 5). Archaeal and bacterial proteomes were also enriched with viral FSFs but at lower levels. Remarkably, patterns of enrichment follow patterns of reductive evolution in the superkingdoms (i.e., Archaea < Bacteria < Eukarya). The popularity and abundance of viral FSFs in cellular proteomes suggests that viruses have been a very active and crucial factor in mediating domain transfer between cellular species and enhancing biodiversity. These domains are present in a remarkably diverse array of cellular hosts, ranging from small microbes to complex vertebrates, providing further support to the ancient and primordial nature of viruses [16] and highlighting their crucial contribution to the biosphere [47]. Figure 5 Enrichment of viral FSFs. Boxplots comparing the distribution index (f) of FSFs shared or not shared with viruses for each cellular superkingdom. Pie charts above each
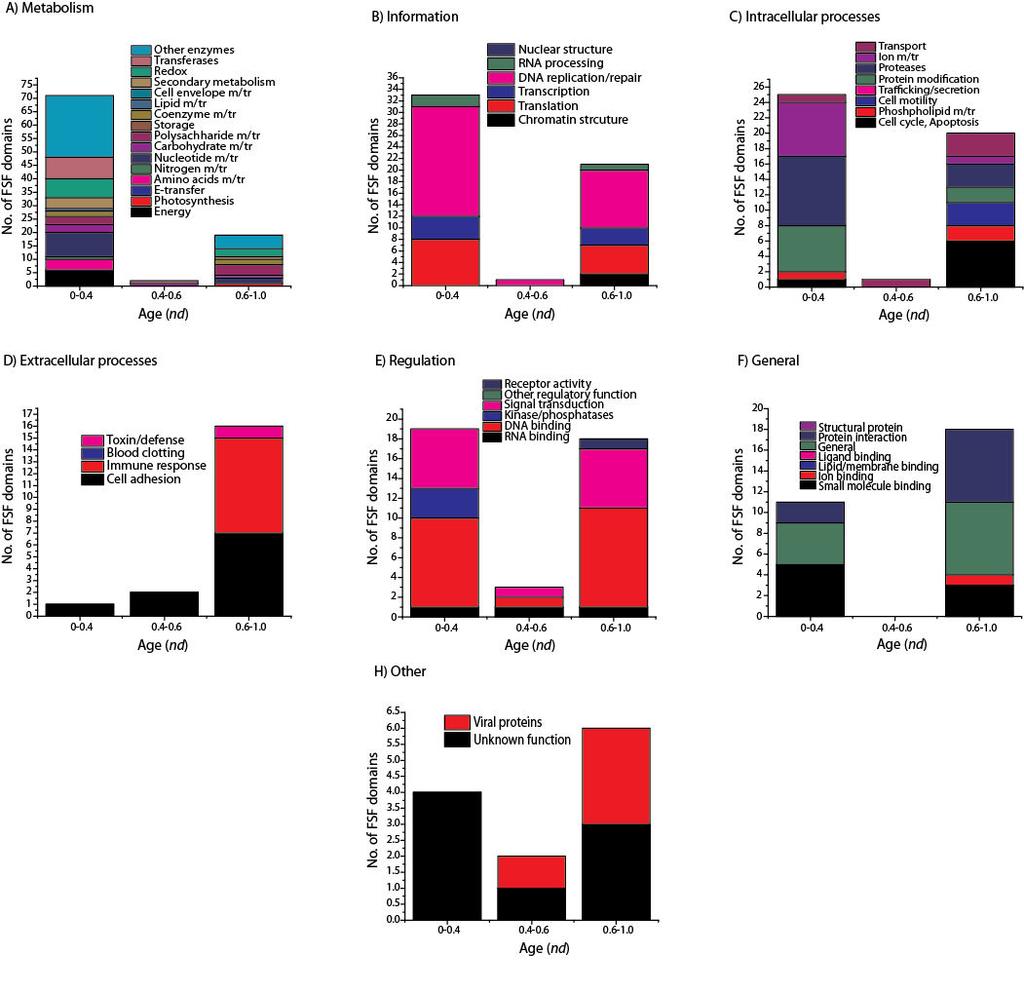
16 superkingdom represent distribution of FSFs in taxonomical groups within each superkingdom. Functional makeup of viral proteomes We studied the molecular functions of 293 (out of 304) FSFs in viral proteomes using the functional annotation scheme described by Vogel and Chothia [59-61]. For the rest of the 11 FSFs, functional annotations were not available. When plotted against time (nd), we note that a majority (n 1 = 164) of the viral FSFs either appeared very early (nd < 0.4) or very late (n 3 = 118) (0.6 < nd < 1.0) (Figure 6), supporting timelines of Figure 1C. For the ancient FSFs (nd < 0.4), we note that most of the viral FSFs perform metabolic functions, followed by informational FSFs, Intracellular processes, Regulation, General, Other and Extracellular processes, in that order. This order matches the functional distribution described previously for the cellular superkingdoms [27]. A significant drop in the number of FSFs/functions is seen in the nd range (n 2 = 11) which is the period marked by massive gene loss in both viruses and cellular organisms. In contrast, a relatively even distribution of functions is seen in the nd range which is the period marked by superkingdom diversification and genome expansion in Eukarya [28]. The specific functions acquired by viruses during this late period include those related to Extracellular processes (toxin/defense, immune response, cell adhesion), General (protein interaction, general, ion binding, small molecule binding), and Other (viral proteins and proteins with unknown functions) (Figure 7). We hypothesize that viruses acquired these functions in order to adapt to the parasitic lifestyle after suffering massive gene loss between nd This is also evident by the appearance of superkingdom specific taxonomic groups (AV, BV, and EV) after the appearance of respective superkingdoms in Figure 1D. In contrast, the number of FSFs corresponding to Metabolism, Information, Intracellular processes, and Regulation is lower compared to nd < 0.4. The significant differences in the distribution of molecular functions for very early (nd < 0.6) and late periods (nd > 0.6) of the evolutionary timeline suggests that viruses started very much like cells (possibly as integral components of cells), experienced massive amounts of genome reduction and finally acquired specific structures and functions needed for a parasitic lifestyle in an expanding cellular world. Figure 6 Functional distribution of viral FSFs in major functional categories. Histogram comparing the number of viral FSFs corresponding to major functional categories plotted against nd. The distribution of functions that appeared early and late is significantly biased. Numbers on top of individual bars indicate total number of FSFs corresponding to each functional category. Figure 7 Functional distribution of viral FSFs in minor functional categories. Histograms comparing the number of viral FSFs corresponding to each of the minor categories within each major functional category. Effect of HGT Domains defined at the FSF level are evolutionarily more conserved than domain sequences [23,29] and the evolutionary impact of HGT is limited at such levels of structural organization [31,32,34]. However, the HGT-derived domain structures are expected to be overrepresented in proteomes [41,67] and this significant enrichment of FSFs in viruses (in the ABEV, BEV, AEV, ABV, AV, BV, and EV taxonomic groups) is taken as an indication
17 that viruses have acquired FSFs from their cellular hosts via HGT. We calculated the probability of enrichment of a particular taxonomic group using the hypergeometric distribution and found that only the ABEV FSF group was significantly overrepresented (P < 0.05). All the other taxonomic groups were significantly underrepresented (P < 0.05) with the exception of the AEV FSF group, which was overrepresented at statistically nonsignificant levels (P = 0.29, Table 4:Viruses). Because HGT is thought to have played an important role in the evolution of prokaryotes, especially bacteria [68], we also evaluated the enrichment of FSFs in bacterial taxonomic groups (ABEV, BEV, ABV, ABE, BE, AB, and BV) as control to the enrichment test on viruses. We found that all the bacterial taxonomic groups were significantly overrepresented (P < 0.05) (as expected) except for ABEV and BV groups (Table 4:Bacteria), supporting high levels of HGT in Bacteria [68]. The significant underrepresentation of viral taxonomic groups indicates that FSFs encoded by giant viruses were not transferred laterally from their cellular hosts, though they can still contribute innovations to the structural make up of cells [28]. Table 4 Statistical test for the enrichment of FSFs in taxonomic groups using hypergeometric distribution for sampled viruses and bacteria Comparison k n M N P-value Comment Sampled viruses ABEV_ABE E-67 Overrepresented BEV_BE Underrepresented BV_B E-13 Underrepresented BEV_BE Underrepresented ABV_AB Underrepresented AV_A Underrepresented AEV_AE Overrepresented EV_E E-09 Underrepresented Bacteria ABEV_ABE E-111 Under-represented BEV_EV < Over-represented ABV_AV < Over-represented ABE_AE < Over-represented BE_E E-9 Over-represented AB_A < Over-represented BV_V Under-represented Significantly over-represented comparisons are highlighted in boldface. k, number of FSFs in viral taxonomic group; n, total number of FSFs in viral supergroup; M, number of FSFs cellular taxonomic group; N, total number of FSFs studied. In order to evaluate the relative contributions of vertical and horizontal processes of inheritance in proteome evolution, we calculated the retention index (r i ) for each phylogenetic character (r i for each FSF) used to build the utol as a relative measure of homoplasy (conflict in how data matches the reconstructed tree), and placed this information along the timelines generated from the trees of FSFs. r i portrays processes other than vertical inheritance (i.e., convergent evolution and HGT) of characters (FSFs) on a relative scale of 0 1. Higher r i values indicate a better fit of characters (FSFs) to the phylogeny and support vertical inheritance. We compared the r i distribution of viral FSFs with the cellular FSFs and found that both groups of FSFs distribute similarly (Additional file 4: Figure S2). On average,
18 however, r i values were higher in viral characters (FSFs) (r i = 0.79 for viral FSFs versus r i = 0.71, P < 0.001), likely due to a significant drop of r i values of FSFs of intermediate age (nd = ), suggesting viral FSF characters fit better the utol than cellular FSFs. Because viral and cellular FSFs distribute similarly in the timeline (Additional file 4: Figure S2), we conclude against intuition that the viral FSFs are not the subject of increased HGT levels relative to cellular FSFs. Discussion In our analyses, we used the structural information of hundreds of proteomes to reconstruct the phylogenomic history of protein domains and organisms. We included viruses with medium-to-very-large proteomes and compared them to the cellular organisms. To our knowledge, this is the first exercise that makes extensive use of molecular data to study the evolution of viruses on a scale that is comparable to the cellular organisms. Additionally, we explored the functional annotations of protein domains (grouped into FSFs) and studied the proteomic make up of viruses. While structural information proved useful for the reconstruction of phylogenies, functional assignments described the nature of viral proteomes. This composite exercise of linking structure and function proved highly useful and yielded significant insights into the structure and evolution of organisms. Our data provides evidence for high levels of genome reduction in giant viruses. This can be illustrated with the evolution of the most important brokers of translational specificity, the aars enzymes [64]. The existence of aarss in mimiviruses and megaviruses was recently given as evidence that these viruses evolved from an ancestral virus or cell harboring an entire aars set by reductive evolution [3]. The reduction hypothesis is more likely than the acquisition of mimiviral aars from its cellular host (i.e., amoeba) by HGT [18]. The probability of seven independent HGT events responsible for the seven aars enzymes of megavirus is unlikely [3] and has been toned down in several studies [9,19,69]. Abergel et al. [70] tested the activity of two of the mimiviral aars (MetRS and TyrRS) and found they were functionally active in infected amoebas. Because HGT-derived genes are expected to acquire different functions, true activity of mimiviral enzymes favors the hypothesis of genome reduction in the mimiviral ancestor [70]. Similarly, sequence-based phylogenies did not suggest acquisition of aarss present in giant viruses via HGT either, since mimiviral sequences did not group with those of their eukaryotic host [3,70]. Our analysis of the distribution and evolution of aars domains is also incompatible with the HGT scenario. The wide distribution of catalytic, editing, trans-editing, anticodon binding and accesory domains of aars enzymes in cells constrasts with their limited presence or complete absence in mimiviruses, and their complete absence in the rest of dsdna viruses we sampled (Figure 2). Even the average number of catalytic domains per proteome that are present in organisms of the cellular superkingdoms is highly reduced in mimiviruses, suggesting the specificity of aars enzymes needs to be supplemented with that of the amoebal host. The absence of crucial editing, anticodon-binding and accessory domains in viruses suggest forces of genome reduction that are similar to organisms exhibiting parasitic lifestyles (e.g., Gillardia theta) [27,28]. For example, the ValRS/IleRS/LeuRS editing domain that is ubiquitous in cellular proteomes and appears earlier than the anticodon binding domains is notoriously absent. Unless mimiviruses favor a statistical proteome, as those obtained by mutation of this editing domain [71], they must supplement their rudimentary aars repertoire with hijacked eukaryotic proteins. Especially relevant are the N-terminal d additional domain of ArgRS, the C-terminal d domain of TyrRS, and the b Myf domain of MetRS
19 and TyrRS, since these aars enzymes were identified in mimiviruses. These domains should have transferred from cellular superkingdoms together with core functional domains by HGT to enhance their catalytic activities. Their absence or extreme substructural reduction suggests again not only reductive evolution but also poor catalytic specificity of viral aarss and poor contribution, if any, to the many functions of aarss that are beyond translation [64]. In light of phylogenomic results, a more parsimonious explanation for the evolution of viral proteomes is their tendencies for genome reduction, anticipated in [28] and [38]. Thus, mimiviruses (and megaviruses) should be viewed as the least reduced forms of an ancestral virus or cell that either coevolved or predated the cellular ancestors. The utols reconstructed from the total set of FSF domains (Figure 3A) and from only the set of universal FSFs (Addiftioanl file, Figure S1) showed that the cohesive viral supergroup exhibited very little diversity (shorter branches) compared to the diversity of cellular proteomes, which expands in the lineages of superkingdoms. We explain the lack of diversity in viral proteomes by their prolonged reductive evolutionary history and the fact that the set of FSFs that distinguish viruses are unevenly distributed in the virosphere (e.g., translation related enzymes are only present in mimiviruses and megaviruses). In contrast, longer branches in cellular superkingdoms are an indication of biological processes shaping the proteomes of higher organisms (i.e., accumulation of protein domains). We assume in our phylogenetic model that the ancestral proteome had a simpler organization (i.e., we treat FSF absence as the ancestral character state; see Methods) and hence resulted in a topology in which viruses appeared to be the most ancient supergroup. However and as explained above, the simpler organization of viral proteomes is a consequence of genome reduction and does not necessarily invalidate the ancestrality of viruses. Modern day viruses are recognized by smaller gene repertoires. It is possible they are also the reduced forms of an ancient viral lineage that coexisted with LUCA (very much like the dsdna viruses we studied). It is less likely however that their initial origin was polyphyletic and driven by HGT from cells. The reconstruction of the ancestral viral lineage and testing the origins of all viruses seems possible with increased sampling of the virosphere and discovery of more giant viruses such as mimiviruses and megaviruses. The limited sampling of our study, mostly confined to viruses of the NCDLV group, and the existence of other giant viruses with even larger proteome repertoires of FSFs [3], does not affect the fundamental conclusion that the origin of viruses, at least giant viruses, was primordial and their evolution was shaped by reductive processes. A phylogenomic analysis involving all viral genomes that are known will help dissect primary and secondary adaptations shaping viral diversity along the entire evolutionary timeline (Nasir et al., ms. in preparation). Conclusions We show that viruses with medium-to-very large proteomes harbor a significant number of FSFs and suggest that they have evolved via massive reductive evolutionary processes that are not so uncommon for small bacteria with small genomes and similar parasitic lifestyles. In addition, these viruses appear as a distinct supergroup on a utol along with the three cellular superkingdoms. We propose that the viruses we have analyzed coexisted with primordial cells. These primordial entities could have been integral components of the common ancestor of life. We finally highlight the crucial contribution of the virosphere to biodiversity by mediating HGT between cellular species.
20 Abbreviations FSF, Fold superfamily; FF, Fold family; F, Fold; FL, Free living; P, Parasitic; OP, Obligate parasitic; BS, Bootstrap; HGT, Horizontal gene transfer; LUCA, Last universal common ancestor; SCOP, Structural Classification of Proteins; PDB, Protein data bank; NCLDV, Nucleo-cytoplasmic large DNA viruses; aars, Aminoacyl-tRNA synthetases; ToD, Tree of domains; ToP, Tree of proteomes; utol, Universal Tree of Life. Competing interests The authors declare no competing interests. Author s contributions All authors designed experiments, performed experiments and read and approved the final manuscript. Acknowledgements We thank Mart Krupovic for help in selecting our viral dataset, Patrick Forterre for valuable comments, and members of the Evolutionary Bioinformatics research team for data, comments and help. Research was supported by the National Science Foundation (MCB and OISE ) of the US and by a grant (PJ ) from the Next- Generation BioGreen 21 Program, Rural Development Administration, Republic of Korea. Any opinions, findings, conclusions and recommendations expressed in this material are those of the authors and do not necessarily reflect the views of the funding agencies. References 1. La Scola B, Audic S, Robert C, Jungang L, de Lamballerie X, Drancourt M, Birtles R, Claverie JM, Raoult D: A giant virus in amoebae. Science 2003, 299(5615): La Scola B, Desnues C, Pagnier I, Robert C, Barrassi L, Fournous G, Merchat M, Suzan- Monti M, Forterre P, Koonin E, Raoult D: The virophage as a unique parasite of the giant mimivirus. Nature 2008, 455(7209): Arslan D, Legendre M, Seltzer V, Abergel C, Claverie JM: Distant Mimivirus relative with a larger genome highlights the fundamental features of Megaviridae. Proc Natl Acad Sci U S A 2011, 108(42): Koonin EV: Virology: Gulliver among the Lilliputians. Curr Biol 2005, 15(5):R Raoult D, Audic S, Robert C, Abergel C, Renesto P, Ogata H, La Scola B, Suzan M, Claverie JM: The 1.2-megabase genome sequence of Mimivirus. Science 2004, 306(5700):
21 6. Xiao C, Kuznetsov YG, Sun S, Hafenstein SL, Kostyuchenko VA, Chipman PR, Suzan- Monti M, Raoult D, McPherson A, Rossmann MG: Structural studies of the giant mimivirus. PLoS Biol 2009, 7(4):e Claverie JM, Ogata H, Audic S, Abergel C, Suhre K, Fournier PE: Mimivirus and the emerging concept of "giant" virus. Virus Res 2006, 117(1): Legendre M, Santini S, Rico A, Abergel C, Claverie JM: Breaking the 1000-gene barrier for Mimivirus using ultra-deep genome and transcriptome sequencing. Virol J 2011, 8: Claverie JM, Abergel C: Mimivirus and its virophage. Annu Rev Genet 2009, 43: Iyer LM, Aravind L, Koonin EV: Common origin of four diverse families of large eukaryotic DNA viruses. J Virol 2001, 75(23): Iyer LM, Balaji S, Koonin EV, Aravind L: Evolutionary genomics of nucleocytoplasmic large DNA viruses. Virus Res 2006, 117(1): Zauberman N, Mutsafi Y, Halevy DB, Shimoni E, Klein E, Xiao C, Sun S, Minsky A: Distinct DNA exit and packaging portals in the virus Acanthamoeba polyphaga mimivirus. PLoS Biol 2008, 6(5):e Suhre K, Audic S, Claverie JM: Mimivirus gene promoters exhibit an unprecedented conservation among all eukaryotes. Proc Natl Acad Sci U S A 2005, 102(41): Forterre P: The origin of viruses and their possible roles in major evolutionary transitions. Virus Res 2006, 117(1): Raoult D, Forterre P: Redefining viruses: lessons from Mimivirus. Nat Rev Microbiol 2008, 6(4): Koonin EV, Senkevich TG, Dolja VV: The ancient Virus World and evolution of cells. Biol Direct 2006, 1: Pearson H: 'Virophage' suggests viruses are alive. Nature 2008, 454(7205): Moreira D, Lopez-Garcia P: Ten reasons to exclude viruses from the tree of life. Nat Rev Microbiol 2009, 7(4): Claverie JM, Ogata H: Ten good reasons not to exclude giruses from the evolutionary picture. Nat Rev Microbiol 2009, 7(8):615. author reply Ludmir EB, Enquist LW: Viral genomes are part of the phylogenetic tree of life. Nat Rev Microbiol 2009, 7(8):615. author reply Moreira D, Brochier-Armanet C: Giant viruses, giant chimeras: the multiple evolutionary histories of Mimivirus genes. BMC Evol Biol 2008, 8:12.
22 22. Moreira D, Lopez-Garcia P: Comment on "The 1.2-megabase genome sequence of Mimivirus". Science 2005, 308(5725):1114. author reply Caetano-Anolles G, Wang M, Caetano-Anolles D, Mittenthal JE: The origin, evolution and structure of the protein world. Biochem J 2009, 417(3): Caetano-Anolles G, Yafremava L, Mittenthal JM: Modularity and dissipation in the evolution of molecular function, structures and networks. In Evolutionary bioinformatics and systems biology. Edited by Caetano-Anollés G, Hoboken C-AG. New Jersey: Wiley- Blackwell; 2010: Murzin AG, Brenner SE, Hubbard T, Chothia C: SCOP: a structural classification of proteins database for the investigation of sequences and structures. J Mol Biol 1995, 247(4): Andreeva A, Howorth D, Chandonia JM, Brenner SE, Hubbard TJ, Chothia C, Murzin AG: Data growth and its impact on the SCOP database: new developments. Nucleic Acids Res Nucleic Acids Res 2008, 36(Database issue):d Nasir A, Naeem A, Khan MJ, Lopez-Nicora HD, Caetano-Anolles G: Functional Annotation of Protein Domains Reveals Remarkable Conservation in the Functional Makeup of Proteomes Across Superkingdoms. Genes 2011, 2: Wang M, Yafremava LS, Caetano-Anolles D, Mittenthal JE, Caetano-Anolles G: Reductive evolution of architectural repertoires in proteomes and the birth of the tripartite world. Genome Res 2007, 17(11): Kim KM, Caetano-Anolles G: The proteomic complexity and rise of the primordial ancestor of diversified life. BMC Evol Biol 2011, 11: Kim KM, Caetano-Anolles G: The evolutionary history of protein fold families and proteomes confirms that the archaeal ancestor is more ancient than the ancestors of other superkingdoms. BMC Evol Biol 2012, 12: Gough J: Convergent evolution of domain architectures (is rare). Bioinformatics 2005, 21(8): Forslund K, Henricson A, Hollich V, Sonnhammer EL: Domain tree-based analysis of protein architecture evolution. Mol Biol Evol 2008, 25(2): Choi IG, Kim SH: Global extent of horizontal gene transfer. Proc Natl Acad Sci U S A 2007, 104(11): Yang S, Bourne PE: The evolutionary history of protein domains viewed by species phylogeny. PLoS One 2009, 4(12):e Maddison WP: Missing data versus missing characters in phylogenetic analysis. Syst Biol 1993, 42:576.
23 36. De Laet J: Parsimony and the problem of inapplicables in sequence data. In Parsimony, phylogeny and genomics. Edited by Albert VA. Oxford: Oxford University Press; 2005: Huelsenbeck JP, Nielsen R: Effect of nonindependent substitution on phylogenetic accuracy. Syst Biol 1999, 48(2): Wang M, Kurland CG, Caetano-Anolles G: Reductive evolution of proteomes and protein structures. Proc Natl Acad Sci U S A 2011, 108(29): Wang M, Jiang YY, Kim KM, Qu G, Ji HF, Mittenthal JE, Zhang HY, Caetano-Anolles G: A universal molecular clock of protein folds and its power in tracing the early history of aerobic metabolism and planet oxygenation. Mol Biol Evol 2011, 28(1): Harish A, Caetano-Anolles G: Ribosomal history reveals origins of modern protein synthesis. PLoS One 2012, 7(3):e Caetano-Anolles D, Kim KM, Mittenthal JE, Caetano-Anolles G: Proteome evolution and the metabolic origins of translation and cellular life. J Mol Evol 2011, 72(1): Caetano-Anolles G, Yafremava LS, Gee H, Caetano-Anolles D, Kim HS, Mittenthal JE: The origin and evolution of modern metabolism. Int J Biochem Cell Biol 2009, 41(2): Caetano-Anolles G, Caetano-Anolles D: An evolutionarily structured universe of protein architecture. Genome Res 2003, 13(7): Caetano-Anolles G: Evolved RNA secondary structure and the rooting of the universal tree of life. J Mol Evol 2002, 54(3): Sun FJ, Caetano-Anolles G: The origin and evolution of trna inferred from phylogenetic analysis of structure. J Mol Evol 2008, 66: Wang M, Caetano-Anolles G: The evolutionary mechanics of domain organization in proteomes and the rise of modularity in the protein world. Structure 2009, 17(1): Abroi A, Gough J: Are viruses a source of new protein folds for organisms? - Virosphere structure space and evolution. Bioessays 2011, 33(8): Gough J, Chothia C: SUPERFAMILY: HMMs representing all proteins of known structure. SCOP sequence searches, alignments and genome assignments. Nucleic Acids Res 2002, 30(1): Wilson D, Pethica R, Zhou Y, Talbot C, Vogel C, Madera M, Chothia C, Gough J: SUPERFAMILY--sophisticated comparative genomics, data mining, visualization and phylogeny. Nucleic Acids Res 2009, 37(Database issue):d Gough J, Karplus K, Hughey R, Chothia C: Assignment of homology to genome sequences using a library of hidden Markov models that represent all proteins of known structure. J Mol Biol 2001, 313(4):
24 51. Wang M, Caetano-Anolles G: Global phylogeny determined by the combination of protein domains in proteomes. Mol Biol Evol 2006, 23(12): Swofford DL: Phylogenomic Analysis Using Parsimony and Other Programs (PAUP*) Ver 4.0b10. Sunderland: MA: Sinauer; Lundberg J: Wagner networks and ancestors. Syst Zool 1972, 18: Kolaczkowski B, Thornton JW: Performance of maximum parsimony and likelihood phylogenetics when evolution is heterogeneous. Nature 2004, 431(7011): Farris JS: The retention index and homoplasy excess. Syst Zool 1989, 38(4): Huson DH, Richter DC, Rausch C, Dezulian T, Franz M, Rupp R: Dendroscope: An interactive viewer for large phylogenetic trees. BMC Bioinforma 2007, 8: Bryant D, Moulton V: Neighbor-net: an agglomerative method for the construction of phylogenetic networks. Mol Biol Evol 2004, 21(2): Huson DH: SplitsTree: analyzing and visualizing evolutionary data. Bioinformatics 1998, 14(1): Vogel C, Teichmann SA, Pereira-Leal J: The relationship between domain duplication and recombination. J Mol Biol 2005, 346(1): Vogel C, Berzuini C, Bashton M, Gough J, Teichmann SA: Supra-domains: evolutionary units larger than single protein domains. J Mol Biol 2004, 336(3): Vogel C, Chothia C: Protein family expansions and biological complexity. PLoS Comput Biol 2006, 2(5):e Tatusov RL, Fedorova ND, Jackson JD, Jacobs AR, Kiryutin B, Koonin EV, Krylov DM, Mazumder R, Mekhedov SL, Nikolskaya AN, Rao BS, Smirnov S, Sverdlov AV, Vasudevan S, Wolf YI, Yin JJ, Natale DA: The COG database: an updated version includes eukaryotes. BMC Bioinforma 2003, 4: Harris MA, Clark J, Ireland A, Lomax J, Ashburner M, Foulger R, Eilbeck K, Lewis S, Marshall B, Mungall C, Richter J, Rubin GM, Blake JA, Bult C, Dolan M, Drabkin H, Eppig JT, Hill DP, Ni L, Ringwald M, Balakrishnan R, Cherry JM, Christie KR, Costanzo MC, Dwight SS, Engel S, Fisk DG, Hirschman JE, Hong EL, Nash RS, Sethuraman A, Theesfeld CL, Botstein D, Dolinski K, Feierbach B, Berardini T, Mundodi S, Rhee SY, Apweiler R, Barrell D, Camon E, Dimmer E, Lee V, Chisholm R, Gaudet P, Kibbe W, Kishore R, Schwarz EM, Sternberg P, Gwinn M, Hannick L, Wortman J, Berriman M, Wood V, de la Cruz N, Tonellato P, Jaiswal P, Seigfried T, White R: Gene Ontology Consortium: The Gene Ontology (GO) database and informatics resource. Nucleic Acids 2004, 32(Database issue):d Guo M, Yang X-L, Schimmel P: New functions of aminoacyl-trna synthetases beyond translation. Nature Rev 2010, 11:
25 65. Eriani G, Delarue M, Poch O, Gangloff J, Moras D: Partition of trna synthetases into two classes based on mutually exclusive sets of sequence motifs. Nature 1990, 347(6289): O'Donoghue P, Luthey-Schulten Z: On the evolution of structure in aminoacyl-trna synthetases. Microbiol Mol Biol Rev 2003, 67(4): Kim KM, Caetano-Anolles G: Emergence and evolution of modern molecular functions inferred from phylogenomic analysis of ontological data. Mol Biol Evol 2010, 27(7): Jain R, Rivera MC, Lake JA: Horizontal gene transfer among genomes: the complexity hypothesis. Proc Natl Acad Sci U S A 1999, 96(7): Claverie JM, Abergel C: Mimivirus: the emerging paradox of quasi-autonomous viruses. Trends Genet 2010, 26(10): Abergel C, Rudinger-Thirion J, Giege R, Claverie JM: Virus-encoded aminoacyl-trna synthetases: structural and functional characterization of mimivirus TyrRS and MetRS. J Virol 2007, 81(22): Boniecki MT, Martinis SA: Coordination of trna synthetase active sites for chemical fidelity. J Biol Chem 2012, 287: Additional files Additional_file_1 as DOC Additional file 1 Table S1: Statistics on the assignment FSF structures in supergroups. Additional_file_2 as DOC Additional file 2 Table S2: List of domain FFs that make structural components of aars enzymes. Additional_file_3 as DOC Additional file 3 Figure S1: Universal tree of life (utol) reconstructed from the set of universal FSFs and corresponding network tree representation. A. One optimal (P < 0.01) most parsimonious phylogenomic tree describing the evolution of 200 proteomes equally sampled from supergroups (50 each from Archaea, Bacteria, and Eukarya and viruses) generated using the census of abundance of 229 FSFs in the ABEV taxonomic group (229 parsimony informative characters; 16,642 steps; CI = ; RI = ; g 1 = 0.399). Terminal leaves of viruses, Archaea, Bacteria, and Eukarya were labeled in red, blue, black and green, respectively. Numbers on the branches indicate bootstrap values. B. Network tree generated from the presence/absence matrix of 229 FSFs (228 non-constant character sites) in 200 sampled proteomes. Nodes were represented by rectangles and labeled as in A. Numbers on the major splits indicate bootstrap values. CI, consistency index; RI, retention index; g 1, tree skewness. Additional_file_4 as DOC Additional file 4 Figure S2: Retention index (r i ) of each FSF plotted against relative age
26 (nd). Viral FSFs are colored red as above and cellular FSFs are represented in blue. Both groups of FSFs follow an identical distribution and generally the viral FSFs are distributed with higher r i values supporting a better fit of viral characters to the phylogeny.
27 Figure 1
28 Figure 2
29 Figure 3
30 Figure 4
31 Figure 5
32 Figure 6
33 Figure 7
Giant viruses coexisted with the cellular ancestors and represent a distinct supergroup along with superkingdoms Archaea, Bacteria and Eukarya
 Giant viruses coexisted with the cellular ancestors and represent a distinct supergroup along with superkingdoms Archaea, Bacteria and Eukarya Nasir et al. Nasir et al. BMC Evolutionary Biology 2012, 12:156
Supplementary Materials for
 advances.sciencemag.org/cgi/content/full/1/8/e1500527/dc1 Supplementary Materials for A phylogenomic data-driven exploration of viral origins and evolution The PDF file includes: Arshan Nasir and Gustavo
Research Article Comparative Analysis of Proteomes and Functionomes Provides Insights into Origins of Cellular Diversification
 Volume 2013, Article ID 648746, 13 pages http://dx.doi.org/10.1155/2013/648746 Research Article Comparative Analysis of Proteomes and Functionomes Provides Insights into Origins of Cellular Diversification
Amira A. AL-Hosary PhD of infectious diseases Department of Animal Medicine (Infectious Diseases) Faculty of Veterinary Medicine Assiut
 Faculty of Veterinary Medicine Assiut") Amira A. AL-Hosary PhD of infectious diseases Department of Animal Medicine (Infectious Diseases) Faculty of Veterinary Medicine Assiut University-Egypt Phylogenetic analysis Phylogenetic Basics: Biological
Amira A. AL-Hosary PhD of infectious diseases Department of Animal Medicine (Infectious Diseases) Faculty of Veterinary Medicine Assiut University-Egypt Phylogenetic analysis Phylogenetic Basics: Biological
CHAPTERS 24-25: Evidence for Evolution and Phylogeny
 CHAPTERS 24-25: Evidence for Evolution and Phylogeny 1. For each of the following, indicate how it is used as evidence of evolution by natural selection or shown as an evolutionary trend: a. Paleontology
8/23/2014. Phylogeny and the Tree of Life
 Phylogeny and the Tree of Life Chapter 26 Objectives Explain the following characteristics of the Linnaean system of classification: a. binomial nomenclature b. hierarchical classification List the major
Dr. Amira A. AL-Hosary
 Phylogenetic analysis Amira A. AL-Hosary PhD of infectious diseases Department of Animal Medicine (Infectious Diseases) Faculty of Veterinary Medicine Assiut University-Egypt Phylogenetic Basics: Biological
BMC Evolutionary Biology 2013, 13:6
 BMC Evolutionary Biology This Provisional PDF corresponds to the article as it appeared upon acceptance. Fully formatted PDF and full text (HTML) versions will be made available soon. Correction: Male-killing
Genomes and Their Evolution
 Chapter 21 Genomes and Their Evolution PowerPoint Lecture Presentations for Biology Eighth Edition Neil Campbell and Jane Reece Lectures by Chris Romero, updated by Erin Barley with contributions from
Introduction to Evolutionary Concepts
 Introduction to Evolutionary Concepts and VMD/MultiSeq - Part I Zaida (Zan) Luthey-Schulten Dept. Chemistry, Beckman Institute, Biophysics, Institute of Genomics Biology, & Physics NIH Workshop 2009 VMD/MultiSeq
Chapter 26 Phylogeny and the Tree of Life
 Chapter 26 Phylogeny and the Tree of Life Chapter focus Shifting from the process of how evolution works to the pattern evolution produces over time. Phylogeny Phylon = tribe, geny = genesis or origin
C3020 Molecular Evolution. Exercises #3: Phylogenetics
 C3020 Molecular Evolution Exercises #3: Phylogenetics Consider the following sequences for five taxa 1-5 and the known outgroup O, which has the ancestral states (note that sequence 3 has changed from
The Giant Cafeteria roenbergensis Virus That Infects a Widespread Marine Phagocytic Protist Is a New Member of the Fourth Domain of Life
 The Giant Cafeteria roenbergensis Virus That Infects a Widespread Marine Phagocytic Protist Is a New Member of the Fourth Domain of Life Philippe Colson 1,2, Gregory Gimenez 1, Mickaël Boyer 1, Ghislain
Origins of Life. Fundamental Properties of Life. Conditions on Early Earth. Evolution of Cells. The Tree of Life
 The Tree of Life Chapter 26 Origins of Life The Earth formed as a hot mass of molten rock about 4.5 billion years ago (BYA) -As it cooled, chemically-rich oceans were formed from water condensation Life
POPULATION GENETICS Winter 2005 Lecture 17 Molecular phylogenetics
 POPULATION GENETICS Winter 2005 Lecture 17 Molecular phylogenetics - in deriving a phylogeny our goal is simply to reconstruct the historical relationships between a group of taxa. - before we review the
Chapter 16: Reconstructing and Using Phylogenies
 Chapter Review 1. Use the phylogenetic tree shown at the right to complete the following. a. Explain how many clades are indicated: Three: (1) chimpanzee/human, (2) chimpanzee/ human/gorilla, and (3)chimpanzee/human/
Supplementary Information
 Supplementary Information Supplementary Figure 1. Schematic pipeline for single-cell genome assembly, cleaning and annotation. a. The assembly process was optimized to account for multiple cells putatively
Chapter 26: Phylogeny and the Tree of Life Phylogenies Show Evolutionary Relationships
 Chapter 26: Phylogeny and the Tree of Life You Must Know The taxonomic categories and how they indicate relatedness. How systematics is used to develop phylogenetic trees. How to construct a phylogenetic
Bio 1B Lecture Outline (please print and bring along) Fall, 2007
 Fall, 2007") Bio 1B Lecture Outline (please print and bring along) Fall, 2007 B.D. Mishler, Dept. of Integrative Biology 2-6810, bmishler@berkeley.edu Evolution lecture #5 -- Molecular genetics and molecular evolution
Bio 1B Lecture Outline (please print and bring along) Fall, 2007 B.D. Mishler, Dept. of Integrative Biology 2-6810, bmishler@berkeley.edu Evolution lecture #5 -- Molecular genetics and molecular evolution
Bioinformatics tools for phylogeny and visualization. Yanbin Yin
 Bioinformatics tools for phylogeny and visualization Yanbin Yin 1 Homework assignment 5 1. Take the MAFFT alignment http://cys.bios.niu.edu/yyin/teach/pbb/purdue.cellwall.list.lignin.f a.aln as input and
Outline. Genome Evolution. Genome. Genome Architecture. Constraints on Genome Evolution. New Evolutionary Synthesis 11/8/16
 Genome Evolution Outline 1. What: Patterns of Genome Evolution Carol Eunmi Lee Evolution 410 University of Wisconsin 2. Why? Evolution of Genome Complexity and the interaction between Natural Selection
Nature Genetics: doi: /ng Supplementary Figure 1. Icm/Dot secretion system region I in 41 Legionella species.
 Supplementary Figure 1 Icm/Dot secretion system region I in 41 Legionella species. Homologs of the effector-coding gene lega15 (orange) were found within Icm/Dot region I in 13 Legionella species. In four
Lecture 11 Friday, October 21, 2011
 Lecture 11 Friday, October 21, 2011 Phylogenetic tree (phylogeny) Darwin and classification: In the Origin, Darwin said that descent from a common ancestral species could explain why the Linnaean system
Chapter 19. Microbial Taxonomy
 Chapter 19 Microbial Taxonomy 12-17-2008 Taxonomy science of biological classification consists of three separate but interrelated parts classification arrangement of organisms into groups (taxa; s.,taxon)
Microbial Taxonomy and the Evolution of Diversity
 19 Microbial Taxonomy and the Evolution of Diversity Copyright McGraw-Hill Global Education Holdings, LLC. Permission required for reproduction or display. 1 Taxonomy Introduction to Microbial Taxonomy
Genetic Variation: The genetic substrate for natural selection. Horizontal Gene Transfer. General Principles 10/2/17.
 Genetic Variation: The genetic substrate for natural selection What about organisms that do not have sexual reproduction? Horizontal Gene Transfer Dr. Carol E. Lee, University of Wisconsin In prokaryotes:
SPECIES OF ARCHAEA ARE MORE CLOSELY RELATED TO EUKARYOTES THAN ARE SPECIES OF PROKARYOTES.
 THE TERMS RUN AND TUMBLE ARE GENERALLY ASSOCIATED WITH A) cell wall fluidity. B) cell membrane structures. C) taxic movements of the cell. D) clustering properties of certain rod-shaped bacteria. A MAJOR
Computational Biology: Basics & Interesting Problems
 Computational Biology: Basics & Interesting Problems Summary Sources of information Biological concepts: structure & terminology Sequencing Gene finding Protein structure prediction Sources of information
Outline. Genome Evolution. Genome. Genome Architecture. Constraints on Genome Evolution. New Evolutionary Synthesis 11/1/18
 Genome Evolution Outline 1. What: Patterns of Genome Evolution Carol Eunmi Lee Evolution 410 University of Wisconsin 2. Why? Evolution of Genome Complexity and the interaction between Natural Selection
Elements of Bioinformatics 14F01 TP5 -Phylogenetic analysis
 Elements of Bioinformatics 14F01 TP5 -Phylogenetic analysis 10 December 2012 - Corrections - Exercise 1 Non-vertebrate chordates generally possess 2 homologs, vertebrates 3 or more gene copies; a Drosophila
Homology and Information Gathering and Domain Annotation for Proteins
 Homology and Information Gathering and Domain Annotation for Proteins Outline Homology Information Gathering for Proteins Domain Annotation for Proteins Examples and exercises The concept of homology The
METHODS FOR DETERMINING PHYLOGENY. In Chapter 11, we discovered that classifying organisms into groups was, and still is, a difficult task.
 Chapter 12 (Strikberger) Molecular Phylogenies and Evolution METHODS FOR DETERMINING PHYLOGENY In Chapter 11, we discovered that classifying organisms into groups was, and still is, a difficult task. Modern
Title: Evolutionary dynamics of the protein structure-function relation and the origin of the genetic code
 Blue Waters Illinois Allocation Report 2016 Primary contact email and name: NAME: Dr. Gustavo Caetano-Anolles EMAIL: gca@illinois.edu Title: Evolutionary dynamics of the protein structure-function relation
A Phylogenetic Network Construction due to Constrained Recombination
 A Phylogenetic Network Construction due to Constrained Recombination Mohd. Abdul Hai Zahid Research Scholar Research Supervisors: Dr. R.C. Joshi Dr. Ankush Mittal Department of Electronics and Computer
Hiromi Nishida. 1. Introduction. 2. Materials and Methods
 Evolutionary Biology Volume 212, Article ID 342482, 5 pages doi:1.1155/212/342482 Research Article Comparative Analyses of Base Compositions, DNA Sizes, and Dinucleotide Frequency Profiles in Archaeal
UoN, CAS, DBSC BIOL102 lecture notes by: Dr. Mustafa A. Mansi. The Phylogenetic Systematics (Phylogeny and Systematics)
") - Phylogeny? - Systematics? The Phylogenetic Systematics (Phylogeny and Systematics) - Phylogenetic systematics? Connection between phylogeny and classification. - Phylogenetic systematics informs the
- Phylogeny? - Systematics? The Phylogenetic Systematics (Phylogeny and Systematics) - Phylogenetic systematics? Connection between phylogeny and classification. - Phylogenetic systematics informs the
Name: Class: Date: ID: A
 Class: _ Date: _ Ch 17 Practice test 1. A segment of DNA that stores genetic information is called a(n) a. amino acid. b. gene. c. protein. d. intron. 2. In which of the following processes does change
Bioinformatics. Dept. of Computational Biology & Bioinformatics
 Bioinformatics Dept. of Computational Biology & Bioinformatics 3 Bioinformatics - play with sequences & structures Dept. of Computational Biology & Bioinformatics 4 ORGANIZATION OF LIFE ROLE OF BIOINFORMATICS
Algorithms in Bioinformatics FOUR Pairwise Sequence Alignment. Pairwise Sequence Alignment. Convention: DNA Sequences 5. Sequence Alignment
 Algorithms in Bioinformatics FOUR Sami Khuri Department of Computer Science San José State University Pairwise Sequence Alignment Homology Similarity Global string alignment Local string alignment Dot
Map of AP-Aligned Bio-Rad Kits with Learning Objectives
 Map of AP-Aligned Bio-Rad Kits with Learning Objectives Cover more than one AP Biology Big Idea with these AP-aligned Bio-Rad kits. Big Idea 1 Big Idea 2 Big Idea 3 Big Idea 4 ThINQ! pglo Transformation
Examples of Phylogenetic Reconstruction
 Examples of Phylogenetic Reconstruction 1. HIV transmission Recently, an HIV-positive Florida dentist was suspected of having transmitted the HIV virus to his dental patients. Although a number of his
Phylogeny and systematics. Why are these disciplines important in evolutionary biology and how are they related to each other?
 Phylogeny and systematics Why are these disciplines important in evolutionary biology and how are they related to each other? Phylogeny and systematics Phylogeny: the evolutionary history of a species
Phylogeny 9/8/2014. Evolutionary Relationships. Data Supporting Phylogeny. Chapter 26
 Phylogeny Chapter 26 Taxonomy Taxonomy: ordered division of organisms into categories based on a set of characteristics used to assess similarities and differences Carolus Linnaeus developed binomial nomenclature,
Bioinformatics Chapter 1. Introduction
 Bioinformatics Chapter 1. Introduction Outline! Biological Data in Digital Symbol Sequences! Genomes Diversity, Size, and Structure! Proteins and Proteomes! On the Information Content of Biological Sequences!
Big Idea 1: The process of evolution drives the diversity and unity of life.
 Big Idea 1: The process of evolution drives the diversity and unity of life. understanding 1.A: Change in the genetic makeup of a population over time is evolution. 1.A.1: Natural selection is a major
SCIENTIFIC EVIDENCE TO SUPPORT THE THEORY OF EVOLUTION. Using Anatomy, Embryology, Biochemistry, and Paleontology
 SCIENTIFIC EVIDENCE TO SUPPORT THE THEORY OF EVOLUTION Using Anatomy, Embryology, Biochemistry, and Paleontology Scientific Fields Different fields of science have contributed evidence for the theory of
Chapter 26 Phylogeny and the Tree of Life
 Chapter 26 Phylogeny and the Tree of Life Biologists estimate that there are about 5 to 100 million species of organisms living on Earth today. Evidence from morphological, biochemical, and gene sequence
PHYLOGENY AND SYSTEMATICS
 AP BIOLOGY EVOLUTION/HEREDITY UNIT Unit 1 Part 11 Chapter 26 Activity #15 NAME DATE PERIOD PHYLOGENY AND SYSTEMATICS PHYLOGENY Evolutionary history of species or group of related species SYSTEMATICS Study
STAAR Biology Assessment
 STAAR Biology Assessment Reporting Category 1: Cell Structure and Function The student will demonstrate an understanding of biomolecules as building blocks of cells, and that cells are the basic unit of
Chapter 19. Gene creatures, Part 1: viruses, viroids and plasmids. Prepared by Woojoo Choi
 Chapter 19. Gene creatures, Part 1: viruses, viroids and plasmids Prepared by Woojoo Choi Dead or alive? 1) In this chapter we will explore the twilight zone of biology and the gene creature who live there.
CHAPTER : Prokaryotic Genetics
 CHAPTER 13.3 13.5: Prokaryotic Genetics 1. Most bacteria are not pathogenic. Identify several important roles they play in the ecosystem and human culture. 2. How do variations arise in bacteria considering
Comparative RNA-seq analysis of transcriptome dynamics during petal development in Rosa chinensis
 Title Comparative RNA-seq analysis of transcriptome dynamics during petal development in Rosa chinensis Author list Yu Han 1, Huihua Wan 1, Tangren Cheng 1, Jia Wang 1, Weiru Yang 1, Huitang Pan 1* & Qixiang
Intraspecific gene genealogies: trees grafting into networks
 Intraspecific gene genealogies: trees grafting into networks by David Posada & Keith A. Crandall Kessy Abarenkov Tartu, 2004 Article describes: Population genetics principles Intraspecific genetic variation
AP Curriculum Framework with Learning Objectives
 Big Ideas Big Idea 1: The process of evolution drives the diversity and unity of life. AP Curriculum Framework with Learning Objectives Understanding 1.A: Change in the genetic makeup of a population over
Characteristics of Life
 UNIT 2 BIODIVERSITY Chapter 4- Patterns of Life Biology 2201 Characteristics of Life All living things share some basic characteristics: 1) living things are organized systems made up of one or more cells
Microbial Taxonomy. Microbes usually have few distinguishing properties that relate them, so a hierarchical taxonomy mainly has not been possible.
 Microbial Taxonomy Traditional taxonomy or the classification through identification and nomenclature of microbes, both "prokaryote" and eukaryote, has been in a mess we were stuck with it for traditional
BIOLOGY STANDARDS BASED RUBRIC
 BIOLOGY STANDARDS BASED RUBRIC STUDENTS WILL UNDERSTAND THAT THE FUNDAMENTAL PROCESSES OF ALL LIVING THINGS DEPEND ON A VARIETY OF SPECIALIZED CELL STRUCTURES AND CHEMICAL PROCESSES. First Semester Benchmarks:
What is Phylogenetics
 What is Phylogenetics Phylogenetics is the area of research concerned with finding the genetic connections and relationships between species. The basic idea is to compare specific characters (features)
Biology 211 (2) Week 1 KEY!
 Week 1 KEY!") Biology 211 (2) Week 1 KEY Chapter 1 KEY FIGURES: 1.2, 1.3, 1.4, 1.5, 1.6, 1.7 VOCABULARY: Adaptation: a trait that increases the fitness Cells: a developed, system bound with a thin outer layer made of
Biology 211 (2) Week 1 KEY Chapter 1 KEY FIGURES: 1.2, 1.3, 1.4, 1.5, 1.6, 1.7 VOCABULARY: Adaptation: a trait that increases the fitness Cells: a developed, system bound with a thin outer layer made of
Molecular phylogeny - Using molecular sequences to infer evolutionary relationships. Tore Samuelsson Feb 2016
 Molecular phylogeny - Using molecular sequences to infer evolutionary relationships Tore Samuelsson Feb 2016 Molecular phylogeny is being used in the identification and characterization of new pathogens,
no.1 Raya Ayman Anas Abu-Humaidan
 no.1 Raya Ayman Anas Abu-Humaidan Introduction to microbiology Let's start! As you might have concluded, microbiology is the study of all organisms that are too small to be seen with the naked eye, Ex:
Enduring understanding 1.A: Change in the genetic makeup of a population over time is evolution.
 The AP Biology course is designed to enable you to develop advanced inquiry and reasoning skills, such as designing a plan for collecting data, analyzing data, applying mathematical routines, and connecting
A (short) introduction to phylogenetics
 introduction to phylogenetics") A (short) introduction to phylogenetics Thibaut Jombart, Marie-Pauline Beugin MRC Centre for Outbreak Analysis and Modelling Imperial College London Genetic data analysis with PR Statistics, Millport Field
A (short) introduction to phylogenetics Thibaut Jombart, Marie-Pauline Beugin MRC Centre for Outbreak Analysis and Modelling Imperial College London Genetic data analysis with PR Statistics, Millport Field
Biology Assessment. Eligible Texas Essential Knowledge and Skills
 Biology Assessment Eligible Texas Essential Knowledge and Skills STAAR Biology Assessment Reporting Category 1: Cell Structure and Function The student will demonstrate an understanding of biomolecules
Outline. Viruses, Bacteria, and Archaea. Viruses Structure Classification Reproduction Prokaryotes Structure Reproduction Nutrition Bacteria Archaea
 Viruses, Bacteria, and Archaea Chapter 21 Viruses Structure Classification Reproduction Prokaryotes Structure Reproduction Nutrition Bacteria Archaea Outline The Viruses The Viruses Viruses are noncellular
Chapters 25 and 26. Searching for Homology. Phylogeny
 Chapters 25 and 26 The Origin of Life as we know it. Phylogeny traces evolutionary history of taxa Systematics- analyzes relationships (modern and past) of organisms Figure 25.1 A gallery of fossils The
CS612 - Algorithms in Bioinformatics
 Fall 2017 Databases and Protein Structure Representation October 2, 2017 Molecular Biology as Information Science > 12, 000 genomes sequenced, mostly bacterial (2013) > 5x10 6 unique sequences available
Chapter 1 Biology: Exploring Life
 Chapter 1 Biology: Exploring Life PowerPoint Lectures for Campbell Biology: Concepts & Connections, Seventh Edition Reece, Taylor, Simon, and Dickey Lecture by Edward J. Zalisko Figure 1.0_1 Chapter 1:
The Prokaryotic World
 The Prokaryotic World A. An overview of prokaryotic life There is no doubt that prokaryotes are everywhere. By everywhere, I mean living in every geographic region, in extremes of environmental conditions,
Bio 119 Bacterial Genomics 6/26/10
 BACTERIAL GENOMICS Reading in BOM-12: Sec. 11.1 Genetic Map of the E. coli Chromosome p. 279 Sec. 13.2 Prokaryotic Genomes: Sizes and ORF Contents p. 344 Sec. 13.3 Prokaryotic Genomes: Bioinformatic Analysis
Evolutionary Patterns in the Sequence and Structure of Transfer RNA: Early Origins of Archaea and Viruses
 Evolutionary Patterns in the Sequence and Structure of Transfer RNA: Early Origins of Archaea and Viruses Feng-Jie Sun, Gustavo Caetano-Anollés* Department of Crop Sciences, University of Illinois Urbana-Champaign,
Organization of Genes Differs in Prokaryotic and Eukaryotic DNA Chapter 10 p
 Organization of Genes Differs in Prokaryotic and Eukaryotic DNA Chapter 10 p.110-114 Arrangement of information in DNA----- requirements for RNA Common arrangement of protein-coding genes in prokaryotes=
Part III - Bioinformatics Study of Aminoacyl trna Synthetases. VMD Multiseq Tutorial Web tools. Perth, Australia 2004 Computational Biology Workshop
 Part III - Bioinformatics Study of Aminoacyl trna Synthetases VMD Multiseq Tutorial Web tools Perth, Australia 2004 Computational Biology Workshop Multiple Sequence Alignments The aminoacyl-trna synthetases,
From gene to protein. Premedical biology
 From gene to protein Premedical biology Central dogma of Biology, Molecular Biology, Genetics transcription replication reverse transcription translation DNA RNA Protein RNA chemically similar to DNA,
Classification and Viruses Practice Test
 Classification and Viruses Practice Test Multiple Choice Identify the choice that best completes the statement or answers the question. 1. Biologists use a classification system to group organisms in part
"Nothing in biology makes sense except in the light of evolution Theodosius Dobzhansky
 MOLECULAR PHYLOGENY "Nothing in biology makes sense except in the light of evolution Theodosius Dobzhansky EVOLUTION - theory that groups of organisms change over time so that descendeants differ structurally
BIOL 1010 Introduction to Biology: The Evolution and Diversity of Life. Spring 2011 Sections A & B
 BIOL 1010 Introduction to Biology: The Evolution and Diversity of Life. Spring 2011 Sections A & B Steve Thompson: stthompson@valdosta.edu http://www.bioinfo4u.net 1 ʻTree of Life,ʼ ʻprimitive,ʼ ʻprogressʼ
Gene Ontology and Functional Enrichment. Genome 559: Introduction to Statistical and Computational Genomics Elhanan Borenstein
 Gene Ontology and Functional Enrichment Genome 559: Introduction to Statistical and Computational Genomics Elhanan Borenstein The parsimony principle: A quick review Find the tree that requires the fewest
Chapter 19: Taxonomy, Systematics, and Phylogeny
 Chapter 19: Taxonomy, Systematics, and Phylogeny AP Curriculum Alignment Chapter 19 expands on the topics of phylogenies and cladograms, which are important to Big Idea 1. In order for students to understand
Homology. and. Information Gathering and Domain Annotation for Proteins
 Homology and Information Gathering and Domain Annotation for Proteins Outline WHAT IS HOMOLOGY? HOW TO GATHER KNOWN PROTEIN INFORMATION? HOW TO ANNOTATE PROTEIN DOMAINS? EXAMPLES AND EXERCISES Homology
Phylogenetics. Applications of phylogenetics. Unrooted networks vs. rooted trees. Outline
 Phylogenetics Todd Vision iology 522 March 26, 2007 pplications of phylogenetics Studying organismal or biogeographic history Systematics ating events in the fossil record onservation biology Studying
A A A A B B1
 LEARNING OBJECTIVES FOR EACH BIG IDEA WITH ASSOCIATED SCIENCE PRACTICES AND ESSENTIAL KNOWLEDGE Learning Objectives will be the target for AP Biology exam questions Learning Objectives Sci Prac Es Knowl
Outline. Classification of Living Things
 Outline Classification of Living Things Chapter 20 Mader: Biology 8th Ed. Taxonomy Binomial System Species Identification Classification Categories Phylogenetic Trees Tracing Phylogeny Cladistic Systematics
Molecular phylogeny How to infer phylogenetic trees using molecular sequences
 Molecular phylogeny How to infer phylogenetic trees using molecular sequences ore Samuelsson Nov 200 Applications of phylogenetic methods Reconstruction of evolutionary history / Resolving taxonomy issues
1. The basic structural and physiological unit of all living organisms is the A) aggregate. B) organelle. C) organism. D) membrane. E) cell.
 aggregate. B) organelle. C) organism. D) membrane. E) cell.") Name: Date: Test File Questions 1. The basic structural and physiological unit of all living organisms is the A) aggregate. B) organelle. C) organism. D) membrane. E) cell. 2. A cell A) can be composed
Name: Date: Test File Questions 1. The basic structural and physiological unit of all living organisms is the A) aggregate. B) organelle. C) organism. D) membrane. E) cell. 2. A cell A) can be composed
Microbiota: Its Evolution and Essence. Hsin-Jung Joyce Wu "Microbiota and man: the story about us
 Microbiota: Its Evolution and Essence Overview q Define microbiota q Learn the tool q Ecological and evolutionary forces in shaping gut microbiota q Gut microbiota versus free-living microbe communities
Newly made RNA is called primary transcript and is modified in three ways before leaving the nucleus:
 m Eukaryotic mrna processing Newly made RNA is called primary transcript and is modified in three ways before leaving the nucleus: Cap structure a modified guanine base is added to the 5 end. Poly-A tail
PHYLOGENY & THE TREE OF LIFE
 PHYLOGENY & THE TREE OF LIFE PREFACE In this powerpoint we learn how biologists distinguish and categorize the millions of species on earth. Early we looked at the process of evolution here we look at
Processes of Evolution
 15 Processes of Evolution Forces of Evolution Concept 15.4 Selection Can Be Stabilizing, Directional, or Disruptive Natural selection can act on quantitative traits in three ways: Stabilizing selection
Molecular evolution - Part 1. Pawan Dhar BII
 Molecular evolution - Part 1 Pawan Dhar BII Theodosius Dobzhansky Nothing in biology makes sense except in the light of evolution Age of life on earth: 3.85 billion years Formation of planet: 4.5 billion
From soup to cells the origin of life
 From soup to cells the origin of life A microbe-like cellular filament found in 3.465 billion year old rock Evolution encompasses a wide range of phenomena: from the emergence of major lineages, to mass
Homework Assignment, Evolutionary Systems Biology, Spring Homework Part I: Phylogenetics:
 Homework Assignment, Evolutionary Systems Biology, Spring 2009. Homework Part I: Phylogenetics: Introduction. The objective of this assignment is to understand the basics of phylogenetic relationships
9/19/2012. Chapter 17 Organizing Life s Diversity. Early Systems of Classification
 Section 1: The History of Classification Section 2: Modern Classification Section 3: Domains and Kingdoms Click on a lesson name to select. Early Systems of Classification Biologists use a system of classification
and just what is science? how about this biology stuff?
 Welcome to Life on Earth! Rob Lewis 512.775.6940 rlewis3@austincc.edu 1 The Science of Biology Themes and just what is science? how about this biology stuff? 2 1 The Process Of Science No absolute truths
Phylogeny and the Tree of Life
 Chapter 26 Phylogeny and the Tree of Life PowerPoint Lecture Presentations for Biology Eighth Edition Neil Campbell and Jane Reece Lectures by Chris Romero, updated by Erin Barley with contributions from
2 Genome evolution: gene fusion versus gene fission
 2 Genome evolution: gene fusion versus gene fission Berend Snel, Peer Bork and Martijn A. Huynen Trends in Genetics 16 (2000) 9-11 13 Chapter 2 Introduction With the advent of complete genome sequencing,
Constructing Evolutionary/Phylogenetic Trees
 Constructing Evolutionary/Phylogenetic Trees 2 broad categories: istance-based methods Ultrametric Additive: UPGMA Transformed istance Neighbor-Joining Character-based Maximum Parsimony Maximum Likelihood
Molecular phylogeny How to infer phylogenetic trees using molecular sequences
 Molecular phylogeny How to infer phylogenetic trees using molecular sequences ore Samuelsson Nov 2009 Applications of phylogenetic methods Reconstruction of evolutionary history / Resolving taxonomy issues
Phylogenetic analysis. Characters
 Typical steps: Phylogenetic analysis Selection of taxa. Selection of characters. Construction of data matrix: character coding. Estimating the best-fitting tree (model) from the data matrix: phylogenetic
SCOTCAT Credits: 20 SCQF Level 7 Semester 1 Academic year: 2018/ am, Practical classes one per week pm Mon, Tue, or Wed
 Biology (BL) modules BL1101 Biology 1 SCOTCAT Credits: 20 SCQF Level 7 Semester 1 10.00 am; Practical classes one per week 2.00-5.00 pm Mon, Tue, or Wed This module is an introduction to molecular and