Evaluation of the Start- Up Core Physics Tests at Japan s High Temperature Engineering Test Reactor (Annular Core Loadings)
|
|
|
- Georgiana Scott
- 6 years ago
- Views:
Transcription

1 INL/EXT Evaluation of the Start- Up Core Physics Tests at Japan s High Temperature Engineering Test Reactor (Annular Core Loadings) John D. Bess Nozomu Fujimoto James W. Sterbentz Luka Snoj Atsushi Zukeran March 2010 The INL is a U.S. Department of Energy National Laboratory operated by Battelle Energy Alliance
2 INL/EXT Evaluation of the Start-Up Core Physics Tests at Japan s High Temperature Engineering Test Reactor (Annular Core Loadings) 1 Japan Atomic Energy Agency 2 Jozef Stefan Institute 3 Senior Reactor Physics Consultant John D. Bess Nozomu Fujimoto 1 James W. Sterbentz Luka Snoj 2 Atsushi Zukeran 3 March 2010 Idaho National Laboratory Idaho Falls, Idaho Prepared for the U.S. Department of Energy Office of Nuclear Energy Under DOE Idaho Operations Office Contract DE-AC07-05ID14517
3 EVALUATION OF THE START-UP CORE PHYSICS TESTS AT JAPAN S HIGH TEMPERATURE ENGINEERING TEST REACTOR (ANNULAR CORE LOADINGS) Evaluators John D. Bess Idaho National Laboratory Nozomu Fujimoto Japan Atomic Energy Agency Internal Reviewers James W. Sterbentz Idaho National Laboratory Independent Reviewers Luka Snoj Jozef Stefan Institute Atsushi Zukeran Senior Reactor Physics Consultant
4 Status of Compilation / Evaluation / Peer Review NEA/NSC/DOC(2006)1 Section 1 Compiled Independent Working Group Review Review Approved 1.0 DETAILED DESCRIPTION YES YES YES YES 1.1 Description of the Critical and / or Subcritical Configuration YES YES YES YES 1.2 Description of Buckling and Extrapolation Length Measurements NA NA NA NA 1.3 Description of Spectral Characteristics Measurements NA NA NA NA 1.4 Description of Reactivity Effects Measurements YES YES YES YES 1.5 Description of Reactivity Coefficient Measurements NA NA NA NA 1.6 Description of Kinetics Measurements NA NA NA NA 1.7 Description of Reaction-Rate Distribution Measurements YES YES YES YES 1.8 Description of Power Distribution Measurements NA NA NA NA 1.9 Description of Isotopic Measurements NA NA NA NA 1.10 Description of Other Miscellaneous Types of Measurements NA NA NA NA Section 2 Evaluated Independent Review Working Group Review Approved 2.0 EVALUATION OF EXPERIMENTAL DATA YES YES YES YES 2.1 Evaluation of Critical and / or Subcritical Configuration Data YES YES YES YES 2.2 Evaluation of Buckling and Extrapolation Length Data NA NA NA NA 2.3 Evaluation of Spectral Characteristics Data NA NA NA NA 2.4 Evaluation of Reactivity Effects Data YES YES YES YES 2.5 Evaluation of Reactivity Coefficient Data NA NA NA NA 2.6 Evaluation of Kinetics Measurements Data NA NA NA NA 2.7 Evaluation of Reaction Rate Distributions YES YES YES YES 2.8 Evaluation of Power Distribution Data NA NA NA NA 2.9 Evaluation of Isotopic Measurements NA NA NA NA 2.10 Evaluation of Other Miscellaneous Types of Measurements NA NA NA NA
5 Section 3 Compiled Independent Working Review Group Review Approved 3.0 BENCHMARK SPECIFICATIONS YES YES YES YES 3.1 Benchmark-Model Specifications for Critical and / or Subcritical YES YES YES YES Measurements 3.2 Benchmark-Model Specifications for Buckling and Extrapolation Length NA NA NA NA Measurements 3.3 Benchmark-Model Specifications for Spectral Characteristics Measurements NA NA NA NA 3.4 Benchmark-Model Specifications for Reactivity Effects Measurements YES YES YES YES 3.5 Benchmark-Model Specifications for Reactivity Coefficient Measurements NA NA NA NA 3.6 Benchmark-Model Specifications for Kinetics Measurements NA NA NA NA 3.7 Benchmark-Model Specifications for Reaction-Rate Distribution YES YES YES YES Measurements 3.8 Benchmark-Model Specifications for Power Distribution Measurements NA NA NA NA 3.9 Benchmark-Model Specifications for Isotopic Measurements NA NA NA NA 3.10 Benchmark-Model Specifications of Other Miscellaneous Types of Measurements NA NA NA NA Section 4 Compiled Independent Review Working Group Review Approved 4.0 RESULTS OF SAMPLE CALCULATIONS YES YES YES YES 4.1 Results of Calculations of the Critical or Subcritical Configurations YES YES YES YES 4.2 Results of Buckling and Extrapolation Length Calculations NA NA NA NA 4.3 Results of Spectral Characteristics Calculations NA NA NA NA 4.4 Results of Reactivity Effect Calculations YES YES YES YES 4.5 Results of Reactivity Coefficient Calculations NA NA NA NA 4.6 Results of Kinetics Parameter Calculations NA NA NA NA 4.7 Results of Reaction-Rate Distribution Calculations YES YES YES YES 4.8 Results of Power Distribution Calculations NA NA NA NA 4.9 Results of Isotopic Calculations NA NA NA NA 4.10 Results of Calculations of Other Miscellaneous Types of Measurements NA NA NA NA Independent Working Group Section 5 Compiled Approved Review Review 5.0 REFERENCES YES YES YES YES Appendix A: Computer Codes, Cross Sections, and Typical Input Listings YES YES YES YES
6 EVALUATION OF THE START-UP CORE PHYSICS TESTS AT JAPAN S HIGH TEMPERATURE ENGINEERING TEST REACTOR (ANNULAR CORE LOADINGS) IDENTIFICATION NUMBER: KEY WORDS: annular cores, critical configurations, graphite-moderated, graphite-reflected, helium coolant, HTTR, low enriched uranium (LEU), pin-in-block fuel, prismatic fuel, thermal reactor, TRISO, uranium oxide fuel SUMMARY INFORMATION 1.0 DETAILED DESCRIPTION The High Temperature Engineering Test Reactor (HTTR) of the Japan Atomic Energy Agency (JAEA) is a 30 MWth, graphite-moderated, helium-cooled reactor that was constructed with the objectives to establish and upgrade the technological basis for advanced high-temperature gas-cooled reactors (HTGRs) as well as to conduct various irradiation tests for innovative high-temperature research. The core size of the HTTR represents about one-half of that of future HTGRs, and the high excess reactivity of the HTTR, necessary for compensation of temperature, xenon, and burnup effects during power operations, is similar to that of future HTGRs. During the start-up core physics tests of the HTTR, various annular cores were formed to provide experimental data for verification of design codes for future HTGRs (Ref. 1, p. 310). The Japanese government approved construction of the HTTR in the 1989 fiscal year budget; construction began at the Oarai Research and Development Center in March 1991 and was completed May Fuel loading began July 1, 1998, from the core periphery. The first criticality was attained with an annular core on November 10, 1998 at 14:18, followed by a series of start-up core physics tests (Figure 1.1) until a fully-loaded core was developed on December 16, Criticality tests were carried out into January The first full power operation with an average core outlet temperature of 850ºC was completed on December 7, 2001, and operational licensing of the HTTR was approved on March 6, The HTTR attained high temperature operation at 950 ºC in April 19, After a series of safety demonstration tests, it will be used as the heat source in a hydrogen production system by 2015 (Ref. 3, pp ). Hot zero-power critical, a rise-to-power, b irradiation, c and safety demonstration testing de have also been performed with the HTTR, representing additional means for computational validation efforts. Power tests were performed in steps from 0 to 30 MW, with various tests performed at each step to confirm core a J. C. Kuijper, X. Raepsaet, J. B. M. de Haas, W. von Lensa, U. Ohlig, H-J. Ruetten, H. Brockmann, F. Damian, F. Dolci, W. Bernnat, J. Oppe, J. L. Kloosterman, N. Cerullo, G. Lomonaco, A. Negrini, J. Magill, and R. Seiler, HTGR Reactor Physics and Fuel Cycle Studies, Nucl. Eng. Des., 236: (2006). b S. Nakagawa, Y. Tachibana, K. Takamatsu, S. Ueta, and S. Hanawa, Performance Test of HTTR, Nucl. Eng. Des., 233: (2004). c T. Shibata, T. Kikuchi, S. Miyamoto, and K. Ogura, Assessment of Irradiation Temperature Stability of the First Irradiation Test Rig in the HTTR, Nucl. Eng. Des., 223: (2003). d Y. Tachibana, S. Nakagawa, T. Takeda, A. Saikusa, T. Furusawa, K. Takamatsu, K. Sawa, and T. Iyoku, Plan for the First Phase of Safety Demonstration Tests of the High Temperature Engineering Test Reactor (HTTR), Nucl. Eng. Des., 224: (2003). e S. Nakagawa, K. Takamatsu, Y. Tachibana, N. Sakaba, and T. Iyoku, Safety Demonstration Tests using High Temperature Engineering Test Reactor, Nucl. Eng. Des., 233: (2004). Revision: 0 Page 1 of 183

7 characteristics, thermal-hydraulic properties, and radiation shielding (Ref. 4, p. 284). The hightemperature test operation at 950 ºC represented the fifth and final phase of the rise-to-power tests. a The safety tests demonstrated inherent safety features of the HTTR such as slow temperature response during abnormal events due to the large heat capacity of the core and the negative reactivity feedback. b The experimental benchmark performed and currently evaluated in this report pertains to the data available for the annular core criticals from the initial six isothermal, annular and fully-loaded, core critical measurements performed at the HTTR. Evaluation of the start-up core physics tests specific to the fully-loaded core is compiled elsewhere (HTTR-GCR-RESR-001). Figure 1.1. Progress of Start-Up Core Physics Tests. c 1.1 Description of the Critical and / or Subcritical Configuration Overview of Experiment The initial start-up core physics tests for the High Temperature Engineering Test Reactor were performed between the months of July 1998 and January The HTTR facility is at the Oarai Research and Development Center of the JAEA. a S. Fujikawa, H. Hayashi, T. Nakazawa, K. Kawasaki, T. Iyoku, S. Nakagawa, and N. Sakaba, Achievement of Reactor-Outlet Coolant Temperature of 950 ºC in HTTR, J. Nucl. Sci. Tech., 41(12): (December 2004). b S. Nakagawa, D. Tochio, K. Takamatsu, M. Goro, and T. Takeda, Improvement of Analysis Technology for High Temperature Gas-Cooled Reactor by using Data Obtained in High Temperature Engineering Test Reactor, J. Power Energy Syst., 2(1): (2008). c Present Status of HTGR Research and Development, Japan Atomic Energy Research Institute, Tokaimura, March Revision: 0 Page 2 of 183
8 First criticality was attained on November 10, 1998, and the core was fully loaded in December During the fuel loading period, various tests were conducted under cold clean conditions as the start-up core physics tests. During these tests, the power was limited to below 30 W and the helium pressure was 1 bar. The tests for the critical approach, excess reactivity, shutdown margin, neutron flux distribution and control rod worth were conducted (Ref. 4, p. 284). Elsewhere the pressure is listed as 1 atmosphere (Ref. 1, p. 312). One atmosphere is equal to Pa, or bar. Of the initial six isothermal, annular and fully-loaded, core critical measurements that were performed, only the annular core loadings were evaluated in this benchmark analysis. The maximum uncertainty range is between and % Δk (1σ) for the 19-fuel-column core, with a decrease in the uncertainty as graphite dummy blocks are replaced by fuel blocks in the core. Dominant uncertainties are the impurities in the IG-110 graphite blocks, PGX graphite reflector blocks, and IG-11 graphite dummy blocks. Comprehensive biases could not be completed for all aspects of this experiment. Currently the calculations performed using the benchmark models have a k eff between 1.4 to 2.7 % of the experimental benchmark value and within 3, except for configuration 4, which is within 4. It is currently difficult to obtain the necessary information to further improve the confidence in the benchmark model and effectively reduce the overall uncertainty; the necessary data is proprietary and its released is being restricted, because the benchmark configuration of the HTTR core is the same that is currently in operation. Once this information is made available, the HTTR benchmark can be adjusted as appropriate Geometry of the Experiment Configuration and Measurement Procedure The geometric information publicly available for this benchmark can be found compiled in Section of HTTR-GCR-RESR Description of Criticality Measurements Before fuel loading, the whole region in the core was filled with graphite dummy blocks. Helium gas was filled up to 1 atm at room temperature. Dummy blocks were replaced with fuel blocks, column by column, in the fuel loading, starting from the core periphery to the center, as shown in Figure 1.2. Revision: 0 Page 3 of 183

9 Figure 1.2. Loading Pattern of the HTTR (Redrawn from Ref. 1, p. 313). In the first phase of fuel loading, six fuel columns were loaded consecutively. In the second phase, three fuel columns were loaded at a time, until a total of 15 columns were in the core. In the third phase of fuel loading, columns were loaded one at a time, so as to identify the number of fuel columns needed for the first criticality. In every loading phase, all control rods were withdrawn from the core after each fuel loading, and inverse multiplication factors were measured. Initial criticality was achieved with 19 fuel columns loaded. Symmetric annular cores were formed at 21-, 24-, and 27-fuel-column loaded cores. The fully-loaded core consists of 30 fuel columns. Figure 1.3 shows some of the fuel-loading steps during the initial core loading (Ref. 4, p. 285). Revision: 0 Page 4 of 183
10 Figure 1.3. Critical Approach at Room Temperature using the Fuel Addition Method (Ref. 4, p. 285). Revision: 0 Page 5 of 183
11 The inverse neutron multiplication factor was monitored in order to observe the approach to criticality; the core was regarded as critical when the neutron flux was self-sustained after removing the temporary neutron source. After the initial criticality, reactivity increase was measured using the IK (Inverse Kinetics) method. The excess reactivity of the core was then obtained by adding all increments of the reactivity from the first criticality to the fully-loaded core (Ref. 2, p. 14). Inverse multiplication factors were evaluated at 0, 6, 9, 12, 15, 16, 17, and 18 fuel-column-loaded cores to predict the first criticality (Ref. 2, p. 39). The inverse multiplication data were recorded and are shown in Figure Inverse multiplication factor 1/M Measured 1/M Ch-1 Ch-2 Ch-3 Average Number of fuel columns Figure 1.4. Inverse Multiplication Data for the Initial Approach to Critical of the HTTR. a 09-GA During the first approach to critical (after loading the 19 th fuel assembly) the source criticality at very low power was achieved. Then the neutron source was removed and the central control rod moved to compensate for the change in reactivity. The first criticality of the reactor was attained on November 10, Figure 1.5 shows the result of the reactivity measurements during this approach to critical (Ref. 2, p. 113). a Present Status of HTGR Research and Development, Japan Atomic Energy Research Institute, Tokaimura, March Revision: 0 Page 6 of 183
12 Figure 1.5. Initial Approach to Criticality Reactivity Measurements (Ref 2, p. 114). The control rod (CR) positions are provided in Table 1.1 for the critical conditions of the annular and fully-loaded cores. The CR pairs were named center (C), ring 1 (R1), ring 2 (R2), and ring 3 (R3) from the center to the outside as shown in Figure 1.2 (also see Section and Figure 3.17). Both R2 and R3 CRs are in the replaceable reflector region surrounding the core, where the six CR pairs on the sides of the hexagonal loading pattern are R2 CRs and the three remaining CR pairs at corners of the hex are R3 CRs. The C-CR was inserted into the 19-column core to adjust initial criticality while the other CRs were fully withdrawn (Ref. 1, p. 317). All control rod insertion levels are adjusted on the same level except for the three pairs of control rods in the most outer region in the side reflectors. These three pairs of CRs are usually fully withdrawn (Ref. 2, p. 40). There were two CR patterns used for the 24-fuel-column core. The first was the flat standard (FS) pattern, where the C, R1, and R2 CRs were inserted into the core at the same height, and the R3 CRs were fully withdrawn. The second pattern was the F23 pattern, where the R2 and R3 CRs in the side reflector were inserted into the core at the same height and the C and R1 CRs were fully withdrawn. The F23 pattern was used to simulate the control of future HTGRs, where the reflector CRs would mainly be Revision: 0 Page 7 of 183
13 used for reactivity control. The effective multiplication factors for the measured CR positions at critical conditions were evaluated for different annular cores and temperatures. The results in Table 1.1 are adjusted such that the multiplication factors could be evaluated at 27 ºC, 300 K (Ref. 1, pp ). A simpler statement for control rod positions of four of the critical cases is shown in Table 1.2, representing the average for rods C, R1, and R2 (with R3 completely withdrawn). Effective corrections to critical rod position in the core include a sinking effect from the CR driving mechanism of about -14 mm and a temperature expansion effect of about +2 mm from 25 to 27 ºC (Ref. 2, p. 46). Reported Japanese data typically had the sinking effect already accounted for in the reported rod positions. Control rods positions were defined with distance from the bottom of the fifth fuel layer (Ref. 1, p. 317). Table 1.1. Measured Control Rod Positions for Critical Conditions (Ref. 1, p. 318). Case Fuel Columns Temperature (ºC) k m (a) Critical Rod Position (mm) (b) C R1 R2 R3 Remark (c) C FS FS F FS FS (a) Measured k m has been corrected with the measured temperature coefficient (TC) for the 30-fuel-column core [ ( k/k/ºc) to 27 ºC (300 K)]. It was assumed that use of the TC for the 30-fuel-column core was practically still useful for the other cores because of the small temperature difference of <4 ºC. (b) Nominally fully withdrawn positions of C, R1, and R3 CRs are 4060 mm and that of the R2 CRs is 3335 mm. (c) C = criticality obtained using central control rod only. FS = flat standard pattern where C, R1, and R2 CRs were inserted into the core at the same levels while R3 CRs were fully withdrawn. F23 = only R2 and R3 CRs were used for control while C and R1 CRs were fully withdrawn. Table 1.2. Average Control Rod Positions for Critical Conditions (Ref. 2, p. 40). Fuel Column 21 (Case 2) 24 (Case 3) 27 (Case 5) 30 (Case 6) Rod Position (mm) 2646 ± ± ± ± 5 Revision: 0 Page 8 of 183
14 1.1.3 Material Data The material data publicly available for this benchmark can be found compiled in Section of HTTR-GCR-RESR Temperature Data The core is at room temperature (Ref. 2, p. 14). Table 1.1 provides the temperature of the experiment for each of the six critical configurations, ranging between 23 and 25ºC Additional Information Relevant to Critical and Subcritical Measurements Additional information is not available. 1.2 Description of Buckling and Extrapolation Length Measurements Buckling and extrapolation length measurements were not made. 1.3 Description of Spectral Characteristics Measurements Spectral characteristics measurements were not made. 1.4 Description of Reactivity Effects Measurements After the initial criticality the excess reactivity of the core was then obtained by adding all increments of the reactivity from the first criticality to the fully-loaded core (Ref. 2, p. 14). Further information regarding the measurement of excess reactivity of the annular core configurations is provided in Section of HTTR-GCR-RESR Description of Reactivity Coefficient Measurements Reactivity coefficient measurements were not made. 1.6 Description of Kinetics Measurements Kinetics measurements were not made. 1.7 Description of Reaction-Rate Distribution Measurements Overview of Experiment The axial reaction rate profile in the instrumentation columns has been evaluated for this benchmark configuration. Revision: 0 Page 9 of 183
15 1.7.2 Geometry of the Experiment Configuration and Measurement Procedure The geometry of the core is that of the fully-loaded core configuration in Section with modifications as stated below Axial Reaction Rate Distribution The fission reaction rate of 235 U was regarded as a neutron flux distribution because the neutron flux distribution could not be directly measured in the HTTR core. The three micro fission chambers (FCs) placed in the irradiation test columns were used to measure the axial reaction rate. The FCs are 5 cm long with a diameter of 0.6 cm. A FC was connected to the end of a long aluminum stick such that it could be axially traversed by moving the stick in the aluminum tube well inserted into the holes of the irradiation test columns. The temporary neutron source was withdrawn from the core during measurements. The reaction rates were then measured at several points around the peak of the reaction rate distribution to search for the peak. The reactor power was changed by the movement of the FC because reactivity was added by movement of the attached stick and cable, which caused a change in the reaction rates of the FCs. The reaction rate of the traversing FC was then normalized with the reaction rate of the FC fixed in another irradiation test column. The axial fission reaction rate distributions were measured for the 24- and 30-fuel-column cores. Both FS and F23 patterns were formed in the 24-fuelcolumn core. The experimental error of the neutron flux was ~0.2 %, and was evaluated from the number of FC pulse counts. Measured distributions are shown (compared with some of Japan s calculated results) in Figure 1.6 (Ref. 1, pp ). The reaction rate for the 30-fuel-column core configuration is evaluated in HTTR-GCR-RESR-001, as it represents measurements performed using the fully-loaded core configuration of the HTTR. Revision: 0 Page 10 of 183
16 Figure 1.6. Axial Reaction Rate Distribution in Irradiation Column for 24- and 30-Fuel-Column Cores (Ref. 1, p. 318). F23 and FS are defined in the footnote of Table 1.1. The 30-fuel-column core reactionrate measurements are evaluated in HTTR-GCR-RESR-001. Revision: 0 Page 11 of 183
17 1.7.3 Material Data The materials in the core were those described in the fully-loaded core configuration in Section with modifications as stated below Temperature Data Experiments were essentially performed at room temperature Additional Information Relevant to Reaction-Rate Distribution Measurements Additional information is not available. 1.8 Description of Power Distribution Measurements Power distribution measurements were not made. 1.9 Description of Isotopic Measurements Isotopic measurements were not made Description of Other Miscellaneous Types of Measurements Other miscellaneous types of measurements were not made. Revision: 0 Page 12 of 183
18 2.0 EVALUATION OF EXPERIMENTAL DATA The overall uncertainty in the calculated value of k eff, which is a function of multiple input parameters, is given by a N N 1 N 2 2 c( eff ) = ( Δ i) + 2 ( Δ i)( Δ j) i, j i= 1 i= 1 j= i+ 1. (2.1) u k k k k r In Equation 2.1, Δk i is the change in k eff when parameter i is changed by the standard deviation in the parameter, and r i,j is the correlation coefficient for parameters i and j. Where standard deviations are available, they are used for calculating the effects these uncertainties might have on k eff, in terms of Δk i. Where observed ranges are given, but not standard deviations, the limiting values of the observed ranges are usually applied, and plausible distribution functions are assumed for finding Δk i. Where only tolerances are given, their limiting values are used, along with plausible distribution functions. Where no guidance is given on the variability of a parameter, engineering judgment is used to select a range of variation that will produce the largest reasonable uncertainty in k eff. The bounding values in this range are then applied in the uncertainty analysis. If the overall uncertainty in k eff predicted by this approach is small enough that the experiment can be judged an acceptable benchmark, one can be confident that the real experiment is actually even better. All uncertainties are adjusted to values of one standard deviation (1σ). No information is available on correlations among parameters, so all parameters and their uncertainties are assumed to be uncorrelated. Usually, no information is publicly available about the distribution function of the deviation of a parameter from its nominal value. In most cases, it is reasonably assumed that the most relevant quantity is uniformly distributed. For example, if the change in k eff from its nominal value is dependent on the change in the volume of a spatial region, then it is assumed that the deviation of the volume of that region from its nominal value is uniformly distributed. The uncertainty analyses were performed in accordance with guidance provided in the ICSBEP Handbook. It should be noted that assuming a uniform distribution of a parameter between its limits leads to overprediction of the effect on k eff. These observations are used repeatedly in the following analysis. The following sections discuss the calculation of the effects of uncertainties in the parameters listed in tables in each section. The values of the tabulated parameters are computed in the benchmark critical configuration and in the configuration with each parameter assigned its maximum variation (or its standard deviation when available), one parameter at a time. The bases for the choices of the parameter values are discussed. In all cases where tolerances or observed variations apply to large numbers of objects, such as TRISO fuel particles, both deterministic (or systematic) uncertainties (applying to all the objects equally) and random uncertainties (different from one object to the next) will occur. For the fuel particles and their subregions especially, the random uncertainties are extremely small (i.e., the tolerance limit for the random uncertainty divided by the square root of the number of fuel particles in the core). In all cases, division by such large numbers would make the random component of the uncertainty negligible. a International Handbook of Evaluated Criticality Safety Benchmark Experiments, NEA/NSC/DOC(95)03/I-VIII, OECD-NEA, ICSBEP Guide to the Expression of Uncertainties, Revision 1, p. 29, September 30, Revision: 0 Page 13 of 183
19 Positional dependence of objects within the assembly also influences the effective proportional effect on the resultant uncertainty and bias calculations. However, since no information is available about how the uncertainties are divided between the systematic and random components, it is assumed throughout that the uncertainties are 25 % systematic and 75 % random for all uncertainties that exhibit a random component. This assumption provides a basic prediction of the effect on k eff until additional information regarding systematic uncertainties can be better evaluated. The 25 % systematic uncertainty is bound by the fact that most systematic uncertainties would be below 50 % of the total uncertainty and above the historic approach of ignoring the unknown systematic components (i.e., treat it with a 0 % probability). In actuality, careful experimenters may have an unknown systematic uncertainty that is approximately % of their total reported uncertainty. Evaluated uncertainties are listed as calculated, such that the readers may themselves adjust results according to some desired systematic-to-random uncertainty ratio. The summary in Section does list the systematic and random components of the uncertainty as separate entities based on the assumption that uncertainties with random components have 25 % systematic uncertainty. It is important to note that most parameters regarding the TRISO particles are normally distributed. 2.1 Evaluation of Critical and / or Subcritical Configuration Data In the preliminary Japanese computational evaluation, the predicted number of fuel columns to achieve criticality was 16±1, much less than the experimental result of 19. It was regarded that the neglect of nitrogen in the porous graphite led to this discrepancy. Two reevaluations were carried out after the initial criticality experiment (Ref. 1, pp ). The first reevaluation examined the air content in the graphite, simplification of graphite geometry, and impurity concentration in the dummy blocks. The predicted number of fuel columns for initial criticality was changed to 18±1. a The second reevaluation wasn t performed until after the full power tests at 30 MW and 850 ºC. Heterogeneity effects and air composition in the graphite was analyzed; the reevaluation also predicted 18±1 fuel columns for initial criticality. b Monte Carlo n-particle (MCNP) version calculations were utilized to estimate the biases and uncertainties associated with the experimental results for HTTR critical configurations in this evaluation. MCNP is a general-purpose, continuous-energy, generalized-geometry, time-dependent, coupled n- particle Monte Carlo transport code. c The Evaluated Neutron Data File library, ENDF/B-VII.0, d was utilized in analysis of the experiment and benchmark model biases and uncertainties. Elemental data such as molecular weights and isotopic abundances were taken from the 16 th edition of the Chart of the Nuclides. e These values are summarized in Appendix C. a Fujimoto, N., Nakano, M., Takeuchi, M., Fujisaki, S., and Yamashita, K., Start-Up Core Physics Tests of High Temperature Engineering Test Reactor (HTTR), (II): First Criticality by an Annular Form Fuel Loading and Its Criticality Prediction Method, J. Atomic Energy Society Japan, 42(5), (2000). b Yamashita, K., Fujimoto, N., Takeuchi, M., Fujisaki, S., Nakano, M., Umeda, M., Takeda, T., Mogi, H., and Tanaka, T., Startup Core Physics Tests of High Temperature Engineering Test Reactor (HTTR), (I): Test Plan, Fuel Loading and Nuclear Characteristics Tests, J. Atomic Energy Society Japan, 42(1), (2000). c X-5 Monte Carlo Team, MCNP a General Monte Carlo n-particle Transport Code, version 5, LA-UR , Los Alamos National Laboratory (2003). d M. B. Chadwick, et al., ENDF/B-VII.0: Next Generation Evaluated Nuclear Data Library for Nuclear Science and Technology, Nucl. Data Sheets, 107: (2006). e Nuclides and Isotopes: Chart of the Nuclides, 16 th edition, (2002). Revision: 0 Page 14 of 183
20 Only the primary components of the HTTR active core and surrounding reflector region were included in the analysis of uncertainties in this evaluation. The uncertainty analysis was performed using a model temperature of approximately 300 K. Five configurations, or cases, representing the HTTR annular cores, created during initial fuel loading, are analyzed in this benchmark. The fully-loaded core configuration is analyzed in a separate report (HTTR-GCR-RESR-001). The difference between the different cases is the number of loaded fuel columns in the core; these are identified in Table 1.1. For all impurity assessments, only the equivalent natural-boron content is utilized in the evaluation. In the compositions used in the evaluation models, the natural-boron content is adjusted to include only the primary absorber 10 B, according to an isotopic abundance of 19.9 at.%. All MCNP calculations of k eff have statistical uncertainties between and , resulting in Δk statistical uncertainties of approximately , assuming no correlation between the individual MCNP results. Some of the calculated uncertainties are poorly estimated because they are very small and on the order of the statistical uncertainty of the analysis method. However, these uncertainties are insignificant in magnitude compared to the total benchmark uncertainty. Reanalysis of most of these parameters with larger variations would not significantly reduce their uncertainties below the statistical uncertainty of the Monte Carlo calculations. Uncertainties less than are reported as negligible (neg). When calculated uncertainties in Δk eff are less than their statistical uncertainties, the statistical uncertainties are used in the calculation of the total uncertainty. The term Scaling Factor denotes the necessary correction to adjust the evaluated uncertainty in k eff to a 1 value. Often a larger uncertainty is evaluated such that the calculated k value is greater than the statistical uncertainty in the analysis method Experimental Uncertainties Temperature Temperature coefficients were not determined for the annular core configurations. The experimenters assumed that the temperature coefficient for the fully-loaded core configuration applies toward all HTTR configurations. Various temperature coefficients of reactivity are reported, ranging from k/k-ºc (Table 1.17 of HTTR-GCR-RESR-001) to pcm/ºc (Ref. 2, p. 113 and 132). An average of pcm/ºc with a deviation of ±0.95 (1 ) was selected to represent the effective change in reactivity with temperature adjustment. The experiments were performed near room temperature, and an uncertainty of ±1 ºC (1 ) was selected to represent the uncertainty in the temperature of the experiment. Results are shown in Table 2.1. The uncertainty in the temperature is considered all systematic with no random component. Table 2.1. Effect of Uncertainty in Temperature. Deviation Δk ± σ Δk Scaling Factor Δk eff (1σ) ± σ Δkeff -1 ºC ± ± ºC ± ± Revision: 0 Page 15 of 183
21 Control Rod Position Control rod positions were varied ±15 mm (3 ), as shown in Table 1.2, to determine the effective change in k eff. The sinking effect of -14 mm that was described in Section (just prior to Table 1.1) had already been applied to the rod position shown in Tables 1.1 and 1.2. It is unconfirmed whether temperature expansion effect of ±2 mm (reported at the end of Section in HTTR-GCR-RESR-001) applies uniformly to all control rods, how it was obtained, or that is was even applied to the reported experimental positions. Therefore it is applied with the ±5 mm in a root mean square approach, the overall uncertainty in the height remains approximately ±5 mm. No additional bias or bias uncertainty was evaluated for the sinking effect of the control rods. Results are shown in Table 2.2. The total number of control rods used in the core is 32 (16 pairs). For determining the random component of the uncertainty in Section 2.1.7, the results in Table 2.2 are divided by 16. Table 2.2. Effect of Uncertainty in Control Rod Position. Case Deviation Δk ± σ Δk Scaling Factor Δk eff (1σ) ± σ Δkeff mm (3σ) ± ± mm (3σ) ± ± mm (3σ) ± ± mm (3σ) ± ± mm (3σ) ± ± mm (3σ) ± ± mm (3σ) ± ± mm (3σ) ± ± mm (3σ) ± ± mm (3σ) ± ± Measured Value of k eff There is no additional information regarding the accuracy of the k eff measurements for the critical core conditions reported in Table 1.1. Typically the uncertainty and its effect are relatively insignificant Geometrical Properties Coated Fuel Particles When adjusting the diameters of the TRISO particle coatings, the other diameters are held constant. This in turn would increase or decrease the mass of the remaining layers. Whereas the diameters of the different layers appeared to be documented with more detail (see Table 1.14 and Figure 1.48 of HTTR-GCR-RESR-001), this approach seemed appropriate. The uncertainty in the mass is then evaluated as part of the density uncertainty Section Kernel Diameter Because of the overspecification of the TRISO particles in Table 1.14 (HTTR-GCR-RESR-001) and the correlation of uranium kernel diameter, density, TRISO packing fraction, and mass, the effect of the Revision: 0 Page 16 of 183
22 uncertainty in the kernel diameter is not included in the total uncertainty. However, an analysis of the uncertainty based upon the fuel mass is performed in Section Buffer Diameter The buffer thickness was varied ±12 μm (3 ) from the nominal value of 60 μm (Tables 1.12 and 1.14, and Figure 1.48 of HTTR-GCR-RESR-001) to determine the effective change in k eff. All other thicknesses in the TRISO particle were maintained the same. The packing fraction of the TRISO particles in the fuel was not conserved, so as to conserve fuel mass, but remained within 1 of the nominal value of 30 vol. % (±3 % in Table 1.14 of HTTR-GCR-RESR-001). Results are shown in Table 2.3. The total number of TRISO particles used in the fully-loaded core is approximately 868,140,000. For determining the random component of the uncertainty, the results in Table 2.3 would be divided by N, where N for each case is shown in Table 2.3. Table 2.3. Effect of Uncertainty in Buffer Diameter. Case Deviation Δk ± σ Δk Scaling Factor Δk eff (1σ) ± σ Δkeff N -12 μm (3σ) ± ± μm (3σ) ± ± μm (3σ) ± ± μm (3σ) ± ± μm (3σ) ± ± μm (3σ) ± ± μm (3σ) ± ± μm (3σ) ± ± μm (3σ) ± ± μm (3σ) ± ± IPyC Diameter The IPyC thickness was varied ±6 μm (3 ) from the nominal value of 30 μm (Tables 1.12 and 1.14, and Figure 1.48 of HTTR-GCR-RESR-001) to determine the effective uncertainty in k eff. All other thicknesses in the TRISO particle were maintained the same. The packing fraction of the TRISO particles in the fuel was not conserved but remained within 1 of the nominal value of 30 vol. % (±3 % in Table 1.14 of HTTR-GCR-RESR-001). Results are shown in Table 2.4. The total number of TRISO particles used in the fully-loaded core is approximately 868,140,000. For determining the random component of the uncertainty, the results in Table 2.4 would be divided by N, where N for each case is shown in Table 2.4. Revision: 0 Page 17 of 183
23 Case Deviation Δk ± σ Δk NEA/NSC/DOC(2006)1 Table 2.4. Effect of Uncertainty in IPyC Diameter. Scaling Factor Δk eff (1σ) ± σ Δkeff N -6 μm (3σ) ± ± μm (3σ) ± ± μm (3σ) ± ± μm (3σ) ± ± μm (3σ) ± ± μm (3σ) ± ± μm (3σ) ± ± μm (3σ) ± ± μm (3σ) ± ± μm (3σ) ± ± SiC Diameter The SiC thickness was varied ±12 μm (3 ) from the nominal value of 30 μm (Tables 1.12 and 1.14, and Figure 1.48 of HTTR-GCR-RESR-001) to determine the effective uncertainty in k eff. Although there is a negative component to the deviation in the thickness (Figure 1.48 of HTTR-GCR-RESR-001), TRISO particles with SiC thicknesses less than 25 μm are not acceptable for use as a final product. The thickness of 25 μm for the thickness appears to be a manufacturing limit while the thickness of 30 μm is more likely to be the actual thickness of the SiC layer. All other thicknesses in the TRISO particle were maintained the same. The packing fraction of the TRISO particles in the fuel was not conserved but remained within 1 of the nominal value of 30 vol. % (±3 % in Table 1.14 of HTTR-GCR-RESR-001). Results are shown in Table 2.5. The total number of TRISO particles used in the fully-loaded core is approximately 868,140,000. For determining the random component of the uncertainty, the results in Table 2.5 would be divided by N, where N for each case is shown in Table 2.5. Revision: 0 Page 18 of 183
24 Case Deviation Δk ± σ Δk NEA/NSC/DOC(2006)1 Table 2.5. Effect of Uncertainty in SiC Diameter. Scaling Factor Δk eff (1σ) ± σ Δkeff N -12 μm (3σ) ± ± μm (3σ) ± ± μm (3σ) ± ± μm (3σ) ± ± μm (3σ) ± ± μm (3σ) ± ± μm (3σ) ± ± μm (3σ) ± ± μm (3σ) ± ± μm (3σ) ± ± OPyC Diameter The OPyC thickness was varied ±6 μm (3 ) from the nominal value of 45 μm (Tables 1.12 and 1.14, and Figure 1.48 of HTTR-GCR-RESR-001) to determine the effective uncertainty in k eff. All other thicknesses in the TRISO particle were maintained the same. The packing fraction of the TRISO particles in the fuel was not conserved but remained within 1 of the nominal value of 30 vol. % (±3 % in Table 1.14 of HTTR-GCR-RESR-001). Results are shown in Table 2.6. The total number of TRISO particles used in the fully-loaded core is approximately 868,140,000. For determining the random component of the uncertainty, the results in Table 2.6 would be divided by N, where N for each case is shown in Table 2.6. Table 2.6. Effect of Uncertainty in OPyC Diameter. Case Deviation Δk ± σ Δk Scaling Factor Δk eff (1σ) ± σ Δkeff N -6 μm (3σ) ± ± μm (3σ) ± ± μm (3σ) ± ± μm (3σ) ± ± μm (3σ) ± ± μm (3σ) ± ± μm (3σ) ± ± μm (3σ) ± ± μm (3σ) ± ± μm (3σ) ± ± Revision: 0 Page 19 of 183
25 Overcoat Diameter Because insufficient data is available for the final composition and density of the graphite overcoat, this layer is being treated with equal properties to that of the surrounding compact graphite matrix (Table 1.14 of HTTR-GCR-RESR-001). Therefore modification of the overcoat diameter would not generate an effective uncertainty in k eff beyond statistical uncertainty Prismatic Fuel Compact Dimensions The inner and outer diameters (ID and OD) of a fuel compact were each individually varied ±0.3 mm and the height (H) was varied ±0.5 mm to determine the effective uncertainty in k eff. For the effective change in height, the fuel stack height was adjusted by ±7.0 mm and the effect from a height change in a single fuel compact was then determined by dividing by 14 for the number of compacts in a fuel rod. The nominal values for the inner diameter, outer diameter, and height of the fuel compacts are 10.0, 26.0, and 39.0 mm, respectively (Table 1.14 of HTTR-GCR-RESR-001). Results are shown in Tables 2.7 through 2.9. In essence, changing the dimensions of the fuel compact without changing the number of TRISO particles would slightly adjust the packing fraction, but within the uncertainty limits. Later information was obtained regarding manufacturing tolerances for the fuel compacts. The ±0.1 mm of the ID and OD represents a bounding limit (with assumed uniform probability) and the effective stack height has a bounding limit (with assumed uniform probability) of ±1.0 mm. a The appropriate corrections to the scaling factors have been incorporated into the uncertainty analysis of these parameters. The total number of fuel compacts used in the fully-loaded core is 66,780. For determining the random component of the uncertainty, the results in Tables 2.7 through 2.9 would be divided by N, where N for each case is shown in Tables 2.7 through 2.9. Table 2.7. Effect of Uncertainty in Compact Dimensions (Inner Diameter). Case Deviation Δk ± σ Δk Scaling Factor Δk eff (1σ) ± σ Δkeff N -0.3 mm (3 limit) ± ± mm (3 limit) ± ± mm (3 limit) ± ± mm (3 limit) ± ± mm (3 limit) ± ± mm (3 limit) ± ± mm (3 limit) ± ± mm (3 limit) ± ± mm (3 limit) ± ± mm (3 limit) ± ± ,370 45,990 52,920 52,920 59,850 a S. Maruyama, K. Yamashita, N. Fujimoto, I. Murata, R. Shindo, and Y. Sudo, Determination of Hot Spot Factors for Calculation of the Maximum Fuel Temperatures in the Core Thermal and Hydraulic Design of HTTR, JAERI- M , JAEA (November 18, 1988). [in Japanese]. Revision: 0 Page 20 of 183
26 Table 2.8. Effect of Uncertainty in Compact Dimensions (Outer Diameter). Case Deviation Δk ± σ Δk Scaling Factor Δk eff (1σ) ± σ Δkeff N -0.3 mm (3 limit) ± ± mm (3 limit) ± ± mm (3 limit) ± ± mm (3 limit) ± ± mm (3 limit) ± ± mm (3 limit) ± ± mm (3 limit) ± ± mm (3 limit) ± ± mm (3 limit) ± ± mm (3 limit) ± ± ,370 45,990 52,920 52,920 59,850 Table 2.9. Effect of Uncertainty in Compact Dimensions (Height). Case Deviation Δk ± σ Δk Scaling Factor Δk eff (1σ) ± σ Δkeff N -7.0 mm (7 limit) ± ± mm (7 limit) ± ± mm (7 limit) ± ± mm (7 limit) ± ± mm (7 limit) ± ± mm (7 limit) ± ± mm (7 limit) ± ± mm (7 limit) ± ± mm (7 limit) ± ± mm (7 limit) ± ± ,370 45,990 52,920 52,920 59,850 Packing Fraction Because of the overspecification of the TRISO particles in Table 1.14 (HTTR-GCR-RESR-001) and the correlation of uranium kernel diameter, density, TRISO packing fraction, and mass, the effect of the uncertainty in the packing fraction is not included in the total uncertainty. However, an analysis of the uncertainty based upon the fuel mass is performed in Section Graphite Sleeves The uncertainty in the sleeve thickness was unreported. An inner diameter uncertainty of ±0.5 mm, which is limited by the 0.25 mm gap width between the sleeve and fuel compacts (Table 1.13 of HTTR-GCR-RESR-001), and an outer diameter uncertainty of ±2 mm were assumed; their effects on the Revision: 0 Page 21 of 183
27 uncertainty of k eff were determined. Figure 1.51 of HTTR-GCR-RESR-001 shows an inner diameter of mm for the graphite sleeves, which would only provide a gap space of mm. The assumed uncertainty encompasses the discrepancy in this value. Results are shown in Tables 2.10 and The fuel sleeve height was varied ±0.5 mm from the nominal value of 577 mm (Table 1.14 and Figure 1.51 of HTTR-GCR-RESR-001) and the effect on the uncertainty of k eff was determined. Results are shown in Table Later information was obtained regarding manufacturing tolerances for the fuel sleeves. The ±0.1 mm of the ID and OD represents a bounding limit (with assumed uniform probability) and the height is then assumed to have a bounding limit (with assumed uniform probability) also of ±0.1 mm. a The appropriate corrections to the scaling factors have been incorporated into the uncertainty analysis of these parameters. The total number of graphite sleeves used in the fully-loaded core is 4,770. For determining the random component of the uncertainty, the results in Tables 2.10 through 2.12 would be divided by N, where N for each case is shown in Tables 2.10 through Table Effect of Uncertainty in Graphite Sleeve Dimensions (Inner Diameter). Case Deviation Δk ± σ Δk Scaling Factor Δk eff (1σ) ± σ Δkeff N -0.5 mm ± ± mm ± ± mm ± ± mm ± ± mm ± ± mm ± ± mm ± ± mm ± ± mm ± ± mm ± ± ,955 3,285 3,780 3,780 4,275 a S. Maruyama, K. Yamashita, N. Fujimoto, I. Murata, R. Shindo, and Y. Sudo, Determination of Hot Spot Factors for Calculation of the Maximum Fuel Temperatures in the Core Thermal and Hydraulic Design of HTTR, JAERI- M , JAEA (November 18, 1988). [in Japanese]. Revision: 0 Page 22 of 183
28 Table Effect of Uncertainty in Graphite Sleeve Dimensions (Outer Diameter). Case Deviation Δk ± σ Δk Scaling Factor Δk eff (1σ) ± σ Δkeff N -2 mm ± ± mm ± ± mm ± ± mm ± ± mm ± ± mm ± ± mm ± ± mm ± ± mm ± ± mm ± ± ,955 3,285 3,780 3,780 4,275 Table Effect of Uncertainty in Graphite Sleeve Dimensions (Height). Case Deviation Δk ± σ Δk Scaling Factor Δk eff (1σ) ± σ Δkeff N -0.5 mm (1σ) ± ± mm (1σ) ± ± mm (1σ) ± ± mm (1σ) ± ± mm (1σ) ± ± mm (1σ) ± ± mm (1σ) ± ± mm (1σ) ± ± mm (1σ) ± ± mm (1σ) ± ± ,955 3,285 3,780 3,780 4, Burnable Poisons The uncertainty in the diameters of the BPs and BP insertion holes was unreported. A BP diameter uncertainty of ±1 mm from the nominal diameter (D) of 14 mm and a BP insertion hole diameter uncertainty of ±1 mm from the nominal diameter of 15 mm were assumed and their effects on the uncertainty of k eff were determined. Results are shown in Tables 2.13 and The uncertainty in the height stack of the BPs was unreported. A stack height (H) uncertainty of ±1 mm from the nominal height of 200 mm was assumed (approximately ±0.1 mm per BP pellet) and the effective uncertainty in k eff was determined. The height of the BP insertion hole was adjusted to accommodate the change in BP stack height. Results are shown in Table Revision: 0 Page 23 of 183
29 The uncertainty in the dimensions of the graphite disks was unreported. A diameter uncertainty of ±1 mm from the nominal diameter of 14 mm and a height uncertainty of ±1 mm from the nominal stack height of 100 mm were assumed and their effects on the uncertainty of k eff were determined. The height of the BP insertion hole was adjusted to accommodate the change in graphite-disk stack height. Results are shown in Tables 2.16 and Because of the tight manufacturing tolerances of the fuel compacts and graphite sleeves (Sections and , respectively) it is believed that similar tolerances apply to other graphite and boron carbide components of the HTTR. Therefore, the BP and graphite disk diameters are treated with a tolerance (with uniform probability) of ±0.1 mm and a stack height tolerance (with uniform probability) of ±1.0 mm. The appropriate corrections to the scaling factors have been incorporated into the uncertainty analysis of these parameters. The total number of burnable poison pellets used in the fully-loaded core is 5,520. For determining the random component of the uncertainty, the results in Tables 2.13 through 2.17 would be divided by N, where N for each case is shown in Tables 2.13 through The total number of BP stacks is 600, of BP insertion holes is 450, and of graphite disk stacks is 300, in the fully-loaded core configuration. Table Effect of Uncertainty in BP Pin Dimensions (Diameter). Case Deviation Δk ± σ Δk Scaling Factor Δk eff (1σ) ± σ Δkeff N -1 mm (10 limit) ± ± mm (10 limit) ± ± mm (10 limit) ± ± mm (10 limit) ± ± mm (10 limit) ± ± mm (10 limit) ± ± mm (10 limit) ± ± mm (10 limit) ± ± mm (10 limit) ± ± mm (10 limit) ± ± ,496 3,864 4,416 4,416 4,968 Revision: 0 Page 24 of 183
30 Table Effect of Uncertainty in BP Pin Dimensions (Stack Height). Case Deviation Δk ± σ Δk Scaling Factor Δk eff (1σ) ± σ Δkeff N -1 mm ± ± mm ± ± mm ± ± mm ± ± mm ± ± mm ± ± mm ± ± mm ± ± mm ± ± mm ± ± Table Effect of Uncertainty in BP Insertion Hole Diameter. Case Deviation Δk ± σ Δk Scaling Factor Δk eff (1σ) ± σ Δkeff N -1 mm (10 limit) ± ± mm (10 limit) ± ± mm (10 limit) ± ± mm (10 limit) ± ± mm (10 limit) ± ± mm (10 limit) ± ± mm (10 limit) ± ± mm (10 limit) ± ± mm (10 limit) ± ± mm (10 limit) ± ± Revision: 0 Page 25 of 183
31 Table Effect of Uncertainty in Graphite Disk Dimensions (Diameter). Case Deviation Δk ± σ Δk Scaling Factor Δk eff (1σ) ± σ Δkeff N -1 mm (10 limit) ± ± mm (10 limit) ± ± mm (10 limit) ± ± mm (10 limit) ± ± mm (10 limit) ± ± mm (10 limit) ± ± mm (10 limit) ± ± mm (10 limit) ± ± mm (10 limit) ± ± mm (10 limit) ± ± Table Effect of Uncertainty in Graphite Disk Dimensions (Stack Height). Case Deviation Δk ± σ Δk Scaling Factor Δk eff (1σ) ± σ Δkeff N -1 mm ± ± mm ± ± mm ± ± mm ± ± mm ± ± mm ± ± mm ± ± mm ± ± mm ± ± mm ± ± Control Rods Absorber Dimensions The uncertainty in the absorber dimensions was unreported. Assumed inner and outer diameter (ID and OD) uncertainties are ±5 mm each from the nominal values of 75 and 105 mm (Table 1.15 of HTTR-GCR-RESR-001), respectively, and their effects on the uncertainty of k eff were determined. The uncertainty in the pellet height was assumed to be ±1 cm from the nominal stack height (H) of 29 cm. The alternate value of 115 mm provided for the outer diameter of the absorber material is believed to be a typographical error (see footnote of Table 1.15 of HTTR-GCR-RESR-001). Results are shown in Tables 2.18 through Revision: 0 Page 26 of 183
32 Because of the tight manufacturing tolerances of the fuel compacts and graphite sleeves (Sections and , respectively) it is believed that similar tolerances apply to other graphite and boron carbide components of the HTTR. Therefore, the absorber diameters are treated with a tolerance (with uniform probability) of ±0.1 mm and a stack height tolerance (with uniform probability) of ±1.0 mm. The appropriate corrections to the scaling factors have been incorporated into the uncertainty analysis of these parameters. The total number of control rod absorber pellets used in the fully-loaded core is approximately 975, as approximately 30% of the control rods are actually inserted into the core. For determining the random component of the uncertainty, the results in Tables 2.18 through 2.20 would be divided by N, where N for each case is shown in Tables 2.18 through Table Effect of Uncertainty in CR Absorber Dimensions (Inner Diameter). Case Deviation Δk ± σ Δk Scaling Factor Δk eff (1σ) ± σ Δkeff N -5 mm (50 limit) ± ± mm (50 limit) ± ± mm (50 limit) ± ± mm (50 limit) ± ± mm (50 limit) ± ± mm (50 limit) ± ± mm (50 limit) ± ± mm (50 limit) ± ± mm (50 limit) ± ± mm (50 limit) ± ± Table Effect of Uncertainty in CR Absorber Dimensions (Outer Diameter). Case Deviation Δk ± σ Δk Scaling Factor Δk eff (1σ) ± σ Δkeff N -5 mm (50 limit) ± ± mm (50 limit) ± ± mm (50 limit) ± ± mm (50 limit) ± ± mm (50 limit) ± ± mm (50 limit) ± ± mm (50 limit) ± ± mm (50 limit) ± ± mm (50 limit) ± ± mm (50 limit) ± ± Revision: 0 Page 27 of 183
33 Table Effect of Uncertainty in CR Absorber Dimensions (Stack Height). Case Deviation Δk ± σ Δk Scaling Factor Δk eff (1σ) ± σ Δkeff N -1 cm (10 limit) ± ± cm (10 limit) ± ± cm (10 limit) ± ± cm (10 limit) ± ± cm (10 limit) ± ± cm (10 limit) ± ± cm (10 limit) ± ± cm (10 limit) ± ± cm (10 limit) ± ± cm (10 limit) ± ± Clad Dimensions The uncertainty in the clad dimensions was unreported, and detailed dimensions for anything similar to the diagram shown in Figure 1.60 of HTTR-GCR-RESR-001were unavailable. Therefore a solid clad material encasing the control rod absorber was defined without detail for the end caps. Inner and outer thicknesses were varied ±5 mm from the nominal values of 65 and 113 mm (Table 1.15 of HTTR-GCR-RESR-001), respectively, to determine their effects on the uncertainty of k eff. The spine diameter was varied ±10 mm from the nominal value of 10 mm (Table 1.15 of HTTR-GCR-RESR-001) and its effect on the uncertainty of k eff was determined. The clad height of a single control rod section was varied ±1 cm. The reported clad thickness of 3.5 mm does not appear to conform to the difference between reported diameters of the clad and absorber materials. It is unclear whether a gap exists or there is rounding of values in the original table. The uncertainties evaluated encompass the overall uncertainty in this discrepancy. The control rod diameters are chosen as the more appropriate dimensions for modeling, such that inner and outer clad thicknesses are approximately 5 and 4 mm, respectively. Results are shown in Tables 2.21 through Height change of clad also affects the effective height of each control rod segment. Because of the tight manufacturing tolerances of the fuel compacts and graphite sleeves (Sections and , respectively) it is believed that tighter tolerances apply to the absorber cladding. Therefore, the diameters are treated with a tolerance (with uniform probability) of ±0.5 mm and a height tolerance (with uniform probability) of ±1.0 mm. The appropriate corrections to the scaling factors have been incorporated into the uncertainty analysis of these parameters. The total number of control rod sections used in the fully-loaded core is approximately 97.5, as approximately 30% of the control rods are actually inserted into the core. For determining the random component of the uncertainty, the results in Tables 2.21 through 2.24 would be divided by N, where N for each case is shown in Tables 2.21 through Revision: 0 Page 28 of 183
34 Table Effect of Uncertainty in CR Clad Dimensions (Inner Diameter). Case Deviation Δk ± σ Δk Scaling Factor Δk eff (1σ) ± σ Δkeff N -5 mm (10 limit) ± ± mm (10 limit) ± ± mm (10 limit) ± ± mm (10 limit) ± ± mm (10 limit) ± ± mm (10 limit) ± ± mm (10 limit) ± ± mm (10 limit) ± ± mm (10 limit) ± ± mm (10 limit) ± ± Table Effect of Uncertainty in CR Clad Dimensions (Outer Diameter). Case Deviation Δk ± σ Δk Scaling Factor Δk eff (1σ) ± σ Δkeff N -5 mm (10 limit) ± ± mm (10 limit) ± ± mm (10 limit) ± ± mm (10 limit) ± ± mm (10 limit) ± ± mm (10 limit) ± ± mm (10 limit) ± ± mm (10 limit) ± ± mm (10 limit) ± ± mm (10 limit) ± ± Revision: 0 Page 29 of 183
35 Table Effect of Uncertainty in CR Clad Dimensions (Height). Case Deviation Δk ± σ Δk Scaling Factor Δk eff (1σ) ± σ Δkeff N -1 cm (10 limit) ± ± cm (10 limit) ± ± cm (10 limit) ± ± cm (10 limit) ± ± cm (10 limit) ± ± cm (10 limit) ± ± cm (10 limit) ± ± cm (10 limit) ± ± cm (10 limit) ± ± cm (10 limit) ± ± Table Effect of Uncertainty in CR Clad Dimensions (Spine Diameter). Case Deviation Δk ± σ Δk Scaling Factor Δk eff (1σ) ± σ Δkeff N -10 mm (20 limit) ± ± mm (20 limit) ± ± mm (20 limit) ± ± mm (20 limit) ± ± mm (20 limit) ± ± mm (20 limit) ± ± mm (20 limit) ± ± mm (20 limit) ± ± mm (20 limit) ± ± mm (20 limit) ± ± Instrumentation Insufficient information is available to comprehensively model and evaluate the uncertainties and biases related to the utility of instrumentation in the HTTR. Neglect of instrumentation inclusion in the model would be a bias; uncertainty in the dimensions and composition of the instrumentation would provide uncertainty in that bias or uncertainty in the model should it have been included in the benchmark model. An approximation of the instrumentation in the HTTR was modeled using information from Section of HTTR-GCR-RESR-001 and approximate diagrams shown in a presentation at the IAEA CRP- Revision: 0 Page 30 of 183
36 5 Meeting. a The expected bias in the instrumentation, from the aforementioned reference, is ~0.2 % k/k. Figures 2.1 through 2.4 provide basic geometric descriptions of the instrumentation utilized in the HTTR core. Figure 2.1 shows the respective heights. Figure 2.2, 2.3, and 2.4 provide additional information regarding channels 1, 2, and 3, respectively (columns E05, E13, and E21, respectively, in Figure 2.5). The 5-cm long 0.6-cm diameter BF 3 counters were modeled containing gas at 1 atm with 100 at.% 10 B content. All metallic components were modeled as aluminum. Approximate dimensions were used based on scaling of the Figures 2.2 through 2.4 and the known hole diameter of 123 mm. Approximate biases were calculated for the annular core configurations (Table 3.1). The bias for the fully-loaded core critical was calculated to be ± % k/k (HTTR-GCR-RESR-001 Section ), which is similar to the previously reported value. The uncertainty in the biases was approximated by dividing the biases in half, and then treating it as a bounding uncertainty and dividing by 3. The uncertainty in the instrumentation is included in the total benchmark model uncertainty, and is provided in Table 3.1. The instrumentation is not included in the benchmark model but the bias in used to correct the experimental k eff. Because the actual dimensions and material properties are approximated, this uncertainty is treated as completely systematic with no random components. Figure 2.1. Vertical Position of the Temporary Neutron Detectors (Ref 1, p. 314). BF 3 = boron-trifluoride neutron detector CIC = gamma-ray compensated ionization chamber FC = micro-fission chamber a N. Fujimoto, N. Nojiri, and K. Yamashita, HTTR s Benchmark Calculation of Start-Up Core Physics Tests, Report of the 3 rd Research Coordiation Meeting on the CRP, IAEA, Oarai, Japan, March (2001). Revision: 0 Page 31 of 183
37 Figure 2.2. Approximation of Instrumentation Channel 1 (Column E05). a a N. Fujimoto, N. Nojiri, and K. Yamashita, HTTR s Benchmark Calculation of Start-Up Core Physics Tests, Report of the 3 rd Research Coordination Meeting on the CRP, IAEA, Oarai, Japan, March (2001). Revision: 0 Page 32 of 183
38 Figure 2.3. Approximation of Instrumentation Channel 2 (Column E13). a a N. Fujimoto, N. Nojiri, and K. Yamashita, HTTR s Benchmark Calculation of Start-Up Core Physics Tests, Report of the 3 rd Research Coordination Meeting on the CRP, IAEA, Oarai, Japan, March (2001). Revision: 0 Page 33 of 183
39 Figure 2.4. Approximation of Instrumentation Channel 3 (Column E21). a a N. Fujimoto, N. Nojiri, and K. Yamashita, HTTR s Benchmark Calculation of Start-Up Core Physics Tests, Report of the 3 rd Research Coordination Meeting on the CRP, IAEA, Oarai, Japan, March (2001). Revision: 0 Page 34 of 183


.")
40 Figure 2.5. Fuel Column Name and Zone Number in the HTTR Core (adapted from Ref. 2, p. 12). Revision: 0 Page 35 of 183
41 Graphite Blocks Block Dimensions An uncertainty in the block dimensions was unreported. The uncertainty in the flat-to-flat distance and the height were each varied ±1 mm from their nominal values of 360 and 580 cm (Tables 1.13 and 1.16 of HTTR-GCR-RESR-001), respectively, and their effects on the uncertainty of k eff were determined. The average gap between columns was reported as approximately 2 mm (Ref. 2, p. 13), allowing room for the flat-to-flat uncertainty. All graphite blocks were varied with this analysis: fuel, reflector, control, instrumentation, and dummy. Results are shown in Tables 2.25 and Because of the tight manufacturing tolerances of the fuel compacts and graphite sleeves (Sections and , respectively) it is believed that similar tolerances apply to other graphite and boron carbide components of the HTTR. Therefore, the graphite block dimensions are treated with a tolerance (with uniform probability) of ±0.1 mm. The appropriate corrections to the scaling factors have been incorporated into the uncertainty analysis of these parameters. The total number of graphite blocks used in all core configurations is 549. For determining the random component of the uncertainty, the results in Tables 2.25 and 2.26 would be divided by 549. Table Effect of Uncertainty in Graphite Block Dimensions (Flat-to-Flat Distance). Case Deviation Δk ± σ Δk 1 Scaling Factor Δk eff (1σ) ± σ Δkeff -1 mm (10 limit) ± ± mm (10 limit) ± ± mm (10 limit) ± ± mm (10 limit) ± ± mm (10 limit) ± ± mm (10 limit) ± ± mm (10 limit) ± ± mm (10 limit) ± ± mm (10 limit) ± ± mm (10 limit) ± ± Revision: 0 Page 36 of 183
42 Table Effect of Uncertainty in Graphite Block Dimensions (Height). Case Deviation Δk ± σ Δk Scaling Factor Δk eff (1σ) ± σ Δkeff -1 mm (10 limit) ± ± mm (10 limit) ± ± mm (10 limit) ± ± mm (10 limit) ± ± mm (10 limit) ± ± mm (10 limit) ± ± mm (10 limit) ± ± mm (10 limit) ± ± mm (10 limit) ± ± mm (10 limit) ± ± Dowel/Socket Dimensions Insufficient information is available to completely model and evaluate the uncertainties and biases related to the incorporation of dowels and sockets in the HTTR. Uncertainty in the volume fraction will be included as part of the assessment of the uncertainty in the total density of the graphite blocks. Coolant Channel Diameter An assumed variation of ±2 mm in the diameter of the coolant channels of the fuel blocks (nominally 41 mm, Table 1.13 of HTTR-GCR-RESR-001) and reflector blocks (nominally 23 mm) in the fuel columns was performed to determine the effective uncertainty in k eff. Results are shown in Tables 2.27 and Insufficient information was available to determine the dimensions of the coolant channels of the lowest reflector blocks. They were modeled similar to the other reflector blocks utilized in the fuel columns. No bias or biased uncertainty was assessed. Because of the tight manufacturing tolerances of the fuel compacts and graphite sleeves (Sections and , respectively) it is believed that similar tolerances apply to other graphite and boron carbide components of the HTTR. Therefore, the coolant channel diameters are treated with a tolerance (with uniform probability) of ±0.1 mm. The appropriate corrections to the scaling factors have been incorporated into the uncertainty analysis of these parameters. The total number of fuel coolant channels used in the fully-loaded core is 4,770. For determining the random component of the uncertainty, the results in Table 2.27 would be divided by N. The total number of reflector coolant channels in all core configurations is 3,816. For determining the random component of the uncertainty, the results in Table 2.28 would be divided by 3,816. Revision: 0 Page 37 of 183
43 Table Effect of Uncertainty in Coolant Channel Diameter (Fuel Blocks). Case Deviation Δk ± σ Δk 1 Scaling Factor Δk eff (1σ) ± σ Δkeff N -2 mm (20 limit) ± ± mm (20 limit) ± ± , mm (20 limit) ± ± mm (20 limit) ± ± mm (20 limit) ± ± mm (20 limit) ± ± mm (20 limit) ± ± mm (20 limit) ± ± mm (20 limit) ± ± mm (20 limit) ± ± ,285 3,780 3,780 4,275 Table Effect of Uncertainty in Coolant Channel Diameter (Reflector Blocks). Case Deviation Δk ± σ Δk 1 Scaling Factor Δk eff (1σ) ± σ Δkeff -2 mm (20 limit) ± ± mm (20 limit) ± ± mm (20 limit) ± ± mm (20 limit) ± ± mm (20 limit) ± ± mm (20 limit) ± ± mm (20 limit) ± ± mm (20 limit) ± ± mm (20 limit) ± ± mm (20 limit) ± ± Fuel and Coolant Channel Pitch An uncertainty in the fuel and coolant channel pitches in the fuel columns was not reported. For the evaluation of this uncertainty, the channels were modeled closer together then further apart by adjusting the pitch between them. A variation of ±2.0 mm from the nominal pitch of 51.5 mm (Figures 1.52 and 1.53 of HTTR-GCR-RESR-001) was assumed and the effects on the uncertainty of k eff were determined. Results are shown in Table Because of the tight manufacturing tolerances of the fuel compacts and graphite sleeves (Sections and , respectively) it is believed that similar tolerances apply to other graphite and boron carbide components of the HTTR. Therefore, the coolant channel pitch is treated with a tolerance (with uniform Revision: 0 Page 38 of 183
44 probability) of ±0.1 mm. The appropriate corrections to the scaling factors have been incorporated into the uncertainty analysis of these parameters. The total number of pitch positions used in the fully-loaded core is 8,586. For determining the random component of the uncertainty, the results in Table 2.29 would be divided by N, where N for each case is shown in Table Table Effect of Uncertainty in Fuel and Coolant Channel Pitch. Case Deviation Δk ± σ Δk Scaling Factor Δk eff (1σ) ± σ Δkeff N -2 mm (20 limit) ± ± mm (20 limit) ± ± mm (20 limit) ± ± mm (20 limit) ± ± mm (20 limit) ± ± mm (20 limit) ± ± mm (20 limit) ± ± mm (20 limit) ± ± mm (20 limit) ± ± mm (20 limit) ± ± ,771 7,101 7,596 7,596 8,091 Handling Socket Dimensions The handling sockets were not included in the model as there was insufficient information to model them completely. The calculated volume of the socket (estimated using dimensions in Figure 1.52 of HTTR-GCR-RESR-001) is roughly 0.5 vol. % of the complete block envelope. This volume reduction is included as a reduction in total block density in the benchmark model. A bias has not been assessed. Uncertainty in the volume fraction will be included as part of the assessment of the uncertainty in the total density of the graphite blocks. Column Pitch An uncertainty in column pitch was assumed based upon the average distance between blocks of approximately 2 mm. For the evaluation of this uncertainty, the columns were modeled closer together then further apart by adjusting the pitch between them. A variation of ±2 mm (2 bounding limit) from the nominal value of 362 mm was analyzed and the effects on the uncertainty of k eff were determined. Results are shown in Table The total number of columns used in all core configurations is 61. For determining the random component of the uncertainty, the results in Table 2.30 would be divided by 61. Revision: 0 Page 39 of 183
45 Table Effect of Uncertainty in Column Pitch. Case Deviation Δk ± σ Δk Scaling Factor Δk eff (1σ) ± σ Δkeff -2 mm ± ± mm ± ± mm ± ± mm ± ± mm ± ± mm ± ± mm ± ± mm ± ± mm ± ± mm ± ± Control-Rod Channel Diameter An assumed variation of ±2 mm in the diameter of the control-rod coolant channels (nominal value of 123 mm, Figure 1.64 of HTTR-GCR-RESR-001) in the control block columns was performed to determine the effective uncertainty in k eff. Results are shown in Table Because of the tight manufacturing tolerances of the fuel compacts and graphite sleeves (Sections and , respectively) it is believed that similar tolerances apply to other graphite and boron carbide components of the HTTR. Therefore, the control-rod channel diameter is treated with a tolerance (with uniform probability) of ±0.1 mm. The appropriate corrections to the scaling factors have been incorporated into the uncertainty analysis of these parameters. The total number of control-rod channels (including empty instrumentation channels) in blocks used in all core configurations is approximately 437. For determining the random component of the uncertainty, the results in Table 2.31 would be divided by 437. Revision: 0 Page 40 of 183
46 Table Effect of Uncertainty in CR Channel Diameter. Case Deviation Δk ± σ Δk Scaling Factor Δk eff (1σ) ± σ Δkeff -2 mm (20 limit) ± ± mm (20 limit) ± ± mm (20 limit) ± ± mm (20 limit) ± ± mm (20 limit) ± ± mm (20 limit) ± ± mm (20 limit) ± ± mm (20 limit) ± ± mm (20 limit) ± ± mm (20 limit) ± ± Control-Rod Channel Pitch An uncertainty in control-rod coolant channel pitch in the fuel and reflector blocks was not reported. For the evaluation of this uncertainty, the channels were modeled closer together then further apart by adjusting the pitch between them. A variation of ±2 mm from the nominal distance of 108 mm from the block axis (Figure 1.64 of HTTR-GCR-RESR-001) was assumed and the effects on the uncertainty of k eff were determined. Results are shown in Table Because of the tight manufacturing tolerances of the fuel compacts and graphite sleeves (Sections and , respectively) it is believed that similar tolerances apply to other graphite and boron carbide components of the HTTR. Therefore, the control-rod channel pitch is treated with a tolerance (with uniform probability) of ±0.1 mm. The appropriate corrections to the scaling factors have been incorporated into the uncertainty analysis of these parameters. The total number of control-rod channels (including empty instrumentation channels) in blocks used in the all core configurations is approximately 437. For determining the random component of the uncertainty, the results in Table 2.32 would be divided by 437. Revision: 0 Page 41 of 183
47 Table Effect of Uncertainty in Control-Rod Channel Pitch. Case Deviation Δk ± σ Δk Scaling Factor Δk eff (1σ) ± σ Δkeff -2 mm (20 limit) ± ± mm (20 limit) ± ± mm (20 limit) ± ± mm (20 limit) ± ± mm (20 limit) ± ± mm (20 limit) ± ± mm (20 limit) ± ± mm (20 limit) ± ± mm (20 limit) ± ± mm (20 limit) ± ± Permanent Reflectors Insufficient information is available to model in detail the permanent reflector of the HTTR. A bias was not assessed for any simplification of the permanent reflector. The actual reflector is in the shape of a dodecagon block with an overall diameter and length of 4250 mm and 5250 mm, respectively. It is unclear as to whether the diameter is inscribed within or circumscribed around the polygon. A radial representation of the permanent reflector had the outer diameter varied ±10 cm to determine the effective change in k. The difference between the reported diameter and an equivalent diameter circle representative of an inscribed or circumscribed dodecagon would by -10 cm and +5 cm, respectively. This uncertainty is treated as a bounding uncertainty. Any uncertainty in the unreported manufacturing tolerances would be negligible. Results are shown in Table The permanent reflector is comprised of 12 circumferential segments in eight axial layers for a total of 96 blocks. However, the uncertainty in the diameter of the model s permanent reflector is not adjusted for random uncertainty and treated as 100% systematic because of the uncertainty in the overall detail of the permanent reflector. Revision: 0 Page 42 of 183
48 Table Effect of Uncertainty in Permanent Reflector Diameter. Case Deviation Δk ± σ Δk Scaling Factor Δk eff (1σ) ± σ Δkeff -10 cm ± ± cm ± ± cm ± ± cm ± ± cm ± ± cm ± ± cm ± ± cm ± ± cm ± ± cm ± ± Dummy Blocks The uncertainty in the outer dimensions of the dummy blocks was included with the graphite block analysis in Section There are two types of dummy blocks, one with a hole pattern similar to that of a control block, and the other with three holes but of smaller diameter (Ref. 2, p. 14). Because the true dimensions of the smaller hole design is unknown, the dummy blocks will all be modeled with the holes of the control blocks but an additional uncertainty will be added to account for this discrepancy. This uncertainty will be assessed by completely filling the holes of the dummy blocks with IG-11 graphite material (Section ) Compositional Variations Coated Fuel Particles Uranium Enrichment The concentration of 234 U expected in the TRISO fuel had to be determined, as it was not provided. First the weight fractions of isotopes in natural uranium dioxide were determined. Then the enriched weight percent of 235 U was multiplied by the natural weight percent of 234 U ( at.%) and divided by the natural weight percent of 235 U (0.72 at.%). Thus an approximate concentration of enriched 234 U content could be determined for this evaluation, which may slightly underestimate the actual 234 U content. γ γ =. Natural Enriched 234 U Enriched 234 γ Natural 235 U U γ 235 U Information was not provided regarding the uncertainty in the uranium enrichment of the TRISO kernels. It is reported elsewhere that the manufacturing tolerance limit for the enrichment is 4.5% of the reported weight percent. a For example, the enrichment of 3.4 wt.% is bound within a tolerance of ±0.153 wt.%. a S. Maruyama, K. Yamashita, N. Fujimoto, I. Murata, R. Shindo, and Y. Sudo, Determination of Hot Spot Factors for Calculation of the Maximum Fuel Temperatures in the Core Thermal and Hydraulic Design of HTTR, JAERI- M , JAEA (November 18, 1988). [in Japanese]. Revision: 0 Page 43 of 183
49 The 234 U content adjusted to match the effective increase or decrease in enrichment of 235 U, to determine the effective uncertainty in k eff. The nominal enrichment values are shown in Figure 1.46 and Table 1.11 of HTTR-GCR-RESR-001. Results are shown in Tables 2.34 through The actual uncertainty in the uranium enrichment is much smaller than the manufacturing limits; however this information is not publicly available. Therefore, the bounding limits are treated with a normal distribution instead of one with uniform probability. Configurations 1 through 4 do not contain uranium fuel with the enrichments of 3.40 and 6.70 wt.%. The uncertainty in the uranium enrichment is considered all systematic with no random component. Table Effect of Uncertainty in Uranium Enrichment (Case 1). Deviation Δk ± σ Δk Scaling Factor Δk eff (1σ) ± σ Δkeff wt.% of 3.9 wt.% ± ± wt.% of 3.9 wt.% ± ± wt.% of 4.3 wt.% ± ± wt.% of 4.3 wt.% ± ± wt.% of 4.8 wt.% ± ± wt.% of 4.8 wt.% ± ± wt.% of 5.2 wt.% ± ± wt.% of 5.2 wt.% ± ± wt.% of 5.9 wt.% ± ± wt.% of 5.9 wt.% ± ± wt.% of 6.3 wt.% ± ± wt.% of 6.3 wt.% ± ± wt.% of 7.2 wt.% ± ± wt.% of 7.2 wt.% ± ± wt.% of 7.9 wt.% ± ± wt.% of 7.9 wt.% ± ± wt.% of 9.4 wt.% ± ± wt.% of 9.4 wt.% ± ± wt.% of 9.9 wt.% ± ± wt.% of 9.9 wt.% ± ± Revision: 0 Page 44 of 183
50 Table Effect of Uncertainty in Uranium Enrichment (Case 2). Deviation Δk ± σ Δk Scaling Factor Δk eff (1σ) ± σ Δkeff wt.% of 3.9 wt.% ± ± wt.% of 3.9 wt.% ± ± wt.% of 4.3 wt.% ± ± wt.% of 4.3 wt.% ± ± wt.% of 4.8 wt.% ± ± wt.% of 4.8 wt.% ± ± wt.% of 5.2 wt.% ± ± wt.% of 5.2 wt.% ± ± wt.% of 5.9 wt.% ± ± wt.% of 5.9 wt.% ± ± wt.% of 6.3 wt.% ± ± wt.% of 6.3 wt.% ± ± wt.% of 7.2 wt.% ± ± wt.% of 7.2 wt.% ± ± wt.% of 7.9 wt.% ± ± wt.% of 7.9 wt.% ± ± wt.% of 9.4 wt.% ± ± wt.% of 9.4 wt.% ± ± wt.% of 9.9 wt.% ± ± wt.% of 9.9 wt.% ± ± Revision: 0 Page 45 of 183
51 Table Effect of Uncertainty in Uranium Enrichment (Case 3). Deviation Δk ± σ Δk Scaling Factor Δk eff (1σ) ± σ Δkeff wt.% of 3.9 wt.% ± ± wt.% of 3.9 wt.% ± ± wt.% of 4.3 wt.% ± ± wt.% of 4.3 wt.% ± ± wt.% of 4.8 wt.% ± ± wt.% of 4.8 wt.% ± ± wt.% of 5.2 wt.% ± ± wt.% of 5.2 wt.% ± ± wt.% of 5.9 wt.% ± ± wt.% of 5.9 wt.% ± ± wt.% of 6.3 wt.% ± ± wt.% of 6.3 wt.% ± ± wt.% of 7.2 wt.% ± ± wt.% of 7.2 wt.% ± ± wt.% of 7.9 wt.% ± ± wt.% of 7.9 wt.% ± ± wt.% of 9.4 wt.% ± ± wt.% of 9.4 wt.% ± ± wt.% of 9.9 wt.% ± ± wt.% of 9.9 wt.% ± ± Revision: 0 Page 46 of 183
52 Table Effect of Uncertainty in Uranium Enrichment (Case 4). Deviation Δk ± σ Δk Scaling Factor Δk eff (1σ) ± σ Δkeff wt.% of 3.9 wt.% ± ± wt.% of 3.9 wt.% ± ± wt.% of 4.3 wt.% ± ± wt.% of 4.3 wt.% ± ± wt.% of 4.8 wt.% ± ± wt.% of 4.8 wt.% ± ± wt.% of 5.2 wt.% ± ± wt.% of 5.2 wt.% ± ± wt.% of 5.9 wt.% ± ± wt.% of 5.9 wt.% ± ± wt.% of 6.3 wt.% ± ± wt.% of 6.3 wt.% ± ± wt.% of 7.2 wt.% ± ± wt.% of 7.2 wt.% ± ± wt.% of 7.9 wt.% ± ± wt.% of 7.9 wt.% ± ± wt.% of 9.4 wt.% ± ± wt.% of 9.4 wt.% ± ± wt.% of 9.9 wt.% ± ± wt.% of 9.9 wt.% ± ± Revision: 0 Page 47 of 183
53 Table Effect of Uncertainty in Uranium Enrichment (Case 5). Deviation Δk ± σ Δk Scaling Factor Δk eff (1σ) ± σ Δkeff wt.% of 3.4 wt.% ± ± wt.% of 3.4 wt.% ± ± wt.% of 3.9 wt.% ± ± wt.% of 3.9 wt.% ± ± wt.% of 4.3 wt.% ± ± wt.% of 4.3 wt.% ± ± wt.% of 4.8 wt.% ± ± wt.% of 4.8 wt.% ± ± wt.% of 5.2 wt.% ± ± wt.% of 5.2 wt.% ± ± wt.% of 5.9 wt.% ± ± wt.% of 5.9 wt.% ± ± wt.% of 6.3 wt.% ± ± wt.% of 6.3 wt.% ± ± wt.% of 6.7 wt.% ± ± wt.% of 6.7 wt.% ± ± wt.% of 7.2 wt.% ± ± wt.% of 7.2 wt.% ± ± wt.% of 7.9 wt.% ± ± wt.% of 7.9 wt.% ± ± wt.% of 9.4 wt.% ± ± wt.% of 9.4 wt.% ± ± wt.% of 9.9 wt.% ± ± wt.% of 9.9 wt.% ± ± Oxygen to Uranium Ratio The oxygen to uranium ratio was varied by a best judgment value of ±0.06 (3 bounding limit) from the nominal value of 2.00 to determine the effective uncertainty in k eff. Results are shown in Table The uncertainty in the oxygen to uranium ratio is considered all systematic with no random component. Revision: 0 Page 48 of 183
54 Table Effect of Uncertainty in Oxygen to Uranium Ratio. Case Deviation Δk ± σ Δk Scaling Factor Δk eff (1σ) ± σ Δkeff N ± ± ± ± ± ± ± ± ± ± ± ± ± ± ± ± ± ± ± ± UO 2 Density Because of the overspecification of the TRISO particles in Table 1.14 (HTTR-GCR-RESR-001) and the correlation of uranium kernel diameter, density, TRISO packing fraction, and mass, the effect of the uncertainty in the fuel density is not included in the total uncertainty. However, an analysis of the uncertainty based upon the fuel mass is performed in Section UO 2 Impurity The kernel impurity was varied from 0-3 ppm by weight of equivalent natural-boron content to determine the bounding uncertainty in k eff. The maximum limit was multiplied 10-fold so as to quantify the effective upper uncertainty in the UO 2 impurity. The average value is 1.5 ppm by weight (Tables 1.13 and 1.14 of HTTR-GCR-RESR-001). Results are shown in Table The uncertainty in the UO 2 impurity is considered all systematic with no random component. Revision: 0 Page 49 of 183
55 Table Effect of Uncertainty in UO 2 Impurity. Case Deviation Δk ± σ Δk Scaling Factor Δk eff (1σ) ± σ Δkeff 0 ppm ± ± ppm ± ± ppm ± ± ppm ± ± ppm ± ± ppm ± ± ppm ± ± ppm ± ± ppm ± ± ppm ± ± Buffer Density The buffer density was varied ±0.30 g/cm 3 from the nominal value of 1.10 g/cm 3 (Table 1.14 of HTTR-GCR-RESR-001) to determine the effective uncertainty in k eff. This value is three times the bounding limit. Results are shown in Table The total number of TRISO particles used in the fully-loaded core is approximately 868,140,000. For determining the random component of the uncertainty, the results in Table 2.41 would be divided by N, where N for each case is shown in Table Table Effect of Uncertainty in Buffer Density. Case Deviation Δk ± σ Δk Scaling Factor Δk eff (1σ) ± σ Δkeff N g/cm ± ± g/cm ± ± g/cm ± ± g/cm ± ± g/cm ± ± g/cm ± ± g/cm ± ± g/cm ± ± g/cm ± ± g/cm ± ± Revision: 0 Page 50 of 183
56 Buffer Impurity The buffer impurity was varied from 0-3 ppm by weight of equivalent natural-boron content to determine the bounding uncertainty in k eff. The average value is 1.5 ppm by weight (Table 1.13 of HTTR-GCR-RESR-001). Results are shown in Table The uncertainty in the buffer impurity is considered all systematic with no random component. Table Effect of Uncertainty in Buffer Impurity. Case Deviation Δk ± σ Δk Scaling Factor Δk eff (1σ) ± σ Δkeff 0 ppm ± ± ppm ± ± ppm ± ± ppm ± ± ppm ± ± ppm ± ± ppm ± ± ppm ± ± ppm ± ± ppm ± ± IPyC Density The IPyC density was varied and g/cm 3 from the nominal value of 1.85 g/cm 3 (Table 1.14 of HTTR-GCR-RESR-001) to determine the effective uncertainty in k eff. These values are three times the bounding limit. Results are shown in Table The total number of TRISO particles used in the fully-loaded core is approximately 868,140,000. For determining the random component of the uncertainty, the results in Table 2.43 would be divided by N, where N for each case is shown in Table Revision: 0 Page 51 of 183
57 Case Deviation Δk ± σ Δk NEA/NSC/DOC(2006)1 Table Effect of Uncertainty in IPyC Density. Scaling Factor Δk eff (1σ) ± σ Δkeff N g/cm ± ± g/cm ± ± g/cm ± ± g/cm ± ± g/cm ± ± g/cm ± ± g/cm ± ± g/cm ± ± g/cm ± ± g/cm ± ± IPyC Impurity The IPyC impurity was varied from 0-3 ppm by weight of equivalent natural-boron content to determine the bounding uncertainty in k eff. The average value is 1.5 ppm by weight (Table 1.13 of HTTR-GCR-RESR-001). Results are shown in Table The uncertainty in the IPyC impurity is considered all systematic with no random component. Table Effect of Uncertainty in IPyC Impurity. Case Deviation Δk ± σ Δk Scaling Factor Δk eff (1σ) ± σ Δkeff 0 ppm ± ± ppm ± ± ppm ± ± ppm ± ± ppm ± ± ppm ± ± ppm ± ± ppm ± ± ppm ± ± ppm ± ± SiC Density The SiC density was increased by 0.06 g/cm 3, where 0.02 g/cm 3 is typical for SiC material, from the nominal value of 3.20 g/cm 3 (Table 1.14 of HTTR-GCR-RESR-001) to determine the effective Revision: 0 Page 52 of 183
58 uncertainty in k eff. This value is three times the bounding limit. The density was not decreased because of the minimum requirement for SiC density. Results are shown in Table The total number of TRISO particles used in the fully-loaded core is approximately 868,140,000. For determining the random component of the uncertainty, the results in Table 2.44 would be divided by N, where N for each case is shown in Table Case Deviation Δk ± σ Δk Table Effect of Uncertainty in SiC Density. Scaling Factor Δk eff (1σ) ± σ Δkeff Ν g/cm ± ± g/cm ± ± g/cm ± ± g/cm ± ± g/cm ± ± SiC Impurity The SiC impurity was varied from 0-3 ppm by weight of equivalent natural-boron content to determine the bounding uncertainty in k eff. The average value is 1.5 ppm by weight (Table 1.13 of HTTR-GCR-RESR-001). Results are shown in Table The uncertainty in the SiC impurity is considered all systematic with no random component. Table Effect of Uncertainty in SiC Impurity. Case Deviation Δk ± σ Δk Scaling Factor Δk eff (1σ) ± σ Δkeff 0 ppm ± ± ppm ± ± ppm ± ± ppm ± ± ppm ± ± ppm ± ± ppm ± ± ppm ± ± ppm ± ± ppm ± ± Revision: 0 Page 53 of 183
59 OPyC Density The OPyC density was varied and g/cm 3 from the nominal value of 1.85 g/cm 3 (Table 1.14 of HTTR-GCR-RESR-001) to determine the effective uncertainty in k eff. This value is three times the bounding limit. Results are shown in Table The total number of TRISO particles used in the fully-loaded core is approximately 868,140,000. For determining the random component of the uncertainty, the results in Table 2.46 would be divided by N, where N for each case is shown in Table Case Deviation Δk ± σ Δk Table Effect of Uncertainty in OPyC Density. Scaling Factor Δk eff (1σ) ± σ Δkeff N g/cm ± ± g/cm ± ± g/cm ± ± g/cm ± ± g/cm ± ± g/cm ± ± g/cm ± ± g/cm ± ± g/cm ± ± g/cm ± ± OPyC Impurity The OPyC impurity was varied from 0-3 ppm by weight of equivalent natural-boron content to determine the bounding uncertainty in k eff. The average value is 1.5 ppm by weight (Table 1.13 of HTTR-GCR-RESR-001). Results are shown in Table The uncertainty in the OPyC impurity is considered all systematic with no random component. Revision: 0 Page 54 of 183
60 Table Effect of Uncertainty in OPyC Impurity. Case Deviation Δk ± σ Δk Scaling Factor Δk eff (1σ) ± σ Δkeff 0 ppm ± ± ppm ± ± ppm ± ± ppm ± ± ppm ± ± ppm ± ± ppm ± ± ppm ± ± ppm ± ± ppm ± ± Overcoat Density Because insufficient data is available for the final composition and density of the graphite overcoat, this layer is being treated with equal properties to that of the surrounding compact graphite matrix. The overcoat density was varied ±0.15 g/cm 3 to determine the effective uncertainty in k eff. This value is three times the bounding limit. Results are shown in Table The total number of TRISO particles used in the fully-loaded core is approximately 868,140,000. For determining the random component of the uncertainty, the results in Table 2.48 would be divided by N, where N for each case is shown in Table Table Effect of Uncertainty in Overcoat Density. Case Deviation Δk ± σ Δk Scaling Factor Δk eff (1σ) ± σ Δkeff N g/cm ± ± g/cm ± ± g/cm ± ± g/cm ± ± g/cm ± ± g/cm ± ± g/cm ± ± g/cm ± ± g/cm ± ± g/cm ± ± Revision: 0 Page 55 of 183
61 Overcoat Composition Because insufficient data is available for the final composition and density of the graphite overcoat, this layer is being treated with equal properties to that of the surrounding compact graphite matrix. In essence, the uncertainty has already been accounted for, as the surrounding graphite matrix has been characterized for uncertainties, and the overcoat has been demonstrated elsewhere to have negligible impact on the calculation of k eff when it is not explicitly modeled, but included in the surrounding matrix. a Overcoat Impurity The overcoat impurity was varied from 0-5 ppm by weight of equivalent natural-boron content to determine the bounding uncertainty in k eff. The average value of the coated fuel particles is 1.5 ppm by weight (Table 1.13 of HTTR-GCR-RESR-001); it is assumed that the overcoat would have a comparable impurity amount. The alternative is to use the impurity of the compact (matrix) material, which is 0.82 ppm by weight (Table 1.27 of HTTR-GCR-RESR-001). The larger amount is selected, i.e. 1.5 ppm. Results are shown in Table The uncertainty in the overcoat impurity is considered all systematic with no random component. Table Effect of Uncertainty in Overcoat Impurity. Case Deviation Δk ± σ Δk Scaling Factor Δk eff (1σ) ± σ Δkeff 0 ppm ± ± ppm ± ± ppm ± ± ppm ± ± ppm ± ± ppm ± ± ppm ± ± ppm ± ± ppm ± ± ppm ± ± Prismatic Fuel Compact Density The compact matrix density was varied ±0.15 g/cm 3 from the nominal value of 1.70 g/cm 3 (Table 1.14 of HTTR-GCR-RESR-001) to determine the effective uncertainty in k eff. This value is three times the bounding limit. Results are shown in Table a W. Ji, J. L. Conlin, W. R. Martin, J. C. Lee, and F. B. Brown, Explicit Modeling of Particle Fuel for the Very- High Temperature Gas-Cooled Reactor, Trans. Am. Nucl. Soc., 92 (June 2005). Revision: 0 Page 56 of 183
62 The total number of fuel compacts used in the fully-loaded core is 66,780. For determining the random component of the uncertainty, the results in Table 2.50 would be divided by N, where N for each case is shown in Table Table Effect of Uncertainty in Compact Matrix Density. Case Deviation Δk ± σ Δk Scaling Factor Δk eff (1σ) ± σ Δkeff N g/cm ± ± g/cm ± ± g/cm ± ± g/cm ± ± g/cm ± ± g/cm ± ± g/cm ± ± g/cm ± ± g/cm ± ± g/cm ± ± ,370 45,990 52,920 52,920 59,850 Impurity The compact matrix impurity was varied from 0-5 ppm by weight of equivalent natural-boron content (Table 1.14 of HTTR-GCR-RESR-001) to determine the bounding uncertainty in k eff. The nominal impurity is 0.82 ppm of natural boron by weight (Table 1.27 of HTTR-GCR-RESR-001). Results are shown in Table The uncertainty in the fuel compact impurity is considered all systematic with no random component. Table Effect of Uncertainty in Compact Matrix Impurity. Case Deviation Δk ± σ Δk Scaling Factor Δk eff (1σ) ± σ Δkeff 0 ppm ± ± ppm ± ± ppm ± ± ppm ± ± ppm ± ± ppm ± ± ppm ± ± ppm ± ± ppm ± ± ppm ± ± Revision: 0 Page 57 of 183
63 Free Uranium Content The free uranium fraction in the fuel compacts has a maximum bounding limit of (see Table 1.14 of HTTR-GCR-RESR-001). The bounding limit was multiplied by 10 in order to assess the uncertainty in k eff, but the effects were still negligible. The free uranium was assumed to be 100 % 235 U so as to assess the maximum uncertainty. The free uranium content in the graphite compact was not included in the benchmark model and a bias was not applied because the effect was negligible. Results are shown in Table The uncertainty in the free uranium content is considered all systematic with no random component. Table Effect of Uncertainty in Compact Free Uranium Content. Case Deviation Δk ± σ Δk Scaling Factor Δk eff (1σ) ± σ Δkeff ppm ± ± ppm ± ± ppm ± ± ppm ± ± ppm ± ± Graphite Sleeves Density The graphite sleeve density was varied an assumed ±0.03 g/cm 3 from the nominal value of g/cm 3 (Table 1.27 of HTTR-GCR-RESR-001) to determine the effective uncertainty in k eff. This value is the bounding limit. The graphite sleeves are composed of IG-110 graphite, and the assumed uncertainty of 0.03 g/cm 3 encompasses the range of reported densities for IG-110 graphite throughout Section 1. Results are shown in Table The total number of graphite sleeves used in the fully-loaded core is 4,770. For determining the random component of the uncertainty, the results in Table 2.53 would be divided by N, where N for each case is shown in Table Revision: 0 Page 58 of 183
64 Table Effect of Uncertainty in Graphite Sleeve Density. Case Deviation Δk ± σ Δk Scaling Factor Δk eff (1σ) ± σ Δkeff N g/cm ± ± g/cm ± ± g/cm ± ± g/cm ± ± g/cm ± ± g/cm ± ± g/cm ± ± g/cm ± ± g/cm ± ± g/cm ± ± ,955 3,285 3,780 3,780 4,275 Impurity The graphite sleeve impurity was varied from 0-1 ppm by weight of equivalent natural-boron content (Table 1.13 of HTTR-GCR-RESR-001) to determine the bounding uncertainty in k eff. The nominal impurity is 0.37 ppm of natural boron by weight (Table 1.27 of HTTR-GCR-RESR-001). Results are shown in Table The uncertainty in the graphite sleeve impurity is considered all systematic with no random component. Table Effect of Uncertainty in Graphite Sleeve Impurity. Case Deviation Δk ± σ Δk Scaling Factor Δk eff (1σ) ± σ Δkeff 0 ppm ± ± ppm ± ± ppm ± ± ppm ± ± ppm ± ± ppm ± ± ppm ± ± ppm ± ± ppm ± ± ppm ± ± Revision: 0 Page 59 of 183
65 Burnable Poisons Absorber Density The absorber density was varied ±0.03 g/cm 3 from the average value of 1.8 g/cm 3 to determine the effective uncertainty in k eff. This value is the bounding limit. The density uncertainty is based upon uncertainty typically found in sintered B 4 C/C pellets (Table 1.29 of HTTR-GCR-RESR-001). Results are shown in Table The total number of burnable poison pellets used in the fully-loaded core is 5,520. For determining the random component of the uncertainty, the results in Table 2.55 would be divided by N, where N for each case is shown in Table Table Effect of Uncertainty in BP Absorber Density. Case Deviation Δk ± σ Δk Scaling Factor Δk eff (1σ) ± σ Δkeff N g/cm ± ± g/cm ± ± g/cm ± ± g/cm ± ± g/cm ± ± g/cm ± ± g/cm ± ± g/cm ± ± g/cm ± ± g/cm ± ± ,496 3,864 4,416 4,416 4,968 Absorber Content The uncertainty in the absorber content was not provided and the variation provided in Table 1.29 of HTTR-GCR-RESR-001 appears too excessive for the quantities utilized in the BP pellets. A variation of approximately ±0.25 % by weight was assumed for each of the two absorber pellet types, and the effective uncertainty in k eff was determined. This value is treated as a bounding limit. The uncertainty of ±0.25 % is based upon the assumption that burnable poison pellets with boron contents between 1.75 and 2.25 wt.% would have an average content of 2.00 wt.% and boron contents between 2.25 and 2.75 wt.% would have an average content of 2.50 wt.%. Further information would be necessary to reduce the range of the uncertainty. Results are shown in Tables 2.56 and The total number of burnable poison pellets with weight percents of 2.00 and 2.50 used in the fullyloaded core is 3,600 and 1,920, respectively. For determining the random component of the uncertainty, the results in Tables 2.56 and 2.57 would be divided by their respective N value, where N for each case is shown in Tables 2.56 and Revision: 0 Page 60 of 183
66 Table Effect of Uncertainty in BP Absorber Content (nominal 2.00 wt.%). Case Deviation Δk ± σ Δk Scaling Factor Δk eff (1σ) ± σ Δkeff N wt.% ± ± wt.% ± ± wt.% ± ± wt.% ± ± wt.% ± ± wt.% ± ± wt.% ± ± wt.% ± ± wt.% ± ± wt.% ± ± ,280 2,520 2,880 2,880 3,240 Table Effect of Uncertainty in BP Absorber Content (nominal 2.50 wt.%). Case Deviation Δk ± σ Δk Scaling Factor Δk eff (1σ) ± σ Δkeff N wt.% ± ± wt.% ± ± wt.% ± ± wt.% ± ± wt.% ± ± wt.% ± ± wt.% ± ± wt.% ± ± wt.% ± ± wt.% ± ± ,216 1,344 1,536 1,536 1,728 Absorber Impurity No information was available regarding any impurities present in the sintered B 4 C/C material for the BP pellets. However, the impurity limits provided in Table 1.29 of HTTR-GCR-RESR-001 can be applied to approximate a rough estimate of the impact of additional impurities. Sodium and manganese were added with a concentrations of 100 and 10 ppm (by weight), respectively. Concentrations of 1000 ppm (by weight) of aluminum, silicon, calcium, and titanium were also included. The effective uncertainty in k eff was determined and is shown in Table This value is treated as a bounding limit. The uncertainty in the absorber impurity is considered all systematic with no random component. Revision: 0 Page 61 of 183
67 Table Effect of Uncertainty in Absorber Impurity. Case Deviation Δk ± σ Δk Scaling Factor Δk eff (1σ) ± σ Δkeff 1 Added Impurities ± ± Added Impurities ± ± Added Impurities ± ± Added Impurities ± ± Added Impurities ± ± Absorber Isotopic Abundance According to the 16 th edition of the Chart of the Nuclides, the natural isotopic abundance of 10 B has been measured between 19.1 and 20.3 at.% with a nominal value of 19.9 at.%. a The abundance of 10 B in the BPs was therefore evaluated at the minimum and maximum bounding values to determine the effective uncertainty in k eff. Table 1.28 of HTTR-GCR-RESR-001 states that the abundance of 10 B is 18.7 wt.%, which correlates to approximately 20.2 at.%. The benchmark model was evaluated at 19.9 at.%. Results are shown in Table The uncertainty in the absorber isotopic abundance is considered all systematic with no random component. Table Effect of Uncertainty in BP Isotopic Abundance of 10 B. Case Deviation Δk ± σ Δk Scaling Factor Δk eff (1σ) ± σ Δkeff 19.1% ± ± % ± ± % ± ± % ± ± % ± ± % ± ± % ± ± % ± ± % ± ± % ± ± Graphite Disk Density An uncertainty in the density of the graphite disks was not reported. A variation of ±0.09 g/cm 3 was assumed and the effects on the uncertainty of k eff were determined. This value is three times the bounding limit. The graphite disks are composed of IG-110 graphite, and the assumed uncertainty of a Nuclides and Isotopes: Chart of the Nuclides, 16 th edition, (2002). Revision: 0 Page 62 of 183
68 0.03 g/cm 3 encompasses the range of reported densities for IG-110 graphite throughout Section 1 of HTTR-GCR-RESR-001. Results are shown in Table The total number of graphite disk stacks used in the fully-loaded core is 300. For determining the random component of the uncertainty, the results in Table 2.59 would be divided by N, where N for each case is shown in Table Table Effect of Uncertainty in Graphite Disk Density. Case Deviation Δk ± σ Δk Scaling Factor Δk eff (1σ) ± σ Δkeff N g/cm ± ± g/cm ± ± g/cm ± ± g/cm ± ± g/cm ± ± g/cm ± ± g/cm ± ± g/cm ± ± g/cm ± ± g/cm ± ± Graphite Disk Impurity The assumed graphite disk impurity was varied from 0-5 ppm by weight of equivalent natural-boron content to determine the bounding uncertainty in k eff. The nominal impurity is 0.37 ppm of natural boron by weight (Table 1.28 of HTTR-GCR-RESR-001). Results are shown in Table The uncertainty in the graphite disk impurity is considered all systematic with no random component. Revision: 0 Page 63 of 183
69 Table Effect of Uncertainty in Graphite Disk Impurity. Case Deviation Δk ± σ Δk Scaling Factor Δk eff (1σ) ± σ Δkeff 0 ppm ± ± ppm ± ± ppm ± ± ppm ± ± ppm ± ± ppm ± ± ppm ± ± ppm ± ± ppm ± ± ppm ± ± Control Rods Absorber Density The absorber density was varied ±0.09 g/cm 3 from the nominal value of 1.9 g/cm 3 (Table 1.15 of HTTR-GCR-RESR-001) to determine the effective uncertainty in k eff. This value is three times the bounding limit. The uncertainty is taken from Table 1.29 of HTTR-GCR-RESR-001. Results are shown in Table The total number of control rod absorber pellets used in the fully-loaded core is approximately 975, as approximately 30% of the control rods are actually inserted into the core. For determining the random component of the uncertainty, the results in Table 2.61 would be divided by N, where N for each case is shown in Table Table Effect of Uncertainty in CR Absorber Density. Case Deviation Δk ± σ Δk Scaling Factor Δk eff (1σ) ± σ Δkeff N g/cm ± ± g/cm ± ± g/cm ± ± g/cm ± ± g/cm ± ± g/cm ± ± g/cm ± ± g/cm ± ± g/cm ± ± g/cm ± ± Revision: 0 Page 64 of 183
70 Absorber Content The boron content was varied ±9 wt.% from the nominal value of 30 wt.% (Table 1.15 of HTTR-GCR-RESR-001) and the effect on the uncertainty in k eff was determined. This value is three times the bounding limit. The uncertainty is taken from Table 1.29 of HTTR-GCR-RESR-001. Results are shown in Table The total number of control rod absorber pellets used in the fully-loaded core is approximately 975, as approximately 30% of the control rods are actually inserted into the core. For determining the random component of the uncertainty, the results in Table 2.62 would be divided by N, where N for each case is shown in Table Table Effect of Uncertainty in CR Absorber Content. Case Deviation Δk ± σ Δk Scaling Factor Δk eff (1σ) ± σ Δkeff N -9 wt.% ± ± wt.% ± ± wt.% ± ± wt.% ± ± wt.% ± ± wt.% ± ± wt.% ± ± wt.% ± ± wt.% ± ± wt.% ± ± Absorber Impurity No information was available regarding any impurities present in the sintered B 4 C/C material for the control rod absorbers. However, the impurity limits provided in Table 1.29 of HTTR-GCR-RESR-001 can be applied to approximate a rough estimate of the impact of additional impurities. Sodium and manganese were added with a concentrations of 100 and 10 ppm (by weight), respectively. Concentrations of 1000 ppm (by weight) of aluminum, silicon, calcium, and titanium were also included. The effective uncertainty in k eff was determined and is shown in Table This value is treated as a bounding limit. The uncertainty in the absorber impurity is considered all systematic with no random component. Revision: 0 Page 65 of 183
71 Table Effect of Uncertainty in Absorber Impurity. Case Deviation Δk ± σ Δk Scaling Factor Δk eff (1σ) ± σ Δkeff 1 Added Impurities ± ± Added Impurities ± ± Added Impurities ± ± Added Impurities ± ± Added Impurities ± ± Absorber Isotopic Abundance According to the 16 th edition of the Chart of the Nuclides, the natural isotopic abundance of 10 B has been measured between 19.1 and 20.3% with a nominal value of 19.9%. a The abundance of 10 B in the control rods was therefore evaluated at the minimum and maximum bounding values to determine the effective uncertainty in k eff. Table 1.28 of HTTR-GCR-RESR-001 states that the abundance of 10 B is 18.7 wt.%, which correlates to approximately 20.2 at.%. The model was not evaluated for a 10 B abundance of 18.7 wt.%. The benchmark model was evaluated at 19.9 at.%. Results are shown in Table The uncertainty in the absorber isotopic abundance is considered all systematic with no random component. Table Effect of Uncertainty in CR Isotopic Abundance of 10 B. Case Deviation Δk ± σ Δk Scaling Factor Δk eff (1σ) ± σ Δkeff 19.1% ± ± % ± ± % ± ± % ± ± % ± ± % ± ± % ± ± % ± ± % ± ± % ± ± a Nuclides and Isotopes: Chart of the Nuclides, 16 th edition, (2002). Revision: 0 Page 66 of 183
72 Clad Density Two references were compared to confirm the composition and density of the Alloy 800H material. ab The density of Alloy 800H is taken to be 8.03 g/cm 3 with an estimated uncertainty of ±0.03 g/cm 3, which is the difference between the reported density values in the two references. This value is the bounding limit. The effective change in k eff was determined. Results are shown in Table The total number of control rod sections used in the fully-loaded core is approximately 97.5, as approximately 30% of the control rods are actually inserted into the core. For determining the random component of the uncertainty, the results in Table 2.65 would be divided by N, where N for each case is shown in Table Table Effect of Uncertainty in Clad Density. Case Deviation Δk ± σ Δk Scaling Factor Δk eff (1σ) ± σ Δkeff N g/cm 3 (1σ) ± ± g/cm 3 (1σ) ± ± g/cm 3 (1σ) ± ± g/cm 3 (1σ) ± ± g/cm 3 (1σ) ± ± g/cm 3 (1σ) ± ± g/cm 3 (1σ) ± ± g/cm 3 (1σ) ± ± g/cm 3 (1σ) ± ± g/cm 3 (1σ) ± ± Clad Composition The clad composition used in the benchmark model is derived from the aforementioned references for Alloy 800H, where the second reference provides a composition range and the first reference provides a nominal composition. A summary of the composition of Alloy 800H is provided in Table The nominal distribution is used in the benchmark model. The composition of the clad material was varied from the nominal value. In the first case, the minimum compositions of all elements were used with iron as the remaining balance. The second case uses the maximum weights of all the elements with a reduction in the iron content until the minimum value is achieved; then nickel is reduced to achieve a total of 100 wt.%. The effective change in k eff for these two cases was determined. Results are shown in Table The uncertainty in the clad composition is considered all systematic with no random component. a Specification Sheet: Alloy 800, 800H, and 800AT, Sandmeyer Steel Company (April 2004). b Material Characteristics: Alloy 800H, PhilipCornes, (Accessed August 5, 2008). Revision: 0 Page 67 of 183
73 Table Composition of Alloy 800H. Element Minimum wt.% Maximum wt.% Nominal wt.% C Al Si P S Ti Cr Mn Fe Ni Cu Total Table Effect of Uncertainty in Clad Composition. Case Deviation Δk ± σ Δk Scaling Factor Δk eff (1σ) ± σ Δkeff Minimum Fe ± ± Maximum Fe ± ± Minimum Fe ± ± Maximum Fe ± ± Minimum Fe ± ± Maximum Fe ± ± Minimum Fe ± ± Maximum Fe ± ± Minimum Fe ± ± Maximum Fe ± ± Clad Impurity No information was available regarding any impurities present in the Alloy 800H metal. Concentrations of minor and trace elements found commonly in nickel alloy a were added to the clad material in the benchmark model (a neutron cross-section library was unavailable for Ytterbium) to determine the effective uncertainty in k eff. Because these impurities are not necessarily those that would have been in the alloy, and the total amount is ~10 wt.%, the atom density of the primary alloy composition was not a J. H. Zaidi, S. Waheed, and S. Ahmed, Determination of Trace Impurities in Nickel-Based Alloy using Neutron Activation Analysis, J. Radioanal. Nucl. Ch., 242: (1999). Revision: 0 Page 68 of 183
74 reduced. Thus the total atom density of the material was increased by including the additional materials. A list of the additional impurities is shown in Table 2.68, and results are shown in Table This value is treated as a bounding limit. The uncertainty in the clad impurity is considered all systematic with no random component. Table Concentration (by weight) of Minor and Trace Elements in Nickel Alloy. Element Concentration Element Concentration As 63.7 μg/g Mo 9.8 μg/g Ba 215 μg/g Na 0.45 % Br 8.9 μg/g Nd 16.2 μg/g Ca 5.9 % Rb 24 ng/g Ce 0.33 % Sb 2.2 μg/g Co 9.96 μg/g Sc 0.13 μg/g Cs 4.34 μg/g Se 0.16 μg/g Dy 6.12 μg/g Sm 0.23 μg/g Er 2.8 μg/g Sn 0.25 μg/g Eu 1.17 μg/g Sr 371 μg/g Ga μg/g Ta 1.21 μg/g Gd 1.7 μg/g Tb 1.24 μg/g Hf 19.5 μg/g Th 18.3 μg/g Hg 6 ng/g U 4.3 μg/g In 245 ng/g Yb (a) 2.48 μg/g La 2.34 μg/g V 0.75 % Lu 1.16 μg/g Zn 93.4 μg/g Mg 2.14 % (a) A neutron cross-section library was unavailable to include this element in the analysis. Table Effect of Uncertainty in Clad Impurity. Case Deviation Δk ± σ Δk Scaling Factor Δk eff (1σ) ± σ Δkeff 1 Added Impurities ± ± Added Impurities ± ± Added Impurities ± ± Added Impurities ± ± Added Impurities ± ± Revision: 0 Page 69 of 183
75 Instrumentation Insufficient information is available to model and comprehensively evaluate the uncertainties and biases related to the utility of instrumentation in the HTTR. A basic analysis of the general description of the instrumentation was performed, as discussed in Section Graphite Blocks Density The IG-110 graphite density was varied ±0.04 g/cm 3 from a nominal value selected as 1.76 g/cm 3 (ranging from 1.75 to 1.78 g/cm 3, Tables 1.13, 1.19, and 1.27 of HTTR-GCR-RESR-001) to determine the effective uncertainty in k eff. A variation of 0.03 g/cm 3 accounts for the difference in density between the various samples of IG-110 blocks, and a variation of 0.01 g/cm 3 is assumed to encompass the variability in the volume fraction caused by eliminating various features such as the dowels, sockets, fuel handling position, and ridged features on the fuel rods. The assumed uncertainty of 0.03 g/cm 3 for the IG-110 graphite encompasses the range of reported densities found throughout Section 1 of HTTR-GCR-RESR-001. Results are shown in Table This value is treated as a bounding limit. Previous results a state that a graphite weight difference of less than 1% should result in a bias of -0.3 % k/k. Scaling the results provided in Table 2.70 provides an uncertainty comparable to the previously published information. The total number of IG-110 graphite blocks used in the fully-loaded core is 549. For determining the random component of the uncertainty, the results in Table 2.70 would be divided by N, where N for each case is shown in Table Table Effect of Uncertainty in IG-110 Density in Graphite Blocks. Case Deviation Δk ± σ Δk Scaling Factor Δk eff (1σ) ± σ Δkeff N g/cm ± ± g/cm ± ± g/cm ± ± g/cm ± ± g/cm ± ± g/cm ± ± g/cm ± ± g/cm ± ± g/cm ± ± g/cm ± ± a Fujimoto, N., Nakano, M., Takeuchi, M., Fujisaki, S., and Yamashita, K., Start-Up Core Physics Tests of High Temperature Engineering Test Reactor (HTTR), (II): First Criticality by an Annular Form Fuel Loading and Its Criticality Prediction Method, J. Atomic Energy Society Japan, 42(5), (2000). Revision: 0 Page 70 of 183
76 Impurity The graphite block impurity was varied from 0-3 ppm by weight of equivalent natural-boron content (Table 1.13 of HTTR-GCR-RESR-001), where the 3 ppm value is 3 times the bounding limit, to determine the bounding uncertainty in k eff. The nominal impurity is 0.40 ppm or 0.37 ppm of natural boron by weight for the fuel/control blocks and reflector blocks, respectively (Table 1.27 of HTTR-GCR-RESR-001). However, characterization of the graphite first loaded into the reactor determined the equivalent boron content for IG-110 graphite to be 0.59 ppm. a This latter value is used in the benchmark model. Results are shown in Table It has been reported that the estimated air content in the graphite blocks would provide -0.4 % k/k to the computational model. b Reference 1 states that an uncertainty factor of ~0.52 % k/k should be used. The inclusion of air in the benchmark model did not produce a noticeable change in reactivity; this was done by modeling air, at atmospheric pressure, distributed throughout the block in the quantity equivalent to the volume fraction to the void space generated for the dowels, sockets, fuel handling position, and other miscellaneous block features. However, it is unclear exactly how much air would be entrapped within the graphite blocks. Air can be entrapped during the graphitization process or absorbed onto the graphite surface. Typically, significant contribution to the equivalent boron content in a graphite block is caused by impurities in the graphite. Methods to measure the impurity content in graphite have improved over the past several years, and the impurity content of the HTTR graphite may need to be reassessed. c Graphite is also somewhat hydroscopic and can absorb water into its pores after fabrication. At low temperatures, the water would still be present in the graphite. Information regarding possible water content in the graphite blocks is unavailable, however. The uncertainty in the graphite block impurity is considered all systematic with no random component. Table Effect of Uncertainty in IG-110 Impurity in Graphite Blocks. Case Deviation Δk ± σ Δk Scaling Factor Δk eff (1σ) ± σ Δkeff 0 ppm ± ± ppm ± ± ppm ± ± ppm ± ± ppm ± ± ppm ± ± ppm ± ± ppm ± ± ppm ± ± ppm ± ± a Sumita, J., Shibata, T., Hanawa, S., Ishihara, M., Iyoku, T., and Sawa, K., Characteristics of First Loaded IG-110 Graphite in HTTR Core, JAEA Technol , October (2006). b Fujimoto, N., Nakano, M., Takeuchi, M., Fujisaki, S., and Yamashita, K., Start-Up Core Physics Tests of High Temperature Engineering Test Reactor (HTTR), (II): First Criticality by an Annular Form Fuel Loading and Its Criticality Prediction Method, J. Atomic Energy Society Japan, 42(5), (2000). c Private communication with Rob Bratton at Idaho National Laboratory (November 20, 2008). Revision: 0 Page 71 of 183
77 Permanent Reflectors Density The PGX graphite density was varied ±0.04 g/cm 3 from a nominal value selected as 1.73 g/cm 3 (ranging from 1.73 to 1.74 g/cm 3, Tables 1.19, 1.20, and 1.27 of HTTR-GCR-RESR-001) to determine the effective uncertainty in k eff. A variation of 0.03 g/cm 3 accounts for the PGX, and a variation of 0.01 g/cm 3 is assumed to encompass the variability in the volume fraction, which is not provided. The assumed uncertainty of 0.03 g/cm 3 for the PGX graphite encompasses the range of reported densities found throughout Section 1 of HTTR-GCR-RESR-001. Results are shown in Table This value is treated as a bounding limit. The total number of permanent reflector blocks used in all core configurations is 96. For determining the random component of the uncertainty, the results in Table 2.72 would be divided by 96. Table Effect of Uncertainty in PGX Density in Permanent Reflector. Case Deviation Δk ± σ Δk Scaling Factor Δk eff (1σ) ± σ Δkeff g/cm ± ± g/cm ± ± g/cm ± ± g/cm ± ± g/cm ± ± g/cm ± ± g/cm ± ± g/cm ± ± g/cm ± ± g/cm ± ± Impurity The permanent reflector impurity was varied from 0-5 ppm by weight of equivalent natural-boron content (Table 1.16 of HTTR-GCR-RESR-001) to determine the bounding uncertainty in k eff. The nominal impurity is 1.91 ppm of natural boron by weight (Table 1.27 of HTTR-GCR-RESR-001). Results are shown in Table The uncertainty in the permanent reflector impurity is considered all systematic with no random component. Revision: 0 Page 72 of 183
78 Table Effect of Uncertainty in PGX Impurity in Permanent Reflector. Case Deviation Δk ± σ Δk Scaling Factor Δk eff (1σ) ± σ Δkeff 0 ppm ± ± ppm ± ± ppm ± ± ppm ± ± ppm ± ± ppm ± ± ppm ± ± ppm ± ± ppm ± ± ppm ± ± Dummy Blocks Density The IG-11 graphite density was varied ±0.04 g/cm 3 from a nominal value of 1.75 g/cm 3 (Table 1.20 of HTTR-GCR-RESR-001) to determine the effective uncertainty in k eff. A variation of 0.03 g/cm 3 was selected as the density uncertainty because IG-11 graphite is essentially impure IG-110 graphite. An additional variation of 0.01 g/cm 3 is assumed to encompass the variability in the volume fraction caused by eliminating various features such as the dowels, sockets, and fuel handling position. Results are shown in Table This value is treated as a bounding limit. The total number of IG-11 graphite blocks used in the fully-loaded core is approximately zero; there are IG-11 graphite blocks in the annular core configurations. For determining the random component of the uncertainty, the results in Table 2.74 would be divided by N, where N for each case is shown in Table Revision: 0 Page 73 of 183
79 Table Effect of Uncertainty in IG-11 Density in Dummy Blocks. Case Deviation Δk ± σ Δk Scaling Factor Δk eff (1σ) ± σ Δkeff N g/cm ± ± g/cm ± ± g/cm ± ± g/cm ± ± g/cm ± ± g/cm ± ± g/cm ± ± g/cm ± ± g/cm ± ± g/cm ± ± Impurity The graphite block impurity was varied from 0-5 ppm by weight of equivalent natural-boron content to determine the bounding uncertainty in k eff. The nominal impurity is 3.1 ppm natural boron by weight (Ref 1, p. 314). The dummy blocks in the HTTR are created from the same graphite material, IG-11, as the reflector graphite in the HTR-10 reactor. ab The maximum impurity content was derived from the reflector graphite in the HTR-10 reactor (HTR10-GCR-RESR-001), which has a nominal boron concentration of ± ppm (±2 %). Results are shown in Table The uncertainty in the graphite block impurity is considered all systematic with no random component. a L. Xiaowei, R. Jean-Charles, and Y. Suyuan, Effect of Temperature on Graphite Oxidation Behavior, Nucl. Eng. Des., 227: (2004). b X. Luo, J-C. Robin, and S. Yu, Comparison of Oxidation Behaviors of Different Grades of Nuclear Graphite, Nucl. Sci. Eng., 151, (2005). Revision: 0 Page 74 of 183
80 Table Effect of Uncertainty in IG-11 Impurity in Dummy Blocks. Case Deviation Δk ± σ Δk Scaling Factor Δk eff (1σ) ± σ Δkeff 0 ppm ± ± ppm ± ± ppm ± ± ppm ± ± ppm ± ± ppm ± ± ppm ± ± ppm ± ± ppm ± ± ppm ± ± Block Type There are two types of dummy blocks, one with a hole pattern similar to that of a control block, and the other with three holes but of smaller diameter (Ref. 2, p. 14). Elsewhere the source of eight types of dummy blocks are specified (most likely having one of the two hole patterns). a Because the true dimensions of the smaller hole design is unknown, the dummy blocks will all be modeled with the holes of the control blocks but an additional uncertainty will be assessed to account for this discrepancy. This uncertainty will be determined by completely filling the holes of the dummy blocks with IG-11 graphite material as a bounding limit (i.e., maximizing the amount of graphite material mass) representing the minimum dimensions of three infinitely thin holes in the dummy blocks. The volume fraction of the simulated control channels in a dummy blocks is approximately %, representing an increase in graphite mass of 36 kg per block when the holes are completely filled (based on a graphite density of 1.75 g/cm 3 with an % reduction for void volume). Results are shown in Table There are no IG-11 graphite blocks used in the fully-loaded core; there are IG-11 graphite blocks in the annular core configurations. For determining the random component of the uncertainty, the results in Table 2.76 would be divided by N, where N for each case is shown in Table a N. Fujimoto, N. Nojiri, and K. Yamashita, HTTR s Benchmark Calculation of Start-Up Core Physics Tests, Report of the 3 rd Research Coordination Meeting on the CRP, IAEA, Oarai, Japan, March (2001). Revision: 0 Page 75 of 183
81 Table Effect of Uncertainty in Dummy Blocks Type. Case Deviation Δk ± σ Δk Scaling Factor Δk eff (1σ) ± σ Δkeff Ν 1 Filled Holes ± ± Filled Holes ± ± Filled Holes ± ± Filled Holes ± ± Filled Holes ± ± Helium Coolant Density The density of helium gas was evaluated using the ideal gas law, PV=nRT, at a pressure of 1 atm and temperature of 25 ºC. The helium coolant was modeled with an atom density of atoms/bcm (mass density of g/cm 3 ). The helium density was varied approximately ±35% (10 bounding limit) to determine the effective uncertainty in k eff. Results are shown in Table The effect of neglecting the helium content and replacing it with an empty void was also performed. The effective change in change in k eff was determined. Results are shown in Table The uncertainty in the helium density is considered all systematic with no random component. Revision: 0 Page 76 of 183
82 Table Effect of Uncertainty in Helium Coolant Density. Case Deviation Δk ± σ Δk Scaling Factor Δk eff (1σ) ± σ Δkeff void ± ± % (10σ) ± ± % (10σ) ± ± void ± ± % (10σ) ± ± % (10σ) ± ± void ± ± % (10σ) ± ± % (10σ) ± ± void ± ± % (10σ) ± ± % (10σ) ± ± void ± ± % (10σ) ± ± % (10σ) ± ± Impurity The upper impurity limit in the helium coolant was included in the model to determine its effect upon the uncertainty in k eff. Upper concentration limits from Table 1.10 of HTTR-GCR-RESR-001 were included although the impurity content in helium at room temperature would be considerably less (and practically nonexistent); therefore it will be treated as a bounding limit. The bounding limit was multiplied by 10 for each component in order to assess the uncertainty, but the effects were still negligible. Results are shown in Table The uncertainty in the helium impurity is considered all systematic with no random component. Table Effect of Uncertainty in Helium Coolant Impurity. Case Deviation Δk ± σ Δk Scaling Factor Δk eff (1σ) ± σ Δkeff 1 Added Impurities ( 10) ± ± Added Impurities ( 10) ± ± Added Impurities ( 10) ± ± Added Impurities ( 10) ± ± Added Impurities ( 10) ± ± Revision: 0 Page 77 of 183
83 2.1.4 Additional Analyses Room Return Insufficient information is available to model and evaluate the uncertainties and biases related to any room return effects in the HTTR. Shielding plugs, plates, and blocks are incorporated within the HTTR vessel and would considerably reduce room return effects from the surrounding reactor vessel, reactor internals, and HTTR infrastructure and facility due to the content of sintered B 4 C/C neutron absorber. A conservative analysis of the HTTR benchmark model of the fully-loaded core (HTTR-GCR-RESR-001) surrounded by shielding material, steel, and concrete provided an insignificant effect because the slight increase in the effective multiplication factor was well below the range of statistical uncertainty for the analysis. Actual room return effects would be assumed quite negligible TRISO Particle Placement Currently MCNP has a limited capability for modeling stochastic geometries. The HTTR core is unique in the fact that it has 12 different enrichments throughout the core. MCNP could effectively model randomness for only two types of TRISO particles at once because the URAN card used to create stochastic models has a maximum limit of two universes per model. A comparison of using the URAN analysis with multiple input decks to represent pairs of enriched TRISO particles was performed for the fully-loaded core configuration (HTTR-GCR-RESR-001) and shown to provide equivalent results to the approach performed below. To approximate the bounding uncertainty in the effects of random TRISO placement, the fuel compacts were modeled with a uniform cell lattice of TRISO particles, which effectively creates partial particles along the compact borders. Figures 2.6 and 2.7 show a cross section of the fuel compacts with ordered and uniformly-filled TRISO distributions, respectively. The effective difference in the multiplication factor is shown in Table The 30 vol. % packing fraction and uranium mass per fuel rod is conserved in this comparison. In order to conserve the uranium mass, the volume was estimated for the uranium kernels along the edges of the fuel compacts (using linear approximation of the cylindrical surface and spherical dome formulas) a to determine the approximate fuel content in each compact. Then the uniform cell lattice was adjusted such that the modeled fuel content matched the reported HTTR value. The reduction in resonance shielding effects in partial particles (i.e. fuel kernels not completely surrounded by graphite coatings) along the edges is not considered in this analysis. There is a slight mass uncertainty that is unaccounted for in this approximation. Because this is a bounding application, the results in Table 2.79 need to be divided by the square-root of three. An analysis performed at the University of Michigan to look at the effects of explicitly modeling particle fuel in a very-high temperature gas-cooled reactor found that in a full core model, the effect of modeling with a uniform lattice and clipped TRISO particles would have a reduced k eff of approximately 0.1 % compared to a heterogeneous core design containing only complete TRISO particles. b The results shown in Table 2.79 are approximately 0.1 % for the fully-loaded core configuration and slightly less for these annular configurations. The values calculated in Table 2.79 are used to represent the uncertainty in random TRISO particle placement in the HTTR. This uncertainty is treated as 100% systematic to capture the complete uncertainty in random particle placement. A driver for this phenomenon might be explained by the Dancoff-Ginsberg factor, where in a lattice, the closer the lumps of fissionable material are to each other, the greater the shadowing effect and the smaller a Spherical and Ellipsoid Dome Formulas, Monolithic Dome Institute, Italy, Texas (2001). b W. Ji, J. L. Conlin, W. R. Martin, J. C. Lee, and F. B. Brown, Explicit Modeling of Particle Fuel for the Very- High Temperature Gas-Cooled Reactor, Trans. Am. Nucl. Soc., 92 (June 2005). Revision: 0 Page 78 of 183
84 the resonance integral for the interacting lattice, which results in an increase in the non-leakage probability and net increase in k eff. a A competing argument is that self-shielding and shadowing effects are quite negligible (2 nd -order effect) and that small variations in fuel conservation actually lead to the difference in the calculated value of k eff. bc Further discussion of the relevance of fuel particle parameters upon the reactivity of the system can be read elsewhere. d It remains up to the user s discretion to assess whether and how an uncertainty might apply to the modeling of this reactor system. 09-GA Figure 2.6. MCNP Ordered TRISO Lattice within the Fuel Compacts. a J. R. Lamarsh, Introduction to Nuclear Reactor Theory, Addison-Wesley Publishing Company, Reading, Massachusetts, pp (1966). b Personal communication between Luka Snoj and Forrest Brown from Los Alamos National Laboratory (November 20, 2008). c F. B. Brown, Monte Carlo Advances & Challenges, Proc. Frederic Joliot and Otto Hahn Summer School 2005, Karlsruhe, Germany, August 24 September 2 (2005). d L. Snoj and M. Ravnik, Effect of Fuel Particles Size and Position Variations on Multiplication Factor in Pebble- Bed Nuclear Reactors, Kerntechnik, 72 (2007). Revision: 0 Page 79 of 183
85 09-GA Figure 2.7. MCNP Uniformly-Filled TRISO Lattice within the Fuel Compacts. Table Comparison of Uniform and Organized TRISO Fill in Fuel Compacts. Case Organized Distribution (Figure 2.6) Uniform Fill (Figure 2.7) Bounding Difference 1 Uncertainty k eff ± σ k k eff ± σ k Δk ± σ Δk Δk ± σ Δk ± ± ± ± ± ± ± ± ± ± ± ± ± ± ± ± ± ± ± ± Revision: 0 Page 80 of 183
86 Block Stack Alignment As discussed in the previous section, MCNP has a limited capability for modeling stochastic geometries for systems with multiple unique components. Whereas the HTTR core model is comprised of 61 columns each containing 9 bricks, a comprehensive analysis of the stochastic nature of block stacking could not be easily evaluated MCNP Random Number Generation The random number seed was changed for the benchmark model and compared with the original to determine the uncertainty in utilizing Monte Carlo analysis methods. Results are shown in Table The uncertainty in the average is the standard deviation of the six averaged eigenvalues. Table Analysis of the Effect of Random Number Generation in MCNP. Seed Case 1 Case 2 Case 3 k eff ± σ keff k eff ± σ keff k eff ± σ keff ± ± ± ± ± ± ± ± ± ± ± ± (a) ± ± ± ± ± ± Average ± ± ± Table 2.80 (cont d.). Analysis of the Effect of Random Number Generation in MCNP. Seed Case 4 Case 5 k eff ± σ keff k eff ± σ keff ± ± ± ± ± ± ± ± (a) ± ± ± ± Average ± ± (a) Primary seed value for evaluation Simplification Biases and Uncertainties Whereas insufficient information is publicly available, a comprehensive analysis of simplification biases and their respective uncertainties could not be appropriately assessed. Currently only an approximate bias for the instrumentation components in the reactor has been assessed (Section ). As additional Revision: 0 Page 81 of 183
87 information becomes available, highly detailed and simplified benchmark models can be generated and their biases can be adequately determined Systematic Biases and Uncertainties There was no information regarding systematic biases or uncertainties publicly available for these experiments. Previous efforts of the Japanese in analyzing the 19-fuel-column core (Case 1) obtained an analytical excess reactivity of 2.7 % k/k, with an estimated Monte Carlo calculation overestimate of 1.2 % k/k. a Additional information would be necessary to completely verify published results to generate an analytical bias for MCNP. As discussed at the beginning of Section 2, all uncertainties are treated as 25% systematic, with no reduction in uncertainty due to the multiplicity of core components, and as 75% random Analysis of HTTR Uranium Content The parameters (dimensions, density, etc.) of the TRISO particles fabricated during the manufacturing process are very normally distributed, except for any defective particles. The fuel content, or mass, is the most well-known specification and measured with the highest accuracy. b Because of the overspecification of the TRISO particles in Table 1.14 of HTTR-GCR-RESR-001 and the correlation of uranium kernel diameter, density, packing fraction, and mass, the effect of the uncertainties in the kernel diameter, density, and packing fraction are not included in the total uncertainty as separate entities. The uranium content of the fuel rods of ± 5.66 g (Table 1.14 of HTTR-GCR-RESR-001) is the parameter most likely known with the greatest accuracy. Therefore, the diameter of the kernels will be fixed at 600 μm, and the density will be varied ± 0.32 g/cm 3 from a nominal value of g/cm 3 to determine the effective uncertainty in k eff due to the uranium mass uncertainty. Results are shown in Table This value is treated as a bounding limit. The total number of fuel rods used in the fully-loaded core is approximately 4,770. For determining the random component of the uncertainty, the results in Table 2.81 would be divided by N. a Fujimoto, N., Nakano, M., Takeuchi, M., Fujisaki, S., and Yamashita, K., Start-Up Core Physics Tests of High Temperature Engineering Test Reactor (HTTR), (II): First Criticality by an Annular Form Fuel Loading and Its Criticality Prediction Method, J. Atomic Energy Society Japan, 42(5), (2000). b Personal communication with David Petti from the Idaho National Laboratory (September 28, 2009). Revision: 0 Page 82 of 183
88 Table Effect of Uncertainty in Uranium Mass. Case Deviation Δk ± σ Δk Scaling Factor Δk eff (1σ) ± σ Δkeff N g/cm ± ± g/cm ± ± g/cm ± ± g/cm ± ± g/cm ± ± g/cm ± ± g/cm ± ± g/cm ± ± g/cm ± ± g/cm ± ± ,955 3,285 3,780 3,780 4, Total Experimental Uncertainty A compilation of the total evaluated uncertainty in the HTTR model is shown in Tables 2.82 through 2.86 for configurations 1 through 5, respectively. As discussed earlier, each of the evaluated uncertainties is divided into a systematic component (25%) and random component (75%), where appropriate. The random component is then divided by the square-root of the number of random objects reported in the subsection containing the calculated base uncertainty values. The root-mean square of each subcomponent is taken to determine the uncertainty in either the random or systematic components of the total evaluated uncertainty. The total evaluated uncertainty is then the root-mean square of the random and systematic uncertainties. Uncertainties less than are reported as negligible (neg). When calculated uncertainties in Δk eff are less than their statistical uncertainties, the statistical uncertainties are used in the calculation of the total uncertainty. Table listings where calculations were not performed or otherwise not available are labeled with NA. For uncertainties where a random component is not applicable, the uncertainty is denoted with --. The most significant contributions to the overall uncertainty from the systematic uncertainties include the impurities in the IG-110 graphite blocks, PGX graphite reflector blocks, and IG-11 graphite dummy blocks. All uncertainties providing at least 0.1 % Δk eff are highlighted in gray in Tables 2.82 through All of the random uncertainties are less than 0.1 % Δk eff. The overall uncertainty is less than 1% Δk eff (except for Cases 1 and 2); it is expected that the total uncertainty will be reduced as additional parameters that characterize the HTTR are obtained. Revision: 0 Page 83 of 183
89 Varied Parameter NEA/NSC/DOC(2006)1 Table Total Experimental Uncertainty (Case 1). Systematic Uncertainty Random Uncertainty Δk eff (1σ) +Δk eff (1σ) Δk eff (1σ) +Δk eff (1σ) Temperature Control Rod Positions Measured Value of k eff neg neg neg neg Kernel Diameter Correlated Parameter (see Section 2.1.6) Buffer Diameter neg neg neg neg IPyC Diameter neg neg neg SiC Diameter neg neg OPyC Diameter neg neg neg neg Overcoat Diameter NA NA NA NA Compact Inner Diameter neg neg neg neg Compact Outer Diameter neg neg Compact Height neg neg Compact Packing Fraction Correlated Parameter (see Section 2.1.6) Sleeve Inner Diameter neg neg Sleeve Outer Diameter neg neg Sleeve Height neg neg BP Diameter BP Stack Height BP Hole Diameter neg neg Graphite Disk Diameter neg neg neg neg Disk Stack Height neg neg CR Absorber Inner Diameter neg neg neg neg CR Absorber Outer Diameter neg neg neg neg CR Absorber Height neg neg neg neg CR Clad Inner Diameter neg neg neg neg CR Clad Outer Diameter neg neg neg neg CR Clad Height neg neg neg neg CR Spine Diameter neg neg neg neg Instrumentation Dimensions Block Flat-to-Flat Distance neg neg Graphite Block Height neg neg neg neg Dowel/Socket Dimensions NA NA NA NA Fuel Channel Diameter neg neg Reflector Channel Diameter neg neg neg neg Channel Pitch neg neg Revision: 0 Page 84 of 183
90 Table 2.82 (cont d.). Total Experimental Uncertainty (Case 1). Varied Parameter Systematic Uncertainty Revision: 0 Page 85 of 183 Random Uncertainty Δk eff (1σ) +Δk eff (1σ) Δk eff (1σ) +Δk eff (1σ) Handling Socket Dimensions NA NA NA NA Column Pitch CR Channel Diameter neg neg neg CR Channel Pitch neg neg neg neg Permanent Reflector Diameter Dummy Block Dimensions See Sections and wt.% Enrichment NA NA NA NA 3.9 wt.% Enrichment wt.% Enrichment wt.% Enrichment wt.% Enrichment wt.% Enrichment wt.% Enrichment wt.% Enrichment NA NA NA NA 7.2 wt.% Enrichment wt.% Enrichment wt.% Enrichment wt.% Enrichment Oxygen to Uranium Ratio UO 2 Density Correlated Parameter (see Section 2.1.6) UO 2 Impurity Buffer Density neg neg neg neg Buffer Impurity neg IPyC Density neg neg neg neg IPyC Impurity SiC Density NA neg NA neg SiC Impurity neg OPyC Density neg neg neg neg OPyC Impurity Overcoat Density neg neg Overcoat Composition NA NA NA NA Overcoat Impurity Compact Density neg neg neg neg Compact Impurity Compact Free U Content NA neg -- --
91 Table 2.82 (cont d.). Total Experimental Uncertainty (Case 1). Varied Parameter Systematic Uncertainty Random Uncertainty Δk eff (1σ) +Δk eff (1σ) Δk eff (1σ) +Δk eff (1σ) Sleeve Density neg neg Sleeve Impurity BP Absorber Density neg neg BP Absorber Content, 2.0 wt.% BP Absorber Content, 2.5 wt.% BP Absorber Impurity NA BP Isotopic Abundance of 10 B Graphite Disk Density neg neg neg neg Graphite Disk Impurity CR Absorber Density neg neg neg CR Absorber Content neg neg neg neg CR Absorber Impurity NA CR Isotopic Abundance of 10 B CR Clad Density CR Clad Composition CR Clad Impurity NA Instrumentation Composition See Section IG-110 Density in Blocks IG-110 Impurity in Blocks PGX Density PGX Impurity Dummy Block Density neg Dummy Block Impurity Dummy Block Type NA NA Helium Coolant Density neg neg Helium Coolant Impurity NA neg Room Return neg neg neg neg TRISO Particle Placement neg neg Block Stack Alignment NA NA NA NA MCNP Random Number Seed Uranium Fuel Mass (Sec ) Uncertainty of Components Total Evaluation Uncertainty Revision: 0 Page 86 of 183
92 Varied Parameter NEA/NSC/DOC(2006)1 Table Total Experimental Uncertainty (Case 2). Systematic Uncertainty Random Uncertainty Δk eff (1σ) +Δk eff (1σ) Δk eff (1σ) +Δk eff (1σ) Temperature Control Rod Positions Measured Value of k eff neg neg neg neg Kernel Diameter Correlated Parameter (see Section 2.1.6) Buffer Diameter neg neg neg IPyC Diameter neg neg neg neg SiC Diameter neg neg OPyC Diameter neg neg Overcoat Diameter NA NA NA NA Compact Inner Diameter neg neg neg neg Compact Outer Diameter neg neg Compact Height neg neg Compact Packing Fraction Correlated Parameter (see Section 2.1.6) Sleeve Inner Diameter neg neg Sleeve Outer Diameter neg neg Sleeve Height neg neg BP Diameter BP Stack Height neg neg BP Hole Diameter neg neg Graphite Disk Diameter neg neg neg neg Disk Stack Height neg neg CR Absorber Inner Diameter neg neg neg neg CR Absorber Outer Diameter neg neg neg neg CR Absorber Height CR Clad Inner Diameter neg neg neg neg CR Clad Outer Diameter neg neg neg neg CR Clad Height CR Spine Diameter neg neg neg neg Instrumentation Dimensions Block Flat-to-Flat Distance neg neg Graphite Block Height neg neg neg Dowel/Socket Dimensions NA NA NA NA Fuel Channel Diameter neg neg Reflector Channel Diameter neg neg neg neg Channel Pitch neg neg Revision: 0 Page 87 of 183
93 Table 2.83 (cont d.). Total Experimental Uncertainty (Case 2). Varied Parameter Systematic Uncertainty Revision: 0 Page 88 of 183 Random Uncertainty Δk eff (1σ) +Δk eff (1σ) Δk eff (1σ) +Δk eff (1σ) Handling Socket Dimensions NA NA NA NA Column Pitch CR Channel Diameter neg neg neg neg CR Channel Pitch neg neg neg neg Permanent Reflector Diameter Dummy Block Dimensions See Sections and wt.% Enrichment NA NA NA NA 3.9 wt.% Enrichment wt.% Enrichment wt.% Enrichment wt.% Enrichment wt.% Enrichment wt.% Enrichment wt.% Enrichment NA NA NA NA 7.2 wt.% Enrichment wt.% Enrichment wt.% Enrichment wt.% Enrichment Oxygen to Uranium Ratio UO 2 Density Correlated Parameter (see Section 2.1.6) UO 2 Impurity Buffer Density neg neg neg Buffer Impurity neg IPyC Density neg neg neg IPyC Impurity SiC Density NA neg NA neg SiC Impurity OPyC Density neg neg neg OPyC Impurity Overcoat Density neg neg neg Overcoat Composition NA NA NA NA Overcoat Impurity Compact Density neg neg neg neg Compact Impurity Compact Free U Content NA neg -- --
94 Table 2.83 (cont d.). Total Experimental Uncertainty (Case 2). Varied Parameter Systematic Uncertainty Random Uncertainty Δk eff (1σ) +Δk eff (1σ) Δk eff (1σ) +Δk eff (1σ) Sleeve Density neg neg Sleeve Impurity BP Absorber Density neg neg BP Absorber Content, 2.0 wt.% BP Absorber Content, 2.5 wt.% BP Absorber Impurity NA BP Isotopic Abundance of 10 B Graphite Disk Density neg neg neg Graphite Disk Impurity CR Absorber Density neg neg neg neg CR Absorber Content neg neg CR Absorber Impurity NA CR Isotopic Abundance of 10 B neg CR Clad Density neg neg neg CR Clad Composition CR Clad Impurity NA Instrumentation Composition See Section IG-110 Density in Blocks IG-110 Impurity in Blocks PGX Density PGX Impurity Dummy Block Density Dummy Block Impurity Dummy Block Type NA NA Helium Coolant Density neg Helium Coolant Impurity NA neg Room Return neg neg neg neg TRISO Particle Placement neg neg Block Stack Alignment NA NA NA NA MCNP Random Number Seed Uranium Fuel Mass (Sec ) Uncertainty of Components Total Evaluation Uncertainty Revision: 0 Page 89 of 183
95 Varied Parameter NEA/NSC/DOC(2006)1 Table Total Experimental Uncertainty (Case 3). Systematic Uncertainty Random Uncertainty Δk eff (1σ) +Δk eff (1σ) Δk eff (1σ) +Δk eff (1σ) Temperature Control Rod Positions Measured Value of k eff neg neg neg neg Kernel Diameter Correlated Parameter (see Section 2.1.6) Buffer Diameter neg neg IPyC Diameter neg neg neg SiC Diameter neg neg OPyC Diameter neg neg neg Overcoat Diameter NA NA NA NA Compact Inner Diameter neg neg neg neg Compact Outer Diameter neg neg Compact Height neg neg Compact Packing Fraction Correlated Parameter (see Section 2.1.6) Sleeve Inner Diameter neg neg Sleeve Outer Diameter neg neg Sleeve Height neg neg BP Diameter BP Stack Height BP Hole Diameter neg neg Graphite Disk Diameter neg neg neg neg Disk Stack Height neg neg neg neg CR Absorber Inner Diameter neg neg neg neg CR Absorber Outer Diameter neg neg neg neg CR Absorber Height neg neg CR Clad Inner Diameter neg neg neg neg CR Clad Outer Diameter neg neg CR Clad Height CR Spine Diameter neg neg neg neg Instrumentation Dimensions Block Flat-to-Flat Distance neg Graphite Block Height neg neg neg neg Dowel/Socket Dimensions NA NA NA NA Fuel Channel Diameter neg neg Reflector Channel Diameter neg neg neg neg Channel Pitch neg neg Revision: 0 Page 90 of 183
96 Table 2.84 (cont d.). Total Experimental Uncertainty (Case 3). Varied Parameter Systematic Uncertainty Revision: 0 Page 91 of 183 Random Uncertainty Δk eff (1σ) +Δk eff (1σ) Δk eff (1σ) +Δk eff (1σ) Handling Socket Dimensions NA NA NA NA Column Pitch CR Channel Diameter neg neg CR Channel Pitch neg neg neg neg Permanent Reflector Diameter Dummy Block Dimensions See Sections and wt.% Enrichment NA NA NA NA 3.9 wt.% Enrichment wt.% Enrichment wt.% Enrichment wt.% Enrichment wt.% Enrichment wt.% Enrichment wt.% Enrichment NA NA NA NA 7.2 wt.% Enrichment wt.% Enrichment wt.% Enrichment wt.% Enrichment Oxygen to Uranium Ratio UO 2 Density Correlated Parameter (see Section 2.1.6) UO 2 Impurity Buffer Density neg neg neg Buffer Impurity IPyC Density neg neg neg neg IPyC Impurity SiC Density NA neg NA neg SiC Impurity OPyC Density neg neg neg OPyC Impurity Overcoat Density neg neg neg Overcoat Composition NA NA NA NA Overcoat Impurity Compact Density neg neg neg Compact Impurity Compact Free U Content NA neg -- --
97 Table 2.84 (cont d.). Total Experimental Uncertainty (Case 3). Varied Parameter Systematic Uncertainty Random Uncertainty Δk eff (1σ) +Δk eff (1σ) Δk eff (1σ) +Δk eff (1σ) Sleeve Density neg neg Sleeve Impurity BP Absorber Density neg neg BP Absorber Content, 2.0 wt.% BP Absorber Content, 2.5 wt.% BP Absorber Impurity NA BP Isotopic Abundance of 10 B Graphite Disk Density neg neg neg neg Graphite Disk Impurity CR Absorber Density neg neg neg neg CR Absorber Content neg neg CR Absorber Impurity NA CR Isotopic Abundance of 10 B CR Clad Density neg neg CR Clad Composition CR Clad Impurity NA Instrumentation Composition See Section IG-110 Density in Blocks IG-110 Impurity in Blocks PGX Density PGX Impurity Dummy Block Density neg Dummy Block Impurity Dummy Block Type NA NA Helium Coolant Density neg neg Helium Coolant Impurity NA neg Room Return neg neg neg Neg TRISO Particle Placement neg neg Block Stack Alignment NA NA NA NA MCNP Random Number Seed Uranium Fuel Mass (Sec ) Uncertainty of Components Total Evaluation Uncertainty Revision: 0 Page 92 of 183
98 Varied Parameter NEA/NSC/DOC(2006)1 Table Total Experimental Uncertainty (Case 4). Systematic Uncertainty Random Uncertainty Δk eff (1σ) +Δk eff (1σ) Δk eff (1σ) +Δk eff (1σ) Temperature Control Rod Positions Measured Value of k eff neg neg neg neg Kernel Diameter Correlated Parameter (see Section 2.1.6) Buffer Diameter neg neg neg IPyC Diameter neg neg neg neg SiC Diameter neg neg OPyC Diameter neg neg Overcoat Diameter NA NA NA NA Compact Inner Diameter neg neg neg Compact Outer Diameter neg neg Compact Height neg neg Compact Packing Fraction Correlated Parameter (see Section 2.1.6) Sleeve Inner Diameter neg neg Sleeve Outer Diameter neg neg Sleeve Height neg neg BP Diameter BP Stack Height BP Hole Diameter neg neg Graphite Disk Diameter neg neg neg neg Disk Stack Height neg neg neg CR Absorber Inner Diameter neg neg neg neg CR Absorber Outer Diameter neg neg neg neg CR Absorber Height neg neg CR Clad Inner Diameter neg neg neg neg CR Clad Outer Diameter neg neg CR Clad Height neg neg CR Spine Diameter neg neg neg neg Instrumentation Dimensions Block Flat-to-Flat Distance Graphite Block Height neg neg neg neg Dowel/Socket Dimensions NA NA NA NA Fuel Channel Diameter neg neg Reflector Channel Diameter neg neg neg neg Channel Pitch neg neg Revision: 0 Page 93 of 183
99 Table 2.85 (cont d.). Total Experimental Uncertainty (Case 4). Varied Parameter Systematic Uncertainty Revision: 0 Page 94 of 183 Random Uncertainty Δk eff (1σ) +Δk eff (1σ) Δk eff (1σ) +Δk eff (1σ) Handling Socket Dimensions NA NA NA NA Column Pitch CR Channel Diameter neg neg CR Channel Pitch neg neg neg neg Permanent Reflector Diameter Dummy Block Dimensions See Sections and wt.% Enrichment NA NA NA NA 3.9 wt.% Enrichment wt.% Enrichment wt.% Enrichment wt.% Enrichment wt.% Enrichment wt.% Enrichment wt.% Enrichment NA NA NA NA 7.2 wt.% Enrichment wt.% Enrichment wt.% Enrichment wt.% Enrichment Oxygen to Uranium Ratio UO 2 Density Correlated Parameter (see Section 2.1.6) UO 2 Impurity Buffer Density neg neg neg neg Buffer Impurity IPyC Density neg neg neg neg IPyC Impurity SiC Density NA neg NA neg SiC Impurity neg OPyC Density neg neg neg neg OPyC Impurity Overcoat Density neg neg Overcoat Composition NA NA NA NA Overcoat Impurity Compact Density neg neg Compact Impurity Compact Free U Content NA neg -- --
100 Table 2.85 (cont d.). Total Experimental Uncertainty (Case 4). Varied Parameter Systematic Uncertainty Random Uncertainty Δk eff (1σ) +Δk eff (1σ) Δk eff (1σ) +Δk eff (1σ) Sleeve Density neg neg Sleeve Impurity BP Absorber Density neg neg BP Absorber Content, 2.0 wt.% BP Absorber Content, 2.5 wt.% BP Absorber Impurity NA BP Isotopic Abundance of 10 B Graphite Disk Density neg neg neg Graphite Disk Impurity CR Absorber Density neg neg neg CR Absorber Content neg neg CR Absorber Impurity NA CR Isotopic Abundance of 10 B CR Clad Density neg neg CR Clad Composition CR Clad Impurity NA neg Instrumentation Composition See Section IG-110 Density in Blocks IG-110 Impurity in Blocks PGX Density PGX Impurity Dummy Block Density Dummy Block Impurity Dummy Block Type NA NA Helium Coolant Density neg Helium Coolant Impurity NA neg Room Return neg neg neg neg TRISO Particle Placement neg neg Block Stack Alignment NA NA NA NA MCNP Random Number Seed Uranium Fuel Mass (Sec ) Uncertainty of Components Total Evaluation Uncertainty Revision: 0 Page 95 of 183
101 Varied Parameter NEA/NSC/DOC(2006)1 Table Total Experimental Uncertainty (Case 5). Systematic Uncertainty Random Uncertainty Δk eff (1σ) +Δk eff (1σ) Δk eff (1σ) +Δk eff (1σ) Temperature Control Rod Positions Measured Value of k eff neg neg neg neg Kernel Diameter Correlated Parameter (see Section 2.1.6) Buffer Diameter neg neg IPyC Diameter neg neg neg neg SiC Diameter neg neg OPyC Diameter neg neg neg neg Overcoat Diameter NA NA NA NA Compact Inner Diameter neg neg Compact Outer Diameter neg neg Compact Height neg neg Compact Packing Fraction Correlated Parameter (see Section 2.1.6) Sleeve Inner Diameter neg neg Sleeve Outer Diameter neg neg Sleeve Height neg neg BP Diameter BP Stack Height BP Hole Diameter neg neg Graphite Disk Diameter neg neg neg neg Disk Stack Height neg neg CR Absorber Inner Diameter neg neg neg neg CR Absorber Outer Diameter neg neg neg neg CR Absorber Height CR Clad Inner Diameter neg neg neg neg CR Clad Outer Diameter neg neg CR Clad Height CR Spine Diameter neg neg neg neg Instrumentation Dimensions Block Flat-to-Flat Distance Graphite Block Height neg neg neg neg Dowel/Socket Dimensions NA NA NA NA Fuel Channel Diameter neg neg Reflector Channel Diameter neg neg neg neg Channel Pitch neg neg Revision: 0 Page 96 of 183
102 Table 2.86 (cont d.). Total Experimental Uncertainty (Case 5). Varied Parameter Systematic Uncertainty Revision: 0 Page 97 of 183 Random Uncertainty Δk eff (1σ) +Δk eff (1σ) Δk eff (1σ) +Δk eff (1σ) Handling Socket Dimensions NA NA NA NA Column Pitch neg neg CR Channel Diameter neg neg neg neg CR Channel Pitch neg neg neg neg Permanent Reflector Diameter Dummy Block Dimensions See Sections and wt.% Enrichment wt.% Enrichment wt.% Enrichment wt.% Enrichment wt.% Enrichment wt.% Enrichment wt.% Enrichment wt.% Enrichment wt.% Enrichment wt.% Enrichment wt.% Enrichment wt.% Enrichment Oxygen to Uranium Ratio UO 2 Density Correlated Parameter (see Section 2.1.6) UO 2 Impurity Buffer Density neg neg neg neg Buffer Impurity IPyC Density neg neg neg neg IPyC Impurity SiC Density NA neg NA neg SiC Impurity neg OPyC Density neg neg neg neg OPyC Impurity Overcoat Density neg neg Overcoat Composition NA NA NA NA Overcoat Impurity Compact Density neg neg neg Compact Impurity Compact Free U Content NA neg -- --
103 Table 2.86 (cont d.). Total Experimental Uncertainty (Case 5). Varied Parameter Systematic Uncertainty Random Uncertainty Δk eff (1σ) +Δk eff (1σ) Δk eff (1σ) +Δk eff (1σ) Sleeve Density neg neg Sleeve Impurity BP Absorber Density neg neg BP Absorber Content, 2.0 wt.% BP Absorber Content, 2.5 wt.% BP Absorber Impurity NA BP Isotopic Abundance of 10 B Graphite Disk Density neg neg neg neg Graphite Disk Impurity neg CR Absorber Density neg neg neg CR Absorber Content neg neg CR Absorber Impurity NA CR Isotopic Abundance of 10 B CR Clad Density neg neg neg CR Clad Composition CR Clad Impurity NA neg Instrumentation Composition See Section IG-110 Density in Blocks IG-110 Impurity in Blocks PGX Density PGX Impurity Dummy Block Density Dummy Block Impurity Dummy Block Type NA NA Helium Coolant Density neg neg Helium Coolant Impurity NA neg Room Return neg neg neg neg TRISO Particle Placement neg neg Block Stack Alignment NA NA NA NA MCNP Random Number Seed Uranium Fuel Mass (Sec ) Uncertainty of Components Total Evaluation Uncertainty Revision: 0 Page 98 of 183
104 2.2 Evaluation of Buckling and Extrapolation Length Data Buckling and extrapolation length measurements were not made. 2.3 Evaluation of Spectral Characteristics Data Spectral characteristics measurements were not made. 2.4 Evaluation of Reactivity Effects Data Evaluation of the excess reactivity measurements of the HTTR annular core configurations is provided in Section of HTTR-GCR-RESR Evaluation of Reactivity Coefficient Data Reactivity coefficient measurements were not made. 2.6 Evaluation of Kinetics Measurements Data Kinetics measurements were not made. 2.7 Evaluation of Reaction-Rate Distributions The benchmark model for the critical configuration analyzed in Section 2.1 and described in Section 3.1 was utilized in the analysis of the reactor physics experiments in Section 1.7. Monte Carlo n-particle (MCNP) version was utilized to predict the biases and uncertainties associated with the experimental results for HTTR critical configurations in this evaluation. MCNP is a general-purpose, continuous-energy, generalized-geometry, time-dependent, coupled n-particle, Monte Carlo transport code. The Evaluated Neutron Data File library, ENDF/B-VII.0, was utilized in analysis of the benchmark model biases and uncertainties. It should be noted that the neutron flux could not be measured directly in the core, but the fission chambers (FCs), containing 235 U, were used to indirectly measure the flux as fission reaction rates. A fixed FC in one of the instrumentation columns was used to normalize the reaction-rate measurements from the FC that was moved to various positions in another column. This was to account for variation in the flux due to movement effects of the detector and its respective components Axial Reaction Rate Distribution The axial fission neutron reaction-rate distribution in Figures 1.5 for the two annular 24-fuel-column cores were digitized and renormalized to allow for further comparative analysis with computational results. The digitization of the charts was performed by Chris White at the Idaho National Laboratory using Marisoft Digitizer. a The chart is imported into the program and bound within a grid system; each individual data point is then marked and exported as numerical data. Table 2.87 and Figures 2.8 and 2.9 represent the digitized data. A comprehensive analysis of the axial neutron reaction-rate distribution in the instrumentation columns of the fully-loaded, 30-fuel-column core has already been performed a M. Mitchell, Marisoft Digitizer Application Version 3.3, Revision: 0 Page 99 of 183
105 (Section of HTTR-GCR-RESR-001). The uncertainty in the reaction-rate measurements of the fully-loaded core were used to generate an estimate of the uncertainties in the 24-fuel-column core measurements by fitting the data to a trend, as shown in Figure The uncertainty in the normalized reaction rates is proportional to the magnitude of the ratio. There is less uncertainty in values near the peak of the neutron flux and significantly more uncertainty for lower fluxes near the edge of the core. A log trend fit is obtained to approximate the uncertainty as a function of normalized reaction rate. The uncertainties in the 24-fuel-column core reaction rates were then estimated using this trend and provided in Table Table Axial Neutron Fission Reaction-Rate Distribution Data for the Annular 24-Fuel-Column Core Configurations. Data Point Configuration 3 (a) Normalized Reaction Rate ± 1σ 1σ (%) Height (cm) (b) Configuration 4 (a) Normalized Reaction Rate ± 1σ 1σ (%) Height (cm) (b) ± ± ± ± ± ± ± ± ± ± ± ± ± ± ± ± ± ± (a) The 24-fuel-column core reaction-rate data are from the top and middle charts, respectively, in Figure 1.6. (b) The height is in reference to the position relative to the bottom of the fifth layer of fuel. Revision: 0 Page 100 of 183
106 1.2 Digitized Axial Neutron Reaction-Rate Distribution Data (Configuration 3) 1 Normalized Neutron Flux Height with Respect to the Bottom of the Fifth Fuel Layer (cm) Figure 2.8. Axial Neutron Reaction-Rate Distribution for the Annular 24-Fuel-Column Core (Configuration 3). 1.2 Digitized Axial Neutron Reaction-Rate Distribution Data (Configuration 4) 1 Normalized Neutron Flux Height with Respect to the Bottom of the Fifth Fuel Layer (cm) Figure 2.9. Axial Neutron Reaction-Rate Distribution for the Annular 24-Fuel-Column Core (Configuration 4). Revision: 0 Page 101 of 183
107 Estimated Uncertainty in Reaction Rate Measurements 14 Uncertainty in Normalized Reaction Rate y = Ln(x) R 2 = Normalized Reaction Rate HTTR Fully-Loaded Core Uncertainty Estimates Log. (HTTR Fully-Loaded Core Uncertainty Estimates) Figure Uncertainty Trend Estimated with HTTR Fully-Loaded-Core Analysis. The axial neutron fission reaction rate in the instrumentation columns were calculated by taking the benchmark model of the 24-fuel-column cores (configurations 3 and 4) in Section 3.1 and superimposing a flux tally over each of the instrumentation column positions: E05, E13, and E21. The flux was computed for 6.15-cm radius discs with a thickness of 1 cm located at the center of one instrumentation channel in each instrumentation column (see Figure 2.11). A total of 522 cm, representing the total height of the core fuel and reflector blocks, was modeled. The (x, y) coordinates used for columns E05, E13, and E21, are ( , 72.4), (5.4, ), and (-120, ), respectively, where the origin is located at the radial center of the core. The F4 flux tally is used in MCNP, which determines the flux across a cell volume by tabulating the average track length of the neutrons. a The tally is then modified by a tally multiplier card, Fm, that accounts for the total fission cross section of 235 U, the fissile material in the fission chambers, to obtain the neutron reaction-rate in each instrumentation column. The calculated neutron fission reaction rates are obtained by taking the variance-weighted average of results obtained using six variations of the input deck (Appendix A.1) with different random number seeds and tallies of the neutron reaction rate (Appendix A.3). This approach was used to reduce the statistical uncertainty in the neutron flux tallies because the relative error values obtained can underpredict the true uncertainty in the calculated neutron flux. b Therefore, the final calculated values are obtained from a total of 18 reaction-rate tallies (6 input decks with 3 instrumentation columns each). a X-5 Monte Carlo Team, MCNP A General Monte Carlo N-Particle Transport Code, Version 5, Volume II: User s Guide, LA-CP (April 24, 2003; revised October 2, 2005). b F. B. Brown, A Review of Best Practices for Monte Carlo Criticality Calculations, Proc. NCSD 2009, Richland, WA, September (2009). Revision: 0 Page 102 of 183
108 The average of the neutron reaction rate in each position is taken and normalized to represent the calculated axial neutron reaction-rate profile. φ ( z) normalized ( z) φ =, φ maximum Instrumentation holes D Total height 5220 mm (522 segments) 1060 Dimensions in mm 09-GA Fig Placement of Axial Flux Tally in the Instrumentation Column. Revision: 0 Page 103 of 183
109 2.8 Evaluation of Power Distribution Data Power distribution measurements were not made. NEA/NSC/DOC(2006)1 2.9 Evaluation of Isotopic Measurements Isotopic measurements were not made Evaluation of Other Miscellaneous Types of Measurements Other miscellaneous types of measurements were not made. Revision: 0 Page 104 of 183
110 3.0 BENCHMARK SPECIFICATIONS NEA/NSC/DOC(2006)1 3.1 Benchmark-Model Specifications for Critical and / or Subcritical Measurements Whereas insufficient information is publicly available, a finely-detailed benchmark model could not be established. A benchmark of the HTTR was prepared and analyzed with as much detail as feasible. The simplification bias for this model could also not be fully determined. However, the uncertainties in the benchmark model are believed to be of sufficient magnitude to encompass any biases incurred due to the simplification process of the benchmark model and a bias for the removal of the core instrumentation has been estimated. It is currently difficult to obtain the necessary information to improve the confidence in the benchmark model; the necessary data is proprietary and its released is being restricted, because the benchmark configuration of the HTTR core is the same that is currently in operation. Once this information is made available, the HTTR benchmark can be adjusted as appropriate. Models for all five configurations of the annular HTTR core are provided. The five configurations, or cases, in this benchmark analysis use four core layouts, with the third core layout implementing two different control rod positionings. Configuration 1 has 19 fuel columns. Configuration 2 has 21 fuel columns. Configurations 3 and 4 have 24 fuel columns. Configuration 5 has 27 fuel columns. Analysis of the fully-loaded, 30-fuel-column, core can be found in HTTR-GCR-RESR Description of the Benchmark Model Simplifications Significant simplifications were incurred to develop a benchmark model of the HTTR because of a lack of information publicly available to determine dimensions and compositions. Simplifications will be discussed where applicable in the descriptions of the dimension and material properties of the model. As stated previously, biases of the model were not assessed but will be addressed as additional HTTR information becomes available. Biases that have been partially investigated are listed in Section The fuel handling positions, dowels, and sockets were not included in the model due to insufficient data specifications, but were accounted for with a void fraction of 0.5 % reduction in graphite density (based upon volume calculations using dimensions provided in Figure 1.52 of HTTR-GCR-RESR-001). The burnable poison insertion holes were placed on the same pitch as the fuel channels to simplify the model. It is apparent from a comparison of Figures 1.65 and 1.67 of HTTR-GCR-RESR-001 that the depth to which the control rod, reserve shutdown system, and instrumentation holes are drilled varies. A depth of 1060 mm above the bottom of the core was selected for all positions to simplify the model. No bias was assessed. Insufficient information was available to model the bottom-most reflector block according to actual design; therefore it was modeled with the same design as the two top reflector blocks and the other bottom reflector block. The top and bottom of each coolant channel is expected to taper from the 21-mm diameter to the 41-mm diameter of the fuel assemblies, but information was unavailable to describe the taper in the model. Therefore channels in the reflector blocks were modeled with 21-mm diameters. Individual sections of the dodecagon-block-shaped permanent reflector were not modeled due to insufficient information. It was modeled as a cylindrical region surrounding the core columns. A bias could not be assessed. Insufficient information was available to model the shielding blocks surrounding the core and shielding plugs in the core. Therefore, they were not included in the benchmark model. It is assumed that all neutrons reaching the core boundaries are lost and not scattered back by the shielding material. A conservative estimate of room-return effects demonstrated a negligible change in k eff. Revision: 0 Page 105 of 183
111 In the materials section, impurity contents in the materials are based upon natural boron equivalency. In the model, however, only the 10 B component is included, as the effect of the 11 B content would be insignificant. The density is the same (1.80 g/cm 3 ) for both types of burnable poison pellets. The boron content in the pellets is based on the reported weight percents instead of the atomic percents. Partially-withdrawn control rod positions represent the average height of the values reported in Table 1.1, which are reported in Table 1.2 except for configuration 4. The average height for the partiallywithdrawn rods in configuration 4 is taken to be 1592 mm. Fully-withdrawn rod positions are 4050 mm for all rods except those in the R2 positions; their maximum withdrawal height is 3325 mm. Too much information was available to specify parameters for the TRISO particle fuel. Because the fuel mass of an individual rod would most probably be the most accurate measured parameter, it was preserved in the benchmark model with some variation to other parameters as necessary. The TRISO kernel diameter is maintained at the nominal value of 600 μm and the density of the fuel is g/cm 3, which is within approximately 95% of the theoretical density of UO 2. The number of TRISO particles in a given compact was reduced from 13,000 to 12,987, with a packing fraction of 30 %, in order to conserve a nominal fuel mass per rod of g Assessed Biases Although some biases have been partially investigated, there is incomplete information regarding the HTTR to properly address simplification biases in order to adjust the benchmark k eff. As stated previously, a conservative estimate of potential room-return effects provided negligible results. As shown in Section in Table 2.52, the effect of neglecting the free uranium content of the fuel compacts was negligible. Finally, the effect of modeling the helium coolant as void material was also negligible (as shown in Section , Table 2.77). The reported literature bias for air content in the graphite could not be verified (Section ). Previous efforts of the Japanese in analyzing the 19-fuel-column core (Case 1) obtained an analytical excess reactivity of 2.7 % k/k, with an estimated Monte Carlo calculation overestimate of 1.2 % k/k. a Additional information would be necessary to completely verify published results An approximate bias for the removal of reactor instrumentation from the three instrumentation columns in the core was calculated, as discussed in Section Calculated biases with uncertainties are shown in Table 3.1. a Fujimoto, N., Nakano, M., Takeuchi, M., Fujisaki, S., and Yamashita, K., Start-Up Core Physics Tests of High Temperature Engineering Test Reactor (HTTR), (II): First Criticality by an Annular Form Fuel Loading and Its Criticality Prediction Method, J. Atomic Energy Society Japan, 42(5), (2000). Revision: 0 Page 106 of 183


")
112 Table 3.1. Estimated Bias for the Removal of Instrumentation Components. Case Δk ± σ Δk ± ± ± ± ± Dimensions Prismatic Pin-in-Block Fuel TRISO Particles The basic ingredient for HTTR fuel is the TRISO particle. A UO 2 kernel is surrounded by four coatings: a low density porous pyrolytic carbon (PyC) buffer layer, a high density inner isotropic PyC layer, a SiC layer, and a final outer PyC layer. A resinated graphite overcoat is then deposited around each TRISO particle. Figure 3.1 depicts the TRISO layers and their respective dimensions. Figure 3.1. TRISO-Coated Fuel Particle. Revision: 0 Page 107 of 183

113 Compacts All fourteen fuel compacts in a single fuel pin are modeled as a single unit filled with the TRISO lattice. The stacked compacts have an inner diameter of 1 cm, an outer diameter of 2.6 cm, and an overall height of 54.6 cm. A horizontal cross section of the compacts is shown in Figure 3.2. In the benchmark model, 12,987 TRISO particles are randomly distributed throughout the compact matrix in a single compact. For a stack of 14 compacts, as modeled in this benchmark, the total number of TRISO particles is 181,818. A key parameter is that the total fuel mass of a single fuel rod (14 stacked compacts) is approximately g. While the benchmark model retains randomness in distribution, many computer codes cannot properly model such configurations. It is up to the user to determine which method is most appropriate while accounting for its impact on the reactivity of the model. Example means for analyzing this model are provided in Section 4.1. The difference in methods for accurately modeling random TRISO particles in a full-core reactor has been discussed in Section Randomly Distributed Fuel Particles in Graphite Matrix Helium Coolant Figure 3.2. Fuel Compact Filled with Randomly Distributed TRISO Particles (Particles Not Shown). Revision: 0 Page 108 of 183
. Figure 3.3. Benchmark HTTR Fuel Element. Revision: 0 Page 109 of 183")
114 Fuel Element A description of the HTTR fuel element is modeled (Figure 3.3). Figure 3.3. Benchmark HTTR Fuel Element. Revision: 0 Page 109 of 183
115 Burnable Poisons The burnable poison pellets and graphite disks were modeled as individual stacks contained within a pin position in the fuel blocks (Figure 3.4). Each fuel block contained two BP pins and one empty pin position. Figure 3.4. Burnable Poison Pin (Left) and Empty Pin Position (Right) Fuel Blocks The HTTR contains two types of regular hexagonal fuel blocks: 33-pin (Zones 1 and 2) and 31-pin (Zones 3 and 4). Diagrams of each fuel block design implemented in the benchmark model are shown in Figures 3.5 and 3.6, respectively. The pitch for all positions is 51.5 mm. Revision: 0 Page 110 of 183


.")
116 Figure 3.5. Fuel Block for 33-Pin Fuel Assembly. Dxx represents the diameter in xx (mm). Revision: 0 Page 111 of 183


.")
117 Figure 3.6. Fuel Block for 31-Pin Fuel Assembly. Dxx represents the diameter in xx (mm). Revision: 0 Page 112 of 183


118 Dummy Blocks The HTTR contains regular hexagonal dummy blocks. A diagram of the dummy block design implemented in the benchmark model is shown in Figure 3.7. Figure 3.7. Dummy Block. Dxx represents the diameter in xx (mm). Revision: 0 Page 113 of 183

119 Control Rod System Control Rods A diagram of a control rod section is shown in Figure 3.8. The absorber compacts are modeled as a single unit. Detailed dimensions regarding the cladding infrastructure for each section was unavailable, and the clad is therefore modeled without detail. A single control rod is comprised of ten sections (Figure 3.9) with a total height of 3.1 m. The control rods are divided up into four sets: center position (C), ring 1 (R1), ring 2 (R2), and ring 3 (R3). The center position contains two control rods. The other rings are comprised of six, six, and three positions, containing a total of twelve, twelve, and six control rods, respectively. Control rods in each set are synchronously moved. Figure 3.8. Control Rod Section. Revision: 0 Page 114 of 183

120 Figure 3.9. Control Rod Comprised of Ten Sections. Revision: 0 Page 115 of 183

 is shown in Figure 3.10.")

121 Control Rod Columns Individual control rod blocks were not modeled. A single control rod column was modeled with three holes to accommodate two control rods and an empty position (for the reserved shutdown system). A diagram of a generic control column (without control rods) is shown in Figure The holes in the control rod and instrumentation columns are equidistant from each other, with an angle of 120º. Figure Control Rod Column. Dxx represents the diameter in xx (mm). Revision: 0 Page 116 of 183


")
122 Instrumentation Instrumentation Components Instrumentation was not included in the benchmark model of the HTTR. An approximate bias with uncertainty was determined applied to the benchmark model (see Sections and ). Instrumentation Columns Instrumentation columns are modeled as a single unit without blocks, similar to the control rod columns. However, all three positions are empty (Figure 3.11). Figure Instrumentation Column. Dxx represents the diameter in xx (mm). Revision: 0 Page 117 of 183


")
123 Replaceable Reflector Columns NEA/NSC/DOC(2006)1 The replaceable reflector columns are modeled as a solid unit and not as individual blocks, similar to the control rod and instrumentation columns but without any channels (Figure 3.12). Figure Replaceable Reflector Column. Revision: 0 Page 118 of 183

124 Replaceable Reflectors Blocks in Fuel Columns The replaceable reflector blocks, located at the top and the bottom fuel columns, are shown in Figures 3.13 and 3.14, for the 33-pin and 31-pin fuel assemblies, respectively. The replaceable reflector blocks have the same regular hexagonal shape and pitch as described for the fuel blocks. Figure Replaceable Reflector Block for 33-Pin Fuel Assembly. Dxx represents the diameter in xx (mm). Revision: 0 Page 119 of 183


.")
125 Figure Replaceable Reflector Block for 31-Pin Fuel Assembly. Dxx represents the diameter in xx (mm). Revision: 0 Page 120 of 183

, and two bottom replaceable reflector blocks (Figure 3.13 for Zones 1 and 2 or Figure 3.14 for Zones 3 and 4).")
 in the TRISO fuel (upper left) and the natural boron content (wt.")
126 Fuel Columns The fuel columns are separated into four zones (as shown in Figure 1.46 of HTTR-GCR-RESR-001). Each zone has a specified pattern of uranium enrichment. Each column contains two top replaceable reflector blocks (Figure 3.13 for Zones 1 and 2 or Figure 3.14 for Zones 3 and 4), five fuel blocks (Figure 3.5 for Zones 1 and 2 and Figure 3.6 for Zones 3 and 4), and two bottom replaceable reflector blocks (Figure 3.13 for Zones 1 and 2 or Figure 3.14 for Zones 3 and 4). The second and third fuel blocks from the top contain burnable poison pellets that are more enriched than the pellets in the other three positions. Figure 3.15 shows the enrichment of the uranium (wt.%) in the TRISO fuel (upper left) and the natural boron content (wt.%) in the burnable pellets (lower right). Figure HTTR Fuel Zones. Revision: 0 Page 121 of 183
, five dummy blocks (Figure 3.")
127 Dummy Fuel Columns NEA/NSC/DOC(2006)1 The dummy fuel columns are similar to the fuel columns shown in Figure 3.15 except that the fueled blocks are replaced with dummy fuel blocks. Each column therefore contains two top replaceable reflector blocks (Figures 3.13 or 3.14 if replacing Zones 1 and 2 or Zones 3 and 4, respectively), five dummy blocks (Figure 3.7), and two bottom replaceable reflector blocks (Figures 3.13 or 3.14). A dummy fuel column is shown in Figure Figure HTTR Dummy Fuel Zone. Revision: 0 Page 122 of 183
128 Reactor Core Configuration NEA/NSC/DOC(2006)1 Figures 3.17 through 3.20 are included to provide an understanding of the final configuration of the reactor. All of the annular core configurations have the same configuration and orientation as the fullyloaded core, but with dummy fuel columns in place of some of the fuel columns, as shown in Figures 3.21 through The HTTR fully-loaded, 30-fuel-column, core configuration (HTTR-GCR-RESR-001) is shown in Figures 3.17, 3.18, The first figure identifies the positions in the core for a given column type. The second figure provides the orientation of each column within its respective position in the core. The third figure shows the column identification number for each position in the core. Figure 3.20 shows a basic cross section of the HTTR fully-loaded core generated in MCNP. The five configurations in this benchmark analysis use four core layouts, with the third core layout implementing two different control rod positions. Configuration 1 (Figure 3.21) has 19 fuel columns and 11 dummy fuel columns. Configuration 2 (Figure 3.22) has 21 fuel columns and 9 dummy fuel columns. Configurations 3 and 4 (Figure 3.23) have 24 fuel columns and 6 dummy fuel columns. Configuration 5 (Figure 3.24) has 27 fuel columns and 3 dummy fuel columns. The permanent reflector surrounding the core has been circularized with a radius of 2125 mm and height of 5220 mm. Revision: 0 Page 123 of 183


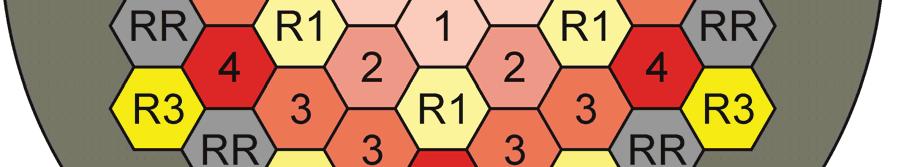

129 Figure HTTR Core Positions (Fully-Loaded, 30-Fuel-Column Core No Dummy Fuel Columns). Revision: 0 Page 124 of 183
130 Figure Fuel and Control Rod Column Orientations. Revision: 0 Page 125 of 183


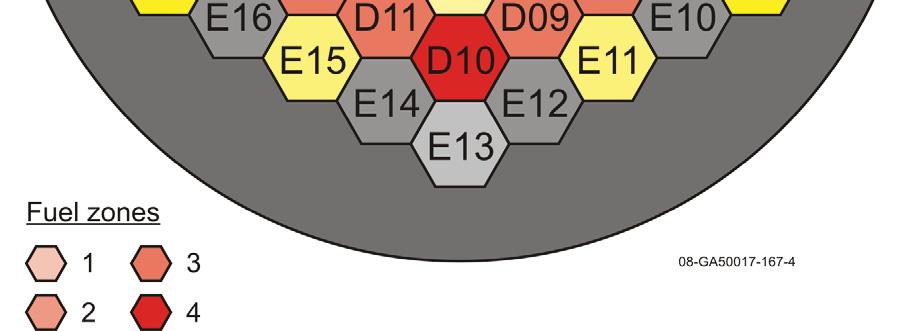
131 Figure HTTR Column Identification. Revision: 0 Page 126 of 183
132 Figure Cross Section of the HTTR Fully-Loaded, 30-Fuel-Column Core. 09-GA Revision: 0 Page 127 of 183

133 Figure HTTR Core Positions (Configuration 1, 19-Fuel-Columns). Revision: 0 Page 128 of 183
134 Figure HTTR Core Positions (Configuration 2, 21-Fuel-Columns). Revision: 0 Page 129 of 183

.")
135 Figure HTTR Core Positions (Configurations 3 and 4, 24-Fuel-Columns). Revision: 0 Page 130 of 183
136 Figure HTTR Core Positions (Configuration 5, 27-Fuel-Columns). Revision: 0 Page 131 of 183
.")
137 Critical Rod Positions The critical rod positions for configurations 1 through 5 are shown in Figures 3.25 through 3.29, respectively. Control rod positions are described with the zero position defined as level with the bottom place of the lowest fuel block (i.e mm from the bottom of the core graphite, the lowest fuel block). These figures provide reference between the various column types in the core and the control rod positions; the dummy fuel column and fuel column are interchangeable in these figures, with no change in the dimensions. Figure Axial Profile of Columns and Control Rod Positions (Configuration 1). Revision: 0 Page 132 of 183

138 Figure Axial Profile of Columns and Control Rod Positions (Configuration 2). Revision: 0 Page 133 of 183

139 Figure Axial Profile of Columns and Control Rod Positions (Configuration 3). Revision: 0 Page 134 of 183
Study on SiC Components to Improve the Neutron Economy in HTGR
 Study on SiC Components to Improve the Neutron Economy in HTGR Piyatida TRINURUK and Assoc.Prof.Dr. Toru OBARA Department of Nuclear Engineering Research Laboratory for Nuclear Reactors Tokyo Institute
Neutronic Issues and Ways to Resolve Them. P.A. Fomichenko National Research Center Kurchatov Institute Yu.P. Sukharev JSC Afrikantov OKBM,
 GT-MHR Project High-Temperature Reactor Neutronic Issues and Ways to Resolve Them P.A. Fomichenko National Research Center Kurchatov Institute Yu.P. Sukharev JSC Afrikantov OKBM, GT-MHR PROJECT MISSION
USA HTR NEUTRONIC CHARACTERIZATION OF THE SAFARI-1 MATERIAL TESTING REACTOR
 Proceedings of HTR2008 4 th International Topical Meeting on High Temperature Reactors September 28-October 1, 2008, Washington, D.C, USA HTR2008-58155 NEUTRONIC CHARACTERIZATION OF THE SAFARI-1 MATERIAL
The Lead-Based VENUS-F Facility: Status of the FREYA Project
 EPJ Web of Conferences 106, 06004 (2016) DOI: 10.1051/epjconf/201610606004 C Owned by the authors, published by EDP Sciences, 2016 The Lead-Based VENUS-F Facility: Status of the FREYA Project Anatoly Kochetkov
Validation of the MCNP computational model for neutron flux distribution with the neutron activation analysis measurement
 Journal of Physics: Conference Series PAPER OPEN ACCESS Validation of the MCNP computational model for neutron flux distribution with the neutron activation analysis measurement To cite this article: K
Effect of Fuel Particles Size Variations on Multiplication Factor in Pebble-Bed Nuclear Reactor
 International Conference Nuclear Energy for New Europe 2005 Bled, Slovenia, September 5-8, 2005 Effect of Fuel Particles Size Variations on Multiplication Factor in Pebble-Bed Nuclear Reactor Luka Snoj,
JOYO MK-III Performance Test at Low Power and Its Analysis
 PHYSOR 200 -The Physics of Fuel Cycles and Advanced Nuclear Systems: Global Developments Chicago, Illinois, April 25-29, 200, on CD-ROM, American Nuclear Society, Lagrange Park, IL. (200) JOYO MK-III Performance
DEVELOPMENT AND VALIDATION OF SCALE NUCLEAR ANALYSIS METHODS FOR HIGH TEMPERATURE GAS-COOLED REACTORS
 DEVELOPMENT AND VALIDATION OF SCALE NUCLEAR ANALYSIS METHODS FOR HIGH TEMPERATURE GAS-COOLED REACTORS Jess Gehin, Matthew Jessee, Mark Williams, Deokjung Lee, Sedat Goluoglu, Germina Ilas, Dan Ilas, Steve
Benchmark Experiment for Fast Neutron Spectrum Potassium Worth Validation in Space Power Reactor Design
 Benchmark Experiment for Fast Neutron Spectrum Potassium Worth Validation in Space Power Reactor Design John D. Bess Idaho National Laboratory NETS 2015 Albuquerque, NM February 23-26, 2015 This paper
Fuel Element Burnup Determination in HEU - LEU Mixed TRIGA Research Reactor Core
 Fuel Element Burnup Determination in HEU - LEU Mixed TRIGA Research Reactor Core Tomaž Žagar, Matjaž Ravnik Institute "Jožef Stefan", Jamova 39, Ljubljana, Slovenia Tomaz.Zagar@ijs.si Abstract This paper
Neutronic Calculations of Ghana Research Reactor-1 LEU Core
 Neutronic Calculations of Ghana Research Reactor-1 LEU Core Manowogbor VC*, Odoi HC and Abrefah RG Department of Nuclear Engineering, School of Nuclear Allied Sciences, University of Ghana Commentary Received
Simulating the Behaviour of the Fast Reactor JOYO
 IYNC 2008 Interlaken, Switzerland, 20 26 September 2008 Paper No. 163 Simulating the Behaviour of the Fast Reactor JOYO ABSTRACT Pauli Juutilainen VTT Technical Research Centre of Finland, P.O. Box 1000,
MONTE CALRLO MODELLING OF VOID COEFFICIENT OF REACTIVITY EXPERIMENT
 MONTE CALRLO MODELLING OF VOID COEFFICIENT OF REACTIVITY EXPERIMENT R. KHAN, M. VILLA, H. BÖCK Vienna University of Technology Atominstitute Stadionallee 2, A-1020, Vienna, Austria ABSTRACT The Atominstitute
CALCULATION OF TEMPERATURE REACTIVITY COEFFICIENTS IN KRITZ-2 CRITICAL EXPERIMENTS USING WIMS ABSTRACT
 CALCULATION OF TEMPERATURE REACTIVITY COEFFICIENTS IN KRITZ-2 CRITICAL EXPERIMENTS USING WIMS D J Powney AEA Technology, Nuclear Science, Winfrith Technology Centre, Dorchester, Dorset DT2 8DH United Kingdom
Hybrid Low-Power Research Reactor with Separable Core Concept
 Hybrid Low-Power Research Reactor with Separable Core Concept S.T. Hong *, I.C.Lim, S.Y.Oh, S.B.Yum, D.H.Kim Korea Atomic Energy Research Institute (KAERI) 111, Daedeok-daero 989 beon-gil, Yuseong-gu,
DOPPLER COEFFICIENT OF REACTIVITY BENCHMARK CALCULATIONS FOR DIFFERENT ENRICHMENTS OF UO 2
 Supercomputing in Nuclear Applications (M&C + SNA 2007) Monterey, California, April 15-19, 2007, on CD-ROM, American Nuclear Society, LaGrange Park, IL (2007) DOPPLER COEFFICIENT OF REACTIVITY BENCHMARK
VERIFICATION OFENDF/B-VII.0, ENDF/B-VII.1 AND JENDL-4.0 NUCLEAR DATA LIBRARIES FOR CRITICALITY CALCULATIONS USING NEA/NSC BENCHMARKS
 VERIFICATION OFENDF/B-VII.0, ENDF/B-VII.1 AND JENDL-4.0 NUCLEAR DATA LIBRARIES FOR CRITICALITY CALCULATIONS USING NEA/NSC BENCHMARKS Amine Bouhaddane 1, Gabriel Farkas 1, Ján Haščík 1, Vladimír Slugeň
United States Nuclear Regulatory Commission US-NRC, USA
 TRISO-coated particle fuel phenomenon identification and ranking tables (PIRTS) for fission product transport due to manufacturing, operations and accidents S.D. Rubin United States Nuclear Regulatory
Benchmark Calculation of KRITZ-2 by DRAGON/PARCS. M. Choi, H. Choi, R. Hon
 Benchmark Calculation of KRITZ-2 by DRAGON/PARCS M. Choi, H. Choi, R. Hon General Atomics: 3550 General Atomics Court, San Diego, CA 92121, USA, Hangbok.Choi@ga.com Abstract - Benchmark calculations have
SUB-CHAPTER D.1. SUMMARY DESCRIPTION
 PAGE : 1 / 12 CHAPTER D. REACTOR AND CORE SUB-CHAPTER D.1. SUMMARY DESCRIPTION Chapter D describes the nuclear, hydraulic and thermal characteristics of the reactor, the proposals made at the present stage
Research Article Analysis of NEA-NSC PWR Uncontrolled Control Rod Withdrawal at Zero Power Benchmark Cases with NODAL3 Code
 Hindawi Science and Technology of Nuclear Installations Volume 2017, Article ID 5151890, 8 pages https://doi.org/10.1155/2017/5151890 Research Article Analysis of NEA-NSC PWR Uncontrolled Control Rod Withdrawal
Analysis of the TRIGA Reactor Benchmarks with TRIPOLI 4.4
 BSTRCT nalysis of the TRIG Reactor Benchmarks with TRIPOLI 4.4 Romain Henry Jožef Stefan Institute Jamova 39 SI-1000 Ljubljana, Slovenia romain.henry@ijs.si Luka Snoj, ndrej Trkov luka.snoj@ijs.si, andrej.trkov@ijs.si
Cold Critical Pre-Experiment Simulations of KRUSTy
 Cold Critical Pre-Experiment Simulations of KRUSTy Kristin Smith * Rene Sanchez, Ph.D. * University of Florida, Nuclear Engineering Program Los Alamos National Lab, Advanced Nuclear Technology LA-UR-17-27250
The Effect of Burnup on Reactivity for VVER-1000 with MOXGD and UGD Fuel Assemblies Using MCNPX Code
 Journal of Nuclear and Particle Physics 2016, 6(3): 61-71 DOI: 10.5923/j.jnpp.20160603.03 The Effect of Burnup on Reactivity for VVER-1000 with MOXGD and UGD Fuel Assemblies Using MCNPX Code Heba K. Louis
Invited. ENDF/B-VII data testing with ICSBEP benchmarks. 1 Introduction. 2 Discussion
 International Conference on Nuclear Data for Science and Technology 2007 DOI: 10.1051/ndata:07285 Invited ENDF/B-VII data testing with ICSBEP benchmarks A.C. Kahler and R.E. MacFarlane Los Alamos National
HTR Spherical Super Lattice Model For Equilibrium Fuel Cycle Analysis. Gray S. Chang. September 12-15, 2005
 INEEL/CON-05-02655, Revision 3 PREPRINT HTR Spherical Super Lattice Model For Equilibrium Fuel Cycle Analysis Gray S. Chang September 12-15, 2005 Mathematics And Computation, Supercomputing, Reactor Physics
Analysis of High Enriched Uranyl Nitrate Solution Containing Cadmium
 INL/CON-05-01002 PREPRINT Analysis of High Enriched Uranyl Nitrate Solution Containing Cadmium PHYSOR-2006 Topical Meeting Soon Sam Kim September 2006 This is a preprint of a paper intended for publication
CONTROL ROD WORTH EVALUATION OF TRIGA MARK II REACTOR
 International Conference Nuclear Energy in Central Europe 2001 Hoteli Bernardin, Portorož, Slovenia, September 10-13, 2001 www: http://www.drustvo-js.si/port2001/ e-mail: PORT2001@ijs.si tel.:+ 386 1 588
Reactor-physical calculations using an MCAM based MCNP model of the Training Reactor of Budapest University of Technology and Economics
 Nukleon 016. december IX. évf. (016) 00 Reactor-physical calculations using an MCAM based MCNP model of the Training Reactor of Budapest University of Technology and Economics Tran Thuy Duong 1, Nguyễn
OECD/NEA Transient Benchmark Analysis with PARCS - THERMIX
 OECD/NEA Transient Benchmark Analysis with PARCS - THERMIX Volkan Seker Thomas J. Downar OECD/NEA PBMR Workshop Paris, France June 16, 2005 Introduction Motivation of the benchmark Code-to-code comparisons.
Challenges in Prismatic HTR Reactor Physics
 Challenges in Prismatic HTR Reactor Physics Javier Ortensi R&D Scientist - Idaho National Laboratory www.inl.gov Advanced Reactor Concepts Workshop, PHYSOR 2012 April 15, 2012 Outline HTR reactor physics
A Dummy Core for V&V and Education & Training Purposes at TechnicAtome: In and Ex-Core Calculations
 A Dummy Core for V&V and Education & Training Purposes at TechnicAtome: In and Ex-Core Calculations S. Nicolas, A. Noguès, L. Manifacier, L. Chabert TechnicAtome, CS 50497, 13593 Aix-en-Provence Cedex
Computational and Experimental Benchmarking for Transient Fuel Testing: Neutronics Tasks
 Computational and Experimental Benchmarking for Transient Fuel Testing: Neutronics Tasks T. Downar W. Martin University of Michigan C. Lee Argonne National Laboratory November 19, 2015 Objective of Neutronics
Sensitivity and Uncertainty Analysis Methodologies for Fast Reactor Physics and Design at JAEA
 Sensitivity and Uncertainty Analysis Methodologies for Fast Reactor Physics and Design at JAEA Kick off meeting of NEA Expert Group on Uncertainty Analysis for Criticality Safety Assessment IRSN, France
Estimation of Control Rods Worth for WWR-S Research Reactor Using WIMS-D4 and CITATION Codes
 Estimation of Control Rods Worth for WWR-S Research Reactor Using WIMS-D4 and CITATION Codes M. S. El-Nagdy 1, M. S. El-Koliel 2, D. H. Daher 1,2 )1( Department of Physics, Faculty of Science, Halwan University,
Comparison of the Monte Carlo Adjoint-Weighted and Differential Operator Perturbation Methods
 Progress in NUCLEAR SCIENCE and TECHNOLOGY, Vol., pp.836-841 (011) ARTICLE Comparison of the Monte Carlo Adjoint-Weighted and Differential Operator Perturbation Methods Brian C. KIEDROWSKI * and Forrest
Modeling and Simulation of Dispersion Particle Fuels in Monte Carlo Neutron Transport Calculation
 18 th IGORR Conference 2017 Modeling and Simulation of Dispersion Particle Fuels in Monte Carlo Neutron Transport Calculation Zhenping Chen School of Nuclear Science and Technology Email: chzping@yeah.net
RANDOMLY DISPERSED PARTICLE FUEL MODEL IN THE PSG MONTE CARLO NEUTRON TRANSPORT CODE
 Supercomputing in Nuclear Applications (M&C + SNA 2007) Monterey, California, April 15-19, 2007, on CD-ROM, American Nuclear Society, LaGrange Park, IL (2007) RANDOMLY DISPERSED PARTICLE FUEL MODEL IN
«CALCULATION OF ISOTOPE BURN-UP AND CHANGE IN EFFICIENCY OF ABSORBING ELEMENTS OF WWER-1000 CONTROL AND PROTECTION SYSTEM DURING BURN-UP».
 «CALCULATION OF ISOTOPE BURN-UP AND CHANGE IN EFFICIENCY OF ABSORBING ELEMENTS OF WWER-1000 CONTROL AND PROTECTION SYSTEM DURING BURN-UP». O.A. Timofeeva, K.U. Kurakin FSUE EDO «GIDROPRESS», Podolsk, Russia
Analytical Validation of Uncertainty in Reactor Physics Parameters for Nuclear Transmutation Systems
 Journal of Nuclear Science and Technology ISSN: 22-3131 (Print) 1881-1248 (Online) Journal homepage: http://www.tandfonline.com/loi/tnst2 Analytical Validation of Uncertainty in Reactor Physics Parameters
SENSITIVITY ANALYSIS OF ALLEGRO MOX CORE. Bratislava, Iľkovičova 3, Bratislava, Slovakia
 SENSITIVITY ANALYSIS OF ALLEGRO MOX CORE Jakub Lüley 1, Ján Haščík 1, Vladimír Slugeň 1, Vladimír Nečas 1 1 Institute of Nuclear and Physical Engineering, Slovak University of Technology in Bratislava,
ACTIVATION ANALYSIS OF DECOMISSIONING OPERATIONS FOR RESEARCH REACTORS
 ACTIVATION ANALYSIS OF DECOMISSIONING OPERATIONS FOR RESEARCH REACTORS Hernán G. Meier, Martín Brizuela, Alexis R. A. Maître and Felipe Albornoz INVAP S.E. Comandante Luis Piedra Buena 4950, 8400 San Carlos
Investigation of Nuclear Data Accuracy for the Accelerator- Driven System with Minor Actinide Fuel
 Investigation of Nuclear Data Accuracy for the Accelerator- Driven System with Minor Actinide Fuel Kenji Nishihara, Takanori Sugawara, Hiroki Iwamoto JAEA, Japan Francisco Alvarez Velarde CIEMAT, Spain
ANALYSIS OF THE PEBBLE-BED VHTR SPECTRUM SHIFTING CAPABILITIES FOR ADVANCED FUEL CYCLES
 ANALYSIS OF THE PEBBLE-BED VHTR SPECTRUM SHIFTING CAPABILITIES FOR ADVANCED FUEL CYCLES A Senior Scholars Thesis by MEGAN LEIGH PRITCHARD Submitted to the Office of Undergraduate Research of Texas A&M
Target accuracy of MA nuclear data and progress in validation by post irradiation experiments with the fast reactor JOYO
 Target accuracy of MA nuclear data and progress in validation by post irradiation experiments with the fast reactor JOYO Shigeo OHKI, Kenji YOKOYAMA, Kazuyuki NUMATA *, and Tomoyuki JIN * Oarai Engineering
PRELIMINARY CONCEPT OF A ZERO POWER NUCLEAR REACTOR CORE
 2011 International Nuclear Atlantic Conference - INAC 2011 Belo Horizonte,MG, Brazil, October 24-28, 2011 ASSOCIAÇÃO BRASILEIRA DE ENERGIA NUCLEAR - ABEN ISBN: 978-85-99141-04-5 PRELIMINARY CONCEPT OF
CONFIGURATION ADJUSTMENT POTENTIAL OF THE VERY HIGH TEMPERATURE REACTOR PRISMATIC CORES WITH ADVANCED ACTINIDE FUELS. A Thesis DAVID E.
 CONFIGURATION ADJUSTMENT POTENTIAL OF THE VERY HIGH TEMPERATURE REACTOR PRISMATIC CORES WITH ADVANCED ACTINIDE FUELS A Thesis by DAVID E. AMES II Submitted to the Office of Graduate Studies of Texas A&M
1. INTRODUCTION 2. EAEA EXISTING CAPABILITIES AND FACILITIES
 EGYPT FINAL REPORT FOR THE CRP ON DEVELOPING TECHNIQUES FOR SMALL- SCALE, INDIGENOUS PRODUCTION OF MO-99 USING LOW- ENRICHED URANIUM (LEU) OR NEUTRON ACTIVATION 1. INTRODUCTION The Egypt country report
YALINA-Booster Conversion Project
 1 ADS/ET-06 YALINA-Booster Conversion Project Y. Gohar 1, I. Bolshinsky 2, G. Aliberti 1, F. Kondev 1, D. Smith 1, A. Talamo 1, Z. Zhong 1, H. Kiyavitskaya 3,V. Bournos 3, Y. Fokov 3, C. Routkovskaya 3,
Sensitivity Analysis of Gas-cooled Fast Reactor
 Sensitivity Analysis of Gas-cooled Fast Reactor Jakub Lüley, Štefan Čerba, Branislav Vrban, Ján Haščík Institute of Nuclear and Physical Engineering, Slovak University of Technology in Bratislava Ilkovičova
M.Cagnazzo Atominstitut, Vienna University of Technology Stadionallee 2, 1020 Wien, Austria
 Measurements of the In-Core Neutron Flux Distribution and Energy Spectrum at the Triga Mark II Reactor of the Vienna University of Technology/Atominstitut ABSTRACT M.Cagnazzo Atominstitut, Vienna University
Chem 481 Lecture Material 4/22/09
 Chem 481 Lecture Material 4/22/09 Nuclear Reactors Poisons The neutron population in an operating reactor is controlled by the use of poisons in the form of control rods. A poison is any substance that
COMPARATIVE ANALYSIS OF WWER-440 REACTOR CORE WITH PARCS/HELIOS AND PARCS/SERPENT CODES
 COMPARATIVE ANALYSIS OF WWER-440 REACTOR CORE WITH PARCS/HELIOS AND PARCS/SERPENT CODES S. Bznuni, A. Amirjanyan, N. Baghdasaryan Nuclear and Radiation Safety Center Yerevan, Armenia Email: s.bznuni@nrsc.am
Data analysis with uncertainty evaluation for the Ignalina NPP RBMK 1500 gas-gap closure evaluation
 Data analysis with uncertainty evaluation for the Ignalina NPP RBMK 1500 gas-gap closure evaluation M. Liaukonisl &J. Augutis2 Department ofmathematics and Statistics, Vytautas Magnus University, Lithuania.
ON THE EVALUATION OF PEBBLE BEAD REACTOR CRITICAL EXPERIMENTS USING THE PEBBED CODE
 ON THE EVALUATION OF PEBBLE BEAD REACTOR CRITICAL EXPERIMENTS USING THE PEBBED CODE Hans D. Gougar, R. Sonat Sen Idaho National Laboratory 2525 N. Fremont Avenue, Idaho Falls, ID 83415-3885 phone: +1-208-5261314,
Lesson 14: Reactivity Variations and Control
 Lesson 14: Reactivity Variations and Control Reactivity Variations External, Internal Short-term Variations Reactivity Feedbacks Reactivity Coefficients and Safety Medium-term Variations Xe 135 Poisoning
The Effect of 99 Mo Production on the Neutronic Safety Parameters of Research Reactors
 The Effect of 99 Mo Production on the Neutronic Safety Parameters of Research Reactors Riham M. Refeat and Heba K. Louis Safety Engineering Department, Nuclear and Radiological Regulation Authority (NRRA),
Fundamentals of Nuclear Reactor Physics
 Fundamentals of Nuclear Reactor Physics E. E. Lewis Professor of Mechanical Engineering McCormick School of Engineering and Applied Science Northwestern University AMSTERDAM BOSTON HEIDELBERG LONDON NEW
Institute of Atomic Energy POLATOM OTWOCK-SWIERK POLAND. Irradiations of HEU targets in MARIA RR for Mo-99 production. G.
 Instytut Energii Atomowej Institute of Atomic Energy OTWOCK-SWIERK POLAND Irradiations of HEU targets in MARIA RR for Mo-99 production G. Krzysztoszek IAEA TM on Commercial Products and Services of Research
Lectures on Applied Reactor Technology and Nuclear Power Safety. Lecture No 5. Title: Reactor Kinetics and Reactor Operation
 Lectures on Nuclear Power Safety Lecture No 5 Title: Reactor Kinetics and Reactor Operation Department of Energy Technology KTH Spring 2005 Slide No 1 Outline of the Lecture (1) Reactor Kinetics Reactor
Error Estimation for ADS Nuclear Properties by using Nuclear Data Covariances
 Error Estimation for ADS Nuclear Properties by using Nuclear Data Covariances Kasufumi TSUJIMOTO Center for Proton Accelerator Facilities, Japan Atomic Energy Research Institute Tokai-mura, Naka-gun, Ibaraki-ken
Kr-85m activity as burnup measurement indicator in a pebble bed reactor based on ORIGEN2.1 Computer Simulation
 Journal of Physics: Conference Series PAPER OPEN ACCESS Kr-85m activity as burnup measurement indicator in a pebble bed reactor based on ORIGEN2.1 Computer Simulation To cite this article: I Husnayani
CRITICAL LOADING CONFIGURATIONS OF THE IPEN/MB-01 REACTOR WITH UO 2 GD 2 O 3 BURNABLE POISON RODS
 CRITICAL LOADING CONFIGURATIONS OF THE IPEN/MB-01 REACTOR WITH UO 2 GD 2 O 3 BURNABLE POISON RODS Alfredo Abe 1, Rinaldo Fuga 1, Adimir dos Santos 2, Graciete S. de Andrade e Silva 2, Leda C. C. B. Fanaro
ANALYSIS OF THE OECD MSLB BENCHMARK WITH THE COUPLED NEUTRONIC AND THERMAL-HYDRAULICS CODE RELAP5/PARCS
 ANALYSIS OF THE OECD MSLB BENCHMARK WITH THE COUPLED NEUTRONIC AND THERMAL-HYDRAULICS CODE RELAP5/PARCS T. Kozlowski, R. M. Miller, T. Downar School of Nuclear Engineering Purdue University United States
Lectures on Applied Reactor Technology and Nuclear Power Safety. Lecture No 4. Title: Control Rods and Sub-critical Systems
 Lectures on Nuclear Power Safety Lecture No 4 Title: Control Rods and Sub-critical Systems Department of Energy Technology KTH Spring 2005 Slide No 1 Outline of the Lecture Control Rods Selection of Control
Status of J-PARC Transmutation Experimental Facility
 Status of J-PARC Transmutation Experimental Facility 10 th OECD/NEA Information Exchange Meeting for Actinide and Fission Product Partitioning and Transmutation 2008.10.9 Japan Atomic Energy Agency Toshinobu
DETAILED CORE DESIGN AND FLOW COOLANT CONDITIONS FOR NEUTRON FLUX MAXIMIZATION IN RESEARCH REACTORS
 Proceedings of ICONE14 14th International Conference on Nuclear Engineering June 17-21, 2006, Miami, FL, USA ICONE14-89547 DETAILED CORE DESIGN AND FLOW COOLANT CONDITIONS FOR NEUTRON FLUX MAXIMIZATION
How to Design a Critical Experiment aka CED-1 and CED-2
 How to Design a Critical Experiment aka CED-1 and CED-2 R. D. McKnight Nuclear Engineering Division Argonne National Laboratory DOE NCSP Technical Seminar FY2011 NCSP Technical Accomplishments March 13-14,
DESIGN OF B 4 C BURNABLE PARTICLES MIXED IN LEU FUEL FOR HTRS
 DESIGN OF B 4 C BURNABLE PARTICLES MIXED IN LEU FUEL FOR HTRS V. Berthou, J.L. Kloosterman, H. Van Dam, T.H.J.J. Van der Hagen. Delft University of Technology Interfaculty Reactor Institute Mekelweg 5,
Critical Experiment Analyses by CHAPLET-3D Code in Two- and Three-Dimensional Core Models
 Journal of NUCLEAR SCIENCE and TECHNOLOGY, Vol. 42, No. 1, p. 101 108 (January 2005) TECHNICAL REPORT Critical Experiment Analyses by CHAPLET-3D Code in Two- and Three-Dimensional Core Models Shinya KOSAKA
Available online at ScienceDirect. Energy Procedia 71 (2015 )
") Available online at www.sciencedirect.com ScienceDirect Energy Procedia 71 (2015 ) 97 105 The Fourth International Symposium on Innovative Nuclear Energy Systems, INES-4 High-Safety Fast Reactor Core Concepts
Available online at www.sciencedirect.com ScienceDirect Energy Procedia 71 (2015 ) 97 105 The Fourth International Symposium on Innovative Nuclear Energy Systems, INES-4 High-Safety Fast Reactor Core Concepts
Considerations for Measurements in Support of Thermal Scattering Data Evaluations. Ayman I. Hawari
 OECD/NEA Meeting: WPEC SG42 Thermal Scattering Kernel S(a,b): Measurement, Evaluation and Application May 13 14, 2017 Paris, France Considerations for Measurements in Support of Thermal Scattering Data
Benchmark Critical Experiment of a Thorium Reflected Plutonium Sphere
 LA-UR-94-3275 Benchmark Critical Experiment of a Thorium Reflected Plutonium Sphere Los Alamos National Laboratory is operated by the University of California for the United States Department of Energy
DETERMINATION OF THE EQUILIBRIUM COMPOSITION OF CORES WITH CONTINUOUS FUEL FEED AND REMOVAL USING MOCUP
 Supercomputing in Nuclear Applications (M&C + SNA 2007) Monterey, California, April 15-19, 2007, on CD-ROM, American Nuclear Society, LaGrange Park, IL (2007) DETERMINATION OF THE EQUILIBRIUM COMPOSITION
REACTOR PHYSICS ASPECTS OF PLUTONIUM RECYCLING IN PWRs
 REACTOR PHYSICS ASPECTS OF PLUTONIUM RECYCLING IN s Present address: J.L. Kloosterman Interfaculty Reactor Institute Delft University of Technology Mekelweg 15, NL-2629 JB Delft, the Netherlands Fax: ++31
REFLECTOR FEEDBACK COEFFICIENT: NEUTRONIC CONSIDERATIONS IN MTR-TYPE RESEARCH REACTORS ABSTRACT
 REFLECTOR FEEDBACK COEFFICIENT: NEUTRONIC CONSIDERATIONS IN MTR-TYPE RESEARCH REACTORS L. MANIFACIER, L. CHABERT, M. BOYARD TechnicAtome, CS 50497, 13593 Aix-en-Provence Cedex 3, France ABSTRACT Having
Reactivity Effect of Fission and Absorption
 Journal of NUCLEAR SCIENCE and TECHNOLOGY, 1, No. 7, p.246~254 (October, 1964). J. Nucl. Sci. Tech. Space Dependent Reactivity Effect of Fission and Absorption Tohru HAGA* and Iwao KOBAYASHI* Received
Validation of the Neutron and Gamma Flux Distributions in the JSI TRIGA Reactor Core
 Validation of the Neutron and Gamma Flux Distributions in the JSI TRIGA Reactor Core Gašper Žerovnik Reactor Physics Department, Jožef Stefan Institute Jamova cesta 19 SI-1000, Ljubljana, Slovenia gasper.zerovnik@ijs.si
VERIFICATION OF MONTE CARLO CALCULATIONS OF THE NEUTRON FLUX IN THE CAROUSEL CHANNELS OF THE TRIGA MARK II REACTOR, LJUBLJANA
 International Conference Nuclear Energy for New Europe 2002 Kranjska Gora, Slovenia, September 9-12, 2002 www.drustvo-js.si/gora2002 VERIFATION OF MONTE CARLO CALCULATIONS OF THE NEUTRON FLUX IN THE CAROUSEL
Calculation of Spatial Weighting Functions for Ex-Core Detectors of VVER-440 Reactors by Monte Carlo Method
 International Conference Nuclear Energy for New Europe 2003 Portorož, Slovenia, September 8-11, 2003 http://www.drustvo-js.si/port2003 Calculation of Spatial Weighting Functions for Ex-Core Detectors of
Implementation of the CLUTCH method in the MORET code. Alexis Jinaphanh
 Implementation of the CLUTCH method in the MORET code Alexis Jinaphanh Institut de Radioprotection et de sûreté nucléaire (IRSN), PSN-EXP/SNC/LNC BP 17, 92262 Fontenay-aux-Roses, France alexis.jinaphanh@irsn.fr
MONTE CARLO SIMULATION OF VHTR PARTICLE FUEL WITH CHORD LENGTH SAMPLING
 Joint International Topical Meeting on Mathematics & Computation and Supercomputing in Nuclear Applications (M&C + SNA 2007) Monterey, California, April 5-9, 2007, on CD-ROM, American Nuclear Society,
arxiv: v2 [physics.ins-det] 22 Nov 2017
![arxiv: v2 [physics.ins-det] 22 Nov 2017](/thumbs/78/76779592.jpg "arxiv: v2 [physics.ins-det] 22 Nov 2017") A new model with for the first criticality benchmarks of the TRIGA Mark II reactor arxiv:177.5194v2 [physics.ins-det] 22 Nov 217 Christian Castagna a,c, Davide Chiesa b,c,, Antonio Cammi a,c, Sara Boarin
A new model with for the first criticality benchmarks of the TRIGA Mark II reactor arxiv:177.5194v2 [physics.ins-det] 22 Nov 217 Christian Castagna a,c, Davide Chiesa b,c,, Antonio Cammi a,c, Sara Boarin
Solving Bateman Equation for Xenon Transient Analysis Using Numerical Methods
 Solving Bateman Equation for Xenon Transient Analysis Using Numerical Methods Zechuan Ding Illume Research, 405 Xintianshiji Business Center, 5 Shixia Road, Shenzhen, China Abstract. After a nuclear reactor
CRITICAL AND SUBCRITICAL EXPERIMENTS USING THE TRAINING NUCLEAR REACTOR OF THE BUDAPEST UNIVERSITY OF TECHNOLOGY AND ECONOMICS
 CRITICAL AND SUBCRITICAL EXPERIMENTS USING THE TRAINING NUCLEAR REACTOR OF THE BUDAPEST UNIVERSITY OF TECHNOLOGY AND ECONOMICS É. M. Zsolnay Department of Nuclear Techniques, Budapest University of Technology
NEUTRON PHYSICAL ANALYSIS OF SIX ENERGETIC FAST REACTORS
 NEUTRON PHYSICAL ANALYSIS OF SIX ENERGETIC FAST REACTORS Peter Vertes Hungarian Academy of Sciences, Centre for Energy Research ABSTRACT Numerous fast reactor constructions have been appeared world-wide
The 2018 Edition of the ICSBEP Handbook
 The 2018 Edition of the ICSBEP Handbook John D. Bess Margaret A. Marshall Idaho National Laboratory Tatiana Ivanova Ian Hill OECD NEA ANS 2018 Annual Meeting Philadelphia, PA 17-21 June 2018 This presentation
Profile SFR-64 BFS-2. RUSSIA
 Profile SFR-64 BFS-2 RUSSIA GENERAL INFORMATION NAME OF THE A full-scale physical model of a high-power BN-type reactor the «BFS-2» critical facility. FACILITY SHORT NAME BFS-2. SIMULATED Na, Pb, Pb-Bi,
Study of Control rod worth in the TMSR
 Nuclear Science and Techniques 24 (2013) 010601 Study of Control rod worth in the TMSR ZHOU Xuemei * LIU Guimin 1 Shanghai Institute of Applied Physics, Chinese Academy of Sciences, Shanghai 201800, China
PRISMATIC MODULAR REACTOR ANALYSIS WITH MELCOR. A Thesis NI ZHEN
 PRISMATIC MODULAR REACTOR ANALYSIS WITH MELCOR A Thesis by NI ZHEN Submitted to the Office of Graduate Studies of Texas A&M University in partial fulfillment of the requirements for the degree of MASTER
Sensitivity and Uncertainty Analysis of the k eff and b eff for the ICSBEP and IRPhE Benchmarks
 Sensitivity and Uncertainty Analysis of the k eff and b eff for the ICSBEP and IRPhE Benchmarks ANDES Workpackage N : 3, Deliverable D3.3 Ivo Kodeli Jožef Stefan Institute, Slovenia ivan.kodeli@ijs.si
Adaptation of Pb-Bi Cooled, Metal Fuel Subcritical Reactor for Use with a Tokamak Fusion Neutron Source
 Adaptation of Pb-Bi Cooled, Metal Fuel Subcritical Reactor for Use with a Tokamak Fusion Neutron Source E. Hoffman, W. Stacey, G. Kessler, D. Ulevich, J. Mandrekas, A. Mauer, C. Kirby, D. Stopp, J. Noble
Task 3 Desired Stakeholder Outcomes
 Task 3 Desired Stakeholder Outcomes Colby Jensen IRP Kickoff Meeting, Nov 19-20, 2015 Instrumentation Overview Three general levels of core instrumentation: Reactor control and operation Additional reactor
Heterogeneous Description of Fuel Assemblies for Correct Estimation of Control Rods Efficiency in BR-1200
 XIII International Youth Scientific and Practical Conference FUTURE OF ATOMIC ENERGY - AtomFuture 2017 Volume 2017 Conference Paper Heterogeneous Description of Fuel Assemblies for Correct Estimation of
Development of Advanced Dynamic Calculation Code for Accelerator Driven System
 Development of Advanced Dynamic Calculation Code for Accelerator Driven System M. Suzuki 1, T. Iwasaki 1, N. Aizawa 1, T. Sato 1, T. Sugawara 2 1 Tohoku University, Japan 2 Japan Atomic Energy Agency,
THREE-DIMENSIONAL INTEGRAL NEUTRON TRANSPORT CELL CALCULATIONS FOR THE DETERMINATION OF MEAN CELL CROSS SECTIONS
 THREE-DIMENSIONAL INTEGRAL NEUTRON TRANSPORT CELL CALCULATIONS FOR THE DETERMINATION OF MEAN CELL CROSS SECTIONS Carsten Beckert 1. Introduction To calculate the neutron transport in a reactor, it is often
MOx Benchmark Calculations by Deterministic and Monte Carlo Codes
 MOx Benchmark Calculations by Deterministic and Monte Carlo Codes G.Kotev, M. Pecchia C. Parisi, F. D Auria San Piero a Grado Nuclear Research Group (GRNSPG), University of Pisa via Diotisalvi 2, 56122
J. T. Mihalczo. P. 0. Box 2008
 nstrumentation and Controls Division MONTE CARLO VERFCATON OF PONT KENETCS FOR SAFETY ANALYSS OF NUCLEAR REACTORS T. E. Valentine J. T. Mihalczo Oak Ridge National Laboratory* P. 0. Box 2008 Oak Ridge,
Figure 1. Layout of fuel assemblies, taken from BEAVRS full core benchmark, to demonstrate the modeling capabilities of OpenMC.
 Treatment of Neutron Resonance Elastic Scattering Using Multipole Representation of Cross Sections in Monte Carlo Simulations Vivian Y. Tran Benoit Forget Abstract Predictive modeling and simulation plays
CHORD LENGTH SAMPLING METHOD FOR ANALYZING VHTR UNIT CELLS IN CONTINUOUS ENERGY SIMULATIONS
 PHYSOR 2012 Advances in Reactor Physics Linking Research, Industry, and Education Knoxville, Tennessee, USA, April 15-20, 2012, on CD-ROM, American Nuclear Society, LaGrange Park, IL (2012) CHORD LENGTH